
Michael S. Lauer and Eiran Z. Gorodeski
An ability to read the medical literature intelligently is an essential skill for the competent clinical practitioner. Acquiring this skill is challenging because of the high volume of medical articles published and the increasing sophistication of modern epidemiologic and statistical methods.
Topics that will be covered in this chapter include:
1. Exposures and outcomes
2. Types of clinical studies
3. Types of statistical errors
4. Data presentation: reporting of outcomes
5. Confounding and interaction
6. Multivariable regression and pitfalls
7. Bias and its consequences
8. External validity: assessments of causation and validity
9. Issues related to:
a. Randomized treatment/prevention trials
b. Studies of diagnostic tests
c. Prognostic (survival) studies
d. Case–control studies
e. Economics
f. Clinical prediction guides
g. Systematic review articles and meta-analyses
CURRENT CONCEPTS AND ESSENTIAL FACTS
Exposures and Outcomes
At the heart of virtually all clinical studies is an attempt to link an “exposure” with an “outcome.” When reading an article, you should ask yourself what exactly the exposure and outcome variables are and whether their association is of interest to you.
For exposure, the “independent” variable, examples include:
1. A treatment strategy (or lack thereof)
2. A patient characteristic (such as age, gender, or cholesterol level)
3. A diagnostic test result (such as ejection fraction)
For outcome, the “dependent” variable, examples include:
1. A treatment outcome (such as death, myocardial infarction, need for revascularization)
2. A clinical event during follow-up (such as death or myocardial infarction)
3. A “gold standard” finding (such as evidence of coronary disease on an angiogram)
Types of Clinical Studies
Various types of clinical studies are reported in the literature, including the following.
Case Reports
Case reports, although they may be fun to read, rarely provide the kind of high-level evidence needed to influence clinical practice.
Case Series
Case series report on a group of patients who show a certain finding. Although there may be a clear-cut exposure and an outcome variable, the absence of a comparison group limits any conclusions that can be drawn. Case reports and case series are best thought of as hypothesis-generating studies.
Cohort Study
The cohort study is a fundamentally strong study design in which:
1. An inception cohort is clearly defined.
2. An exposure variable is defined.
3. The cohort consists of individuals with and without the exposure variable present at the time of inception.
4. The cohort is followed over time for the occurrence of a clearly and objectively defined outcome.
5. The occurrence of the outcome is compared in individuals with and without the exposure variable.
Case–Control Study
A case–control study (Fig. 7.1) is a somewhat weaker study design than a cohort study. In a case–control study:
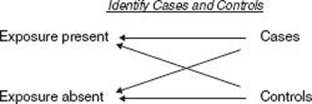
FIGURE 7.1 Case–control study diagram.
1. A “case” group of subjects with a given outcome is identified.
2. A “control” group of subjects, without the outcome, is identified.
3. The occurrence of an exposure variable is compared between the case group and the control group.
Studies of Diagnostic Tests
In studies designed to assess the value of a diagnostic test, a group of patients suspected of having a certain disease (outcome) undergo the diagnostic test, and then the results of the diagnostic test are compared against an accepted standard.
Cost-Effectiveness Studies
Cost-effectiveness studies usually take the form of a cohort study in which (a) the cost of an intervention is measured, (b) the outcomes of performing or not performing an intervention are compared, or (c) the cost of preventing an outcome is measured; typically, this last is recorded as dollars per year of life saved or dollars per quality-adjusted year of life saved (QALY).
Randomized Controlled Trials
Randomized controlled trials (Fig. 7.2) are the gold standard for assessing a treatment or a prevention measure. In these studies:
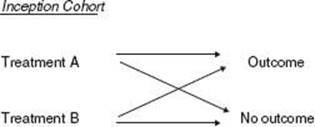
FIGURE 7.2 Randomized trial diagram.
1. A cohort of patients at risk for an outcome is defined.
2. Determination of which patients receive treatment or prevention is made entirely at random.
3. An outcome is measured after a predetermined follow-up period.
In effect, a randomized controlled trial is a kind of cohort study, except that the exposure variable is determined by the investigator, not by nature, using a randomization technique.
Prospective-versus-Retrospective Studies
In prospective-versus-retrospective studies, prospective data are obtained and coded at the time they are first available and, in the case of cohort studies, prior to the outcome. Retrospective data are obtained at a later time, often after the outcome has occurred.
Prospective studies are much less likely to be subject to observation bias or problems with missing data.
Meta-Analysis
Meta-analyses are systematic reviews of specific clinical questions with data pooled from multiple previously completed/published studies. Steps in a meta-analysis include:
1. Clinical hypothesis is defined.
2. Literature is searched.
3. Studies are selected based on prespecified criteria.
4. Consistent summary measures are collected from each identified study.
5. Pooled analysis is performed.
Most meta-analyses only pool randomized clinical trials, but meta-analyses can include cohort studies alone or mixed with clinical trials. Meta-analyses may suffer from publication bias as negative studies have traditionally been more difficult to publish.
Genome-Wide Association Studies
Genome-wide association studies (GWAS) are a contemporary form of case–control studies that focus on genetic data. DNA from people with (cases) and without (controls) a disease is collected and placed on gene chips. These chips are read into computers that identify DNA variations between the two groups . DNA variations that are more frequently detected are “associated” with the disease and hint at chromosomal regions that may be responsible for the disease.
Statistical Tests
Statistics is the science by which observations made of a sample are assessed with respect to their likely validity in the entire universe.
Type I and Type II Errors
Commonly reported statistics include two types of statistical error analysis. In type I errors, an association between an exposure and an outcome is in fact a spurious one that has resulted from random chance. The “p value” refers to the likelihood that an observed association is due to chance alone. In type II errors, on the other hand, the lack of an observed association between an exposure and an outcome is in fact due to chance because the sample size was not large enough to detect an association if one in fact exists. This is one of the most common errors reported in clinical literature.
Hypothesis Testing
Statistical tests also aim to determine whether a “null hypothesis” should be rejected, where the null hypothesis is that no association exists between the exposure and the outcome. Today many clinical researchers are moving away from this sort of hypothesis testing and more toward estimation of effects along with confidence intervals, discussed below.
Comparisons of Continuous Variables
Continuous variables are variables that can have an infinite number of values, such as age, height, blood pressure, or cholesterol level. They are described using means, standard deviations, ranges, quartiles, quintiles, deciles, and so on.
When continuous variables are normally distributed (i.e., described by a Gaussian or bell-shaped curve), t tests are generally used to compare the means of two groups and ANOVA is used to compare means of three or more groups.
When the continuous variables cannot be assumed to be normally distributed, nonparametric testing, such as the Wilcoxon rank-sum, which compares median values and distributions of two groups, or the Kruskal-Wallis test, which compares medians and distributions of three or more groups, is often used.
To compare the strength of a presumed linear association between two continuous variables (e.g., left ventricle mass versus blood pressure), researchers often use tests of correlation (r value), such as Pearson or Spearman tests. In these tests, the square of the r value describes how much the variability of one variable can be attributed to the other.
Comparisons of Categorical Variables
Variables that can only have a finite set of values (e.g., gender, presence or absence hypertension, use of a certain medication) are called categorical variables. For most samples, these kinds of variables are compared using the chi-square test. However, if the sample size is very small, researchers may instead use the Fischer exact test.
Data Presentation and Reporting of Outcomes
The statistical tests discussed above tell only part of the story. The strengths of associations can be described in a number of ways.
Number of Outcomes
Knowing the number of outcomes is essential to determining the strength of a study. In general, studies with <25 outcome occurrences are suspect. Studies with >100 outcomes may be compelling.
Absolute Event Rates
Absolute event rates are generally considered the most honest way to present data. How many outcomes were associated with exposures? How many outcomes occurred among those not exposed? Be suspicious if raw data are not provided. A careful reading of the raw data will enables a reader to distinguish between “statistical significance” and “clinical significance.” It is the latter that we really care about.
Relative Risk or Risk Ratio
Relative risk or risk ratio (RR) is the proportion of event rates according to exposure, or

where OE is the number of patients with exposure who had the outcome. NE is the number of patients with exposure, O0 is the number of patients without exposure who had the outcome and N0 is the number of patients without exposure.
A risk ratio of 1.0 implies no association; a value >1 implies an increased risk, and a value <1 implies a protective effect.
Relative Risk Reduction
Relative risk reduction (RRR) is defined as the proportional reduction in rates, or
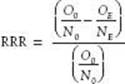
Absolute Risk Reduction
Absolute risk reduction (ARR) is the difference between absolute event rates, a more honest way of presenting data, or
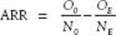
Number Needed to Treat
Number needed to treat (NNT) is the number of patients who would need to be exposed in order to prevent one outcome, or

Confidence Interval
The confidence interval (CI) is a measure of uncertainty; given a 95% confidence interval, we can be 95% sure that the true measure lies somewhere within the interval.
Odds Ratio
Odds are another way of describing the frequency of an event. For any given population in which O outcomes occur among N subjects,
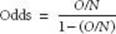
In effect, this is the probability of an event occurring divided by the probability that the event will not occur. The odds ratio compares odds between exposed and unexposed groups.
It is very important that you not confuse odds ratios with risk ratios (or relative risks). Generally, odds ratios and risk ratios are similar only if the outcome event rates are low (i.e., <10%).
Hazard Ratio
The hazard ratio is used specifically in survival studies. The hazard is the instantaneous probability of an event occurring given that a subject has survived for a certain period of time without experiencing that event. The hazard ratio compares the hazards of exposed and unexposed groups.
Attributable Risk
Attributable risk measures the relative contribution of a given exposure to an outcome in a population. Thus, if we assume that the association is causal and we then remove the exposure, the attributable risk tells us by how much the outcome event rate should be reduced. Attributable risk (AR) is calculated as
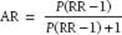
where P is the prevalence of exposure (or NE/[NE+ N0]) and RR is the relative risk as described above.
Kaplan–Meier Event Rates
Kaplan–Absolute risk reduction Meier event rates are a graphical way of showing time free of an event. This method takes into account variable follow-up times (or censoring), an issue that is common in studies of outcomes of chronic diseases.
An example showing how these terms are calculated is now shown. Imagine a clinical trial in which 10,000 patients are randomized in a 1:1 manner to either drug A or drug B (i.e., 5,000 are assigned drug A and 5,000 are assigned drug B). Suppose that 2,500 of the drug A patients experience events, whereas 2,000 of the drug B patients have events. Thus, we have:
 Drug A: 5,000 patients
Drug B: 5,000 patients
Events with drug A: 2,500
Absolute event rate: 2,500/5,000 = 0.50
Events with drug B: 2,000
Absolute event rate: 2,000/5,000 = 0.40
Absolute rates, drug A and drug B: 0.50 and 0.40
Risk ratio for drug B: 0.40/0.50 = 0.80
Absolute risk reduction: 0.50 - 0.40 = 0.10
Relative risk reduction: (0.50 - 0.40)/0.50 = 0.20
NNT: 1/0.10 = 10
Absolute rates, drug A and drug B: 0.50 and 0.40
Odds for drug B: 0.40/(1 - 0.40) = 0.67
Odds for drug A: 0.50/(1 - 0.50) = 1.00
Odds ratio of drug B to drug A: 0.67/1.00 = 0.67
Terms Related to Studies of Diagnostic Tests
Studies of diagnostic tests often rely on 2 × 2 tables that relate diagnostic test findings to the presence or the absence of disease as assessed by a given standard. Figure 7.3 shows an example for which

FIGURE 7.3 A 2 × 2 table.
Sensitivity (Sens) = A/D+ = positive for disease
Specificity (Spec) = D/D- = negative for health
Thus,
A = true positive = Sens(D+) = Sens(prevalence)(N)
B = false positive = (1 − Spec)(D-)
= (1 − Spec)(1 − prevalence)(N)
Here, positive predictive value = true positives/all positives = A/(A + B), which is what we as clinicians really care about.
Substituting the above terms, we get the clinical version of Bayes theorem, namely,
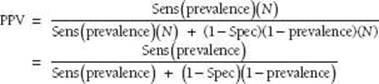
where PPV is the positive predictive value. Implications of Bayes theorem include:
1. PPV depends on sensitivity, specificity, and prevalence; the last is sometimes referred to as the pretest likelihood of disease.
2. PPV is most different from prevalence when the latter has a value near 0.50; that is, a diagnostic test is most useful the more uncertain one is of the diagnosis.
If one varies the cutoff point for a positive test, the specificity and sensitivity will vary in an inverse way. In other words, the better the sensitivity, the worse is the specificity, and vice versa.
A plot of sensitivity versus (1 − specificity) yields the receiver operating characteristic (ROC) curve, where the area under the curve is a measure of the overall ability of the test to distinguish between patients with and without disease (Fig. 7.4).
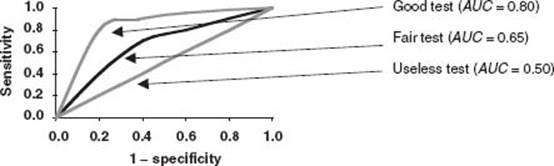
FIGURE 7.4 ROC curve.
The likelihood ratio (LR) enables us to relate pretest odds of disease to posttest odds:
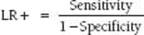
where LR+ is the positive likelihood ratio, and
Oddspost = LR (Oddsple)
where

In general, for a test to be clinically useful, the positive likelihood ratio (LR+) should be at least 10, whereas the negative likelihood ratio (LR-) should be <0.1.
In a similar fashion, the negative predictive value (NPV) is the ratio of true negatives to all negatives:

Analogously, LR− is
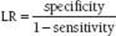
The negative likelihood ratio relates the pretest odds of not having disease to the posttest odds of not having disease.
Confounding and Interaction
Even if an association between an exposure and an outcome is not due to random chance, it may not be a clinically meaningful one if confounding is present. A confounding factor is said to exist if the factor has an association with both the exposure and the outcome but is not a causative link between them. As an example, consider alcohol intake as the exposure, lung cancer as the outcome, and smoking as the confounder. Smoking is a confounding factor with regard to the association between alcohol intake and lung cancer (Fig. 7.5).
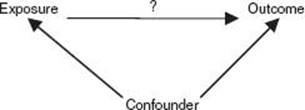
FIGURE 7.5 Confounding-factor diagram.
Researchers have several ways to deal with confounding.
Dealing with Confounding by Altering Study Design
The study design can be adjusted by:
Restriction: Keep patients with confounders out of the study.
Matching: Keep confounding factors balanced between those who are and those who are not exposed; this technique works better for cohort studies than for case–control studies.
Randomization: If done properly and if sample size is large enough, randomization can assure balance of both observed and unobserved confounders.
Dealing with Confounding in the Analyses of the Study
Confounding can be avoided by:
Restriction: Keep patients with confounders out of the analyses.
Stratification: Assess the association between exposure and outcome according to the presence or the absence of possible confounders (discussed in more detail below).
Multivariable methods: Discussed below.
Assessing Confounding by Stratified Analyses
Scenario A:
Whole-population risk ratio (RR) = 3.0.
Stratum with confounder C present, RR = 3.0
Stratum with confounder C absent, RR = 3.0.
No confounding is present.
Scenario B:
Whole-population RR = 3.0.
Stratum with confounder C present, RR = 1.0.
Stratum with confounder C absent, RR = 1.0.
Complete confounding is present.
Scenario C:
Whole-population RR = 3.0.
Stratum with confounder C present, RR = 1.5.
Stratum with confounder C absent, RR = 1.5.
Partial confounding is present.
This is the most common scenario.
Interaction
Interaction (also known as “effect modification”) is an interesting situation in which the strength of an association between an exposure and an outcome is related to another factor. Such a scenario might be:
Whole-population RR = 3.0
Stratum with interaction factor I present, RR = 5.0
Stratum with interaction factor I absent, RR = 2.0
Interaction can also be assessed using multivariable regression analysis by incorporating “interaction” terms into the analyses.
One of the most common errors in clinical research is failure to consider potential interactions.
Uses and Pitfalls of Multivariable Regression
Multivariable regression is used (a) to assess multiple confounders simultaneously, and (b) to estimate the likelihood of an outcome given multiple possible predictors.
Linear Regression
Linear regression is used when the outcome variable is continuous:
Y = α + ß1x1 + ß2x2 + ß3x3 + … + ßixi
where x1is the exposure of interest; x2, x3, ..., xi are potential confounders; and the ß coefficients are parameter estimates of the associations between each covariate x and outcome Y.
Logistic Regression
Logistic regression is used when the outcome variable is binary (yes/no):
LogOdds = α + ß1x1+ ß2x2+ ß3x3+...+ ßixi
Cox Proportional Hazards Regression
Cox proportional hazards regression is used when the outcome is a hazard ratio, which is an assessment of time free of an outcome. Thus, the outcome includes not only whether an event occurs but also the length of observation before an event either does or does not occur. This is expressed as:
Log hazard ratio = h0(ß1x1+ ß2x2+ ß3x3+ + ßixi)
where h0 is the theoretical hazard for subjects with all x = 0.
Common Errors in Using Multivariable Regression
Model overfitting: more than one covariate per 10 outcome events—a very common and serious mistake
Inappropriate linear assumption: when a logarithmic, inverse, or quadratic model would yield a better fit
Violation of the proportional hazards assumption, which maintains that the hazard ratio between exposed and unexposed groups remains constant over time
Failure to account for interactions
Inappropriate variable selection: here knowledge of the biology of the question is really essential.
Collinearity: covariates associated with one another
Failure to look for and account for outliers and/or excessively influential observations
Bias and Its Consequences
Statistical bias is a systematic problem by which exposed and nonexposed subjects are either selected for study inclusion differently and/or have their outcomes assessed differently.
Selection bias occurs when the exposure of interest affects whether a subject is included in a study. A typical example is referral bias, under which patients with particularly severe illnesses are more likely to be studied at a tertiary care center. This can lead to an invalid comparison with an unexposed group (a problem of internal validity) or difficulty generalizing results to the population at large (a problem of external validity).
Observation bias occurs when the exposure of interest has an effect, conscious or not, on how the outcome is measured. A way of avoiding this is “blinding” patients and investigators as to the nature of the exposure variable. Observation bias can result in an invalid comparison between exposed and unexposed patients, which is a problem of internal validity.
Recall bias may be a problem in case–control studies, in which patients with an outcome are more likely to recall an exposure than those without the outcome. A typical example is recall of pregnancy exposures among women who give birth to children with congenital defects.
Verification bias may be a problem in studies of diagnostic tests, in which the result of the diagnostic test directly affects the clinician’s decision to refer a patient for the “gold standard” test. A typical example: patients with an abnormal stress study are more likely to be referred for coronary angiography. Verification bias results in an overestimation of sensitivity and an underestimation of specificity.
A key question to ask is “Are there differences in the way exposed and unexposed subjects are selected or evaluated?” If the answer is yes, then bias is likely to be present.
Causality and Validity
Randomized trials can establish causality, that is, that a particular treatment or prevention strategy specifically causes a certain outcome. Other types of clinical studies can only establish association, not cause.
Criteria have been established by which to judge whether an association is likely to be causal. These criteria include:
1. Strength of association
2. Dose–response relationship
3. Temporal relationship (exposure always precedes outcome)
4. Biologic plausibility
5. Consistency with other studies
Another important area to consider in evaluating research studies is validity. An observed association between an exposure and an outcome in a given population is likely to have internal validity if, after use of appropriate methods, it is not due to chance, confounding, or bias.
External validity refers to both the likelihood of a cause–effect association as noted above and the likelihood that the observed association is relevant to other populations not studied.
Issues Related to Specific Types of Studies (From ACP Journal Club Criteria)
Randomized Trials
Adequate randomization must be achieved. Look for “Table 1” and the type of randomization method used.
Follow-up should include at least 80% of the study population.
Consider the outcome measures chosen. Are they objective and clinically relevant? Are they subject to bias? For cardiology studies, all-cause death is the best outcome.
Studies of Diagnosis
There should be a reasonable spectrum of patients.
The “gold standard” should be interpreted without knowledge of the results of the test of interest (source of observation bias).
Each participant should get both the test being studied and the gold standard test, with performance on the gold standard being independent of the results of the diagnostic test (i.e., no verification bias).
Studies of Prognosis
The inception cohort should consist entirely of people who are free from the outcome.
Follow-up should include at least 80% of the study population.
Consider the outcome measures chosen.
Case–Control Studies
The key to validity is how controls were chosen.
Controls should come from the same person–time pool as cases.
If a control had had the outcome, would he or she have become a case for the study?
Studies of Economics
Comparisons involving real patients are best.
Costs should be measured in terms of resources used, not charges.
Incremental costs of one intervention over another should be included.
Sensitivity analyses should be performed.
Clinical Prediction Rules
Should be validated either in a different data set or by using modern validation techniques, such as bootstrapping
Should consider treatment, diagnosis, prognosis, causation
Systematic Review Articles
The article should identify the search methods used.
Only quality source materials should be chosen.
If the review includes meta-analysis, appropriate techniques to consider variations in study quality, sample sizes, and publication bias should be used.
CURRENT CONTROVERSIES IN RESEARCH
1. The peer review method: Issues include
a. Assessing reviewers
b. Dealing with bias and conflicts of interest
c. Creating uniform standards
2. Investigator concerns
a. Conflicts of interest
b. Drug and device company control over data and publication
c. Ethical issues, particularly regarding safety of human subjects
d. Informed consent and documentation
e. Complex regulations regarding research practice
3. Statistical and analytical methods
a. Getting away from p values
b. Equivalency trials
c. New types of databases (object-oriented, “meta-data,” XML)
d. Controlling for bias and confounding with propensity analysis
e. Nonproportional hazards
f. Validation with bootstrapping and similar techniques
g. Optimal model selection methods; information theory
4. Public policy concerns
a. How to keep up
b. Proliferation of journal summary publications
c. Development of guidelines and their dissemination
d. Timing of publication and meeting presentations
e. The impact of the media
f. Associations between medical societies and editors; maintenance of editorial independence
g. Electronic versus paper information
SUGGESTED READINGS
Elwood M. Critical Appraisal of Epidemiological Studies and Clinical Trials. New York: Oxford University Press; 1998.
Gordis L. Epidemiology. 2nd ed. Philadelphia: WB Sauders; 2000.
Guyatt G, Rennie D, eds. Users’ Guides to the Medical Literature: A Manual for Evidence-Based Clinical Practice. Chicago: American Medical Association; 2002.
Woodward M. Epidemiology: Study Design and Data Analysis. New York: Chapman & Hall/CRC Press; 1999.
QUESTIONS AND ANSWERS
Questions
1. A study finds that in the largely white community of Olmstead County, Minnesota, drug B is effective for controlling blood pressure compared to placebo. As a physician working in a practice caring mainly for African American patients, your concern is that this study may lack:
a. Control for bias
b. Internal validity
c. Consideration of the effects of chance
d. External validity
e. Failure to consider interaction
2. A new diagnostic test for coronary disease is compared against cardiac catheterization among 100 patients who had both studies performed. Coronary disease is present in 50 patients, among whom 45 had a positive test. Among the patients without coronary disease, 25 had a positive test. Which of the following is true?
a. The sensitivity is 90%.
b. The specificity is 50%.
c. The sensitivity is likely to be <90%.
d. The sensitivity is likely to be <50%.
e. The positive likelihood ratio is 2.
3. A study of 10,000 people without a history of myocardial infarction (MI) is done to see what effect a high uric acid level has on risk. An elevated level is present in 2,000, among whom 100 have an MI during 5 years of follow-up. Among the people without an elevated uric acid level, 200 have an MI during the same period. The odds ratio for an MI given an elevated uric level compared to those without an elevated level is:
a. 0.50
b. 2.00
c. 0.25
d. 2.05
e. 5.25
4. In the above study, if we assume that there is a causative link between uric acid and MI, the attributable risk is:
a. 0.13
b. 0.17
c. 0.25
d. 2.00
5. A study of a new electrocardiograph (ECG) technology looks at the ability of the ECG finding to predict sudden death. Among 300 patients studied, 25 had sudden death. The unadjusted relative risk for the ECG finding for prediction of sudden death is 3.0. After adjustment for age, gender, left ventricular ejection fraction, nuclear findings, diabetes, hypertension, and cholesterol level in a multivariable Cox regression analysis, the adjusted relative risk is 2.5. Which of the following is true?
a. The ECG finding is a valid, independent predictor of death.
b. Confounding is present.
c. Model overfitting occurred.
d. The finding is statistically significant but not clinically significant.
e. Bias was not adjusted for.
6. Recently published guidelines suggest that antibiotic prophylaxis prior to dental procedures is not indicated to prevent infective endocarditis in most cardiac patients. An investigator is designing a study to examine this further. Which of the following statements is true?
a. A prospective cohort study design may prove that dental procedures cause infective endocarditis.
b. A cross-sectional study design is appropriate to study the course of infective endocarditis.
c. A meta-analysis of previously published observational studies will help quantify the summary data available about endocarditis prophylaxis.
d. A case–control study is inappropriate when the goal is to study a rare disease.
7. What is a “p-value”?
a. p-value is the probability that the relationship you are observing is pure chance.
b. p-value is the probability that the null hypothesis is true.
c. p-value is the probability of falsely rejecting the null hypothesis.
d. p-value is the probability that replicating the experiment will yield the same result.
8. In the Randomized Aldactone Evaluation Study (N Engl J Med. 1999;341:709–717), the rate of death over a mean period of 24 months was 46% in the placebo arm, and 35% in the spironolactone arm. Approximately how many heart failure patients would need to receive spironolactone to prevent death in one person?
a. 90
b. 9
c. 11
d. Unable to calculate without knowing the incidence and prevalence of disease in the population
9. The RAPID trial (Circulation. 1995;91:2725–2732) was designed to test the hypothesis that bolus administration of one or more dosage regimens of reteplase was superior to standard-dose alteplase in achieving infarct-related artery patency 90 minutes after initiation of treatment. This was an example of a:
a. Phase I study
b. Phase II study
c. Phase III trial
d. Phase IV trial
10. A 65-year-old man is seen in clinic for evaluation of a murmur heard by his primary care physician. He is asymptomatic. On physical exam, he is found to have a systolic murmur. You estimate that he has a 40% chance of having aortic stenosis. You want to investigate this further with an echocardiogram, which is 90% sensitive and 95% specific. If the echocardiogram is positive, how sure can you be of the diagnosis?
a. 90%
b. 90% to 93%
c. 93% to 95%
d. 95%
Answers
1. Answer D: External validity. Just because the finding is true among Caucasians, it may not be true among African Americans.
2. Answer C: The sensitivity is likely to be <90%. This is an example of verification bias, in which sensitivity is overestimated and specificity is underestimated.
3. Answer D: 2.05. Remember, Odds = P/(1 -P). Thus, the odds for patients with an elevated uric acid level are 0.05/(1 -0.05) and the odds for patients without an elevated uric acid level are 0.025/(1 -0.025).
4. Answer B: 0.17. Attributable risk is Prev(RR -1)/[Prev(RR -1) + 1]. The prevalence is 0.2 and the relative risk is 2.0.
5. Answer C: Model overfitting occurred. There were only 25 outcome events, meaning that at most two or three covariates can be considered in a regression model.
6. Answer C: Meta-analyses of clinical trials or observational studies are a contemporary approach to pool and summarize existing studies. Cross-sectional studies may demonstrate the status of a disease in a point in time but cannot be used to study time-dependent processes. Cohort studies are the best study design for investigating the course or cause of a disease, but only clinical trials can be used to prove causation.
7. Answer A: The more formal definition is “the probability of obtaining a test statistic at least as extreme as the one that was actually observed, assuming that the null hypothesis is true.”
8. Answer B: Number needed to treat (NNT) = 1/absolute risk reduction (ARR). ARR=0.46–0.35 = 0.11, NNT = 1/0.11 = 9.
9. Answer B: Phase II studies evaluate whether an intervention has any biologic activity or clinical effect, and may also be used to estimate the rate of adverse events.
10. Answer B: Using clinical version of Bayes theorem, the probability of diagnosis is (0.90)(0.40)/[(0.90)(0.40) + (0.05)(0.60)] = 92.3%.