
Fred M. Kusumoto, MD
Diseases of the cardiovascular system frequently confront the physician involved in the day-to-day care of patients. Knowledge of the underlying pathophysiologic processes associated with diseases of the heart and blood vessels provides a critical framework for patient management. This chapter deals with diseases of the heart with the following chapter focusing on diseases of the blood vessels. Normal cardiac structure and function are summarized here, and pathophysiologic mechanisms for commonly encountered cardiac problems are then discussed, with emphasis on arrhythmias, heart failure, valvular heart disease, coronary artery disease, and pericardial disease.
NORMAL STRUCTURE & FUNCTION OF THE HEART
ANATOMY
The heart is a complex organ whose primary function is to pump blood through the pulmonary and systemic circulations. It is composed of four muscular chambers: the main pumping chambers, the left and right ventricles, and the left and right atria, which act like “priming pumps” responsible for the final 20–30% of ventricular filling (Figure 10-1A). Peripheral venous return from the inferior and superior venae cavae fills the right atrium and ventricle (through the open tricuspid valve) (Figure 10-1B). With atrial contraction, additional blood flows through the tricuspid valve and completes the filling of the right ventricle. Unoxygenated blood is then pumped to the pulmonary artery and lung by the right ventricle through the pulmonary valve (Figure 10-1C). Oxygenated blood returns from the lung to the left atrium via four pulmonary veins (Figure 10-1D). Sequential left atrial and ventricular contraction pumps blood back to the peripheral tissues. The mitral valve separates the left atrium and ventricle, and the aortic valve separates the left ventricle from the aorta (Figures 10-1D and 10-1E).
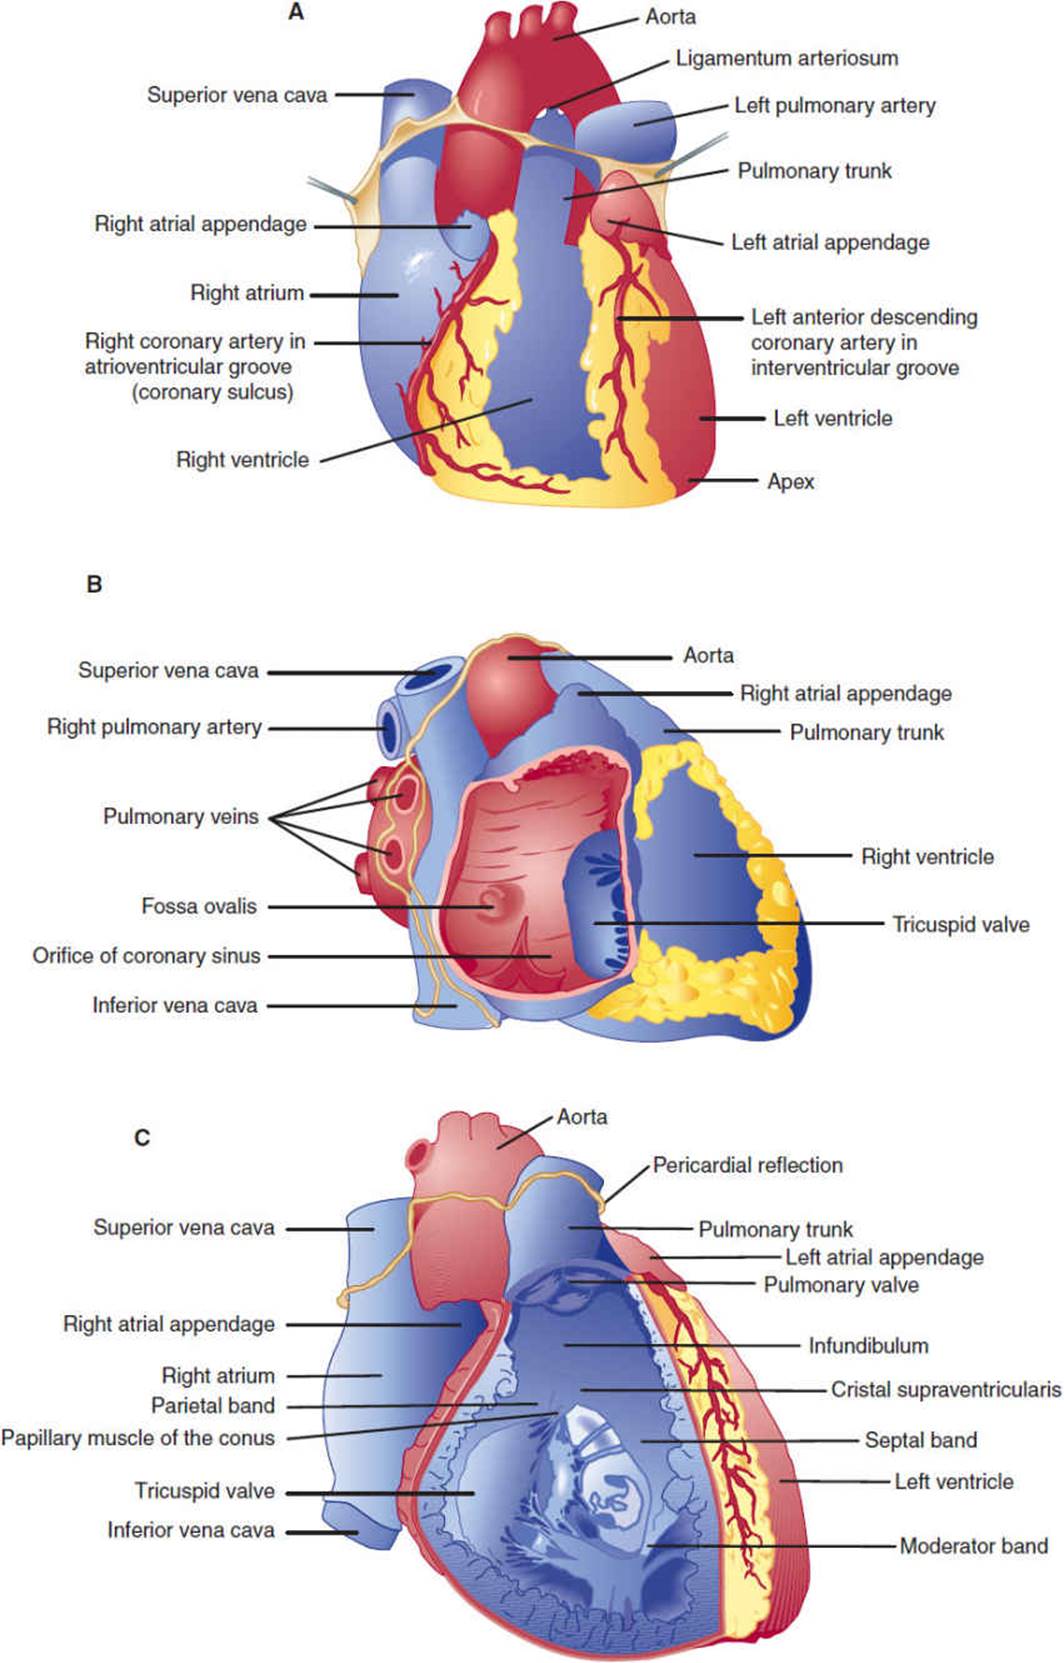

Figure 10-1 Anatomy of the heart. A: Anterior view of the heart. B: View of the right heart with the right atrial wall reflected to show the right atrium. C: Anterior view of the heart with the anterior wall removed to show the right ventricular cavity. (Redrawn, with permission, from Cheitlin MD et al, eds. Clinical Cardiology, 6th ed. Originally published by Appleton & Lange. Copyright © 1993 by The McGraw-Hill Companies, Inc.)
The heart lies free in the pericardial sac, attached to mediastinal structures only at the great vessels. During embryologic development, the heart invaginates into the pericardial sac like a fist pushing into a partially inflated balloon. The pericardial sac is composed of a serous inner layer (visceral pericardium) directly apposed to the myocardium and a fibrous outer layer called the parietal pericardium. Under normal conditions, approximately 40–50 mL of clear fluid, which probably is an ultrafiltrate of plasma, fills the space between the layers of the pericardial sac.
The left main and right coronary arteries arise from the root of the aorta and provide the principal blood supply to the heart (Figure 10-2). The large left main coronary artery usually branches into the left anterior descending artery and the circumflex coronary artery. The left anterior descending coronary artery gives off diagonal and septal branches that supply blood to the anterior wall and septum of the heart, respectively. The circumflex coronary artery continues around the heart in the left atrioventricular groove and gives off large obtuse marginal arteries that supply blood to the left ventricular free wall. The right coronary artery travels in the right atrioventricular groove and supplies blood to the right ventricle via acute marginal branches. The posterior descending artery, which supplies blood to the posterior and inferior walls of the left ventricle, arises from the right coronary artery in 80% of people (right-dominant circulation) and from the circumflex artery in the remainder (left-dominant circulation).

FIGURE 10-2 Coronary arteries and their principal branches in humans. (Redrawn, with permission, from Ross G. The cardiovascular system. In: Ross G, ed. Essentials of Human Physiology. Copyright © 1978 by Year Book Medical Publishers, Inc., Chicago.)
Contraction of the heart chambers is coordinated by several regions in the heart that are composed of myocytes with specialized automaticity (pacemaker) and conduction properties (Figure 10-3). Cells in the sinoatrial (SA) node and the atrioventricular (AV) node have fast pacemaker rates (SA node: 60–100 bpm; AV node: 40–70 bpm), and the His bundle and Purkinje fibers are characterized by rapid rates of conduction. Because it has the fastest intrinsic pacemaker rhythm, the SA node is usually the site of initiation of the cardiac electrical impulse during a normal heartbeat. The impulse then rapidly depolarizes both the left and right atria as it travels to the AV node. Conduction velocity slows from 1 m/s in atrial tissue to 0.05 m/s in nodal tissue. After the delay in the AV node, the impulse moves rapidly down the His bundle (1 m/s) and Purkinje fibers (4 m/s) to simultaneously depolarize the right and left ventricles. The atria and ventricles are separated by a fibrous framework that is electrically inert, so under normal conditions the AV node and the contiguous His bundle form the only electrical connection between the atria and ventricles. This arrangement allows the atria and ventricles to beat in a synchronized fashion and minimizes the chance of electrical feedback between the chambers.

FIGURE 10-3 Conducting system of the heart. Typical transmembrane action potentials for the SA and AV nodes, other parts of the conduction system, and the atrial and ventricular muscles are shown along with the correlation to the extracellularly recorded electrical activity (ie, the electrocardiogram [ECG]). The action potentials and ECG are plotted on the same time axis but with different zero points on the vertical scale. The PR interval is measured from the beginning of the P wave to the beginning of the QRS. (LAF, left anterior fascicle.) (Redrawn, with permission, from Ganong WF. Review of Medical Physiology, 22nd ed. McGraw-Hill, 2005.)
The electrical activity of the heart can be measured from the body surface at standardized positions by electrocardiography. On the electrocardiogram (ECG), the P wave represents depolarization of atrial tissue; the electrocardiographic wave (QRS) interval, ventricular depolarization; and the T wave, ventricular repolarization (Figure 10-3). Because normal ventricular depolarization occurs almost simultaneously in the right and left ventricles—usually within 60–100 ms—the QRS complex is narrow. Although the electrical activity of the small specialized conduction tissues cannot be measured directly from the surface, the interval between the P wave and the start of the QRS complex (PR interval) represents primarily the conduction time of the AV node and His bundle.
HISTOLOGY
Ventricular myocytes are normally 50–100 mm long and 10–25 mm wide. Atrial and nodal myocytes are smaller, whereas myocytes of the Purkinje system are larger in both dimensions. Myocytes are filled with hundreds of parallel striated bundles termed myofibrils. Myofibrils are composed of repeating units, termed sarcomeres, that form the major contractile unit of the myocyte (Figure 10-4). Sarcomeres are complex structures composed of the contractile proteins, myosin, and actin, which are connected by cross-bridges, and a regulatory protein complex, tropomyosin. (See Cellular Physiology section later.)

FIGURE 10-4 A: Electron photomicrograph of cardiac muscle. The fuzzy thick lines are intercalated disks (×12,000). (Reproduced, with permission, from Bloom W et al. A Textbook of Histology, 10th ed. Saunders, 1975.) B:Diagram of cardiac muscle as seen under the light microscope (top) and the electron microscope (bottom). (N, nucleus.) (Redrawn, with permission, from Braunwald E et al. Mechanisms of contraction of the normal and failing heart. N Engl J Med. 1967;277:794.)
PHYSIOLOGY
Physiology of the Whole Heart
Because the ventricles are the primary physiologic pumps of the heart, analysis has focused on these chambers, particularly the left ventricle. Function of intact ventricles is traditionally studied by evaluating pressure-time and pressure-volume relationships.
In pressure-time analysis (Figure 10-5), pressures in the chambers of the heart and the great vessels are measured during the cardiac cycle and plotted as a function of time. At the beginning of the cardiac cycle, the left atrium contracts, forcing additional blood into the left ventricle and giving rise to an a wave on the left atrial pressure tracing. At end diastole, the mitral valve closes, producing the first heart sound (S1), and a brief period of isovolumic contraction follows during which both the aortic and the mitral valve are closed but the left ventricle is actively contracting. When intraventricular pressure rises to the level of aortic pressure, the aortic valve opens and blood flows into the aorta. Beyond this point, the aorta and left ventricle form a contiguous chamber with equal pressures, but left ventricular volume decreases as blood is expelled. Left ventricular contraction stops and ventricular relaxation begins, and end systole is reached when intraventricular pressure falls below aortic pressure. The aortic valve then closes, producing the second heart sound (S2). Throughout systole, blood has slowly accumulated in the left atrium (because the mitral valve is closed), giving rise to the v wave on the left atrial pressure tracing. During the first phase of diastole—isovolumic relaxation—no change in ventricular volume occurs, but continued relaxation of the ventricle leads to an exponential fall in left ventricular pressure. Left ventricular filling begins when left ventricular pressure falls below left atrial pressure and the mitral valve opens. Ventricular relaxation is a relatively long process that begins before the aortic valve closes and extends past mitral valve opening. The rate and extent of ventricular relaxation depend on multiple factors: heart rate, wall thickness, chamber volume and shape, aortic pressure, sympathetic tone, and presence or absence of myocardial ischemia. Once the mitral valve opens, there is an initial period of rapid filling of the ventricle that contributes 70–80% of blood volume to the ventricle and occurs largely because of the atrioventricular pressure gradient. By mid-diastole, flow into the left ventricle has slowed, and the cardiac cycle begins again with the next atrial contraction. Right ventricular pressure-time analysis is similar but with lower pressures because the impedance to flow in the pulmonary vascular system is much lower than in the systemic circulation.

FIGURE 10-5 Diagram of events in the cardiac cycle. From top downward: pressure (in millimeters of mercury) in aorta, left ventricle, left atrium, pulmonary artery, right ventricle, right atrium; blood flow (mL/s) in ascending aorta and pulmonary artery; ECG. Abscissa, time in seconds. (Valvular opening and closing are indicated by AO and AC, respectively, for the aortic valve; MO and MC for the mitral valve; PO and PC for the pulmonary valve; TO and TC for the tricuspid valve.) Events of the cardiac cycle at a heart rate of 75 bpm. The phases of the cardiac cycle identified by the numbers at the bottom are as follows: 1, atrial systole; 2, isovolumetric ventricular contraction; 3, ventricular ejection; 4, isovolumetric ventricular relaxation; 5, ventricular filling. Note that late in systole aortic pressure actually exceeds left ventricular pressure. However, the momentum of the blood keeps it flowing out of the ventricle for a short period. The pressure relationships in the right ventricle and pulmonary artery are similar. (Redrawn, with permission, from Milnor WR. The circulation. In: Mountcastle VB, ed. Medical Physiology, 2 vols. Mosby, 1980.)
In pressure-volume analysis (Figure 10-6), pressure during the cardiac cycle is plotted as a function of volume rather than time. During diastole, as ventricular volume increases during both the initial rapid filling period and atrial contraction, ventricular pressure increases (curve da). The shape and position of this curve, the diastolic pressure-volume relationship, are dependent on relaxation properties of the ventricle, the elastic recoil of the ventricle, and the distensibility of the ventricle. The curve shifts to the left (higher pressure for a given volume) if relaxation of the ventricle is decreased, the ventricle loses elastic recoil, or the ventricle becomes stiffer. At the beginning of systole, active ventricular contraction begins and volume remains unchanged (isovolumic contraction period) (ab). When left ventricular pressure reaches aortic pressure, the aortic valve opens, and ventricular volume decreases as the ventricle expels its blood (curve bc). At end systole (c), the aortic valve closes and isovolumic relaxation begins (cd). When the mitral valve opens, the ventricle begins filling for the next cardiac cycle, repeating the entire process. The area encompassed by this loop represents the amount of work done by the ventricle during a cardiac cycle. The position of point c is dependent on the isovolumic systolic pressure-volume curve. If the ventricle is filled with variable amounts of blood (preloads) and allowed to contract but the aortic valve is prevented from opening, a relatively linear relationship exists, termed the isovolumic systolic pressure-volume curve (Figure 10-6B). The slope and position of this line describe the inherent contractile state of the ventricle. If contractility is increased by catecholamines or other positive inotropes, the line will shift to the left.

FIGURE 10-6 A: Pressure-volume loop for the left ventricle. During diastole the left ventricle fills and pressure increases along the diastolic pressure-volume curve from d to a. Line ab represents isometric contraction, and bc the ejection phase of systole. The aortic valve closes at point c, and pressure drops along cd (isovolumic relaxation), until the mitral valve opens at point d and the cycle repeats. The distance from b to c represents the stroke volume ejected by that beat. Point a represents end-diastole and point c, end-systole. B: If the left ventricle is filled by varying amounts a, a′, a″ and allowed to undergo isovolumic contraction, a relatively linear relationship, the isovolumic pressure-volume relation, can be defined.
Pressure-volume relationships help illustrate the effects of different stresses on cardiac output. Cardiac output of the ventricle is the product of the heart rate and the volume of blood pumped with each beat (stroke volume). The width of the pressure-volume loop is the difference between end-diastolic volume and end-systolic volume, or the stroke volume (Figure 10-6). The stroke volume is dependent on three parameters: contractility, afterload, and preload (Figure 10-7). Changing the contractile state of the heart will change the width of the pressure-volume loop by changing the position of the isovolumic systolic pressure curve. The impedance against which the heart must work (aortic pressure for the left ventricle) is termed afterload; increased afterload will cause a decrease in stroke volume. Preload is the amount of filling of the ventricle at end-diastole. Up to a point, the more a myocyte or ventricular chamber is stretched, the more it will contract (Frank-Starling relationship), so that increased preload will lead to an increase in stroke volume.

FIGURE 10-7 A: Increasing afterload from b to b′ decreases stroke volume from bc to b′c′. B: Increasing preload from a to a′ increases stroke volume from bc to b′c′, but at the expense of increased end-diastolic pressure. C:Increasing contractile state shifts the isovolumic pressure-volume relationship leftward, increasing stroke volume from bc to b′c′.
Pressure-time and pressure-volume relationships are critical for understanding the pathophysiologic mechanisms of diseases that affect the entire ventricular chamber function, such as heart failure and valvular abnormalities.
Cellular Physiology
A. Ventricular and Atrial Myocytes
The cellular mechanism of myocyte contraction after electrical stimulation is too complex to be fully addressed in this section, but excellent discussions of electromechanical coupling can be found. Briefly, when the myocyte is stimulated, sodium channels on the cell surface membrane (sarcolemma) open, and sodium ions (Na+) flow down their electrochemical gradient into the cell. This sudden inward surge of ions is responsible for the sharp upstroke of the myocyte action potential (phase 0) (Figure 10-8). A plateau phase follows during which the cell membrane potential remains relatively unchanged owing to the inward flow of calcium ions (Ca2+) and the outward flow of potassium ions (K+) through several different specialized potassium channels. Repolarization occurs because of continued outward flow of K+ after inward flux of Ca2+ has stopped.

FIGURE 10-8 Changes in ionic conductances responsible for generating action potentials for ventricular or atrial tissue (right) and a sinus or AV node cell (left). In nodal cells rapid Na+ channels are absent, so that the action potential upstroke is much slower. Diastolic depolarization observed in nodal cells is due to decreased K+ efflux and slow Na+ and Ca2+ influx. Ca2+ (T): influx via Ca2+ (T) channels; Ca2+(L): influx via Ca2+ (L) channels.
Within the cell, the change in membrane potential from the sudden influx of Na+ and the subsequent increase in intracellular Ca2+ causes the sarcoplasmic reticulum to release large numbers of calcium ions via specialized Ca2+release channels. The exact signaling mechanism is not known. Once in the cytoplasm, however, Ca2+ released from the sarcoplasmic reticulum binds with the regulatory proteins troponin and tropomyosin. Myosin and actin are then allowed to interact and the cross-bridges between them bend, giving rise to contraction (Figure 10-9). The process of relaxation is poorly understood also but appears to involve return of Ca2+ to the sarcoplasmic reticulum via two transmembrane sarcoplasmic reticulum-embedded proteins: Ca2+-ATPase and phospholamban. Reuptake of Ca2+ is an active process that requires adenosine triphosphate (ATP).

FIGURE 10-9 Initiation of muscle contraction by Ca2+. When Ca2+ binds to troponin C, tropomyosin is displaced laterally, exposing the binding site for myosin on actin (dark area). Hydrolysis of ATP then changes the conformation of the myosin head and fosters its binding to the exposed site. For simplicity, only one of the two heads of the myosin-II molecule is shown. (Redrawn, with permission, from Ganong WF. Review of Medical Physiology, 22nd ed. McGraw-Hill, 2005.)
B. Pacemaker Cells
The action potential of pacemaker cells is different from that described for ventricular and atrial myocytes (Figure 10-8). Fast sodium channels are absent, so that rapid phase 0 depolarization is not observed in SA nodal and AV nodal cells. In addition, these cells are characterized by increased automaticity from a relatively rapid spontaneous phase 4 depolarization. A combination of reduced outward flow of K+ and inward flow of Na+ and Ca2+ via specialized channels appears to be responsible for this dynamic change in membrane potential. Myofibrils are sparse, although present, in the specialized pacemaker cells.
CHECKPOINT
1. What are the differences in pacemaker and conduction properties in different regions of the heart, and why do these differences explain the observation that cardiac electrical impulses normally arise in the SA node?
2. Describe pressure-time analysis through the cardiac cycle.
3. Describe pressure-volume analysis through the cardiac cycle.
4. What are preload and afterload?
5. Briefly describe the molecular mechanism of electromechanical coupling in cardiac myocyte contraction.
PATHOPHYSIOLOGY OF SELECTED CARDIOVASCULAR DISORDERS
ARRHYTHMIAS
At rest, the heart is normally activated at a rate of 50–100 bpm. Abnormal rhythms of the heart (arrhythmias) can be classified as either too slow (bradycardias) or too fast (tachycardias).
Bradycardia
Bradycardia can arise from two basic mechanisms. First, reduced automaticity of the sinus node can result in slow heart rates or pauses. As shown in Figure 10-10, if sinus node pacemaker activity ceases, the heart will usually be activated at a slower rate by other cardiac tissues with pacemaker activity. Reduced sinus node automaticity can occur during periods of increased vagal tone (sleep, carotid sinus massage, “common faint”), with increasing age and secondary to drugs (beta blockers, calcium channel blockers).

FIGURE 10-10 Rhythm strip showing bradycardia resulting from sinus node pause. Atrial activity (arrows) suddenly ceases, and after approximately 3 s a junctional escape beat is observed (J).
Second, slow heart rates can occur if the cardiac impulse is prevented from activating the ventricles normally because of blocked conduction (Figure 10-11). Because the fibrous valvular annulus is electrically inert, the AV node and His bundle normally form the only electrically active connection between the atria and the ventricles. Although this arrangement is useful for preventing feedback between the two chambers, it also makes the AV node and His bundle vulnerable sites for blocked conduction between the atria and ventricles. Although block can be observed in either the left or right bundle branches, bradycardia does not necessarily occur, because the ventricles can still be activated by the contralateral bundle. Atrioventricular block has been classified as first degree when there is an abnormally long atrioventricular conduction time (PR interval >0.22 s) but activation of the atria and ventricles still demonstrates 1:1 association. In second-degree atrioventricular block, some but not all atrial impulses are conducted to the ventricles. Finally, in third-degree block, there is no association between atrial and ventricular activity. Atrioventricular block can occur with increasing age, with increased vagal input, and as a side effect of certain drugs. Atrioventricular block can sometimes be observed also in congenital disorders such as muscular dystrophy, tuberous sclerosis, and maternal systemic lupus erythematosus and in acquired disorders such as sarcoidosis, gout, Lyme disease, systemic lupus erythematosus, ankylosing spondylitis, and coronary artery disease.

FIGURE 10-11 Rhythm strip demonstrating third-degree (complete) heart block with no association between atrial activity (arrows) and ventricular activity (dots).
Bradycardia resulting from either decreased automaticity or blocked conduction requires evaluation to search for reversible causes. However, implantation of a permanent pacemaker is often required.
Tachycardia
Tachycardias can arise from three basic cellular mechanisms (Figure 10-12). First, increased automaticity resulting from more rapid phase 4 depolarization can cause rapid heart rate. Second, if repolarization is delayed (longer plateau period), spontaneous depolarizations (caused by reactivation of sodium or calcium channels) can sometimes occur in phase 3 or phase 4 of the action potential. These depolarizations are called triggered activity because they are dependent on the existence of a preceding action potential. If these depolarizations reach threshold, tachycardia can occur in certain pathologic conditions. Third, and most commonly, tachycardias can arise from a reentrant circuit. Any condition that gives rise to parallel but electrically separate regions with different conduction velocities (such as the border zone of a myocardial infarction or an accessory atrioventricular connection) can serve as the substrate for a reentrant circuit.

FIGURE 10-12 Tachyarrhythmias can arise from three different mechanisms. First, increased automaticity from more rapid phase 4 depolarization can cause arrhythmias. Second, in certain conditions, spontaneous depolarizations during phase 3 (early afterdepolarizations; EAD) or phase 4 (late afterdepolarizations; DAD) can repetitively reach threshold and cause tachycardia. This appears to be the mechanism of the polymorphic ventricular tachycardia (torsades de pointes) observed in some patients taking procainamide or quinidine and the arrhythmias associated with digoxin toxicity. Third, the most common mechanism for tachyarrhythmia is reentry. In reentry, two parallel pathways with different conduction properties exist (perhaps at the border zone of a myocardial infarction or a region of myocardial ischemia). The electrical impulse normally travels down the fast pathway and the slow pathway (shaded region), but at the point where the two pathways converge the impulse traveling down the slow pathway is blocked since the tissue is refractory from the recent depolarization via the fast pathway (a). However, when a premature beat reaches the circuit, block can occur in the fast pathway, and the impulse will travel down the slow pathway (shaded region) (b). After traveling through the slow pathway the impulse can then enter the fast pathway in retrograde fashion (which because of the delay has recovered excitability), and then reenter the slow pathway to start a continuous loop of activation, or reentrant circuit (c).
The best studied example of reentrant tachyarrhythmias is Wolff-Parkinson-White syndrome (Figure 10-13). As mentioned, the AV node normally forms the only electrical connection between the atria and the ventricles. Perhaps because of incomplete formation of the annulus, an accessory atrioventricular connection is found in approximately 1 in 1000 persons. This accessory pathway is usually composed of normal atrial or ventricular tissue. Because part of the ventricle is “pre-excited” over the accessory pathway rather than via the AV node, the surface ECG shows a short PR interval and a relatively wide QRS with a slurred upstroke, termed a delta wave. Because the atria and ventricles are linked by two parallel connections, reentrant tachycardias are readily initiated. For example, a premature atrial contraction could be blocked in the accessory pathway but still conduct to the ventricles via the AV node. If enough time has elapsed so that the accessory pathway has recovered excitability, the cardiac impulse can travel in retrograde fashion to the atria over the accessory pathway and initiate a reentrant tachycardia.

FIGURE 10-13 Reentrant tachyarrhythmia resulting from Wolff-Parkinson-White syndrome. A: First two beats demonstrate sinus rhythm with preexcitation of the ventricles over an accessory pathway. The large arrows show the delta wave. An atrial premature contraction (APC) blocks in the accessory pathway, which leads to normalization of the QRS, and the atria are activated in retrograde fashion via the accessory pathway (small arrows) and supraventricular tachycardia ensues. B: The left panel schematically depicts the first two beats of the rhythm strip. The QRS is wide owing to activation of the ventricles over both the AV node and the accessory pathway. The middle panel depicts the atrial premature contraction, which is blocked in the accessory pathway but conducts over the AV node. In the right panel, the atria are activated in retrograde fashion over the accessory pathway, and a reentrant circuit is initiated.
The best example of tachycardias from triggered activity is the long QT syndrome. More than 40 years ago, investigators described several clusters of patients with a congenital syndrome associated with a long QT interval and ventricular arrhythmias. Data have shown that the long QT interval can be due to several specific ion channel defects. For example, reduced function of potassium channels leads to a prolonged plateau period (Figure 10-14). The prolonged plateau phase in ventricular tissue leads to a prolonged QT interval. These patients are prone to triggered activity because of reactivation of sodium and calcium channels (early after depolarizations). Triggered activity in the ventricles can lead to life-threatening ventricular arrhythmias.

FIGURE 10-14 In certain patients with the long QT syndrome, potassium channel function is reduced (diagonal arrows), which leads to prolongation of the action potential of ventricular myocytes and prolongation of the QT interval. In some cases, reactivation of sodium and calcium channels can lead to triggered activity that can initiate life-threatening ventricular arrhythmias.
Regardless of the mechanism, the approach to immediate clinical management of tachycardias depends on whether the QRS complex is narrow or wide. If the QRS complex is narrow, depolarization of the ventricles must be occurring normally over the specialized conduction tissues of the heart, and the arrhythmia must be originating at or above the AV node (supraventricular) (Figure 10-15).

FIGURE 10-15 In supraventricular tachycardia, the QRS is narrow because the ventricles are depolarized over the normal specialized conduction tissues (light blue region). Five possible arrhythmias are commonly encountered. First, in atrial fibrillation, multiple microreentrant circuits can lead to chaotic activation of the atrium. Because impulses are reaching the AV node at irregular intervals, ventricular depolarization is irregular. Second, in atrial flutter, a macroreentrant circuit, traveling up the interatrial septum and down the lateral walls, can activate the atria in a regular fashion at approximately 300 bpm. The AV node can conduct only every other or every third beat, so that the ventricles are depolarized at 150 or 100 bpm. In AV nodal reentrant tachycardia, slow and fast pathways exist in the region of the AV node and a microreentrant circuit can be formed. Fourth, in atrioventricular reentry, an abnormal connection between the atrium and ventricle exists so that a macroreentrant circuit can be formed with the AV node forming the slow pathway, and the abnormal atrioventricular connection, the fast pathway. Finally, in atrial tachycardia an abnormal focus of atrial activity as a result of either reentry, triggered activity, or abnormal automaticity can activate the atria in a regular fashion.
A wide QRS complex suggests that ventricular activation is not occurring normally over the specialized conduction tissues of the heart. The tachycardia either is arising from ventricular tissue or is a supraventricular tachycardia with aberrant conduction over the His-Purkinje system or an accessory pathway. Criteria have been developed for distinguishing between ventricular and supraventricular tachycardia with aberrance.
HEART FAILURE
Inadequate pump function of the heart, which leads to congestion resulting from fluid in the lungs and peripheral tissues, is a common end result of many cardiac disease processes. Heart failure (HF) is present in approximately 3 million people in the United States; more than 400,000 new cases are reported annually. The clinical presentation is highly variable; for an individual patient, symptoms and signs depend on how quickly heart failure develops and whether it involves the left, right, or both ventricles.
1. Left Ventricular Failure
Clinical Presentation
Patients with left ventricular failure most commonly present with a sensation of breathlessness (dyspnea), particularly when lying down (orthopnea) or at night (paroxysmal nocturnal dyspnea). In addition, the patient may complain of blood-tinged sputum (hemoptysis) and occasionally chest pain. Fatigue, nocturia, and confusion can also be caused by heart failure.
On physical examination, the patient usually has elevated respiratory and heart rates. The skin may be pale, cold, and sweaty. In severe heart failure, palpation of the peripheral pulse may reveal alternating strong and weak beats (pulsus alternans). Auscultation of the lungs reveals abnormal sounds, called rales, that have been described as “crackling leaves.” In addition, the bases of the lung fields may be dull to percussion. On cardiac examination, the apical impulse is often displaced laterally and sustained. Third and fourth heart sounds can be heard on auscultation of the heart. Because many patients with left ventricular failure also have accompanying failure of the right ventricle, signs of right ventricular failure may also be present (see next section).
Etiology
Heart failure is a pathophysiologic complex associated with dysfunction of the heart and is a common end point for many diseases of the cardiovascular system. There are many possible causes (Table 10-1), and the specific reason for heart failure in a given patient must always be sought. In general, heart failure can be caused by (1) inappropriate workloads placed on the heart, such as volume overload or pressure overload; (2) restricted filling of the heart; (3) myocyte loss; or (4) decreased myocyte contractility. Any one of these causes can initiate an evolving sequence of events that are described next.
TABLE 10-1 Causes of left ventricular failure.

Pathophysiology
The pathophysiology of heart failure is complex and must be understood at multiple levels. Traditionally, research has focused on the hemodynamic changes of the failing heart, considering the heart as an isolated organ. However, studies of the failing heart have emphasized the importance of understanding changes at the cellular level and the neuro-hormonal interactions between the heart and other organs of the body (Table 10-2).
TABLE 10-2 Pathophysiologic changes associated with heart failure.

A. Hemodynamic Changes—From a hemodynamic standpoint, heart failure can arise from worsening systolic or diastolic function or, more frequently, a combination of both. In systolic dysfunction, the isovolumic systolic pressure curve of the pressure-volume relationship is shifted downward (Figure 10-16A). This reduces the stroke volume of the heart with a concomitant decrease in cardiac output. To maintain cardiac output, the heart can respond with three compensatory mechanisms: First, increased return of blood to the heart (preload) can lead to increased contraction of sarcomeres (Frank-Starling relationship). In the pressure-volume relationship, the heart operates at a′ instead of a, and stroke volume increases, but at the cost of increased end-diastolic pressure (Figure 10-16D). Second, increased release of catecholamines can increase cardiac output by both increasing the heart rate and shifting the systolic isovolumetric curve to the left (Figure 10-16C). Finally, cardiac muscle can hypertrophy and ventricular volume can increase, which shifts the diastolic curve to the right (Figure 10-16B). Although each of these compensatory mechanisms can temporarily maintain cardiac output, each is limited in its ability to do so, and if the underlying reason for systolic dysfunction remains untreated, the heart ultimately fails.

FIGURE 10-16 A: Systolic dysfunction is represented by shifting of the isovolumic pressure-volume curve to the right (dashed line), thus decreasing stroke volume. The ventricle can compensate by (B) shifting the diastolic pressure-volume relationship rightward (dashed line) by increasing left ventricular volume or elasticity, (C) increasing contractile state (dashed line) by activation of circulating catecholamines, and (D) increasing filling or preload (ato a′).
In diastolic dysfunction, the position of the systolic isovolumic curve remains unchanged (contractility of the myocytes is preserved). However, the diastolic pressure-volume curve is shifted to the left, with an accompanying increase in left ventricular end-diastolic pressure and symptoms of heart failure (Figure 10-17). Diastolic dysfunction can be present in any disease that causes decreased relaxation, decreased elastic recoil, or increased stiffness of the ventricle. Hypertension often leads to compensatory increases in left ventricular wall thickness that can cause diastolic dysfunction by changing all three parameters. Lack of sufficient blood to myocytes (ischemia) can also cause diastolic dysfunction by decreasing relaxation. If ischemia is severe, as in myocardial infarction, irreversible damage to the myocytes can occur, with replacement of contractile cells by fibrosis, which will lead to systolic dysfunction. In most patients, a combination of systolic and diastolic dysfunction is responsible for the symptoms of heart failure.

FIGURE 10-17 In diastolic dysfunction, the diastolic pressure-volume relation is shifted upward and to the left (dashed line), which leads to an elevated left ventricular end-diastolic pressure a′ and reduced stroke volume.
B. Neuro-hormonal Changes—After an injury to the heart (Table 10-1), increased secretion of endogenous neuro-hormones and cytokines is observed. Initially, increased activity of the adrenergic system and the renin-angiotensin system provides a compensatory response that maintains perfusion of vital organs. However, over time these changes can lead to progressive deterioration of cardiac function.
Increased sympathetic activity occurs early in the development of heart failure. Elevated plasma norepinephrine levels cause increased cardiac contractility and an increased heart rate that initially help maintain cardiac output. However, continued increases lead to increased preload (as a result of venous vasoconstriction) and afterload (from arterial vasoconstriction), which can worsen heart failure. In addition, sympathetic hyperactivity causes deleterious cellular changes, which are discussed in the next section.
Reduced renal blood pressure stimulates the release of renin and increases the production of angiotensin II. Both angiotensin II and sympathetic activation cause efferent glomerular arteriolar vasoconstriction, which helps maintain the glomerular filtration rate despite a reduced cardiac output. Angiotensin II stimulates aldosterone synthesis, which leads to sodium resorption and potassium excretion by the kidneys. However, a vicious circle is initiated as continued hyperactivity of the renin-angiotensin system leads to severe vasoconstriction, increased afterload, and further reduction in cardiac output and glomerular filtration rate.
Heart failure is associated with increased release of vasopressin from the posterior pituitary gland. Vasopressin is another powerful vasoconstrictor that also promotes reabsorption of water in the renal tubules.
Heart failure is associated with the release of cytokines and other circulating peptides. Cytokines are a heterogeneous family of proteins that are secreted by macrophages, lymphocytes, monocytes, and endothelial cells in response to injury. The interleukins (ILs) and tumor necrosis factor (TNF) are the two major groups of cytokines that may have an important pathophysiologic role in heart failure. Upregulation of the gene responsible for TNF with an accompanying increase in circulating plasma levels of TNF has been found in patients with heart failure. TNF appears to have an important role in the cycle of myocyte hypertrophy and cell death (apoptosis) described in the next section. Preliminary in vitro data suggest that IL-1 may accelerate myocyte hypertrophy. Another peptide important for mediating some of the pathophysiologic effects observed in heart failure is the potent vasoconstrictor endothelin, which is released from endothelial cells. Preliminary data have suggested that excessive endothelin release may be responsible for hypertension in the pulmonary arteries observed in patients with left ventricular heart failure. Endothelin is also associated with myocyte growth and deposition of collagen in the interstitial matrix.
C. Cellular Changes—Pathophysiologic changes at the cellular level are very complex and include changes in Ca2+ handling, adrenergic receptors, contractile apparatus, and myocyte structure.
In heart failure, both delivery of Ca2+ to the contractile apparatus and reuptake of Ca2+ by the sarcoplasmic reticulum are slowed. Decreased levels of messenger ribonucleic acid (mRNA) for the specialized Ca2+ release channels have been reported by some investigators. Similarly, myocytes from failing hearts have reduced levels of mRNA for the two sarcoplasmic reticulum proteins phospholamban and Ca2+-ATPase.
Two major classes of adrenergic receptors are found in the human heart. Alpha1-adrenergic receptors are important for induction of myocardial hypertrophy; levels of α1 receptors are slightly increased in heart failure. Heart failure is associated with significant β-adrenergic receptor desensitization as a result of chronic sympathetic activation. This effect is mediated by downregulation of β1-adrenergic receptors, downstream uncoupling of the signal transduction pathway, and upregulation of inhibitory G proteins. All of these changes lead to a further reduction in myocyte contractility.
Cardiac myocytes cannot proliferate once they have matured to their adult form. However, there is a constant turnover of the contractile proteins that make up the sarcomere. In response to the hemodynamic stresses associated with heart failure, angiotensin II, TNF, norepinephrine, and other molecules induce protein synthesis via intranuclear mediators of gene activity such as c-fos, c-jun, and c-myc. This causes myocyte hypertrophy with an increase in sarcomere numbers and a re-expression of fetal and neonatal forms of myosin and troponin. Activation of this primitive program results in the development of large myocytes that do not contract normally and have decreased ATPase activity.
The heart enlarges in response to continued hemodynamic stress. Changes in myocardial size and shape associated with heart failure are collectively referred to as left ventricular remodeling. Several tissue changes appear to mediate this process. First, heart failure is associated with myocyte loss via a process called apoptosis (programmed cell death). Unlike the process of necrosis, apoptotic cells initially demonstrate decreased cell volume without disruption of the cell membrane. However, as the apoptotic process continues, the myocyte ultimately dies, and “holes” are left in the myocardium. Loss of myocytes places increased stress on the remaining myocytes. The process of apoptosis is accelerated by the proliferative signals that stimulate myocyte hypertrophy such as TNF. Although apoptosis is a normal process that is essential in organs made up of proliferating cells, in the heart apoptosis initiates a vicious circle whereby cell death causes increased stress that leads to hypertrophy and further acceleration of apoptosis.
A second tissue change observed in heart failure is an increased amount of fibrous tissue in the interstitial spaces of the heart. Collagen deposition is due to activation of fibroblasts and myocyte death. Endothelin release leads to interstitial collagen deposition. The increase in connective tissue increases chamber stiffness and shifts the diastolic pressure-volume curve to the left.
Finally, heart failure is associated with gradual dilation of the ventricle. Myocyte “slippage” as a result of activation of collagenases that disrupt the collagen network may be responsible for this process.
Clinical Manifestations
A. Symptoms
1. Shortness of breath, orthopnea, paroxysmal nocturnal dyspnea—Although many details of the physiologic mechanisms for the sensation of breathlessness are unclear, the inciting event probably is a rise in pulmonary capillary pressures as a consequence of elevated left ventricular and atrial pressures. The rise in pulmonary capillary pressure relative to plasma oncotic pressure causes fluid to move into the interstitial spaces of the lung (pulmonary edema), which can be seen on chest x-ray film (Figure 10-18). Interstitial edema probably stimulates juxtacapillary J receptors, which in turn causes reflex shallow and rapid breathing. Replacement of air in the lungs by blood or interstitial fluid can cause a reduction of vital capacity, restrictive physiology, and air trapping as a result of closure of small airways. The work of breathing increases as the patient tries to distend stiff lungs, which can lead to respiratory muscle fatigue and the sensation of dyspnea. Alterations in the distribution of ventilation and perfusion result in relative ventilation-perfusion mismatch, with consequent widening of the alveolar-arterial O2 gradient, hypoxemia, and increased dead space. Edema of the bronchial walls can lead to small airway obstruction and produce wheezing (“cardiac asthma”). Shortness of breath occurs in the recumbent position (orthopnea) because of reduced blood pooling in the extremities and abdomen, and, because the patient is operating on the steep portion of the diastolic pressure-volume curve, any increase in blood return leads to marked elevations in ventricular pressures. Patients usually learn to minimize orthopnea by sleeping with the upper body propped up by two or more pillows. Sudden onset of severe respiratory distress at night—paroxysmal nocturnal dyspnea—probably occurs because of the reduced adrenergic support of ventricular function that occurs with sleep, the increase in blood return as described previously, and normal nocturnal depression of the respiratory center.
2. Fatigue, confusion—Fatigue probably arises because of inability of the heart to supply appropriate amounts of blood to skeletal muscles. Confusion may arise in advanced heart failure because of under-perfusion of the cerebrum.
3. Nocturia—Heart failure can lead to reduced renal perfusion during the day while the patient is upright, which normalizes only at night while the patient is supine, with consequent diuresis.
4. Chest pain—If the cause of failure is coronary artery disease, patients may have chest pain secondary to ischemia (angina pectoris). In addition, even without ischemia, acute heart failure can cause chest pain by unknown mechanisms.

FIGURE 10-18 Posteroanterior chest x-ray film in a man with acute pulmonary edema resulting from left ventricular failure. Note the bat’s wing density, cardiac enlargement, increased size of upper lobe vessels, and pulmonary venous congestion. (Reproduced, with permission, from Cheitlin MD et al, eds. Clinical Cardiology, 6th ed. Originally published by Appleton & Lange. Copyright © 1993 by The McGraw-Hill Companies, Inc.)
B. Physical Examination
1. Rales, pleural effusion—Increased fluid in the alveolar spaces from the mechanisms described previously can be heard as rales. Increased capillary pressures can also cause fluid accumulation in the pleural spaces.
2. Displaced and sustained apical impulse—In most people, contraction of the heart can be appreciated by careful palpation of the chest wall (apical impulse). The normal apical impulse is felt in the midclavicular line in the fourth or fifth intercostal space and is palpable only during the first part of systole. When the apical impulse can be felt during the latter part of systole, it is sustained. Sustained impulses suggest that increases in left ventricular volume or mass are present. In addition, when left ventricular volume is increased as a compensatory mechanism of heart failure, the apical impulse is displaced laterally.
3. Third heart sound (S3)—The third heart sound is a low-pitched sound that is heard during rapid filling of the ventricle in early diastole (Figure 10-19A). The exact mechanism responsible for the genesis of the third heart sound is not known, but the sound appears to result either from the sudden deceleration of blood as the elastic limits of the ventricular chamber are reached or from the actual impact of the ventricular wall against the chest wall. Although a third heart sound is normal in children and young adults, it is rarely heard in healthy adults older than 40 years. In these individuals, the presence of a third heart sound is almost pathognomonic of ventricular failure. The increased end-systolic volumes and pressures characteristic of the failing heart are probably responsible for the prominent third heart sound. When it arises because of left ventricular failure, the third heart sound is usually heard best at the apex. It can be present in patients with either diastolic or systolic dysfunction.
4. Fourth heart sound (S4)—Normally, sounds arising from atrial contraction are not heard. However, if there is increased stiffness of the ventricle, a low-pitched sound at end-diastole that occurs concomitantly with atrial contraction can sometimes be heard (Figure 10-19B). As with the third heart sound, the exact mechanism for the genesis of the fourth heart sound is not known. However, it probably arises from the sudden deceleration of blood in a noncompliant ventricle or from the sudden impact of a stiff ventricle against the chest wall. It is best heard laterally over the apex at the point of maximal impulse, particularly when the patient is partially rolled over onto the left side. The fourth heart sound is commonly heard in any patient with heart failure resulting from diastolic dysfunction.
5. Pale, cold, and sweaty skin—Patients with severe heart failure often have peripheral vasoconstriction, which maintains blood flow to the central organs and head. In some cases, the skin appears dusky because of reduced oxygen content in venous blood as a result of increased oxygen extraction from peripheral tissues that are receiving low blood flow. Sweating occurs because body heat cannot be dissipated through the constricted vascular bed of the skin.

FIGURE 10-19 A: Phonocardiogram showing typical third heart sound (S3). It follows the second sound (S2) by 0.16 s. B: Phonocardiogram showing a fourth heart sound (S4) and its relation to first sound (S1).
2. Right Ventricular Failure
Clinical Presentation
Symptoms of right ventricular failure include shortness of breath, pedal edema, and abdominal pain.
The findings on physical examination are similar to those of left ventricular failure but in different positions, because the right ventricle is anatomically anterior and to the right of the left ventricle (Figure 10-1). Patients with right ventricular failure may have a third heart sound heard best at the sternal border or a sustained systolic heave of the sternum. Inspection of the neck reveals elevated jugular venous pressures. Because the most common cause of right ventricular failure is left ventricular failure, signs of left ventricular failure are often also present.
Etiology
Right ventricular failure can be due to several causes. As mentioned, left ventricular failure can cause right ventricular failure because of the increased afterload placed on the right ventricle. Increased afterload can also be present from abnormalities of the pulmonary arteries or capillaries. For example, increased flow from a congenital shunt can cause reactive pulmonary artery constriction, increased right ventricular afterload, and, ultimately, right ventricular failure. Right ventricular failure can occur as a sequela of pulmonary disease (cor pulmonale) because of destruction of the pulmonary capillary bed or hypoxia-induced vasoconstriction of the pulmonary arterioles. Right ventricular failure can also be caused by right ventricular ischemia, usually in the setting of an inferior wall myocardial infarction (Table 10-3).
TABLE 10-3 Causes of right ventricular failure.

Pathophysiology
The pathophysiology of right ventricular failure is similar to that described for the left ventricle. Both systolic and diastolic abnormalities of the right ventricle can be present and usually occur because of inappropriate loads placed on the ventricle or primary loss of myocyte contractility.
Patients with isolated right ventricular failure (pulmonary hypertension, cor pulmonale) can have a mechanical reason for left ventricular failure. The interventricular septum is usually bowed toward the thinner walled and lower pressure right ventricle. When right ventricular pressure increases relative to the left, the interventricular septum can bow to the left and prevent efficient filling of the left ventricle, which may lead to pulmonary congestion. Rarely, the bowing can be so severe that left ventricular outflow can be partially obstructed.
Clinical Manifestations
A. Shortness of Breath—If there is left ventricular failure, patients may be short of breath because of pulmonary edema, as discussed previously. In patients with right-sided failure resulting from pulmonary disease, shortness of breath may be a manifestation of the underlying disease (eg, pulmonary embolus, chronic obstructive pulmonary disease). In some patients with right ventricular failure, congestion of the hepatic veins with formation of ascites can impinge on normal diaphragmatic function and contribute to the sensation of dyspnea. In addition, reduced right-sided cardiac output alone can cause acidosis, hypoxia, and air hunger. If the cause of right-sided failure is a left-sided defect such as mitral stenosis, the onset of right heart failure can sometimes lessen the symptoms of pulmonary edema because of the decreased load placed on the left ventricle.
B. Elevated Jugular Venous Pressure—The position of venous pulsations of the internal jugular vein can be observed during examination of the neck (Figure 10-20A). The vertical distance above the heart at which venous pulsations are observed is an estimate of the right atrial or central venous pressure. Because the position of the right atrium cannot be precisely determined, the height of the jugular venous pulsation is measured relative to the angle of Louis on the sternum. Right atrial pressure can then be approximated by adding 5 cm to the height of the venous column (because the right atrium is approximately 5 cm inferior to the angle). Jugular venous pulsations are usually observed less than 7 cm above the right atrium. Elevated atrial pressures are present any time this distance is greater than 10 cm. Elevated atrial pressures indicate that the preload of the ventricle is adequate but ventricular function is decreased and fluid is accumulating in the venous system. Other causes of elevated jugular pressures besides heart failure include pericardial tamponade, constrictive pericarditis, and massive pulmonary embolism.

FIGURE 10-20 A: Examination of jugular venous pulse and estimation of venous pressure. (RA, right atrium; RV, right ventricle.) B: Jugular venous pressure waveforms in relation to the electrocardiogram (P wave, QRS, and T wave) and the first and second heart sounds (S1 and S2). The bottom of the x descent occurs coincident with the first heart sound (S1). The v wave occurs just after the apical impulse is felt at the same time the second heart sound (S2) is heard. See text for further explanation of jugular venous wave forms.
In addition to relative position, individual waveforms of the jugular venous pulse can be assessed. Three positive waves (a, c, and v) and two negative waves (x and y) can be recognized (Figure 10-20B). The a wave is caused by transmitted right atrial pressure from atrial contraction. The c wave is usually not present on bedside examination; it is thought to arise from bulging of the tricuspid valve during isovolumic contraction of the right ventricle. The xdescent is thought to be due to atrial relaxation and downward displacement of the tricuspid annulus during systole. The v wave arises from continued filling of the right atrium during the latter part of systole. Once the tricuspid valve opens, blood flows into the right ventricle and the y descent begins. Evaluation of the individual waveforms will become particularly important when pericardial disease is discussed.
C. Anasarca, Ascites, Pedal Edema, Hepatojugular Reflux, Abdominal Pain—Elevated right-sided pressure leads to accumulation of fluid in the systemic venous circulation. Venous congestion can be manifested by generalized edema (anasarca), ascites (collection of fluid in the peritoneal space), and dependent edema (swelling of the feet and legs). Pressing on the liver for approximately 5 seconds can lead to displacement of blood into the vena cava; when the right ventricle cannot accommodate this additional volume, an increase in jugular venous pressure (“hepatojugular reflux”) can be observed. Expansion of the liver from fluid accumulation can cause distention of the liver capsule with accompanying right upper quadrant abdominal pain.
CHECKPOINT
6. What are the clinical presentations of left ventricular heart failure (HF)? Of right ventricular failure?
7. What are the four general categories that account for almost all causes of HF?
8. Explain the differences between the pathophysiology of HF resulting from systolic versus diastolic dysfunction.
9. What are the major clinical manifestations and complications of left- versus right-sided heart failure?
VALVULAR HEART DISEASE
Dysfunctional cardiac valves can be classified as either narrow (stenosis) or leaky (regurgitation). Although the tricuspid and pulmonary valves can become dysfunctional in patients with endocarditis, congenital lesions, or carcinoid syndrome, primary right-sided valvular abnormalities are relatively rare and are not discussed further here. In this section, the pathophysiologic mechanisms of stenotic and regurgitant aortic and mitral valves are addressed.
A general classification of heart murmurs is presented in Figure 10-21. Any disease process that creates turbulent flow in the heart or great vessels can cause a murmur. For instance, ventricular septal defect is associated with a systolic murmur because of the abnormal interventricular connection and the pressure difference between the left and right ventricles; patent ductus arteriosus is associated with a continuous murmur because of a persistent connection between the pulmonary artery and the aorta. However, valvular lesions are the principal cause of heart murmurs. Thus, an understanding of heart murmurs gives insight into the underlying pathophysiologic processes of specific valvular lesions.

FIGURE 10-21 The timing of the principal cardiac murmurs.
Heart murmurs can be either systolic or diastolic. During systole, while the left ventricle is contracting, the aortic valve is open and the mitral valve is closed. Turbulent flow can occur either because of an incompetent mitral valve, leading to regurgitation of blood back into the atrium, or from a narrowed aortic valve. In diastole, the situation is reversed, with filling of the left ventricle through an open mitral valve while the aortic valve is closed. Turbulent flow occurs when there is narrowing of the mitral valve or incompetence of the aortic valve. Stenosis of valves usually develops slowly over time; lesions that cause valvular regurgitation can be either chronic or acute.
1. Aortic Stenosis
Clinical Presentation
For all causes of aortic stenosis, there is usually a long latent period of slowly increasing obstruction before symptoms appear. In descending order of frequency, the three characteristic symptoms of aortic stenosis are chest pain (angina pectoris), syncope, and heart failure (see prior discussion). Once symptoms occur, the prognosis is poor if the obstruction is untreated, with average life expectancies of 2, 3, and 5 years for angina pectoris, syncope, and heart failure, respectively.
On physical examination, palpation of the carotid upstroke reveals a pulsation (pulsus) that is both decreased (parvus) and late (tardus) relative to the apical impulse. Palpation of the chest reveals an apical impulse that is laterally displaced and sustained. On auscultation, a midsystolic murmur is heard, loudest at the base of the heart, and often with radiation to the sternal notch and the neck. Depending on the cause of the aortic stenosis, a crisp, relatively high-pitched aortic ejection sound can be heard just after the first heart sound. Finally, a fourth heart sound (S4) is often present.
Etiology
Various causes of aortic stenosis are listed and described in Table 10-4.
TABLE 10-4 Causes of aortic stenosis.

Pathophysiology
The normal aortic valve area is approximately 3.5–4.0 cm2. Critical aortic stenosis is usually present when the area is less than 0.8 cm2. At this point, the systolic gradient between the left ventricle and the aorta can exceed 150 mm Hg, and most patients are symptomatic (Figure 10-22A). The fixed outflow obstruction places a large afterload on the ventricle. The compensatory mechanisms of the heart can be understood by examining Laplace law for a sphere, where wall stress (T) is proportionate to the product of the transmural pressure (P) and cavitary radius (r) and inversely proportionate to wall thickness (W):

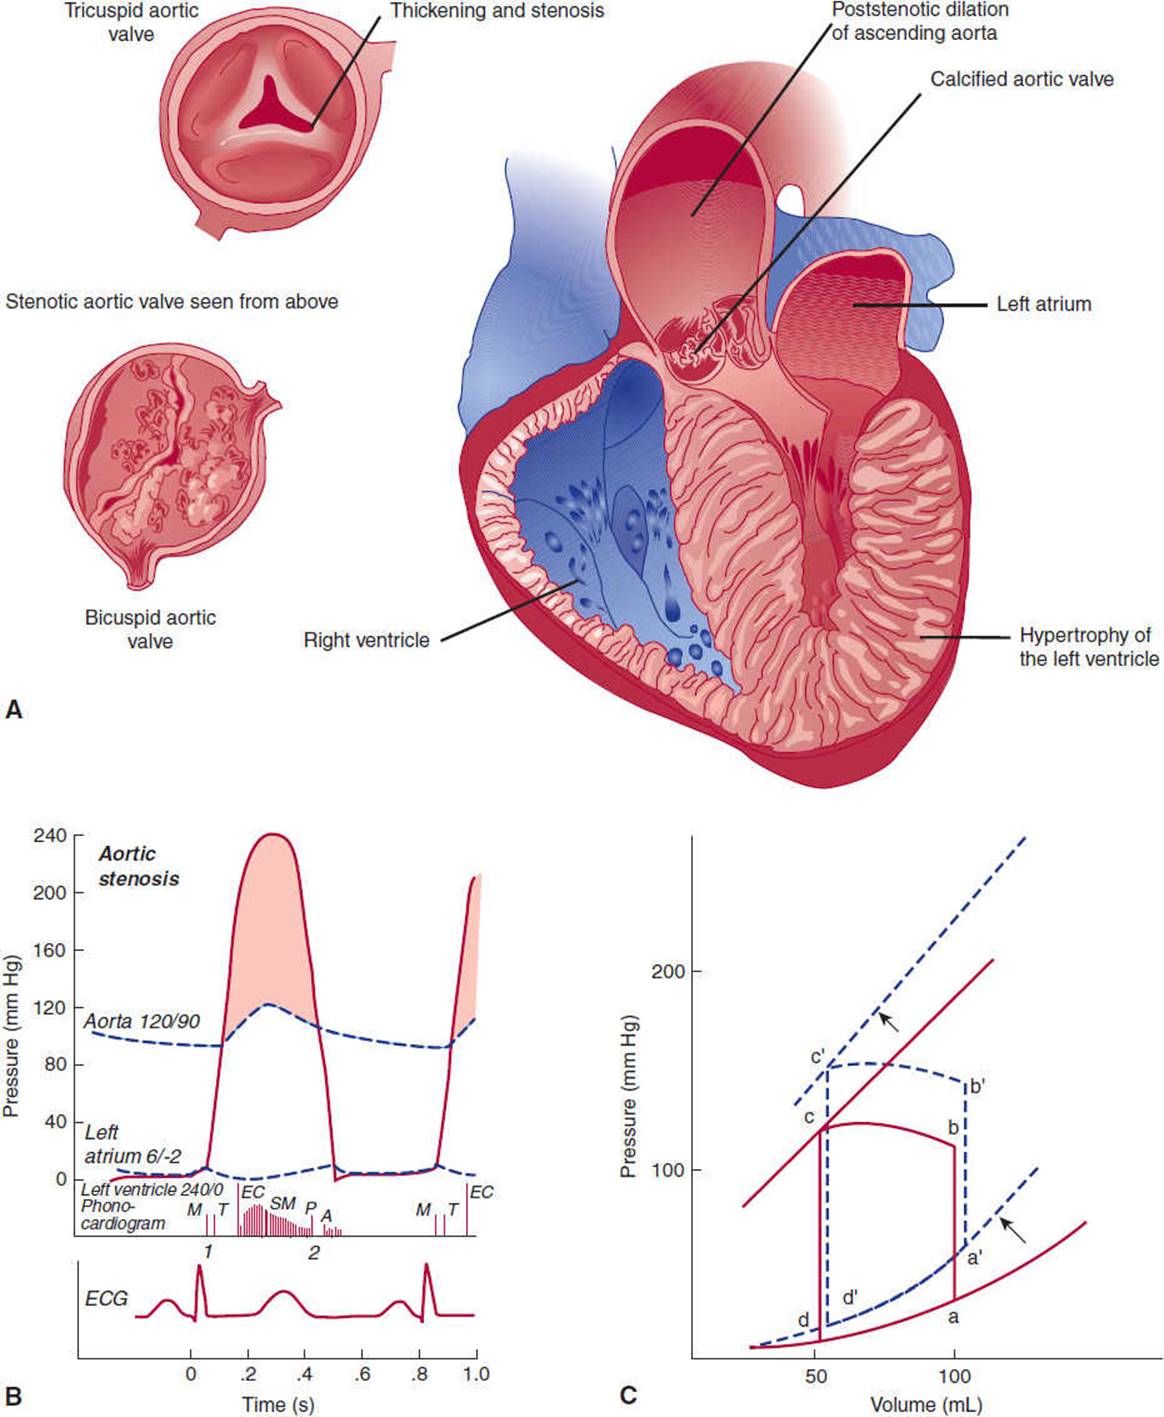
FIGURE 10-22 Aortic stenosis. A: Drawing of the left heart in left anterior oblique view showing anatomic features of aortic stenosis. Note structures enlarged: left ventricle (thickened); poststenotic dilation of the aorta. B:Drawing showing auscultatory and hemodynamic features of predominant aortic stenosis. Cardinal features include left ventricular hypertrophy; systolic ejection murmur. (EC, ejection click; SM, systolic murmur; P, pulmonary valve; A, aortic valve.) (Redrawn, with permission, from Cheitlin MD et al, eds. Clinical Cardiology, 6th ed. Originally published by Appleton & Lange. Copyright © 1993 by The McGraw-Hill Companies, Inc.) C: Pressure-volume loop in aortic stenosis. The left ventricle becomes thickened and less compliant, forcing the diastolic pressure-volume curve upward, which results in elevated left ventricular end-diastolic pressure (a′). Because the left ventricle must pump against a fixed gradient (increased afterload), b increases to b′. Finally, the hypertrophy of the ventricle results in increased inotropic force, which shifts the isovolumic pressure curve leftward.
In response to the pressure overload (increased P), left ventricular wall thickness markedly increases—while the cavitary radius remains relatively unchanged—by parallel replication of sarcomeres. These compensatory changes, termed “concentric hypertrophy,” reduce the increase in wall tension observed in aortic stenosis (see Aortic Regurgitation). Analysis of pressure-volume loops reveals that, to maintain stroke volume and because of decreases in ventricular compliance, left ventricular end-diastolic pressure increases significantly (Figure 10-22C). The thick ventricle leads to a prominent a wave on left atrial pressure tracings as the ventricle becomes more dependent on atrial contraction to fill the ventricle.
Clinical Manifestations
A. Symptoms
1. Angina pectoris—Angina can occur because of several mechanisms. First, approximately half of all patients with aortic stenosis have significant concomitant coronary artery disease. Even without significant coronary artery disease, the combination of increased oxygen demands because of ventricular hypertrophy and decreased supply as a result of excessive compression of the vessels can lead to relative ischemia of the myocytes. Finally, coronary artery obstruction from calcium emboli arising from a calcified stenotic aortic valve has been reported, although it is an uncommon cause of angina.
2. Syncope—Syncope in aortic stenosis is usually due to decreased cerebral perfusion from the fixed obstruction but may also occur because of transient atrial arrhythmias with loss of effective atrial contribution to ventricular filling. In addition, arrhythmias arising from ventricular tissues are more common in patients with aortic stenosis and can cause syncope.
3. Heart failure—(See prior discussion of Heart Failure.) The progressive increase in left ventricular end-diastolic pressure can cause elevated pulmonary venous pressure and pulmonary edema.
B. Physical Examination—Because there is a fixed obstruction to flow, the carotid upstroke is decreased and late. Left ventricular hypertrophy causes the apical impulse to be displaced laterally and to become sustained. The increased dependence on atrial contraction is responsible for the prominent S4. Flow through the restricted orifice gives rise to a midsystolic murmur. The murmur is usually heard best at the base of the heart but often radiates to the neck and apex. It usually presents as a crescendo-decrescendo murmur, and in contrast to mitral regurgitation, the first and second heart sounds are easily heard. As aortic valve narrowing worsens, the murmur peaks later in systole. When calcified leaflets are present, the murmur tends to have a harsher quality. An aortic ejection sound, which is caused by the sudden checking of the leaflets as they open, is heard only when the leaflets remain fairly mobile, as in congenitally malformed valves.
Although obstruction of blood flow from the left ventricle is usually due to valvular disease, obstruction can also occur above or below the valve and can present in somewhat the same way as valvular aortic stenosis. A membranous shelf that partially obstructs flow just above the valve in the aorta can sometimes be present from birth. In this condition, the systolic murmur is usually heard best at the first intercostal space at the right sternal border. Subvalvular stenosis can occur in some patients who develop severe hypertrophy of the heart (Figure 10-23). This well-recognized clinical entity—hypertrophic cardiomyopathy—can also be manifested by a crescendo-decrescendo systolic murmur noted on physical examination. However, obstruction of the outflow tract in hypertrophic cardiomyopathy is dynamic, with greater obstruction when preload is decreased from decreased intra-ventricular volume. For this reason, having the patient stand or perform Valsalva maneuver (expiratory effort against a closed glottis), both of which decrease venous return, causes the murmur to increase. Both of these maneuvers cause a decrease in murmurs caused by valvular stenosis, because less absolute blood volume flows across the stenotic aortic valve.

FIGURE 10-23 Hypertrophic cardiomyopathy (left lateral view). The cardinal features are displayed. (Redrawn, with permission, from Cheitlin MD et al, eds. Clinical Cardiology, 6th ed. Originally published by Appleton & Lange. Copyright © 1993 by The McGraw-Hill Companies, Inc.)
2. Aortic Regurgitation
Clinical Presentation
Aortic regurgitation can be either chronic or acute. In chronic aortic regurgitation, there is a long latent period during which the patient remains asymptomatic as the heart responds to the volume load. When the compensatory mechanisms fail, symptoms of left-sided failure become manifest. In acute aortic regurgitation, compensatory mechanisms have no time to be activated, so shortness of breath, pulmonary edema, and hypotension—often with cardiovascular collapse—occur suddenly.
Physical examination of patients with chronic aortic regurgitation reveals hyperdynamic (pounding) pulses. The apical impulse is hyperdynamic and displaced laterally. On auscultation, three murmurs may be heard: a high-pitched early diastolic murmur, a diastolic rumble called the Austin Flint murmur, and a systolic murmur. A third heart sound is often present. However, in acute aortic regurgitation, the peripheral signs are often absent, and in many cases the left ventricular impulse is normal. On auscultation, the diastolic murmur is much softer, and the Austin Flint murmur, if present, is short. The first heart sound will be soft and sometimes absent.
Etiology
Acute and chronic aortic regurgitation can be due to either valvular or aortic root abnormalities (Table 10-5).
TABLE 10-5 Causes of aortic regurgitation.

Pathophysiology
Aortic regurgitation places a volume load on the left ventricle, because during diastole blood enters the ventricle both from the left atrium and from the aorta. If the regurgitation develops slowly, the heart responds to the increased diastolic pressure by fiber elongation and replication of sarcomeres in series, which leads to increased ventricular volumes. Because systolic pressure remains relatively unchanged, increased wall stress—by Laplace law—can be compensated for by an additional increase in wall thickness. This response, “eccentric hypertrophy”—so named because the ventricular cavity enlarges laterally in the chest and becomes eccentric to its normal position—explains the different ventricular geometry observed in patients with aortic regurgitation versus those with aortic stenosis (concentric hypertrophy caused by the systolic pressure overload). Ultimately, chronic aortic regurgitation leads to huge ventricular volumes as demonstrated in the pressure-volume loops (Figure 10-24). The left ventricle operates as a low-compliance pump, handling large end-diastolic and stroke volumes, often with little increase in end-diastolic pressure. In addition, no truly isovolumic period of relaxation or contraction exists because of the persistent flow into the ventricle from the systemic circulation. Aortic pulse pressure is widened. Diastolic pressure decreases because of regurgitant flow back into the left ventricle and increased compliance of the large central vessels (in response to increased stroke volume); elevated stroke volume leads to increased systolic pressures (Figure 10-24C).

Figure 10-24 Aortic insufficiency (regurgitation). A: Drawing of the left heart in left anterior oblique view showing anatomic features of aortic insufficiency. Note structures enlarged: left ventricle, aorta. B:Drawing showing auscultatory and hemodynamic features of predominant aortic insufficiency. Cardinal features include large hypertrophied left ventricle; large aorta; increased stroke volume; wide pulse pressure; diastolic murmur. (SM, systolic murmur; A, aortic valve; P, pulmonary valve; DM, diastolic murmur.) (Redrawn, with permission, from Cheitlin MD et al, eds. Clinical Cardiology, 6th ed. Originally published by Appleton & Lange. Copyright © 1993 by The McGraw-Hill Companies, Inc.) C: Pressure-volume loop in chronic aortic insufficiency. Marked enlargement in left ventricular volume shifts the diastolic pressure-volume curve rightward. Hypertrophy of the ventricle shifts the isovolumic pressure-volume curve leftward (not shown), but ultimately the ventricle dilates and contractility decreases and the isovolemic pressure-volume curve shifts to the right. Stroke volume is enormous, although effective stroke volume may be minimally changed because much of the increase in stroke volume leaks back into the ventricle. Because the ventricle is constantly being filled from the mitral valve or the incompetent aortic valve, no isovolumic periods exist.
Clinical Manifestations
A. Shortness of Breath—Pulmonary edema can develop, particularly if the aortic regurgitation is acute and the ventricle does not have time to compensate for the sudden increase in volume. In chronic aortic regurgitation, compensatory mechanisms eventually fail and the heart begins to operate on the steeper portion of the diastolic pressure-volume relationship.
B. Physical Examination
1. Hyperdynamic pulses—In chronic aortic regurgitation, a widened pulse pressure is responsible for several characteristic peripheral signs. Palpation of the peripheral pulse reveals a sudden rise and then drop in pressure (water-hammer or Corrigan pulse). Head bobbing (DeMusset sign), rhythmic pulsation of the uvula (Müller sign), and arterial pulsation seen in the nail bed (Quincke pulse) have been described in patients with chronic aortic regurgitation.
2. Murmurs—Three heart murmurs can be heard in patients with aortic regurgitation: First, flow from the regurgitant volume back into the left ventricle can be heard as a high-pitched, blowing, early diastolic murmur usually perceived best along the left sternal border. Second, the rumbling murmur described by Austin Flint can be heard at the apex during any part of diastole. The Austin Flint murmur is thought to result from regurgitant flow from the aortic valve impinging on the anterior leaflet of the mitral valve, producing functional mitral stenosis. Finally, a crescendo-decrescendo systolic murmur, which is thought to arise from the increased stroke volume flowing across the aortic valve, can be heard at the left sternal border.
In acute, severe aortic regurgitation, the early diastolic murmur may be softer because of rapid diastolic equalization of ventricular and aortic pressures. The first heart sound is soft because of early mitral valve closure from aortic regurgitation and elevated ventricular pressures.
3. Third heart sound—A third heart sound can be heard because of concomitant heart failure or because of the exaggerated early diastolic filling of the left ventricle.
4. Apical impulse—The apical impulse is displaced laterally because of the increased volume of the left ventricle.
3. Mitral Stenosis
Clinical Presentation
The symptoms of mitral stenosis include dyspnea, fatigue, and hemoptysis. Occasionally, the patient complains of palpitations or a rapid heartbeat. Finally, the patient with mitral stenosis may present with neurologic symptoms such as transient numbness or weakness of the extremities, sudden loss of vision, or difficulty with coordination.
The characteristic murmur of mitral stenosis is a late low-pitched diastolic rumble. In addition, an opening snap may be heard in the first portion of diastole (Figure 10-25). Auscultation of the lungs may reveal rales.

FIGURE 10-25 Mitral stenosis. A: Drawing of the left heart in left anterior oblique view showing anatomic features of mitral stenosis. Note enlarged left atrium, small left ventricle. B: Drawing showing auscultatory and hemodynamic features of mitral stenosis. Cardinal features include thickening and fusion of mitral valve cusps, elevated left atrial pressure, left atrial enlargement, opening snap, diastolic murmur. (PSM, presystolic murmur; OS, opening snap; M, mitral; T, tricuspid; A, aortic; P, pulmonary; DM, diastolic murmur.) (Redrawn, with permission, from Netter FH. Heart, vol 5: CIBA Collection of Medical Illustrations, CIBA Pharmaceutical Co., 1969.) C:Pressure-volume loop in mitral stenosis. Filling of the left ventricle is restricted from a to a′, decreasing stroke volume to b′c′.
Etiology
Mitral stenosis is most commonly a sequela of rheumatic heart disease (Table 10-6). Infrequently, it may be caused by congenital lesions or calcium deposition. Atrial masses (myxomas) can cause intermittent obstruction of the mitral valve.
TABLE 10-6 Causes of mitral stenosis.

Pathophysiology
The mitral valve is normally bicuspid, with the anterior cusp approximately twice the area of the posterior cusp. The mitral valve area is usually 5–6 cm2; clinically relevant mitral stenosis usually occurs when the valve area decreases to less than 1 cm2. Because obstruction of flow protects the ventricle from pressure and volume loads, the left ventricular pressure-volume relationship shows relatively little abnormality other than decreased volumes. However, analysis of hemodynamic tracings shows the characteristic elevation in left atrial pressures (Figure 10-25B). For this reason, the main pathophysiologic abnormality in mitral stenosis is elevated pulmonary venous pressure and elevated right-sided pressures (pulmonary artery, right ventricle, and right atrium). Dilation and reduced systolic function of the right ventricle are commonly observed in patients with advanced mitral stenosis.
Clinical Manifestations
A. Symptoms
1. Shortness of breath, hemoptysis, and orthopnea—All of these symptoms occur because of elevated left atrial, pulmonary venous, and pulmonary capillary pressures (the actual mechanisms are described in the section on heart failure).
2. Palpitations—Increased left atrial size predisposes patients with mitral stenosis to atrial arrhythmias. Chaotic atrial activity (ie, atrial fibrillation) is commonly observed. Because ventricular filling is particularly dependent on atrial contraction in patients with mitral stenosis, acute hemodynamic decompensation may occur when organized contraction of the atrium is lost.
3. Neurologic symptoms—Reduced outflow leads to dilation of the left atrium and stasis of blood flow. Thrombus in the left atrium is observed on echocardiography in approximately 20% of patients with mitral stenosis, and the prevalence increases with age, presence of atrial fibrillation, severity of stenosis, and any reduction in cardiac output. Embolic events that lead to neurologic symptoms occur in 8% of patients in sinus rhythm and in 32% of patients with chronic or paroxysmal atrial fibrillation. In addition, left atrial enlargement can sometimes impinge on the recurrent laryngeal nerve and lead to hoarseness (Ortner syndrome).
B. Physical Examination—On auscultation of the heart, the diastolic rumble occurs because of turbulent flow across the narrowed mitral valve orifice. An opening snap, analogous to the ejection click described for aortic stenosis, may be heard in early diastole. The opening snap is heard only when the patient has relatively mobile leaflets.
Rales occur because elevated pulmonary capillary pressures lead to accumulation of intra-alveolar fluid.
4. Mitral Regurgitation
Clinical Presentation
The presentation of mitral regurgitation depends on how quickly valvular incompetence develops. Patients with chronic mitral regurgitation develop symptoms gradually over time. Common complaints include dyspnea, easy fatigability, and palpitations. Patients with acute mitral regurgitation present with symptoms of left heart failure: shortness of breath, orthopnea, and shock. Chest pain may be present in patients whose mitral regurgitation is due to coronary artery disease.
On physical examination, patients have a pansystolic regurgitant murmur that is heard best at the apex and often radiates to the axilla. This murmur often obscures the first and second heart sounds. When mitral valve incompetence is severe, a third heart sound is often present. In chronic mitral regurgitation, the apical impulse is often hyperdynamic and displaced laterally.
Etiology
In the past, rheumatic heart disease accounted for most cases of mitral regurgitation. Mitral valve prolapse is now probably the most common cause, followed by coronary artery disease. The tips of the anterior and posterior mitral valve leaflets are held in place during ventricular contraction by the anterolateral and posteromedial papillary muscles. The valves are connected to the papillary muscles via thin fibrous structures called chordae tendineae. In patients with mitral valve prolapse, extra tissue present on the valvular apparatus can undergo myxomatous degeneration by the fifth or sixth decade. Mitral regurgitation follows as a result of either poor coaptation of the valve leaflets or sudden rupture of the chordae tendineae. In coronary artery disease, obstruction of the circumflex coronary artery can lead to ischemia or rupture of the papillary muscles (Table 10-7).
TABLE 10-7 Causes of mitral regurgitation.

Pathophysiology
When the mitral valve fails to close properly, regurgitation of blood into the left atrium from the ventricle occurs during systole. In chronic mitral regurgitation, the compensatory mechanism to this volume load is similar to the changes seen in aortic regurgitation. The left ventricle and atrium dilate, and to normalize wall stress in the ventricle there is also concomitant hypertrophy of the ventricular wall (see prior discussion of Laplace law). Diastolic filling of the ventricle increases because it is now the sum of right ventricular output and the regurgitant volume from the previous beat. In acute mitral regurgitation, the sudden volume load on the atrium and ventricle is not compensated for by chamber enlargement and hypertrophy. The sudden increase in atrial volume leads to prominent atrial v waves with transmission of this elevated pressure to the pulmonary capillaries and the development of pulmonary edema (Figure 10-26).

FIGURE 10-26 Mitral insufficiency (regurgitation). A: Drawing of the left heart in left lateral view showing anatomic features of mitral insufficiency. Note structures enlarged: left atrium, left ventricle. B:Drawing showing auscultatory and hemodynamic features of mitral insufficiency. Cardinal features include systolic backflow into left atrium, left atrial enlargement, left ventricular enlargement (hypertrophy in acute lesions), prominent v wave caused by filling from both the pulmonary veins and the regurgitant jet, and holosystolic murmur. (3, third heart sound; SM, systolic murmur; A, aortic; P, pulmonary.) (Redrawn, with permission, from Cheitlin MD et al, eds. Clinical Cardiology, 6th ed. Originally published by Appleton & Lange. Copyright © 1993 by The McGraw-Hill Companies, Inc.) C: Pressure-volume loop in mitral insufficiency. Increased ventricular volumes shift the diastolic pressure-volume curve rightward. Stroke volume is increased because the ventricle can now eject blood into the low-pressure left atrium. With chronic volume loads, the isovolemic pressure-volume curve eventually shifts to the right.
Clinical Manifestations
A. Symptoms
1. Pulmonary edema—Rapid elevation of pulmonary capillary pressure in acute mitral regurgitation leads to the sudden onset of pulmonary edema, manifested by shortness of breath, orthopnea, and paroxysmal nocturnal dyspnea. In chronic mitral regurgitation, the symptoms develop gradually, but at some point the compensatory mechanisms fail and pulmonary edema develops, particularly with exercise.
2. Fatigue—Fatigue can develop because of decreased forward blood flow to the peripheral tissues.
3. Palpitations—Left atrial enlargement may lead to the development of atrial fibrillation and accompanying palpitations. Patients with atrial fibrillation and mitral regurgitation have a 20% incidence of cardioembolic events.
B. Physical Examination
1. Holosystolic murmur—Regurgitant flow into the atrium produces a high-pitched murmur that is heard throughout systole. The murmur begins with the first heart sound, continues to the second heart sound, and is of constant intensity throughout systole. It finally ends when left ventricular pressure drops to equal left atrial pressure during isovolumic relaxation. Unlike with the murmur of aortic stenosis, there is little variation in the intensity of the murmur as the heart rate changes. In addition, the murmur does not change in intensity with respiration. It is usually heard best at the apex and often radiates to the axilla. If rupture of the anterior leaflet has occurred, the mitral regurgitation murmur will sometimes radiate to the back.
2. Third heart sound—A third heart sound is heard if heart failure is present. Because of increased and rapid filling of the ventricle during diastole, it may also be heard in the absence of overt failure in patients with severe mitral regurgitation.
3. Displaced and hyperdynamic apical impulse—The compensatory increase in left ventricular volume and wall thickness in patients with chronic mitral regurgitation is manifested by a laterally displaced apical impulse. Because the ventricle now has a low-pressure chamber (the left atrium) into which to eject blood, the apical impulse is often hyperdynamic. When mitral regurgitation develops suddenly, the apical impulse is not displaced or hyperdynamic, because the left ventricle has not had enough time for compensatory volume increases to occur.
CHECKPOINT
10. What are the clinical presentations of each of the four major categories of valvular heart disease?
11. What are the most common causes of each category of valvular heart disease?
12. What is the pathogenesis of each category of valvular heart disease?
13. What are the major clinical manifestations and complications of each category of valvular heart disease?
CORONARY ARTERY DISEASE
Clinical Presentation
Chest pain is the most common symptom associated with coronary artery disease. It is usually described as dull and can often radiate down the arm or to the jaw. It does not worsen with a deep breath and can be associated with shortness of breath, diaphoresis, nausea, and vomiting. This entire symptom complex has been termed angina pectoris, or “pain in the chest”; this phrase was first used by Heberden in 1744.
Clinically, angina is classified according to the precipitant and the duration of symptoms. If the pain occurs only with exertion and has been stable over a long period of time, it is termed stable angina. If the pain occurs at rest, it is termed unstable angina. Finally, regardless of the precipitant, if the chest pain persists without interruption for prolonged periods and irreversible myocyte damage has occurred, it is termed myocardial infarction.
On physical examination, the patient with coronary artery disease may have a fourth heart sound or signs of heart failure and shock. However, more than any other cardiovascular problem, the initial diagnosis relies on patient history.
Etiology
Atherosclerotic obstruction of the large epicardial vessels is by far the most common cause of coronary artery disease. Spasm of the coronary arteries from various mediators such as serotonin and histamine has been well described and is more common in Japanese individuals. Rarely, congenital abnormalities can cause coronary artery diseases (Table 10-8).
TABLE 10-8 Causes of coronary artery disease.

Pathophysiology
Coronary blood flow brings oxygen to myocytes and removes waste products such as carbon dioxide, lactic acid, and hydrogen ions. The heart has a tremendously high metabolic requirement; although it accounts for only 0.3% of body weight, it is responsible for 7% of the body’s resting oxygen consumption. Cellular ischemia occurs when there is either increased demand for oxygen relative to maximal arterial supply or an absolute reduction in oxygen supply. Although situations of increased demand such as thyrotoxicosis and aortic stenosis can cause myocardial ischemia, most clinical cases are due to decreased oxygen supply. Reduced oxygen supply can rarely arise from decreased oxygen content in blood—such as occurs in carbon monoxide poisoning or anemia—but more commonly stems from coronary artery abnormalities (Table 10-8), particularly atherosclerotic disease. Myocardial ischemia may arise from a combination of increased demand and decreased supply; cocaine abuse increases oxygen demand (by inhibiting reuptake of norepinephrine at adrenergic nerve endings in the heart) and can reduce oxygen supply by causing vasospasm.
Atherosclerosis of large coronary arteries remains the predominant cause of angina and myocardial infarction. Raised fatty streaks, which appear as yellow spots or streaks in the vessel walls, are seen in coronary arteries in almost all members of any population by 20 years of age (see Chapter 11). They are found mainly in areas exposed to increased shear stresses such as bending points and bifurcations and are thought to arise from isolated macrophage foam cell migration into areas of minimal chronic intimal injury. In many people this process progresses, with additional migration of foam cells, smooth muscle cell proliferation, and extracellular fat and collagen deposition (Figure 10-27). The extent and incidence of these advanced lesions vary among persons in different geographic regions and ethnic groups.

FIGURE 10-27 Mechanisms of production of atheroma. A: Structure of normal muscular artery. The adventitia, or outermost layer of the artery, consists principally of recognizable fibroblasts intermixed with smooth muscle cells loosely arranged between bundles of collagen and surrounded by proteoglycans. It is usually separated from the media by a discontinuous sheet of elastic tissue, the external elastic lamina. B: Platelet aggregates, or microthrombi, form as a result of adherence of the platelets to the exposed subendothelial connective tissue. Platelets that adhere to the connective tissue release granules whose constituents may gain entry into the arterial wall. Platelet factors thus interact with plasma constituents in the artery wall and may stimulate events shown in the next illustration. C: Smooth muscle cells migrate from the media into the intima through fenestrae in the internal elastic lamina and actively multiply within the intima. Endothelial cells regenerate in an attempt to re-cover the exposed intima, which thickens rapidly owing to smooth muscle proliferation and formation of new connective tissue. (Redrawn, with permission, from Ross R et al. The pathogenesis of atherosclerosis. [Part 1.] N Engl J Med. 1976;295:369.)
The underlying pathophysiologic processes differ for each clinical presentation of coronary artery disease. In patients with stable angina, fixed narrowing of one or several coronary arteries is usually present. Because the large coronary arteries usually function as conduits and do not offer resistance to flow, the arterial lumen must be decreased by 90% to produce cellular ischemia when the patient is at rest. However, with exercise, a 50% reduction in lumen size can lead to symptoms. In patients with unstable angina, fissuring of the atherosclerotic plaque can lead to platelet accumulation and transient episodes of thrombotic occlusion, usually lasting 10–20 minutes. In addition, platelet release of vasoconstrictive factors such as thromboxane A2 or serotonin and endothelial dysfunction may cause vasoconstriction and contribute to decreased flow. In myocardial infarction, deep arterial injury from plaque rupture may cause formation of a relatively fixed and persistent thrombus. Recent research has emphasized that plaque composition mediated by inflammation has an important role in clinical presentation. Loss of the extracellular matrix and cellular necrosis due to the inflammatory response appear to be the key mediators for plaque rupture.
The heart receives its energy primarily from ATP generated by oxidative phosphorylation of free fatty acids, although glucose and other carbohydrates can be utilized. Within 60 seconds after coronary artery occlusion, myocardial oxygen tension in the affected cells falls essentially to zero. Cardiac stores of high-energy phosphates are rapidly depleted, and the cells shift rapidly to anaerobic metabolism with consequent lactic acid production. Dysfunction of myocardial relaxation and contraction occurs within seconds, even before depletion of high-energy phosphates occurs. The biochemical basis for this abnormality is not known. If perfusion is not restored within 40–60 minutes, an irreversible stage of injury characterized by diffuse mitochondrial swelling, damage to the cell membrane, and marked depletion of glycogen begins. The exact mechanism by which irreversible damage occurs is not clear, but severe ATP depletion, increased extracellular calcium concentrations, lactic acidosis, and free radicals have all been postulated as possible causes.
In experimental preparations, if ischemic myocardium is perfused within 5 minutes, systolic function returns promptly, whereas diastolic abnormalities may take up to 40 minutes to normalize. With prolonged episodes of ischemia—up to 1 hour—it may take up to 1 month to restore ventricular function. When the heart demonstrates this prolonged period of decreased function despite normal perfusion, the myocardium is said to be “stunned.” The biochemical basis for stunning is poorly understood. If reperfusion occurs later or not at all, systolic function often will not return to the affected area.
Clinical Manifestations
A. Chest Pain
Chest pain has traditionally been ascribed to ischemia. However, more recent evidence suggests that, in patients with coronary artery disease, 70–80% of episodes of ischemia are actually asymptomatic. When present, the chest pain is thought to be mediated by sympathetic afferent fibers that richly innervate the atrium and ventricle. From the heart, the fibers traverse the upper thoracic sympathetic ganglia and the five upper thoracic dorsal roots of the spinal cord. In the spinal cord, the impulses probably converge with impulses from other structures. This convergence is probably the mechanism for the chest wall, back, and arm pain that sometimes accompanies angina pectoris. The importance of these fibers can be demonstrated in patients who have had a heart transplant. When these patients develop atherosclerosis, they remain completely asymptomatic, without development of angina.
Evidence suggests that the actual trigger for nerve stimulation is adenosine. Adenosine infusion into the coronary arteries can produce the characteristic symptoms of angina without evidence of ischemia. In addition, blocking the adenosine receptor (P1) with aminophylline leads to reduced anginal symptoms despite similar degrees of ischemia.
Three factors probably account for the large proportion of asymptomatic episodes: dysfunction of afferent nerves, transient reduced perfusion, and differing pain thresholds among patients. Dysfunction of afferent nerves may cause silent ischemia. Patients with transplanted hearts do not sense cardiac pain despite significant atherosclerosis. Peripheral neuropathy in patients with diabetes may explain the increased episodes of silent ischemia described in this patient population. Transient reduced perfusion may also be an important mechanism for silent ischemia. Within a few seconds after cessation of perfusion, systolic and diastolic abnormalities can be observed. Angina is a relatively late event, occurring after at least 30 seconds of ischemia. Finally, differing pain thresholds between patients may explain the high prevalence of silent ischemia. The presence of angina is moderately correlated with a decreased pain tolerance. The mechanism for different pain thresholds is unknown but may be due to differences in plasma endorphins.
B. Fourth Heart Sound and Shortness of Breath
Both of these findings may occur because of diastolic and systolic dysfunction of the ischemic myocardium. (See prior discussion of heart failure.)
C. Shock
The site of coronary artery occlusion determines the clinical presentation of myocardial ischemia or infarction. As a general rule, the more myocardium that is supplied by the occluded vessel, the more significant and severe are the symptoms. For example, obstruction of the left main coronary artery or the proximal left anterior descending coronary artery will usually present as severe cardiac failure, often with associated hypotension (shock). In addition, shock may be associated with coronary artery disease in several special situations. If necrosis of the septum occurs from left anterior descending artery occlusion, myocardial rupture with the formation of an interventricular septal defect can occur. Rupture of the anterior or lateral free walls from occlusion of the left anterior descending or circumflex coronary arteries, respectively, can lead to the formation of pericardial effusion and tamponade. Rupture of myocardial tissue usually occurs 4–7 days after the acute ischemic event, when the myocardial wall has thinned and is in the process of healing. Sudden hemodynamic decompensation during this period should arouse suspicion of these complications. Finally, circumflex artery occlusion may result in ischemia and dysfunction or overt rupture of the papillary muscles, which can produce severe mitral regurgitation and shock.
D. Bradycardia
Inferior wall myocardial infarctions usually arise from occlusion of the right coronary artery. Because the area of left ventricular tissue supplied by this artery is small, patients usually do not present with heart failure. However, the artery that provides blood supply to the AV node branches off the posterior descending artery, so that inferior wall myocardial infarctions are sometimes associated with slowed or absent conduction in the AV node. Besides ischemia, AV nodal conduction abnormalities can occur because of reflex activation of the vagus nerve, which richly innervates the AV node.
Dysfunction of the sinus node is rarely seen in coronary artery disease, because this area receives blood from both the right and the left coronary arteries.
E. Nausea and Vomiting
Nausea and vomiting may arise from activation of the vagus nerve in the setting of an inferior wall myocardial infarction.
F. Tachycardia
Levels of catecholamines are usually raised in patients with myocardial infarction. This helps to maintain stroke volume but leads to an increased heart rate.
CHECKPOINT
14. What is the clinical presentation of coronary artery disease along the continuum from stable angina to unstable angina to myocardial infarction?
15. What are the most common causes of coronary artery disease?
16. How do the pathophysiologies of stable angina, unstable angina, and myocardial infarction differ?
17. What are the major clinical manifestations and complications of coronary artery disease?
PERICARDIAL DISEASE
Pericardial disease may include inflammation of the pericardium (pericarditis) or abnormal amounts of fluid in the space between the visceral and parietal pericardium (pericardial effusion).
Pericarditis
Clinical Presentation
The patient presents with severe chest pain. Descriptions of the pain are variable, but the usual picture is of a sharp retrosternal onset with radiation to the back and worse with deep breathing or coughing. The pain is often position dependent: worse when lying flat and improved while sitting up and leaning forward.
On physical examination, the pericardial rub is pathognomonic of pericarditis. It is a high-pitched squeaking sound, often with two or more components.
Occasionally, continual inflammation of the pericardium leads to fibrosis and the development of constrictive pericarditis (Figure 10-28). Examination of the jugular venous pulsation is critical in the patient who may have constrictive pericarditis. The jugular venous pressure is elevated, and the individual waveforms are often quite prominent. In addition, there can be an inappropriate increase in the jugular venous pulsation level with inspiration (Kussmaul sign). Hepatomegaly and ascites may be noted on physical examination. On auscultation of the heart, a high-pitched sound called a pericardial knock can be heard just after the second heart sound, often mimicking a third heart sound.

FIGURE 10-28 Magnetic resonance image of cross-section of thorax showing pericardial thickening (arrows) in a patient with constrictive pericarditis. (Courtesy of C Higgins. Reproduced, with permission, from Cheitlin MD et al, eds. Clinical Cardiology, 6th ed. Originally published by Appleton & Lange. Copyright © 1993 by The McGraw-Hill Companies, Inc.)
Etiology
Table 10–9 lists the causes of acute pericarditis. Viruses, particularly the coxsackieviruses, are the most common cause of acute pericarditis. Viruses are also probably responsible for “idiopathic” pericarditis.
TABLE 10-9 Causes of pericarditis.

Pathophysiology
In pericarditis, microscopic examination of pericardial specimens obtained at surgery (eg, stripping or window) or autopsy shows signs of acute inflammation, with increased numbers of polymorphonuclear leukocytes, increased vascularity, and deposition of fibrin. If the inflammation is of long duration, the pericardium can become fibrotic and scarred, with deposition of calcium.
The heavily fibrotic pericardium can inhibit the filling of the ventricles. At this point, signs of constrictive pericarditis appear (see following discussion).
Clinical Manifestations
A. Chest Pain—Chest pain is probably due to inflammation of the pericardium. Inflammation of adjacent pleura may account for the characteristic worsening of pain with deep breathing and coughing.
B. Physical Examination
1. Friction rub—The pericardial friction rub is thought to arise from friction between the visceral and parietal pericardial surfaces. The rub is traditionally described as having three components, each associated with rapid movement of a cardiac chamber: The systolic component, which is probably related to ventricular contraction, is most common and most easily heard. During diastole, there are two components: one during early diastole, resulting from rapid filling of the ventricle, and another quieter component that occurs in late diastole, thought to be due to atrial contraction. The diastolic components often merge so that a two-component or “to-and-fro” rub is most commonly heard.
2. Signs of constriction—In the patient with constrictive pericarditis, early diastolic filling of the ventricle occurs normally, but the filling is suddenly stopped by the nonelastic thickened pericardium. This cessation of filling can be observed on the pressure-time curve of the ventricle and is probably responsible for the diastolic knock (Figure 10-29). In addition, the rapid emptying of the atrium leads to a prominent y descent that makes the v wave more noticeable on the atrial pressure tracing (Figure 10-30). Systemic venous pressure is elevated, because flow entering the heart is limited. Usually with inspiration, the decrease in intrathoracic pressure is transmitted to the heart, and filling of the right side of the heart increases with an accompanying fall in systemic venous pressure. In patients with constrictive pericarditis, this normal response is prevented and the patient develops Kussmaul sign (Figure 10-31). Elevated systemic venous pressure can cause accumulation of fluid in the liver and intraperitoneal space, leading to hepatomegaly and ascites.

FIGURE 10-29 Phonocardiogram of typical sharp, early diastolic pericardial knock (K). (Reproduced, with permission, from Cheitlin MD et al, eds. Clinical Cardiology, 6th ed. Originally published by Appleton & Lange. Copyright © 1993 by The McGraw-Hill Companies, Inc.)

FIGURE 10-30 Jugular venous pressure waveforms in various kinds of heart disease. In right ventricular failure, mean jugular venous pressure is elevated, but the waveforms remain relatively unchanged. If right ventricular failure is accompanied by tricuspid regurgitation, the v wave may become more prominent (because the right atrium is receiving blood from both systemic venous return and the right ventricle). In constrictive pericarditis, the y descent becomes prominent because the right ventricle rapidly fills in early diastole. In contrast, in pericardial tamponade, the right ventricle only fills during early systole, so that only an x descent is observed. In both constrictive pericarditis and pericardial tamponade, mean jugular venous pressure is elevated.

FIGURE 10-31 Brachial arterial and right atrial pressures showing pulsus paradoxus in a patient with constrictive pericarditis and an increase in right atrial pressure on inspiration (Kussmaul sign). Both the systolic and diastolic atrial pressures rise with inspiration. (Redrawn, with permission, from Cheitlin MD et al, eds. Clinical Cardiology, 6th ed. Originally published by Appleton & Lange. Copyright © 1993 by The McGraw-Hill Companies, Inc.)
PERICARDIAL EFFUSION & TAMPONADE
Clinical Presentation
Pericardial effusion may occur in response to any cause of pericarditis, so the patient may develop chest pain or pericardial rub as described previously. In addition, pericardial effusion may develop slowly and may be asymptomatic. However, sudden filling of the pericardial space with fluid can have catastrophic consequences by limiting ventricular filling (pericardial tamponade). Patients with pericardial tamponade often complain of shortness of breath, but the diagnosis is most commonly made by noting the characteristic physical examination findings associated with pericardial tamponade.
Pericardial tamponade is accompanied by characteristic physical signs that arise from the limited filling of the ventricle. The three classic signs of pericardial tamponade are called Beck triad after the surgeon who described them in 1935: (1) hypotension, (2) elevated jugular venous pressure, and (3) muffled heart sounds. In addition, the patient may have a decrease in systemic pressure with inspiration (paradoxic pulse).
Etiology
Almost any cause of pericarditis can cause pericardial effusion.
Pathophysiology
The pericardium is normally filled with a small amount of fluid (30–50 mL) with an intrapericardial pressure that is usually about the same as the intrapleural pressure. With the sudden addition of fluid, the pericardial pressure can increase, at times to the level of the right atrial and right ventricular pressures. The transmural distending pressure of the ventricle decreases and the chamber collapses, preventing appropriate filling of the heart from systemic venous return. The four chambers of the heart occupy a relatively fixed volume in the pericardial sac, and evaluation of hemodynamics reveals equilibration of ventricular and pulmonary artery diastolic pressures with right atrial and left atrial pressures, all at approximately intrapericardial pressure.
Clinical Manifestations
Because the clinical manifestations of pericardial effusion without tamponade are similar to those of pericarditis, they are not described here. Instead, the pathophysiologic mechanisms for the symptoms and signs of pericardial tamponade are described.
A. Shortness of Breath—Dyspnea is the most common symptom of pericardial tamponade. The pathogenesis probably relates to a reduction in cardiac output and, in some patients, the presence of pulmonary edema.
B. Elevated Jugular Venous Pressure—Jugular venous pressure (Figure 10-30). In addition, cardiac tamponade alters the dynamics of atrial filling. Normally, atrial filling occurs first during ventricular ejection (y descent) and then later when the tricuspid valve opens (x descent). In cardiac tamponade, the atrium can fill during ventricular contraction so that the x descent can still be seen. However, when the tricuspid valve opens, further filling of the right atrium is prevented because chamber size is limited by the surrounding pericardial fluid. For this reason, the y descent is not seen in the patient with pericardial tamponade. Loss of the y descent in the setting of elevated jugular venous pressures should always arouse suspicion of pericardial tamponade.
C. Hypotension—Hypotension occurs because of reduced cardiac output.
D. Paradoxic Pulse—Arterial systolic blood pressure normally drops 10–12 mm Hg with inspiration. Marked inspiratory drop in systolic blood pressure (>20 mm Hg) is an important physical finding in the diagnosis of cardiac tamponade but can also be seen in severe pulmonary disease and, less commonly, in constrictive pericarditis (Figure 10-31). Marked inspiratory decline in left ventricular stroke volume occurs because of decreased left ventricular end-diastolic volume. With inspiration, increased blood return augments filling of the right ventricle, which causes the interventricular septum to bow to the left and reduce left ventricular end-diastolic volume (reverse Bernheim effect). Also during inspiration, flow into the left atrium from the pulmonary veins is reduced, further reducing left ventricular preload.
E. Muffled Heart Sounds—Pericardial fluid can cause the heart sounds to become muffled or indistinct.
CHECKPOINT
18. What are the clinical presentations of each form of pericardial disease discussed previously?
19. What are the most common causes of pericarditis and pericardial effusion?
20. What are the major clinical manifestations and complications of pericarditis and pericardial effusion with tamponade?
CASE STUDIES
Yeong Kwok, MD
(See Chapter 25, p. 718 for Answers)
CASE 49
A 25-year-old man presents to the hospital with lightheadedness and palpitations for the past 2 hours. He had four or five previous episodes of palpitations in the past, but they had lasted only a few minutes and went away on their own. These episodes were not associated with any specific activity or diet. He denies any chest pain. On physical examination, he is noted to be tachycardic with a heart rate of 180 bpm and a blood pressure of 105/70 mm Hg. An ECG shows a narrow complex tachycardia at 180 bpm. The tachycardia terminates suddenly, and the patient’s heart rate drops to 90 bpm. A repeat ECG shows sinus rhythm with a short PR interval and a wide QRS with a slurred upstroke (delta wave). The patient is diagnosed as having the Wolff-Parkinson-White syndrome.
Questions
A. What is the significance of the delta wave on this patient’s ECG?
B. How are reentrant tachycardias initiated in this condition?
C. What are two other mechanisms that give rise to tachycardias?
CASE 50
A 66-year-old woman presents to the clinic with shortness of breath, leg swelling, and fatigue. She has a long history of type 2 diabetes and hypertension but until recently had been able to go for daily walks with her friends. In the past month, the walks have become more difficult due to shortness of breath and fatigue. She also sometimes awakens in the middle of the night due to shortness of breath and has to prop herself up on three pillows. On physical examination, she is noted to be tachycardic with a heart rate of 110 bpm and a blood pressure of 105/70 mm Hg. Her lung exam is notable for fine crackles on inspiration at both bases. Her cardiac exam is notable for the presence of a third and fourth heart sound and jugular venous distension. She has 2+ pitting edema to the knees bilaterally. An ECG shows sinus rhythm at 110 bpm with Q waves in the anterior leads. An echocardiogram shows decreased wall motion of the anterior wall of the heart and an estimated ejection fraction of 25%. She is diagnosed with systolic heart failure, likely secondary to a silent myocardial infarction.
Questions
A. What are the four broad mechanisms that can lead to heart failure? Which of these are at work in this case?
B. What are the differences between systolic and diastolic dysfunction?
C. What are the causes of her shortness of breath, awakening in the middle of the night, and her need to prop herself up on three pillows?
CASE 51
A 59-year-old man is brought to the emergency department by ambulance after experiencing a syncopal episode. He states that he was running in the park when he suddenly lost consciousness. He denies any symptoms preceding the event, and he had no deficits or symptoms upon arousing. On review of systems, he does say that he has had substernal chest pressure associated with exercise for the past several weeks. Each episode was relieved with rest. He denies shortness of breath, dyspnea on exertion, orthopnea, and paroxysmal nocturnal dyspnea. His medical history is notable for multiple episodes of pharyngitis as a child. He is otherwise well. He has no significant family history. He was born in Mexico and moved to the United States at age 10 years. He does not smoke, drink alcohol, or use drugs. On examination, his blood pressure is 110/90 mm Hg, heart rate 95 bpm, respiratory rate 15/min, and oxygen saturation 98%. Neck examination reveals both pulsus parvus and pulsus tardus. Cardiac examination reveals a laterally displaced and sustained apical impulse. He has a grade 3/6 midsystolic murmur, loudest at the base of the heart, radiating to the neck, and a grade 1/6 high-pitched, blowing, early diastolic murmur along the left sternal border. An S4 is audible. Lungs are clear to auscultation. Abdominal examination is benign. He has no lower extremity edema. Aortic stenosis is suspected.
Questions
A. What are the most common causes of aortic stenosis? Which is most likely in this patient? Why?
B. How does aortic stenosis cause syncope?
C. What is the pathophysiologic mechanism by which aortic stenosis causes angina pectoris?
D. How does aortic stenosis result in the physical findings described previously?
E. Based on the way this patient presented, what is his life expectancy if left untreated?
CASE 52
A 64-year-old man presents to the clinic with a 3-month history of worsening shortness of breath. He finds that he becomes short of breath after walking one block or one flight of stairs. He awakens at night, gasping for breath and has to prop himself up with pillows in order to sleep. On physical examination, his blood pressure is 190/60 mm Hg and his pulses are hyperdynamic. His apical impulse is displaced to the left and downward. On physical examination, there are rales over both lower lung fields. On cardiac examination, there are three distinct murmurs: a high-pitched, early diastolic murmur loudest at the left lower sternal border, a diastolic rumble heard at the apex, and a crescendo-decrescendo systolic murmur heard at the left upper sternal border. Chest x-ray film shows cardiomegaly and pulmonary edema, and an echocardiogram shows severe aortic regurgitation with a dilated and hypertrophied left ventricle.
Questions
A. What accounts for the dilation and hypertrophy of the left ventricle in aortic regurgitation?
B. What is the pathophysiology of the wide pulse pressure (difference between the systolic and diastolic blood pressure) and the hyperdynamic pulses?
C. What explains the murmurs heard in this patient?
D. What are the underlying mechanisms responsible for the patient’s shortness of breath with exertion and at night?
CASE 53
A 45-year-old man presents with a history of shortness of breath, irregular heartbeat, and hemoptysis. He notes that over the past 2 weeks, he has become easily “winded” with minor activities. Also, he has coughed up some flecks of blood on a few occasions. He has noted a fast heartbeat and, on occasion, a pounding sensation in his chest. He gives a history of being ill for several weeks after a severe sore throat in childhood. On physical examination, his pulse rate is noted to be 120–130 bpm and his rhythm, irregularly irregular. He has distended jugular venous pulses and rales at the bases of both lung fields. On cardiac examination, there is an irregular heartbeat as well as a soft diastolic decrescendo murmur, loudest at the apex. An ECG shows atrial fibrillation as well as evidence of left atrial enlargement.
Questions
A. What is the likely diagnosis in this patient, and what are the elements in the history, physical examination, and ECG that support the diagnosis?
B. What is the main pathophysiologic mechanism in this condition, and how does it explain the irregular heartbeat, shortness of breath, and hemoptysis?
C. What neurological complication can this patient develop?
CASE 54
A 59-year-old man presents to the emergency department with a 4-hour history of “crushing” chest pain. His cardiac examination is normal with no murmurs and normal heart sounds. An ECG reveals ST segment elevation in the lateral precordial leads and cardiac enzymes show evidence of myocardial injury. He undergoes emergent cardiac catheterization that shows a thrombus in the left circumflex artery. He undergoes successful angioplasty, and a stent is placed. He is monitored in the cardiac intensive care unit. He does well until the next day, when he develops sudden shortness of breath and decreasing oxygen saturations. Physical examination now reveals jugular venous distention, rales at both lung bases, and a blowing holosystolic murmur loudest at the apex, radiating into the axilla.
Questions
A. What likely accounts for this patient’s sudden decompensation?
B. What is the main pathophysiologic derangement in this condition?
C. What changes in the heart take place if this condition develops slowly rather than suddenly?
CASE 55
A 55-year-old man presents to the clinic with complaints of chest pain. He states that for the past 5 months he has noted intermittent substernal chest pressure radiating to the left arm. The pain occurs primarily when exercising vigorously and is relieved with rest. He denies associated shortness of breath, nausea, vomiting, or diaphoresis. He has a medical history significant for hypertension and hyperlipidemia. He is taking atenolol for his high blood pressure and is eating a low-cholesterol diet. His family history is notable for a father who died of myocardial infarction at age 56 years. He has a 50-pack-year smoking history and is currently trying to quit. His physical examination is within normal limits with the exception of his blood pressure, which is 145/95 mm Hg, with a heart rate of 75 bpm.
Questions
A. What is the likely diagnosis? How would you classify his diagnosis clinically?
B. What are the most common causes of this disease? Which is the most likely in this patient?
C. What are this patient’s risk factors for coronary artery disease?
D. What is the hypothesized mechanism by which atherosclerotic plaques form?
E. What is the pathogenetic mechanism by which plaque formation results in the symptoms just mentioned?
CASE 56
A 35-year-old man presents to the emergency department with complaints of chest pain. The pain is described as 8 on a scale ranging from 1 to 10, retrosternal, and sharp in nature. It radiates to the back, is worse with taking a deep breath, and is improved by leaning forward. On review of systems, he has noted a “flu-like illness” over the past several days, including fever, rhinorrhea, and cough. He has no medical history and is taking no medications. He denies tobacco, alcohol, or drug use. On physical examination, he appears in moderate distress from pain, with a blood pressure of 125/85 mm Hg, heart rate 105 bpm, respiratory rate 18/min, and oxygen saturation of 98% on room air. He is currently afebrile. His head and neck examination is notable for clear mucus in the nasal passages and a mildly erythematous oropharynx. The neck is supple, with shotty anterior cervical lymphadenopathy. The chest is clear to auscultation. Jugular veins are not distended. Cardiac examination is tachycardic with a three-component high-pitched squeaking sound. Abdominal and extremity examinations are normal.
Questions
A. What is the likely diagnosis?
B. What are the most common causes of this disease, and which is most likely in this patient?
C. What is the pathophysiologic mechanism for his chest pain?
D. What is the sound heard on cardiac examination? What is its cause?
E. What are two possible complications of this disease? What might you look for on physical examination to make certain that these complications are not present?
CASE 57
A 65-year-old woman is hospitalized with a large anterior myocardial infarction. After 4 days in the hospital, she is doing well and plans are being made for discharge to a rehabilitation facility to help her regain her strength and recover her cardiac function. While going to the bathroom, she passed out suddenly. On examination, her blood pressure is 60/40 mm Hg, her heart rate is 120, and she has distant heart sounds. An emergent echocardiogram shows rupture of the anterior wall and pericardial tamponade.
Questions
A. What are three classic signs of pericardial tamponade (Beck triad)?
A. What is the pathophysiology of pericardial tamponade?
A. What is the mechanism of paradoxic pulse?
REFERENCES
General
Kusumoto FM. Cardiovascular Pathophysiology. Hayes Barton Press, 2004.
Arrhythmias
Badhwar N et al. Arrhythmias in the coronary care unit. J Intensive Care Med. 2012 Sep–Oct;27(5):267–89. [PMID: 21747124]
Curtis AB et al. Arrhythmias in women. Clin Cardiol. 2012 Mar;35(3):166–71. [PMID: 22389121]
Katritsis DG et al. Nonsustained ventricular tachycardia. J Am Coll Cardiol. 2012 Nov 13;60(20):1993–2004. [PMID: 23083773]
Kumar P et al. Bradyarrhythmias in the elderly. Clin Geriatr Med. 2012 Nov;28(4):703–15. [PMID: 23101579]
Link MS. Clinical practice. Evaluation and initial treatment of supraventricular tachycardia. N Engl J Med. 2012 Oct 11;367(15):1438–48. [PMID: 23050527]
Whinnett ZI et al. Diagnosis and management of supraventricular tachycardia. BMJ. 2012 Dec 11;345:e7769. [PMID: 23233691]
Heart Failure
Campbell RT et al. What have we learned about patients with heart failure and preserved ejection fraction from DIG-PEF, CHARM-preserved, and I-PRESERVE? J Am Coll Cardiol. 2012 Dec 11;60(23):2349–56. [PMID: 23141494]
Chatterjee K. Pathophysiology of systolic and diastolic heart failure. Med Clin North Am. 2012 Sep;96(5):891–9. [PMID: 22980053]
Dell’Italia LJ. Anatomy and physiology of the right ventricle. Cardiol Clin. 2012 May;30(2):167–87. [PMID: 22548810]
Frohlich ED et al. Pressure overload. Heart Fail Clin. 2012 Jan;8(1):21–32. [PMID: 22108724]
Fukuta H et al. The cardiac cycle and a physiologic basis of left ventricular contraction, ejection, relaxation, and filling. Heart Fail Clin 2008 Jan;4(1):1–11. [PMID: 18313620]
Kemp CD et al. The pathophysiology of heart failure. Cardiovasc Pathol. 2012 Sep–Oct;21(5):365–71. [PMID: 22227365]
Koitabashi N et al. Reverse remodeling in heart failure—mechanisms and therapeutic opportunities. Nat Rev Cardiol. 2011 Dec 6;9(3):147–57. [PMID: 22143079]
Lanier GM et al. An update on diastolic dysfunction. Cardiol Rev. 2012 Sep–Oct;20(5):230–6. [PMID: 22418249]
Maron BJ et al. Hypertrophic cardiomyopathy. Lancet. 2013 Jan 19;381(9862):242–55. [PMID: 22874472]
Rathi S et al. The epidemiology and pathophysiology of heart failure. Med Clin North Am. 2012 Sep;96(5):881–90. [PMID: 22980052]
Shah AM et al. In search of new therapeutic targets and strategies for heart failure: recent advances in basic science. Lancet. 2011 Aug 20;378(9792):704–12. [PMID: 21856484]
Valvular Heart Disease
Ahmed MI et al. Mitral regurgitation. Curr Probl Cardiol. 2009 Mar;34(3):93–136. [PMID: 19232244]
Dweck MR et al. Calcific aortic stenosis: a disease of the valve and the myocardium. J Am Coll Cardiol. 2012 Nov 6;60(19):1854–63. [PMID: 23062541]
Guy TS et al. Mitral valve prolapse. Annu Rev Med. 2012;63:277–92. [PMID: 22248324]
Hamirani YS et al. Acute aortic regurgitation. Circulation. 2012 Aug 28;126(9):1121–6. [PMID: 22927474]
Marijon E et al. Rheumatic heart disease. Lancet. 2012 Mar 10;379(9819):953–64. [PMID: 22405798]
Mokadam NA et al. Management of acute regurgitation in left-sided cardiac valves. Tex Heart Inst J. 2011;38(1):9–19. [PMID: 21423463]
Silbiger JJ. Anatomy, mechanics, and pathophysiology of the mitral annulus. Am Heart J. 2012 Aug;164(2):163–76. [PMID: 22877801]
Coronary Artery Disease
Abbate R et al. Thrombosis and acute coronary syndrome. Thromb Res. 2012 Mar;129(3):235–40. [PMID: 22281070]
Crea F et al. Pathogenesis of acute coronary syndromes. J Am Coll Cardiol. 2013 Jan 8;61(1):1–11. [PMID: 23158526]
Jugdutt BI. Ischemia/infarction. Heart Fail Clin. 2012 Jan;8(1):43–51. [PMID: 22108726]
Parker MW et al. Assessment and management of atherosclerosis in the athletic patient. Prog Cardiovasc Dis. 2012 Mar–Apr;54(5):416–22. [PMID: 22386292]
Swirski FK et al. Leukocyte behavior in atherosclerosis, myocardial infarction, and heart failure. Science. 2013 Jan 11;339(6116):161–6. [PMID: 23307733]
Tousoulis D et al. Pathophysiology of atherosclerosis: the role of inflammation. Curr Pharm Des. 2011 Dec;17(37):4089–110. [PMID: 22204371]
Weber C et al. Atherosclerosis: current pathogenesis and therapeutic options. Nat Med 2011 Nov 7;17(11):1410–22. [PMID: 22064431]
Pericardial Disease
Ariyarajah V et al. Acute pericarditis: diagnostic cues and common electrocardiographic manifestations. Cardiol Rev. 2007 Jan–Feb;15(1):24–30. [PMID: 17172880]
Dudzinski DM et al. Pericardial diseases. Curr Probl Cardiol. 2012 Mar;37(3):75–118. [PMID: 22289657]
Jiamsripong P et al. Spectrum of pericardial disease: part II. Expert Rev Cardiovasc Ther. 2009 Sep;7(9):1159–69. [PMID: 19764867]
Mookadam F et al. Spectrum of pericardial disease: part I. Expert Rev Cardiovasc Ther. 2009 Sep;7(9):1149–57. [PMID: 19764866]