Sharon E. Moran
Kevin Y. Pei
Mihae Yu
Since the introduction of the pulmonary artery catheter (PAC) in the 1970s, initial enthusiasm has been tempered by allegation that the use of PAC may cause harm (1). Several academic societies have convened expert panels to review the literature and discuss important issues regarding PAC utilization (2). For most critical care practitioners, the benefits of using PACs has warranted continued use in high-risk patients, but controversy remains.
Inherent in the use of the PAC is the assumption that flow-related variables such as cardiac output/cardiac index (CO/CI) and oxygen delivery (DO2) to the tissues are important for survival. Shoemaker et al. popularized this concept when they observed that the differentiating parameters between survivors and nonsurvivors were flow-related variables such as DO2, oxygen consumption (VO2), and CO instead of the traditional values of blood pressure (BP), heart rate (HR), urine output, and arterial oxygen tension (PaO2) (3,4). In addition, Bihari et al. (5) reported that as DO2 was augmented in critically ill patients, oxygen consumption of the tissues increased, suggesting that a supply dependency existed. The biggest criticism of the supply dependency concept was the mathematical coupling between DO2 and VO2since cardiac output is on both sides of the equation. In a study using independent measurement of VO2, Yu et al. (6) demonstrated that some but not all critically ill patients showed an increase in VO2 as DO2 improved. The theory of supply dependency and titrating DO2 until the VO2 slope flattens is an attractive concept but is not practical. Some patients may not demonstrate a plateau; furthermore, a patient's VO2 is constantly changing secondary to variations in activity (turning, suctioning), temperature, vasoactive agents, and nutritional support. An easier clinical end point of resuscitation is the mixed venous oxygen saturation (SvO2), which reflects the balance between DO2 and VO2 (see below) (7).
Review of all the literature studying resuscitation to CI, DO2, and SvO2 goals (both pro and con) is beyond the scope of this chapter but is summarized in the practice guidelines for PAC (2). The controversy is NOT whether DO2 is important to tissues but rather how much is necessary to meet the demands of individual tissues. It is also clear that global values of DO2 may not translate into transport of oxygen to the individual tissue beds, but until we have a tool to measure all tissue oxygenation states (or one tissue bed that is a surrogate marker for the rest of the body), the amount of oxygen delivery necessary for tissue perfusion will remain controversial.
Over the decades, clinicians have progressed from treatment of BP, HR, and urine output to markers of anaerobic metabolism such as lactic acid and base deficit, and then to flow-related variables such as DO2, VO2, and SvO2. What we currently need is an easy, noninvasive method to measure tissue oxygenation and the energy state of the cells. This would allow “titration” of DO2 to meet tissue demands rather than aiming for a single global survival value of DO2 and SvO2 (3,4). We consider these end points of resuscitation to be NOT mutually exclusive, but to complement each other into what we call “tiers” of resuscitation. Instead of discarding the value of DO2 manipulation, we should seek better measurements of end points of resuscitation, and search for treatment modalities to improve oxygen transport into the cells.
While literature on use of PAC is vast and confusing, it is important for readers to critically evaluate the studies by asking the following questions:
1. What patient population was chosen for the study and was that an appropriate choice of patients?
2. Were the patients chosen early in the course of illness, or after they developed multisystem organ failure (MSOF)? Was there a time specified to reach the goal? Timing of resuscitation is essential for successful outcome. Studies stressing early resuscitative efforts (7,8,9,10) demonstrate better outcomes with DO2 and SvO2 goals than studies with no time specification (11,12). Given that early resuscitation improves outcome, studies that demonstrate lack of benefit from PAC may be flawed if enrollment occurs within 48 hours of respiratory failure since resuscitation should be completed by 24 hours (13).
3. What were the deletion criteria? Studies excluding patients with acute cardiac or pulmonary problems would be deleting patients who would most benefit from PAC use. One study that deleted patients who already had a PAC, chronic obstructive pulmonary disease (COPD), renal failure, acute myocardial infarct, and liver disease reported no advantage of PAC use (13).
4. Did patients with good cardiac function and ability to respond to increased metabolic demands “negate” the average differences in DO2 between the control and treated groups; that is, did the study enroll patients with good cardiac function who reached their hemodynamic goals with minimum intervention? These patients tend to do well with low mortality. There are two studies that deleted patients with good cardiac function, but these studies had conflicting outcome results, most likely due to differences in treatment and timing of goal achievement (12,14).
5. What were the hemodynamic goals of the study: CI, DO2, or SvO2, or any one or combination of these? Our preference has been to use oxygen delivery indexed (DO2I) rather than CI since the acceptable CI would vary with hemoglobin levels (15,16).
6. How was the treatment administered? Were fluids given to reach a certain pulmonary artery occlusion pressure (PAOP)? Is left ventricular stroke work index (LVSWI) an appropriate end point for fluid administration since a high BP would lead to an elevated LVSWI without an adequate preload (12)? How were fluid and blood given? What were the dosages of inotropes and did large amounts of inotropes (i.e., 200 µg/kg/minute of dobutamine) possibly contribute to negative outcome (12)?
7. What percent of study patients did not reach the goals? Was failure to reach goals due to inadequate effort by the treating team or due to the inherent inability of the patient's myocardium to respond to treatment? We demonstrated that in the initial phases of our prospective randomized trials, failure to reach DO2I of ≥600 mL/minute/m2 occurred 46% of the time but decreased to 19% in the second part of the trial (14). High failure rates (>70%) to reach hemodynamic goals have been reported in some studies with negative outcomes (12,17).
Differences in study design and treatment algorithm may have contributed to the confusion. Nevertheless, our therapeutic regimen is limited, and as clinicians, we continue to optimize DO2 with the hope of delivering oxygen to the tissues.
Pearls
· Identify patients who may benefit from PAC insertion (Table 18.1), and identify what hemodynamic information is needed to guide treatment.
· Insert the PAC early. The best treatment for MSOF is prevention. The majority of successful outcome studies suggest that timing is of the essence.
· Ensure proper readings. No information is better than wrong information leading to erroneous treatment. Studies have demonstrated an alarming degree of user error (18,19,20). A corollary is that infrequent use of PAC may lead to more error (both nursing and physician related).
|
Table 18.1 Indications for pulmonary artery catheter insertion |
|
|
· Have a specific goal for the patient (i.e., DO2, SvO2). The goal may vary depending on the type of disease, and also as the patient's clinical condition changes (16). For example, the preoperative patients may have a modest DO2 goal (21) compared to shock patients (10,22). Older patients (>75 years of age) may have lower metabolic rates and need less DO2 to meet tissue demands (6,14).
· Use of the PAC requires judgment. The “optimum” PAOP may vary as the patient's condition (compliance of the heart, degree of ventilator support) changes. The optimum DO2 may vary as the patient's course of illness changes.
· Instead of using single values of DO2 or CI as end points of resuscitation, individualize DO2 to achieve normal values of traditional parameters (BP, HR, urine output), lactate levels, and SvO2 levels. Additional monitoring of peripheral tissues is currently available such as gastrointestinal tonometry (23), transcutaneous pressure of O2 (PtcO2) and CO2 (PtcCO2) (24,25,26), and near-infrared spectroscopy (27). While orthogonal polarization spectral imaging of oral capillaries holds promise (28,29), further validation studies are needed.
· Do not expect information that the PAC was not designed to give. Central pressure may not give accurate information about the intravascular volume (30). Central and global values such as DO2 and SvO2may not reflect adequate oxygenation state or cellular viability and function in all the tissue beds.
Indications for Pulmonary Artery Catheter Insertion
Indications for PAC insertion (Table 18.1) have been broadly categorized to (a) precautionary measures in high-risk patients, (b) shock states, (c) pulmonary problems, and (d) cardiac dysfunction.
Preoperative intervention of high-risk surgical patients using PACs remains a controversial area and recommendations are vague in the American College of Cardiology/American Heart Association (ACC/AHA) guidelines (2,31). The key points are as follows: insert the PAC with enough time to achieve the hemodynamic goals (usually the day before), communicate with the anesthesiologist regarding the information obtained while in the intensive care unit (ICU), and monitor the patient in the ICU beyond 24 hours to allow for fluid shifts to occur.
The goals of preoperative invasive monitoring are to (a) optimize preload (plot the Starling curve, see below); (b) optimize CI and stroke volume index (SVI) by adjusting preload, afterload, and contractility (possibly by using inotropes); (c) maintain DO2 to perfuse the rest of the body and prevent MSOF; (d) perfuse the coronaries by maintaining coronary perfusion pressure (CPP) and DO2; (e) decrease myocardial work and myocardial oxygen consumption (MVO2) by keeping systolic blood pressure and heart rate normal; and (f) prevent myocardial infarct by avoiding wide swings (>15%) in heart rate and blood pressure (21,32,33). Further details in utilization of PACs for treatment of high-risk patients, shock, and cardiopulmonary failure are covered in other chapters.
The PAC is inserted to obtain information beyond the physical exam. Clinical predictors of hemodynamic status in the critically ill patient, such as chest radiograph, jugulovenous distention, and urine output, are inaccurate (1,34). Physicians are correctly able to predict PAOP and CI only 30% to 70% of the time. With insertion of the PAC, four types of information may be obtained:
1. Central pressures in relationship to the right ventricle (i.e., central venous pressure [CVP] or right atrial [RA] pressure); central pressures in relationship to the left ventricle (i.e., PAOP to estimate left ventricular end-diastolic pressure [LVEDP])
2. Cardiac function measured as cardiac output and presented as cardiac index
3. SvO2
4. Intrapulmonary shunt (Qs/Qt)
General Considerations
The technical aspects of PAC insertion are presented in “Vascular Cannulation.” It is essential that the catheter be positioned and transduced properly, and a knowledgeable clinician must be able to correctly interpret the data (18,35,36). Physicians should understand the basic physical principles involved in catheterization, know the design of the catheter, and be able to recognize and remedy technical errors.
Although the modern PAC has features that weren't available when it was introduced, the general principles of placement have not changed. If the PAC has fiberoptic bundles at the tip for continuous SvO2monitoring, external in vitro calibration is done prior to removing the catheter tip from the casing. The PAC is then flushed to assess the patency of its lumens and to fill the catheter with a noncompressible column of fluid capable of transmitting pressures. There is a distal port for monitoring the pulmonary artery pressures (PAPs) and a central port approximately 30 cm from the tip that will lie in the right atrium in the average-size heart. For cardiac output monitoring, a thermistor is located proximal to the tip to measure temperature changes (discussed below). The catheter is placed through the protective sheath and the balloon is checked for integrity prior to insertion. The transducer is placed at the level of the patient's midaxillary line and zeroed to atmospheric pressure (phlebostatic point). If the transducer elevates above the patient level, the readings will be falsely low. Conversely, if the transducer falls below the patient level, the readings will be falsely high. This is typically noted in beds that are designed to rotate patients.
Pressure Measurements
Normal hemodynamic values are presented in Table 18.2.
Pressure changes in the heart or vessels cause movement of the catheter, which is then converted to an electrical signal by a transducer (37). Electrical noise is filtered and the signal is amplified and displayed as a tracing on a monitor. Before insertion, the function of the system is checked by shaking the catheter and seeing good waveforms on the monitor. If the waveform is dampened, the system should be flushed to rid the catheter and tubings of all air bubbles, and all connections should be tightened. After inserting the PAC 15 to 20 cm into the introducer in the vein, the balloon is inflated and the catheter is gently advanced. The natural flow of blood from the vena cava through the heart and to the lungs guides the catheter to the pulmonary vasculature (38). While passing from the vena cava to a branch of the pulmonary artery, characteristic waveforms are displayed on the monitor (Fig. 18.1). Once the catheter is advanced to the “wedged” position, the balloon is deflated and the catheter adjusted until 1.25 to 1.5 mL of inflation is needed to produce the PAOP tracing. The balloon should only be inflated long enough to record a measurement in order to avoid rupture of the artery or infarction of the downstream segment of lung. The balloon should always be deflated when withdrawing the catheter to avoid vascular and valvular injury. The catheter should coil gently in the right ventricle (RV) and sit in a larger branch of the pulmonary artery (Fig. 18.2). A chest radiograph is done to assess for pneumothorax and may help to confirm proper position. If there is not an obvious wedge tracing, blood may be sampled from the distal port with the balloon inflated, after discarding about 15 mL from the distal port. The sample should have a higher PaO2 and pH with a lower PCO2 than blood aspirated when the balloon is deflated (39). Proper placement is also indicated by the SvO2 signal quality (if using a fiberoptic catheter), which is displayed in different ways by different manufacturers. The quality of the signal may be altered by a fibrin clot at the tip of the catheter or by placement of the tip against a vessel wall and may suggest that the catheter is in too far or that the patient is hypovolemic with collapse of the vessel wall around the catheter tip. If the catheter is in too far, the PAOP tracing will continue to elevate and is called “overwedging” (Fig. 18.3). If this occurs, the balloon should be deflated and the catheter pulled back ([congruent]1 cm) and the balloon inflated again until a good tracing is seen with 1.25 to 1.5 mL of balloon inflation.
|
|
||||||||||||||||||||||||||||||||||||||||||||
|
Figure 18.1. Waveforms seen during pulmonary artery catheter insertion. |
||||||||||||||||||||||||||||||||||||||||||||
|
Table 18.2 Normal hemodynamic values |
||||||||||||||||||||||||||||||||||||||||||||
|
|
|
|
Figure 18.2. Proper position of the pulmonary artery catheter. RA, right atrium; RV, right ventricle; PA, pulmonary artery; LV, left ventricle; AO, aorta. |
Because there is a tendency for materials to oscillate at their natural frequencies, the pressure signal may be distorted (40). This effect may be reduced by using stiff, noncompliant tubing and the shortest length (<4 feet) in the setup of the catheter and monitoring system. The loss of transmitted signal is referred to as damping, and catheters may be over- or underdamped. The degree of damping can be determined by a “fast flush” device (Fig. 18.4). When the catheter is rapidly flushed, a square wave is produced, followed by a series of oscillations before the tracing returns to the baseline pressure reading (41). The appearance of the oscillations demonstrates the degree of damping. Underdamping, which occurs more frequently, is identified by several sharp oscillations and produces higher systolic pressure readings (Fig. 18.4B). Overdamping results in a rounded oscillation and results in lower readings, and may be due to clots, air bubbles, or kinking in the catheter (Fig. 18.4C). Another factor that may interfere with the signal is catheter whip, which results from contraction of the heart. The tracing will show high-frequency distortion. This may be minimized by a high-frequency filter built into the transducer system (40).
|
|
|
Figure 18.3. Overwedged tracing. PA, pulmonary artery; PAOP, pulmonary artery occlusion pressure. |
|
|
|
Figure 18.4. Checking transducer reliability by the “fast flush square wave testing.” |
|
|
|
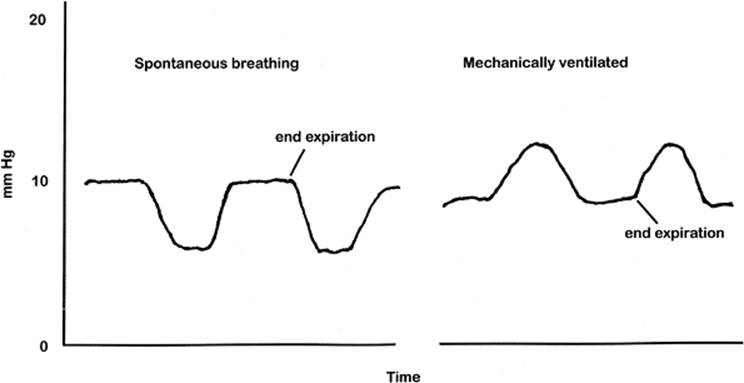
Figure 18.5. Reading of pulmonary artery occlusion pressure (PAOP) at end expiration. During spontaneous breaths, PAOP dips down during peak inspiration due to negative intrathoracic pressure. During mechanical ventilation, PAOP goes up during peak inspiration due to positive pressure ventilation and intrathoracic pressure. In both situations, PAOP should be read at end expiration. |
Whether the patient is on mechanical ventilation (positive intrathoracic pressure) or spontaneously breathing (negative intrathoracic pressure), all pressure measurements should occur at end expiration when the intrathoracic pressure is closest to atmospheric pressure (Fig. 18.5) (unless the patient is on higher levels of positive end-expiratory pressure [PEEP]). This point can be determined by watching the patient's respiratory movements or displaying the airway pressure tracing on the same monitor where the pulmonary artery pressure is displayed. If respiratory variation is so pronounced that there is no flat end expiration, then it is best NOT to record a number (Fig. 18.6). In this situation, patients may need to be sedated, or if getting a PAOP is crucial, even paralyzed. What is unacceptable is to “guess” what the number may be, leading to wrong conclusions and wrong treatment. No information is better than wrong information.
The first characteristic waveform seen when inserting a PAC is the right atrium (RA) tracing (Fig. 18.7). The tracing can be seen while inserting the catheter or by transducing the right atrial pressure once the PAC is in position. There are two main positive pressure deflections, called the a and v waves. The a wave follows the P wave of the electrocardiogram and is due to the pressure increase during atrial systole (Figs. 18.7 and 18.8). The v wave results from atrial filling against a closed tricuspid valve during ventricular systole. Between these two positive deflections is a small c wave due to tricuspid closure. Two negative deflections called the x and y descents occur when pressure in the atrium decreases. The x descent occurs during atrial relaxation. The y descent is seen when the tricuspid valve opens and blood flows from the atrium to the ventricle.
The best estimate of CVP and PAOP is at end diastole when the atrium contracts. For CVP, where the c wave emerges from the a wave (also called the z-point) is the optimum reading point. If this point is not clear, read the pressure at the middle of the x descent. Certain patterns in the RA tracing may be seen in disease states (Fig. 18.7). a waves may not be seen in patients with atrial fibrillation. Sawtoothed a waves will be present during atrial flutter. Large a, or “cannon” waves occur during atrioventricular (A-V) dissociation when the atrium contracts against a closed valve, or during complete heart block. A steep y descent is seen in tricuspid regurgitation and the x descent is not apparent. Both descents are prominent in RV infarction. Tamponade tends to cause loss of the y descent due to impairment of ventricular filling. In pericarditis, sharp a and v waves are followed by steep x and y descents. Large v waves are seen in mitral regurgitation, congestive heart failure, and ventricular septal defect due to the increase in atrial pressure. Recognizing these patterns may help to suggest a diagnosis before a confirmatory echocardiogram is obtained.
|
|
|
Figure 18.6. Excessive variation in pulmonary artery occlusion pressure with forced inspiratory and expiratory efforts precluding accurate measurement due to absence of a stable end-expiratory point. |
|
|
|
Figure 18.7. Pressure tracings from the right atrial port in normal and pathologic conditions (refer to text). |
The pressures observed in the right atrium range from 0 to 8 mm Hg. Higher pressures may not necessarily mean fluid overload, but reflect the volume of the right heart and the ability of the ventricle to eject that volume. There is little relationship between CVP and PAOP or left heart pressures in patients with valvular or coronary artery disease or when pulmonary artery pressures are elevated (42,43). It is in these situations of right heart failure, severe pulmonary disease, and in most of the critically ill patients when monitoring the CVP only (and not the PAOP) would be misleading.
The next waveform seen is that of the right ventricle (Fig. 18.1). The pressures here are higher with a wider difference between systolic and diastolic. If no RV waveform is seen after inserting the catheter 30 cm from the internal jugular or subclavian vein entry site, the catheter may be curling in the atrium or passing into the inferior vena cava. The catheter should be quickly advanced through the ventricle both to avoid dysrhythmias and to keep the catheter from warming and losing its stiffness. The RV systolic pressures generally range from 15 to 30 mm Hg and diastolic pressures from 4 to 12 mm Hg. In right heart failure, the RV diastolic pressures may be high enough that the waveform mimics the PA. Low RV pressures will be seen in hypovolemic shock and they will also be close to PA pressures. One concern at this point of insertion is causing a right bundle branch block (RBBB), or even complete heart block in patients with pre-existing left bundle branch block (LBBB) (44). However, the incidence of complete heart block appears to be no greater in patients with LBBB than without (45).
|
|
|
Figure 18.8. Reading of central venous pressure (CVP) and pulmonary artery occlusion pressure (PAOP) in relationship to the cardiac cycle (electrocardiogram). |
Once the catheter enters the pulmonary artery, the waveform shows an increase in diastolic pressure while the systolic pressure remains about the same as in the ventricle, sometimes referred to as the “step up” (Fig. 18.1). This transition may be difficult to discern when there is hypovolemia, tamponade, RV failure, or catheter whip. If there is no change in waveform after inserting the catheter 50 cm, it may be coiling in the ventricle and is at risk of knotting. A chest radiograph will discern the problem and fluoroscopy may be used to guide placement. Normal PA pressures range from 15 to 25 mm Hg systolic over 8 to 15 mm Hg diastolic. The beginning of diastole is marked by a dicrotic notch on the PA tracing, corresponding to the closure of the pulmonic valve (46). This incisura distinguishes the PA from the RV when RV diastolic pressures are elevated. As blood flows through the lungs to the left atrium, the PA pressure drops until it reaches a nadir at the end of diastole. Since the pulmonary circulation has low resistance, the diastolic pressure is able to decrease until it is just higher than PAOP. The highest PA systolic pressure occurs during the T wave of the corresponding electrocardiogram (ECG). The pulmonary circulation is very dynamic and is affected by acidosis, hypoxia, sepsis, and vasoactive drugs (47). An increase in CO may also seemingly paradoxically lower the PA pressures by a reflexive decrease in pulmonary vascular resistance with fluid resuscitation and decreased sympathetic nervous system discharge (48).
The transition to the wedge position is noted by a drop in mean pressure from the PA. The PAOP usually ranges from 6 to 12 mm Hg in normal states. PAOP most closely reflects LVEDP after atrial contraction and before ventricular contraction (Fig. 18.8). There are often no clear a, c, or v waves. The point 0.05 seconds after onset of QRS of the ECG is where the pressure best estimates LVEDP (49). When v waves are prominent such as in mitral insufficiency, the bottom of the v wave or the a wave may be used to measure the PAOP (Fig. 18.9). A prominent v wave may fool the novice into thinking that the catheter is not wedging. It is important to note the change in wave form from PA to v wave tracing (although the two waves may look remarkably similar). One way of differentiation is that the v wave occurs later in the ECG cycle after the T wave while the PA wave occurs right after QRS (Fig. 18.9). There may be large a waves secondary to a decrease in left ventricle compliance (50); the point 0.05 seconds after initiation of QRS again best reflects LVEDP. Even though the measurements are correlated with the ECG and are done during end expiration, the PAOP may be exaggerated by respiratory muscle activity, especially during active or labored exhalation. Once the patient is adequately sedated, a short-acting paralyzing agent may be necessary to eliminate this effect (51) (Fig. 18.6).
|
|
|
Figure 18.9. Regurgitant mitral valve generating a v wave seen during wedging. PA, pulmonary artery. |
Principles of Measuring Pulmonary Artery Occlusion Pressure
When the balloon is inflated, the blood flow in that segment of the pulmonary artery is occluded and the PAOP is measured. Since there is no flow, the pressure between the occluded pulmonary artery segment and the left atrium will equalize (Fig. 18.10), analogous to closing off a pipe with pressures equalizing between the two ends (52). With the closed pipe analogy, there is a list of assumptions: PAOP [congruent] PcP [congruent] LAP [congruent] LVEDP [congruent] LVEDV, where PcP is pulmonary capillary pressure, LAP is left atrial pressure, and LVEDV is left ventricular end-diastolic volume. As long as there is no obstruction in this conduit, the relationship between PAOP and LVEDP may hold. The final assumption is equating pressure to volume by estimating LVEDV or “preload” with LVEDP. We will now assess the pitfalls with each one of these assumptions.
1. PAOP [congruent] PcP [congruent] LAP. In the “closed pipe” analogy, the column of blood between the catheter tip and the left atrium should be patent and not narrowed by alveolar pressures. This occurs in the dependent areas of the lung, where the pressures from blood flow in the right atrium and pulmonary artery are greater than the alveolar pressure, or zone 3 in the West classification (53). In other areas of the lung (zone 1 or 2), the pulmonary arteries may collapse from higher alveolar pressures and the wedge pressure may partially reflect alveolar pressure (Fig. 18.11). Because the PAC is directed by blood flow, it is more likely to pass into zone 3, where pulmonary arterial and venous pressures exceed alveolar pressures. This is especially true when the patient is supine, since there is greater volume of lung located in a dependent position (54). When pulmonary artery diastolic pressure is lower than the PAOP, this implies incorrect positioning of the PAC (i.e., blood cannot flow in reverse direction), and may be due to transmission of alveolar pressures on the PAOP in non–zone 3 catheter position. Other factors that may cause errors in estimation of PAOP to LAP are pulmonary venous obstruction and respiratory variation as well as high ventilator support (PAOP reads higher than LAP).
The PAOP usually closely approximates the pulmonary capillary hydrostatic pressure (Pc). When there is an increase in pulmonary vascular resistance (PVR), the wedge pressure underestimates Pc. A difference of 2 to 3 mm Hg between the PAOP and pulmonary artery diastolic (PAD) pressure is a clue that there may be a discrepancy between PAOP and Pc (35). Hydrostatic pulmonary edema may therefore occur at lower wedge pressures. A method of calculating the Pc has been described by recording the rapid drop in pressure decline when the catheter balloon is inflated in the wedge position (55). The point where the rapid decline transitions to a more gradual slope before reaching the PAOP is the Pc (Fig. 18.12).
|
|
|
Figure 18.10. Closed pipe analogy: blocking of flow by the balloon with theoretical equalization of pressure in the conduit. RA, right atrium; RV, right ventricle; PAOP, pulmonary artery occlusion pressure; Pc, pulmonary capillary; LAP, left atrial pressure; LV, left ventricle. |
Increased intrathoracic pressure secondary to respiratory failure and the addition of PEEP in ventilated patients affects pulmonary vascular pressures. Up to about 15 cm H2O, PAOP closely correlates with LAP (56). During higher PEEP states, the PAOP may not reflect the true filling pressure of the heart (i.e., pressure outside minus pressure inside the heart). Although the heart is seeing the high PEEP support at all times, on-PEEP PAOP is not giving the information that we need from the PAOP, which is the cardiac filling pressure. In general, 5 cm H2O of PEEP is said to raise the measured PAOP by 1 mm Hg, but a greater effect is seen in hypovolemic patients or when the catheter is not in West zone 3 (57). High PEEP may also turn zone 3 status to zone 2 or 1 by compressing the pulmonary artery and/or pulmonary vein. Another formula predicts that 50% of PEEP is transmitted to the pleural space (54). However, in noncompliant lungs, such as in the acute respiratory distress syndrome, the alveolar pressure is not effectively transmitted to the vasculature. Also, pulmonary disease is not homogeneous. In complicated cases, it is best to avoid formulas or assumptions. In order to more accurately correct for the pressure transmitted during high PEEP ventilation, the intrapleural pressure may be measured directly with a catheter in the pleural space or distal esophagus and then subtracted from the PAOP, resulting in a “transmural” pressure. However, this is cumbersome and not often done.
|
|
|
Figure 18.11. West's lung zones. PAP, pulmonary arterial pressure; PalvP, pulmonary alveolar pressure; PvP, pulmonary venous pressure. Zone 1: PAP <PalvP> PvP (there is no blood flow across the collapsed pulmonary capillary bed). Zone 2: PAP > PalvP > PvP (there is some flow since PAP is greater than PalvP). Zone 3: PAP > PalvP < PvP (pulmonary arteries are patent). |
|
|
|
Figure 18.12. Estimation of pulmonary capillary pressure. PA, pulmonary artery pressure; Pc, pulmonary capillary pressure; PAOP, pulmonary artery occlusion pressure. |
Another method is to measure an “off-PEEP” wedge pressure by temporarily disconnecting the patient from the ventilator circuit and recording the nadir of the tracing (58). This nadir pressure better reflects LAP than the on-PEEP PAOP. The discontinuation should be brief (<1 second) so that a decrease in PaO2 from derecruitment of alveoli does not occur (59). The brief off-PEEP state will not change physiologic conditions such as venous return and cardiac function. The procedure should be coordinated and done by trained personnel only when the PAOP is needed to make a clinical decision. The balloon is inflated first to ensure good position, then deflated. The FiO2 may be increased temporarily for patient safety, the balloon reinflated, and at end expiration, the patient is disconnected from the ventilator for 1 second and then reconnected while the PAOP tracing is being recorded. The drop in PAOP upon ventilator disconnection is the off-PEEP PAOP (58). When done properly, it is extremely rare to cause hypoxia.
2. LAP [congruent] LVEDP. LAP (and thus PAOP) will overestimate LVEDP if there is an obstruction between the left atrium and the left ventricle such as a myxoma or mitral stenosis. Mitral valve regurgitation also causes the PAOP to read higher than the true LVEDP because of the additional pressure of the retrograde flow of blood across the valve resulting in a large v wave (see above). LAP (and thus PAOP) will underestimate LVEDP when severe aortic regurgitation causes premature closure of the mitral valve when the left ventricle is still filling. LAP (and PAOP) is higher when there is a left atrial kick in a failing heart and decreased ventricle compliance such as in ischemic states, left ventricular hypertrophy, and restrictive cardiomyopathies (60). This is especially true when LVEDP is greater than 25 mm Hg.
3. LVEDP [congruent] LVEDV. The pressure–volume relationship depends on the compliance of the ventricle and the transmural ventricular distending force. The compliance of the ventricles will change with ischemia, infarct, and hypertrophy. A stiff heart (myocardial hypertrophy) will need higher pressures to obtain the same amount of volume as a normal heart (Fig. 18.13). The transmural ventricular distending force (intracavitary pressure minus juxtacardiac pressure) will depend on the pressure inside and outside the heart. External forces elevating juxtacardiac pressures may be high ventilator support or pericardial tamponade, which may cause elevation of PAOP but may not reflect ventricular filling pressure.
Clinical Use of the Pulmonary Artery Occlusion Pressure
As long as the previously mentioned assumptions regarding the relationship between PAOP, LAP, and LVEDP have been evaluated, the PAOP may be used as an estimate of LAP with reasonable correlation (52,61). The optimum wedge pressure depends on the patient, but has been defined as the pressure where there is minimal increase in stroke volume or left ventricular stroke work. Although the normal PAOP values may be 10 to 14 mm Hg (62,63), some patients require a high pressure to reach the optimum stroke volume (Fig. 18.14). The Starling curve plotting stroke volume index to PAOP (as an estimate of LVEDP) may help identify the optimum wedge but some patients may have a flat curve. If vasoactive agents are started, the heart may now be on a different curve requiring new assessment of the optimum PAOP. The optimum PAOP varies not only from patient to patient, but also temporally within the same patient as the clinical condition changes (such as vasoactive agents, myocardial compliance, and external forces around the heart). There are no set numbers to treat to, but each patient must be individually assessed and assessed repeatedly, making the PAC a highly user-dependent tool.
|
|
|
Figure 18.13. The same pulmonary artery occlusion pressure of 20 mm Hg reflecting three different clinical conditions. A: Distended hypervolemic ventricle in a normal heart. B: Normal volume in a noncompliant heart (ventricular hypertrophy). C: Low volume in a normal ventricle with high juxtacardiac pressures such as high positive end-expiratory pressure. |
|
|
|
Figure 18.14. Frank-Starling curves (family of curves) showing the relationship between left ventricular end-diastolic pressure (LVEDP) to stroke volume (SV, mL/beat). Augmenting preload increases LVEDP with a concomitant increase in SV (up to a certain point). The effects of manipulating preload, afterload, and contractility and shifting to another curve can be seen. |
Elevated wedge pressures may help differentiate hydrostatic pulmonary edema from that caused by increased permeability. A PAOP of 24 mm Hg or higher is associated with a tendency for hydrostatic edema (64). Lower pressures may imply increased capillary permeability and traditionally, a PAOP of <18 mm Hg has implied a pulmonary (or noncardiogenic) cause of lung edema. When there is an increase in PVR, the wedge pressure underestimates Pc and hydrostatic pulmonary edema may therefore occur at lower wedge pressures (see Fig. 18.12).
Volumetric PACs are designed with the ability to measure right ventricular ejection fraction (RVEF), from which the right ventricular end-diastolic volume indexed (RVEDVI) to body surface area (BSA) is calculated. Traditionally, the right heart function was deemed unimportant and thought to merely act as a conduit to get blood to the left ventricle. However, right heart dysfunction with septal deviation may impact LV compliance and contractility, and the function of RV is important when pulmonary artery pressures are elevated. The volumetric PACs have two additional electrodes that provide continuous measurement of the ECG and a thermistor with a rapid response. From beat-to-beat change in temperature, the ejection fraction (EF) is calculated. EF (%) = SVI/EDVI × 100, where SVI is stroke volume indexed and EDVI is end-diastolic volume indexed to BSA. CI/HR = EDVI – ESVI, where ESVI is end-systolic volume indexed to BSA (65). RVEDVI has been shown to be a more accurate measure of cardiac preload than pressure measurements in certain patient populations (66,67). The measurement of RVEF has been validated by comparisons with transesophageal echocardiography (68). The RVEDVI in healthy individuals falls between 60 and 100 mL/m2. The information obtained from the volumetric catheter has been used to predict response to fluid challenge when the values are relatively low (<90 mL/m2) (66). The validity of the RVEF measurement is compromised by tachycardia (pulse >120 beats per minute) and atrial fibrillation (irregular heart rate) (69).
Cardiac Output
The ability of the heart to meet increasing tissue oxygen demand is perhaps the single most important determinant in oxygen delivery and tissue perfusion. The evolution of cardiac output measurement started with Adolf Fick, who in the 1870s proposed that uptake or release of a substance by an organ is the product of blood flow through that organ and the difference between arterial and venous values of that substance. The original “dye” was oxygen and the organ studied was the lung. Fick's equation stated: CO = VO2/(CaO2 – CvO2), where VO2 is oxygen consumption, CaO2 is arterial content of O2, and CvO2 is mixed venous content of O2.
This principle is widely accepted as an accurate though invasive assessment of cardiac output since a pulmonary artery catheter must be placed to obtain accurate mixed venous oxygen content. Its practical use is limited by the cumbersome measurement of oxygen consumption. Stewart (1897) and Hamilton (1932) utilized the concept but used a known amount of dye injected into central circulation followed by serial peripheral arterial measurements of dye concentration (i.e., change in dye concentration over time), and calculated the flow. The area under the curve after plotting time (x axis) versus dye concentration (y axis) reflected the cardiac output using the following equation: Cardiac output = Amount of dye injected/integral (dye concentration × function of time). The next revolutionary step in cardiac output measurement was using temperature as the dye. Crystalloid solution (usually 10 mL, but 5 mL may be used in volume-restricted patients) is injected into the RA port at similar parts of the respiratory cycle (end expiration), within 4 seconds in a smooth manner (70). The thermistor near the tip of the PAC detects the change in temperature, and the change in blood temperature over time is proportional to the blood flow from the ventricle. Several measurements (three to five) should be taken and the average of the values (within 10% of each other) used. Principles of the modified Stewart-Hamilton equation calculate the cardiac output (Fig. 18.15).
|
|
|
Figure 18.15. The modified Stewart-Hamilton equation for estimating cardiac output. |
Although initial studies used iced solutions as injectates, ambient temperature injectate is now the standard solution used with excellent reproducibility and correlation with iced injection (71) and has less likelihood of reflexive bradycardia (72). It is important to note that iced injectates (0°C to 5°C) are associated with higher reproducibility and the highest signal-to-noise ratio (73) and may be necessary in hypothermic patients. Falsely low CO will occur if an error in the system increases the change in temperature (which is in the denominator of the Stewart-Hamilton equation): the temperature probe reading the injectate is cooler than the actual injectate (or the solution is warmer than the temperature reading of the injectate), more than allotted “dye” amount is injected (>10 mL fluid), there is too rapid an injection, or the injection occurs during positive pressure ventilation. Falsely high CO may occur if the temperature probe measuring injectate reads warmer than the actual injectate (if the solution is cooler than the temperature reading of the injectate), less than the allotted amount of “dye” (<10 mL) is used, or the catheter has migrated distally with less change in temperature difference. Most institutions use temperature probes at the site of injection (RA port) so that variations in injectate temperature should not contribute to errors in CO measurements.
Another development in the evolution of measuring CO is the PAC with continuous cardiac output (CCO) monitoring (74,75). A heat element is embedded in the PAC to deliver small pulsations of heat, which is detected by a rapid-response thermistor placed distally to the heat source. The change in temperature detected is then used to calculate cardiac output. Although there is no gold standard for measuring CO at the bedside, CCO values are reproducible and close to manual CO measurements, although discrepancies are observed at extremely low-flow states (74). Unlike the manual injection of crystalloid, the measurements are done at random parts of the respiratory cycle and are less subject to human error, which may account for some of the differences in the two techniques. A word of caution is that the CCO value may not change instantly when the cardiac output changes (e.g., with titration of inotropes), but the effect of treatment can be seen in seconds if using a continuous SvO2 monitor. Due to the heat-generating wire coil in the distal end, these catheters must be removed before magnetic resonance imaging.
Starling Curves (Fig. 18.14)
Drs. Frank and Starling described the relationship between myocardial stretch and contractility. Myocardial stretch is an independent determinant of stroke work and the actin–myosin interaction has a linear correlation with the strength of systolic contraction up to a certain point. Given the heart's dynamic environment, a family of curves is more representative of the true preload–to–stroke volume relationship. Increasing afterload or decreasing contractility shifts the curve down and to the right (i.e., more stretch is necessary to produce a similar difference in stroke volume). One cannot stress enough the importance of reassessment after each therapy. For example, initiating afterload reduction may put the heart on a different Starling curve (to the left and up, Fig. 18.14), but may decrease the preload. Unless more fluid is given to optimize the LVEDP (i.e., PAOP), the best stroke volume may not be achieved.
Mixed Venous Oxygen Saturation (See Chapter on Venous Oximetry)
Specialized PACs with the ability to measure mixed venous oxygen saturation (SvO2) continuously using principles of reflection spectrophotometry are available (Fig. 18.16). Oxygen saturation is the ratio of hemoglobin bound to O2 divided by total hemoglobin, and when measured at the tip of the PAC, reflects mixing of deoxygenated blood from superior and inferior vena cavae and coronary vessels. The SvO2value indicates the balance between oxygen delivery to the tissues and the amount consumed by the tissues before returning to the heart.
Rearranging the Fick Equation

Four factors determine the SvO2 value: three parameters contributing to oxygen delivery (CO, hemoglobin, and SaO2), and one parameter for O2 consumption. Low SVO2 suggests insufficient O2 delivery or increased O2 consumption. SVO2 is also a harbinger of shock and may decrease before overt shock is apparent (14,15,25,76). Mixed venous oxygen saturation has also regained popularity as an end goal of resuscitation with decreased mortality (7,77,78,79). Inadequate oxygen delivery can be the result of decreased cardiac output, low hemoglobin, or low oxygen saturation. Increased consumption may occur due to activity, fever, hyperthyroid state, or repayment of oxygen debt. High SvO2 suggests low cellular consumption such as in late sepsis, arteriovenous shunts (cirrhosis), or excessive inotrope use. Hypothermia, sedation, paralysis, anesthesia, hypothyroidism, and cyanide poisoning can also reduce VO2. The catheter should also be checked to ensure that distal migration has not occurred leading to sampling of pulmonary capillary blood that is normally highly saturated (~100%). Inflating the balloon (wedging) should determine that the catheter is in too far if the PAOP tracing is seen with <1.25 mL of air.
|
|
|
Figure 18.16. Fiberoptic catheter using principles of spectrophotometry. |
Calibration by lab oximeter on a daily basis is important to check for drifting and whenever the values do not seem to correlate with the patient's clinical condition. Even if the PAC does not have continuous SvO2 monitoring, SvO2 can be checked by sending a blood sample from the distal PA port (by drawing slowly at the rate of 1 mL over 20 seconds to prevent sampling of pulmonary capillary blood) and sending it to the lab for oximeter analysis (direct saturation measurement and not arterial blood gas [ABG] analysis). If the PAC has continuous SvO2 monitoring, a signal quality indicator is generated. If the signal intensity suggests poor quality, errors include (a) that PAC is in too far, (b) there are fibrin clots around the tip, (c) the catheter is touching the vessel wall, or (d) the patient may be hypovolemic. Repositioning the PAC or flushing the PA port may resolve this issue.
Intrapulmonary Shunt (Qs/Qt)
Shunt refers to the portion (in %) of blood that flows (CO) from the right side of the heart to the left completely deoxygenated (Fig. 18.17). We will not discuss cardiac shunts in this chapter. Physiologic shunt = Anatomic shunt + Intrapulmonary shunt. Anatomic shunt refers to the direct drainage of the venous system to the left ventricle through the bronchial, thebesian, and pleural veins (~2%–5% of CO). Intrapulmonary shunt (Qs/Qt) is expressed as the % of cardiac output passing through completely collapsed alveoli with no or little gas exchange so that the ventilation-to-perfusion ratio is zero (i.e., V/Q = 0).
Venoarterial admixture or shuntlike states refer to blood flow passing through partially open alveoli (i.e., V/Q <1). Acute shunt will not respond to FiO2 and the treatment is PEEP to open the alveoli and make them responsive to FiO2. Venous admixture will demonstrate some response to FiO2. If the shunt is minimal (normal condition), there is almost a linear relationship between FiO2 and PaO2, but as the shunt increases, FiO2 no longer affects PaO2 in a linear fashion (Fig. 18.18). This is an important concept as one cannot improve hypoxemia by increasing FiO2 alone, but needs to open the alveoli with PEEP. If the shunt equation is calculated on a FiO2 of <1.0, both the shunt and venous admixture will be captured in the equation. Intrapulmonary shunt (Qs/Qt) is calculated as (CcO2 – CaO2)/(CcO2 – CvO2), where CcO2 is the pulmonary capillary content of O2, CaO2 is the arterial content of O2, and CvO2 is the mixed venous content of O2 (Table 18.3). Since pulmonary capillary blood cannot be sampled, the saturation is assumed to be 100%, which usually holds true when the FiO2 is 1.0. It is important to understand the contribution of a low SvO2 to PaO2 if there is a moderate shunt (>20%). Any decrease in SvO2 in a patient with >20% shunt will allow more deoxygenated blood to go into the arterial circulation, resulting in a lower PaO2. This is called nonpulmonary cause of hypoxia. For example, if a patient with a 20% intrapulmonary shunt and a hemoglobin of 15 g/dL has an acute cardiac event, and the CO decreases from 5 to 3 L/minute, the PaO2 will decrease from ~80 to 65 mm Hg (Fig. 18.19). In the exact same scenario, if the patient's hemoglobin is 10 g/dL, the PaO2 will decrease from 70 to 55 mm Hg. This demonstrates the importance of low SvO2 contributing to lower PaO2. If the PEEP had been increased in this patient to treat a low PaO2, a further decrease in CO would have resulted in worsening SvO2 and PaO2. Treatment in this case is to optimize CO first to see if PaO2 improves. Another example: If a patient is agitated and the arterial saturation decreases, this may be due to increased oxygen consumption and low SvO2 in a patient with a moderate intrapulmonary shunt, and not from an acute pulmonary event. Treatment is to decrease agitation and VO2. There are times when severe cardiorespiratory compromise warrants titration of both cardiac output and PEEP simultaneously in patients with life-threatening hypoxia. It is important to understand the interaction of one organ on the other and the relationship between PaO2, hemoglobin, and cardiac output (Fig. 18.19).
|
|
|
Figure 18.17. Intrapulmonary shunt (Qs/Qt) is the percent of cardiac output (CO) not involved with gas exchange (goes through collapsed alveoli), with ventilation/perfusion V/Q = O. LA, left atrium; RV, right ventricle. |
|
|
|
Figure 18.18. The effect of FiO2 on PaO2 depending on the degree of intrapulmonary shunts of 20%, 30%, and 50%. This is assuming that other parameters that affect SvO2 such as cardiac output, hemoglobin, and oxygen consumption are remaining constant. |
|
Table 18.3 Derived calculations (all are indexed to body surface area) |
||||||||||||||||||||||||||||||||||||||||||||||||||||||||||||||||||||||
|
||||||||||||||||||||||||||||||||||||||||||||||||||||||||||||||||||||||
Derived Variables
See Table 18.3 for the equations and normal values. Once the flow and pressure variables have been obtained from the PAC, further hemodynamic calculations may be done to obtain complete information. Most bedside monitors are capable of calculating and displaying the numbers, but clinicians must understand the significance and pitfalls of these values.
· Stroke volume index (SVI) is the quantity of blood ejected from the ventricle with each contraction (i.e., the difference between end-diastolic and end-systolic volumes). SVI accounts for the effect of the heart rate's contribution to CI, and is an important variable because one does not want to augment CI by causing tachycardia (Fig. 18.14). SVI varies with preload, afterload, and contractility. Preload is the theoretical stretch of ventricles at end diastole.
According to Frank and Starling, the stretch of myocardium augments contractility to a certain point, and then cardiac output is negatively affected by further increases (80). Afterload is the interplay between aortic compliance, peripheral vascular resistance, viscosity of blood, aortic impedance, and aortic wall resistance. Afterload is therefore the force that myocytes must overcome during each contraction. Contractility is the maximum velocity of myocardial fiber contraction; it is the myocytes' inherent ability, independent of preload. All these parameters are extremely dynamic and require frequent reassessment.
|
|
|
Figure 18.19. Relationship between PaO2, cardiac output, and three different intrapulmonary shunt states (10%, 20%, and 30%) for patients with a hemoglobin of 15 g/dL and 10 g/dL. This graph demonstrates “nonpulmonary” causes for PaO2 changes where a low cardiac output or low hemoglobin will impact PaO2 depending on the degree of shunt. |
· Left ventricular stroke work index (LVSWI) estimates the work of the left ventricle in one beat. Work is the product of force and distance. Physiologically, this translates to the product of change in pressure and change in volume. Current technology does not allow continuous measurements of both ventricular volumes at the bedside. Stroke work index is low in cardiogenic and hypovolemic shock. In trauma patients, it has been suggested that high LVSWI is associated with decreased mortality (81,82). It should be noted that not all work is alike since “good work” is associated with large volume change with little pressure, and “bad work” is associated with large pressure change with little volume movement.
· Right ventricular stroke work index (RVSWI) is the right heart's ability to produce forward flow against the pulmonary circulation and estimates external work for the RV in one beat. The work generated by RV is markedly less than LV due to a relatively low pulmonary pressure system. In patients with pulmonary hypertension and consequent right heart failure, the RVSWI must compensate accordingly (discussed below).
· Pulmonary vascular resistance index (PVRI) is the resistance for the right ventricle. Resistance to blood flow is analogous to electrical circuit resistance defined by Ohm's Law. Resistance = Pressure/Flow. Physiologically, the pressure change between two vascular beds drives the flow (i.e., cardiac index). PVRI reflects resistance in the pulmonary vasculature. Pulmonary hypertension exists when systolic PAP is >35 mm Hg or mean PAP is >25 mm Hg (83,84). In critically ill patients, the most common causes for elevated PAP are acute respiratory distress syndrome, acute LV dysfunction, and pulmonary embolism (83,85,86,87,88,89). Patients with comorbid conditions such as chronic pulmonary hypertension may suffer from interstitial lung disease, COPD, or liver or cardiac disease. The right ventricle is exquisitely sensitive to increases in afterload and lacks the ability to overcome pulmonary hypertension with PAP >40 mm Hg (84). Subsequent decrease in cardiac output is due to the combination of decreased RVSWI and decreased filling of the left ventricle as a result of interventricular septal deviation (90). Since cardiac output is indexed to BSA, PVR should also be indexed and presented as PVRI.
· Systemic vascular resistance index (SVRI) is the resistance for the left ventricle. In the context of hyperdynamic states with high cardiac index and decreased SVRI, the patient may be in distributive shock. Patients with low cardiac index and high SVRI are in hypovolemic or cardiogenic shock. It is important to recognize that SVRI represents the interplay of vascular diameter and viscosity, of which neither variable is easily measured. SVRI is calculated; therefore error is introduced if any of its subcomponents carries inaccuracy. Since CO is indexed to BSA, SVR should also be indexed and presented as SVRI.
· Arterial oxygen content of blood (CaO2) is the amount of oxygen carried in arterial blood. When evaluating delivery of oxygen, the CaO2 is of critical importance. Each gram of hemoglobin carries 1.36 to 1.39 mL of oxygen if it is 100% saturated. Oxygen is poorly soluble in plasma and the dissolved oxygen contribution to arterial oxygen content is negligible. Therefore, saturation (SaO2) plays a more important role than pressure of oxygen (PaO2).
· Mixed venous oxygen content of blood (CvO2) is the amount of oxygen carried in the mixed venous blood. Low mixed venous oxygen content has similar clinical implications as low SvO2 and suggests decreased oxygen delivery or increased oxygen consumption (see above). Since the blood is sent for oximeter analysis for saturation value and not PvO2, the PvO2 value in the equation (Table 18.3) is usually substituted with the normal PvO2 value of 40 mm Hg since the amount dissolved is so small that a PvO2 substitution of 0 to 70 mm Hg will not make a difference in the calculation of CvO2.
· Delivery of oxygen indexed to BSA (DO2I) is the amount of oxygen delivered to the tissues by hemoglobin, arterial saturation, and flow (CI) (i.e., the product of cardiac index and arterial oxygen content of blood). The survival benefit of titrating to a specific DO2I value has been extensively studied as an end point of resuscitation with conflicting results. The controversy surrounding DO2 augmentation is discussed in the beginning of this chapter (10,14,21,22,25,32,91,92,93).
· Oxygen consumption indexed (VO2I): There are two methods of assessing oxygen consumption: Fick's principle and indirect calorimetry (94). Fick's principle states that the rate of diffusion of a known indicator (oxygen) is proportional to the product of concentration gradient and flow. Physiologically, this translates to the difference between arterial and mixed venous oxygen content multiplied by the cardiac output. Consumption can also be assessed by indirect calorimetry and is typically 3.5 mL of oxygen/kg (95). Indirect calorimetry compares the difference between inspired and expired oxygen to carbon dioxide ratios. There is usually a discrepancy (either way) of up to 11% between Fick's principle and indirect calorimetry, partially explained by Fick's method not accounting for pulmonary oxygen consumption (96,97,98,99). Shoemaker first noted that a higher VO2I of >160 mL/minute/m2 was associated with survival (3,4). It may reflect cells' ability to increase metabolic rate and utilize oxygen during stressed states. The concept of “critical DO2I” where VO2 becomes delivery dependent has been described in certain disease states with values occurring at DO2 of <450 mL oxygen/minute/m2(100,101,102). Although the concept is attractive, it is difficult to use VO2 as a therapeutic end point since VO2 varies constantly depending on sedation, temperature, paralysis, loop diuretics, complete mechanical ventilation, vasoactive agents, and the progress of the underlying disease process (6,15).
· Coronary perfusion pressure (CPP): In compliant vessels, flow to the coronary arteries can be augmented via coronary artery dilation. However, in patients with coronary artery disease with fixed vessels, flow depends on the pressure gradient between the two ends. Due to high LV pressures, coronaries feeding the LV fill during diastole, and maintenance of diastolic pressure is important. In patients undergoing preoperative optimization, nitroglycerin can be used to preferentially dilate nondiseased coronary vessels, thereby augmenting oxygen delivery to the myocytes. Generally CPP >50 mm Hg is desired, but there is individual variation.
Special Comment on Obesity and Derived Parameters
The validity of derived parameters indexed to body surface area has been questioned in morbidly obese patients. Several studies have demonstrated that derived parameters indexed to body surface area are appropriate and closely approximate indexing to body mass index. The large body surface area in the obese patient does not affect these measurements (103,104,105).
Complications of Pulmonary Artery Insertion
Pulmonary artery catheter insertion is an invasive procedure and carries inherent risks (106,107,108). Complications related to central venous access are discussed in other chapters. The overall complication rate associated with PACs can be as high as 25%. The procedural risks are pneumothorax, hemothorax, and knotting of catheters. Multiple prospective and retrospective studies have reported the most common complications including infection, thrombosis, arrhythmias, new bundle branch blocks, and pulmonary artery rupture (109,110). Serious complications (PA rupture and cardiac perforation with tamponade) are infrequent, but they can be fatal if unrecognized. Although reports of PAC-related infection are up to 22%, consequential bacteremia is relatively rare (0.7%–2.2%) (111). Catheters inserted for greater than 3 days may be associated with more infectious and thrombotic complications (112,113). Arrhythmias were relatively common, occurring in up to 75% of insertions. However, clinically significant arrhythmias requiring treatment were rare; 3% developed new bundle branch blocks, but this complication was not associated with increased mortality (109,110). Pulmonary artery rupture is exceedingly rare with a reported incidence of 0.031% (114) but usually occurs in patients with pulmonary hypertension and can be fatal due to high pulmonary pressures. Slow inflation of the balloon with immediate abortion if there is too much resistance or the waveform shows overwedging are important preventive maneuvers. Placement of pulmonary artery catheters requires skilled operators who are trained to troubleshoot and recognize complications when they occur. As discussed earlier in this chapter, perhaps the most dangerous complication of pulmonary artery catheters is the misinterpretation of information.
Arterial Lines
Indications for invasive pressure monitoring are (a) hypodynamic states including all forms of shock and (b) frequent blood sampling for blood gas analysis and labs. Other indications include monitoring of response to vasoactive agents and severe peripheral vascular disease precluding noninvasive blood pressure monitoring. There are no true absolute contraindications.
Arterial cannulation is relatively safe with nonocclusive thrombosis and hematoma being the most common complications (115). Selection of anatomic site is an important consideration; percutaneous arterial catheters can be introduced in the radial, brachial, axillary, femoral, and dorsalis pedis arteries. Placement in brachial arteries is ill advised; it is an end artery and patients may develop ipsilateral hand ischemia in up to 40% of insertions (116,117). The radial artery remains the most popular placement site due to its ease of access and relatively low complication rates. A preprocedure Allen test assesses the patency of collateral arteries, but this test has poor correlation with distal flow and likelihood of hand ischemia (118,119).
Pressure Measurement
Continuous measures of systolic blood pressure (SBP), diastolic blood pressure (DBP), and mean arterial pressure (MAP) are displayed with invasive arterial catheters. Four elements must be considered in direct pressure measurement: (a) energy content, (b) transformation of pressure pulse, (c) reflection of pressure wave, and (d) recording system. Each element can introduce error in invasive blood pressure monitoring rendering the often large discrepancy between cuff and invasive pressures. The SBP is determined by the ventricular ejection velocity and volume. This pulse wave meets increasing impedance as the caliber of vessels decrease. Additionally, pulse amplification is proportional to distance from aorta; consequently, the radial artery pressure tends to be higher than aortic pressure.
Volume and velocity of left ventricular ejection, peripheral resistance, distensibility of arterial wall, and viscosity of blood determine the peak SBP. Usage of long tubing (≥4 feet) or microbubbles in the closed system can result in inaccurate measurements, specifically underdamping and falsely high SBP. Underdamping produces characteristic waveforms with sharp and overshooting upstroke and small, artifact pressure waves along the waveform. Overdamped tracings are caused by kinking, macrobubbles, or mechanical obstruction of tubing. Overdamped waveforms are characteristically diminished in their upstroke and exhibit loss of the dicrotic notch. The dynamic response of arterial monitoring circuits is assessed by a fast flush square wave test (Fig. 18.4). A properly calibrated system produces one overdamped waveform followed by several oscillating overshoot waves (120).
Waveform analysis (Fig. 18.20) demonstrates the typical points associated with (a) systolic upstroke, (b) systolic peak, (c) systolic decline, (d) dicrotic notch, (e) diastolic runoff, and (f) end diastole. Examination of the arterial waveform provides useful information regarding a patient's clinical status. Left ventricular ejection produces the first, sharp upstroke at the beginning of aortic valve opening (Fig. 18.20, points 1 and 2). As the ventricular flow is dispersed peripherally, the waveform declines (point 3); this is also when the heart is in isovolumetric relaxation and diastolic filling. Just prior to closure of the aortic valve and as a result of isovolumetric relaxation, there is a slight drop in pressure known as the incisura (at the aorta) or dicrotic notch (at the periphery) (point 4). Further decrease in the pressure waveform reflects the runoff to distal arterioles (points 5 and 6). More peripheral arteries exhibit narrower waveforms and higher systolic pressures and wider pulse pressures, although the mean arterial pressure remains similar to central vessels. The etiology of varying pulse contours in the periphery is related to the elasticity, amplification, and distortion of smaller arteries (121). Various cardiac conditions produce characteristic arterial waveforms. In aortic stenosis, narrow waveform and loss of the dicrotic notch secondary to diseased valve are seen. Aortic regurgitation may exhibit widened pulse pressures and a sharp upstroke, sometimes accompanied by two peaks.
|
|
|
Figure 18.20. Arterial waveform analysis (see text for explanation of points 1–6). |
· Systolic pressure variation (SPV): Variations in systolic blood pressure and ventricular stroke volume are of greater magnitude in hypovolemic states (122). Theories on the etiology of this phenomenon relate to the characteristics unique to hypovolemia and include (a) the superior vena cava is more easily collapsible, (b) there is an increased effect of transmural pressures in the right atrium, and (c) the preload and stroke volume relationship is on the steep portion of the Frank-Starling curve. Usually, a decrease in left ventricular stroke volume occurs with inspiration due to the positive pressure ventilation. Originally, Perel described SPV as two components (Fig. 18.21)—delta up (Δup) and delta down (Δdown)—while emphasizing the strong correlation between Δdown and hypovolemic states (123,124,125). Δup is the difference between maximum SBP and a reference SBP (usually at expiratory pause during mechanical ventilation). Δdown is similarly the difference between minimum SBP and reference SBP and represents a decrease in stroke volume during expiration. SPV >10 mm Hg indicates hypovolemia and suggests responsiveness to fluid challenge (126). SPV also has significant correlation with the left ventricular end-diastolic area by echocardiogram (127) and PAOP (128). Note that SPV, like stroke volume variation, may be sensitive to changes in volume status, but may not necessarily equate to actual intravascular blood volume.
· Stroke volume variation (SVV): Arterial pressure variation during the respiratory cycle is a well-documented phenomenon (122). Pulsus paradoxicus describes falls in arterial pressures (>10 mm Hg) during inspiration and rises in pressures during expiration in spontaneously breathing patients. Reverse pulsus paradoxicus occurs in ventilated patients. Proprietary algorithms in new monitor devices analyze the pulse-to-pulse variation in a semi-continuous fashion with updates at 20-second intervals. SVV is not a measurement of absolute preload; rather, it is an assessment of response to fluid resuscitation (128,129,130,131). SVV >9.5% to 15% is associated with fluid responsiveness. SVV is only approved for use in sedated, mechanically ventilated patients who are in sinus rhythm (rhythm must be regular or the variation may be due to irregular rate rather than volume status).
SVV = (SV maximum - SV minimum)/[(SV maximum + SV minimum)/2] × 100
· Available technology on the market: Several companies market continuous arterial catheter cardiac output monitoring with several important distinctions. The main difference between the aforementioned technologies is that Lidco analyzes areas under a concentration curve, whereas Flotrac analyzes stroke volume based on pulse pressure variances.
|
|
|
Figure 18.21. Systolic pressure variation (SPV). See text. |
· LidcoPlus (Lidco, Cambridge, UK): LidcoPlus combines the previously validated Lidco lithium indicator dilution calibration procedure with continuous pulse contour analysis for real-time cardiac output assessment (132). A small amount of lithium chloride is injected in a vein and the concentration of arterial sampling over time produces a concentration-time curve. The area under this curve provides the cardiac output by integral mathematics. The manufacturer recommends calibration every 8 hours. Studies have shown that LidcoPlus provides similar cardiac output results as traditional pulmonary artery catheters over a wide range of hemodynamic states (133,134).
· FloTrac (Edwards Lifesciences, Irvine, CA, USA) features continuous cardiac output and stroke volume variation without need for calibration utilizing an existing arterial catheter. Assumptions are made regarding the patient's vascular compliance given his or her age, weight, and height. Proprietary software analyzes waveform contours beat to beat and evaluates cardiac output based on the concept that stroke volume is related to beat-to-beat pressure changes. The algorithm also takes into account the dynamic changes in vascular compliance by assessing the characteristic changes associated with alterations in vascular tone. Preliminary studies have demonstrated similar cardiac output results compared to intermittent, bolus thermodilution techniques (135). Although the use of SVV has only been validated in heavily sedated patients without spontaneous respirations and in sinus rhythm, preliminary data confirm that SVV may be utilized in spontaneously breathing patients with quiet respirations.
Summary
The value of any monitoring system is to impact outcomes. Although surrounded by controversy, there remains a group of patients who may benefit from invasive monitoring. It is imperative that technology is used by trained personnel who understand both the benefits and the limitations of the devices. Equally important is the concept of early resuscitation before the onset of multisystem organ failure. The next quantum leap in hemodynamic monitoring will come when we are able to treat patients with noninvasive technology with the goal of delivering oxygen to every tissue bed. It is also conceivable that if we can constantly measure with minimally invasive devices cardiac output and cardiac preload, intravascular blood volume status, central SvO2, and tissue oxygenation (see chapters on noninvasive cardiovascular monitoring, monitoring tissue perfusion, blood volume, and venous saturation monitoring), the PAC could become obsolete in the future. Until that time, it has been difficult to reproduce the continuous reliable information obtained from the PAC.
References
1. Connors AF Jr, Speroff T, Dawson NV, et al. The effectiveness of right heart catheterization in the initial care of critically ill patients. SUPPORT Investigators. JAMA. 1996;276(11):889.
2. Practice guidelines for pulmonary artery catheterization: an updated report by the American Society of Anesthesiologists Task Force on Pulmonary Artery Catheterization. Anesthesiology. 2003;99(4):988.
3. Shoemaker WC, Elwyn DH, Levin H, et al. Use of nonparametric analysis of cardiorespiratory variables as early predictors of death and survival in postoperative patients. J Surg Res. 1974;17(5):1.
4. Shoemaker WC, Montgomery ES, Kaplan E, et al. Physiologic patterns in surviving and nonsurviving shock patients. Use of sequential cardiorespiratory variables in defining criteria for therapeutic goals and early warning of death. Arch Surg. 1973;106(5):630.
5. Bihari D, Smithies M, Gimson A, et al. The effects of vasodilation with prostacyclin on oxygen delivery and uptake in critically ill patients. N Engl J Med. 1987;317(7):397.
6. Yu M, Burchell S, Takiguchi SA, et al. The relationship of oxygen consumption measured by indirect calorimetry to oxygen delivery in critically ill patients. J Trauma. 1996;41(1):41.
7. Rivers E, Nguyen B, Havstad S, et al. Early goal-directed therapy in the treatment of severe sepsis and septic shock. N Engl J Med. 2001;345(19):1368.
8. Moore FA, Haenel JB, Moore EE, et al. Incommensurate oxygen consumption in response to maximal oxygen availability predicts postinjury multiple organ failure. J Trauma. 1992;33(1):58.
9. Bishop MH, Shoemaker WC, Appel PL, et al. Relationship between supranormal circulatory values, time delays, and outcome in severely traumatized patients. Crit Care Med. 1993;21(1):56.
10. Fleming A, Bishop M, Shoemaker W, et al. Prospective trial of supranormal values as goals of resuscitation in severe trauma. Arch Surg. 1992;127(10):1175.
11. Gattinoni L, Brazzi L, Pelosi P, et al. A trial of goal-oriented hemodynamic therapy in critically ill patients. SvO2 Collaborative Group. N Engl J Med. 1995;333(16):1025.
12. Hayes MA, Timmins AC, Yau EH, et al. Elevation of systemic oxygen delivery in the treatment of critically ill patients. N Engl J Med. 1994;330(24):1717.
13. Wheeler AP, Bernard GR, Thompson BT, et al. Pulmonary-artery versus central venous catheter to guide treatment of acute lung injury. N Engl J Med. 2006;354(21):2213.
14. Yu M, Burchell S, Hasaniya NW, et al. Relationship of mortality to increasing oxygen delivery in patients > or = 50 years of age: a prospective, randomized trial. Crit Care Med. 1998;26(6):1011.
15. Yu M. Invasive and noninvasive oxygen consumption and hemodynamic monitoring in elderly surgical patients. New Horiz. 1996;4(4):443.
16. Yu M. Oxygen transport optimization. New Horiz. 1999;7:46.
17. Sandham JD, Hull RD, Brant RF, et al. A randomized, controlled trial of the use of pulmonary-artery catheters in high-risk surgical patients. N Engl J Med. 2003;348(1):5.
18. Iberti TJ, Daily EK, Leibowitz AB, et al. Assessment of critical care nurses' knowledge of the pulmonary artery catheter. The Pulmonary Artery Catheter Study Group. Crit Care Med. 1994;22(10):1674.
19. Iberti TJ, Fischer EP, Leibowitz AB, et al. A multicenter study of physicians' knowledge of the pulmonary artery catheter. Pulmonary Artery Catheter Study Group. JAMA. 1990;264(22):2928.
20. Komadina KH, Schenk DA, LaVeau P, et al. Interobserver variability in the interpretation of pulmonary artery catheter pressure tracings. Chest. 1991;100(6):1647.
21. Berlauk JF, Abrams JH, Gilmour IJ, et al. Preoperative optimization of cardiovascular hemodynamics improves outcome in peripheral vascular surgery. A prospective, randomized clinical trial. Ann Surg. 1991;214(3):289.
22. Shoemaker WC, Kram HB, Appel PL, et al. The efficacy of central venous and pulmonary artery catheters and therapy based upon them in reducing mortality and morbidity. Arch Surg. 1990;125(10):1332.
23. Gutierrez G, Palizas F, Doglio G, et al. Gastric intramucosal pH as a therapeutic index of tissue oxygenation in critically ill patients. Lancet. 1992;339(8787):195.
24. Shoemaker WC, Bayard DS, Wo CC, et al. Outcome prediction in chest injury by a mathematical search and display program. Chest. 2005;128(4):2739.
25. Yu M, Chapital A, Ho HC, et al. A prospective randomized trial comparing oxygen delivery versus transcutaneous pressure of oxygen values as resuscitative goals. Shock. 2007;27(6):615.
26. Yu M, Morita SY, Daniel SR, et al. Transcutaneous pressure of oxygen: a non-invasive and early detector of peripheral shock and outcome. Shock. 2006;26(5):450.
27. Cohn SM, Nathens AB, Moore FA, et al. Tissue oxygen saturation predicts the development of organ dysfunction during traumatic shock resuscitation. J Trauma. 2007;62(1):44.
28. De Backer D, Creteur J, Preiser JC, et al. Microvascular blood flow is altered in patients with sepsis. Am J Respir Crit Care Med. 2002;166(1):98.
29. Boerma EC, Mathura KR, van der Voort PH, et al. Quantifying bedside-derived imaging of microcirculatory abnormalities in septic patients: a prospective validation study. Crit Care. 2005;9(6):R601.
30. Yamauchi H, Biuk-Aghai E, Yu M, et al. Circulating blood volume measurements in crtically ill surgical patients correlate poorly with pulmonary artery catheter measurements. Hawaii Med J. 2008;67(1):8–11.
31. ACC/AHA guideline for perioperative cardiovascular evaluation for noncardiac surgery–executive summary. Circulation. 2002;105:1257.
32. Boyd O, Grounds RM, Bennett ED. A randomized clinical trial of the effect of deliberate perioperative increase of oxygen delivery on mortality in high-risk surgical patients. JAMA. 1993;270(22):2699.
33. Wilson RJ, Woods I. Cardiovascular optimization for high-risk surgery. Curr Opin Crit Care. 2001;7(3):195.
34. Eisenberg PR, Jaffe AS, Schuster DP. Clinical evaluation compared to pulmonary artery catheterization in the hemodynamic assessment of critically ill patients. Crit Care Med. 1984;12(7):549.
35. Tuman KJ, Carroll GC, Ivankovich AD. Pitfalls in interpretation of pulmonary artery catheter data. J Cardiothorac Anesth. 1989;3(5):625.
36. Connors AF Jr, McCaffree DR, Gray BA. Evaluation of right-heart catheterization in the critically ill patient without acute myocardial infarction. N Engl J Med. 1983;308(5):263.
37. Civetta JM. Pulmonary artery catheter insertion. In: Sprung C, ed. The Pulmonary Artery Catheter: Methodology and Clinical Application. Baltimore: University Park Press; 1983:21.
38. Swan HJ, Ganz W, Forrester J, et al. Catheterization of the heart in man with use of a flow-directed balloon-tipped catheter. N Engl J Med. 1970;283(9):447.
39. Morris AH, Chapman RH. Wedge pressure confirmation by aspiration of pulmonary capillary blood. Crit Care Med. 1985;13(9):756.
40. Kett D, Schein R. Techniques for pulmonary artery catheter insertion. In: Sprung C, ed. The Pulmonary Artery Catheter: Methodology and Clinical Applications. Baltimore: University Park Press; 1993:43.
41. Daily EK, Schroeder JS. Principles and hazards of monitoring equipment. In: Techniques in Bedside Hemodynamic Monitoring. St. Louis: The C.V. Mosby Company; 1989:34.
42. Sarin CL, Yalav E, Clement AJ, et al. The necessity for measurement of left atrial pressure after cardiac valve surgery. Thorax. 1970;25(2):185.
43. Civetta JM, Gabel JC. Flow directed-pulmonary artery catheterization in surgical patients: indications and modifications of technic. Ann Surg. 1972;176(6):753.
44. Thompson I, Dalton B, Lappas D. Right bundle-branch block and complete heart block caused by the Swan-Ganz catheter. Anesthesiology. 1979;51:359.
45. Shah KB, Rao TL, Laughlin S, et al. A review of pulmonary artery catheterization in 6,245 patients. Anesthesiology. 1984;61(3):271.
46. Sharkey SW. Beyond the wedge: clinical physiology and the Swan-Ganz catheter. Am J Med. 1987;83(1):111.
47. Leatherman J, Marini J. Pulmonary artery catheter: pressure monitoring. In: Sprung C, ed. The Pulmonary Artery Catheter: Methodology and Clinical Applications. Baltimore: University Park Press; 1993:119.
48. Zapol W, Snider M, Rie M, et al. Pulmonary circulation during adult respiratory distress syndrome. In: Zapol W, Falke K, eds. Acute Respiratory Failure. New York: Marcel Dekker, Inc.; 1985:241.
49. Raper R, Sibbald WJ. Misled by the wedge? The Swan-Ganz catheter and left ventricular preload. Chest. 1986;89(3):427.
50. Fisher ML, De Felice CE, Parisi AF. Assessing left ventricular filling pressure with flow-directed (Swan-Ganz) catheters. Detection of sudden changes in patients with left ventricular dysfunction. Chest. 1975;68(4):542.
51. Schuster DP, Seeman MD. Temporary muscle paralysis for accurate measurement of pulmonary artery occlusion pressure. Chest. 1983;84:593–597.
52. Lappas D, Lell WA, Gabel JC, et al. Indirect measurement of left-atrial pressure in surgical patients–pulmonary-capillary wedge and pulmonary-artery diastolic pressures compared with left-atrial pressure. Anesthesiology. 1973;38(4):394.
53. West JB, Dollery CT, Naimark A. Distribution of blood flow in isolated lung; relation to vascular and alveolar pressures. J Appl Physiol. 1964;19:713.
54. O'Quin R, Marini JJ. Pulmonary artery occlusion pressure: clinical physiology, measurement, and interpretation. Am Rev Respir Dis. 1983;128(2):319.
55. Cope DK, Allison RC, Parmentier JL, et al. Measurement of effective pulmonary capillary pressure using the pressure profile after pulmonary artery occlusion. Crit Care Med. 1986;14(1):16.
56. Lozman J, Powers SR Jr, Older T, et al. Correlation of pulmonary wedge and left atrial pressures. A study in the patient receiving positive end expiratory pressure ventilation. Arch Surg. 1974;109(2):270.
57. Civetta JM. Invasive catheterization. In: Shoemaker W, Thompson W, eds. Critical Care: State of the Art. Fullerton, CA: Society of Critical Care Medicine; 1980:1.
58. Carter RS, Snyder JV, Pinsky MR. LV filling pressure during PEEP measured by nadir wedge pressure after airway disconnection. Am J Physiol. 1985;249(4 Pt 2):H770.
59. De Campo T, Civetta JM. The effect of short-term discontinuation of high-level PEEP in patients with acute respiratory failure. Crit Care Med. 1979;7(2):47.
60. Rahimtoola SH. Left ventricular end-diastolic and filling pressures in assessment of ventricular function. Chest. 1973;63(6):858.
61. Longman J, Powers S, Older T, et al. Correlation of pulmonary wedge and left atrial pressures. Arch Surg. 1974;109:270.
62. Parker JO, Case RB. Normal left ventricular function. Circulation. 1979;60(1):4.
63. Packman MI, Rackow EC. Optimum left heart filling pressure during fluid resuscitation of patients with hypovolemic and septic shock. Crit Care Med. 1983;11(3):165.
64. Guyton AC, Lindsey AW. Effect of elevated left atrial pressure and decreased plasma protein concentration on the development of pulmonary edema. Circ Res. 1959;7(4):649.
65. Zwissler B, Briegel J. Right ventricular catheter. Curr Opin Crit Care. 1998;4:177.
66. Diebel L, Wilson RF, Heins J, et al. End-diastolic volume versus pulmonary artery wedge pressure in evaluating cardiac preload in trauma patients. J Trauma. 1994;37(6):950.
67. Durham R, Neunaber K, Vogler G, et al. Right ventricular end-diastolic volume as a measure of preload. J Trauma. 1995;39(2):218.
68. Chang MC, Black CS, Meredith JW. Volumetric assessment of preload in trauma patients: addressing the problem of mathematical coupling. Shock. 1996;6(5):326.
69. European Society of Intensive Care Medicine. Expert panel: the use of the pulmonary artery catheter. Intensive Care Med. 1991;17(3):I.
70. Conway J, Lund-Johansen P, Thermodilution method for measuring cardiac output. Eur Heart J. 1990;11(Suppl I):17.
71. Olsson B, Pool J, Vandermoten P, et al. Validity and reproducibility of determination of cardiac output by thermodilution in man. Cardiology. 1970;55(3):136.
72. Harris AP, Miller CF, Beattie C, et al. The slowing of sinus rhythm during thermodilution cardiac output determination and the effect of altering injectate temperature. Anesthesiology. 1985;63(5):540.
73. Elkayam U, Berkley R, Azen S, et al. Cardiac output by thermodilution technique. Effect of injectate's volume and temperature on accuracy and reproducibility in the critically ill patient. Chest. 1983;84(4):418.
74. Le Tulzo Y, Belghith M, Seguin P, et al. Reproducibility of thermodilution cardiac output determination in critically ill patients: comparison between bolus and continuous method. J Clin Monit. 1996;12(5):379.
75. Seguin P, Colcanap O, Le Rouzo A, et al. Evaluation of a new semi-continuous cardiac output system in the intensive care unit. Can J Anaesth. 1998;45(6):578.
76. Burchell SA, Yu M, Takiguchi SA, et al. Evaluation of a continuous cardiac output and mixed venous oxygen saturation catheter in critically ill surgical patients. Crit Care Med. 1997;25(3):388.
77. Rivers E. The outcome of patients presenting to the emergency department with severe sepsis or septic shock. Crit Care. 2006;10(4):154.
78. Rivers EP, Nguyen HB, Huang DT, et al. Early goal-directed therapy. Crit Care Med. 2004;32(1):314.
79. Otero RM, Nguyen HB, Huang DT, et al. Early goal-directed therapy in severe sepsis and septic shock revisited: concepts, controversies, and contemporary findings. Chest. 2006;130(5):1579.
80. Katz AM. Ernest Henry Starling, his predecessors, and the “Law of the Heart”. Circulation. 2002;106(23):2986.
81. Chang MC, Mondy JS, Meredith JW, et al. Redefining cardiovascular performance during resuscitation: ventricular stroke work, power, and the pressure-volume diagram. J Trauma. 1998;45(3):470.
82. Martin RS, Norris PR, Kilgo PD, et al. Validation of stroke work and ventricular arterial coupling as markers of cardiovascular performance during resuscitation. J Trauma. 2006;60(5):930.
83. Barst RJ, McGoon M, Torbicki A, et al. Diagnosis and differential assessment of pulmonary arterial hypertension. J Am Coll Cardiol. 2004;43(12 Suppl S):40S.
84. Chin KM, Kim NH, Rubin LJ. The right ventricle in pulmonary hypertension. Coron Artery Dis. 2005;16(1):13.
85. Benza RL, Park MH, Keogh A, et al. Management of pulmonary arterial hypertension with a focus on combination therapies. J Heart Lung Transplant. 2007;26(5):437.
86. Girgis RE, Mathai SC. Pulmonary hypertension associated with chronic respiratory disease. Clin Chest Med. 2007;28(1):219.
87. O'Callaghan D, Gaine SP. Combination therapy and new types of agents for pulmonary arterial hypertension. Clin Chest Med. 2007;28(1):169.
88. Oudiz RJ. Pulmonary hypertension associated with left-sided heart disease. Clin Chest Med. 2007;28(1):233.
89. Ryu JH, Krowka MJ, Pellikka PA, et al. Pulmonary hypertension in patients with interstitial lung diseases. Mayo Clin Proc. 2007;82(3):342.
90. Zamanian RT, Haddad F, Doyle RL, et al. Management strategies for patients with pulmonary hypertension in the intensive care unit. Crit Care Med. 2007;35(9):2037.
91. Fenwick E, Wilson J, Sculpher M, et al. Pre-operative optimisation employing dopexamine or adrenaline for patients undergoing major elective surgery: a cost-effectiveness analysis. Intensive Care Med. 2002;28(5):599.
92. Kern JW, Shoemaker WC. Meta-analysis of hemodynamic optimization in high-risk patients. Crit Care Med. 2002;30(8):1686.
93. Yu M, Takanishi D, Myers SA, et al. Frequency of mortality and myocardial infarction during maximizing oxygen delivery: a prospective, randomized trial. Crit Care Med. 1995;23(6):1025.
94. Hanique G, Dugernier T, Laterre PF, et al. Evaluation of oxygen uptake and delivery in critically ill patients: a statistical reappraisal. Intensive Care Med. 1994;20(1):19.
95. Brandi LS, Bertolini R, Calafa M. Indirect calorimetry in critically ill patients: clinical applications and practical advice. Nutrition. 1997;13(4):349.
96. Peyton PJ, Robinson GJ. Measured pulmonary oxygen consumption: difference between systemic oxygen uptake measured by the reverse Fick method and indirect calorimetry in cardiac surgery. Anaesthesia. 2005;60(2):146.
97. Bizouarn P, Blanloeil Y, Pinaud M. Comparison between oxygen consumption calculated by Fick's principle using a continuous thermodilution technique and measured by indirect calorimetry. Br J Anaesth. 1995;75(6):719.
98. Oudemans-van Straaten HM, Scheffer GJ. Oxygen consumption after cardiopulmonary bypass–different measuring methods yield different results. Intensive Care Med. 1994;20(6):458.
99. Smithies MN, Royston B, Makita K, et al. Comparison of oxygen consumption measurements: indirect calorimetry versus the reversed Fick method. Crit Care Med. 1991;19(11):1401.
100. Lorente JA, Renes E, Gomez-Aguinaga MA, et al. Oxygen delivery-dependent oxygen consumption in acute respiratory failure. Crit Care Med. 1991;19(6):770.
101. Appel PL, Shoemaker WC. Relationship of oxygen consumption and oxygen delivery in surgical patients with ARDS. Chest. 1992;102(3):906.
102. Schumacker PT, Cain SM. The concept of a critical oxygen delivery. Intensive Care Med. 1987;13(4):223.
103. Beutler S, Schmidt U, Michard F. Hemodynamic monitoring in obese patients: a big issue. Crit Care Med. 2004;32(9):1981.
104. Collis T, Devereux RB, Roman MJ, et al. Relations of stroke volume and cardiac output to body composition: the strong heart study. Circulation. 2001;103(6):820.
105. Stelfox HT, Ahmed SB, Ribeiro RA, et al. Hemodynamic monitoring in obese patients: the impact of body mass index on cardiac output and stroke volume. Crit Care Med. 2006;34(4):1243.
106. Hadian M, Pinsky MR. Evidence-based review of the use of the pulmonary artery catheter: impact data and complications. Crit Care. 2006;10(Suppl 3):S8.
107. Carrico CJ, Horovitz JH. Monitoring the critically ill surgical patient. Adv Surg. 1977;11:101.
108. McNally JB. Invasive monitoring with the Swan-Ganz catheter. Ariz Med. 1974;31(6):421.
109. Sprung CL, Elser B, Schein RM, et al. Risk of right bundle-branch block and complete heart block during pulmonary artery catheterization. Crit Care Med. 1989;17(1):1.
110. Sprung CL, Pozen RG, Rozanski JJ, et al. Advanced ventricular arrhythmias during bedside pulmonary artery catheterization. Am J Med. 1982;72(2):203.
111. Payen D, Gayat E. Which general intensive care unit patients can benefit from placement of the pulmonary artery catheter? Crit Care. 2006;10(Suppl 3):S7.
112. Sise MJ, Hollingsworth P, Brimm JE, et al. Complications of the flow-directed pulmonary artery catheter: a prospective analysis in 219 patients. Crit Care Med. 1981;9(4):315.
113. Rosenwasser RH, Jallo JI, Getch CC, et al. Complications of Swan-Ganz catheterization for hemodynamic monitoring in patients with subarachnoid hemorrhage. Neurosurgery. 1995;37(5):872.
114. Kearney TJ, Shabot MM. Pulmonary artery rupture associated with the Swan-Ganz catheter. Chest. 1995;108(5):1349.
115. Slogoff S, Keats AS, Arlund C. On the safety of radial artery cannulation. Anesthesiology. 1983;59(1):42.
116. Mortensen JD. Clinical sequelae from arterial needle puncture, cannulation, and incision. Circulation. 1967;35(6):1118.
117. Barnes RW, Petersen JL, Krugmire RB Jr, et al. Complications of brachial artery catheterization: prospective evaluation with the Doppler ultrasonic velocity detector. Chest. 1974;66(4):363.
118. Mangar D, Thrush DN, Connell GR, et al. Direct or modified Seldinger guide wire-directed technique for arterial catheter insertion. Anesth Analg. 1993;76(4):714.
119. Barone JE, Madlinger RV. Should an Allen test be performed before radial artery cannulation? J Trauma. 2006;61(2):468.
120. Gardner RM. Direct blood pressure measurement–dynamic response requirements. Anesthesiology. 1981;54(3):227.
121. O'Rourke MF, Yaginuma T. Wave reflections and the arterial pulse. Arch Intern Med. 1984;144(2):366.
122. Michard F. Changes in arterial pressure during mechanical ventilation. Anesthesiology. 2005;103(2):419.
123. Perel A. The value of delta Down during haemorrhage. Br J Anaesth. 1999;83(6):967.
124. Perel A. Assessing fluid responsiveness by the systolic pressure variation in mechanically ventilated patients. Systolic pressure variation as a guide to fluid therapy in patients with sepsis-induced hypotension. Anesthesiology. 1998;89(6):1309.
125. Perel A. Arterial pressure waveform analysis during hypovolemia. Anesth Analg. 1996;82(3):670.
126. Rick JJ, Burke SS. Respirator paradox. South Med J. 1978;71(11):1376.
127. Coriat P, Vrillon M, Perel A, et al. A comparison of systolic blood pressure variations and echocardiographic estimates of end-diastolic left ventricular size in patients after aortic surgery. Anesth Analg. 1994;78(1):46.
128. Preisman S, Kogan S, Berkenstadt H, et al. Predicting fluid responsiveness in patients undergoing cardiac surgery: functional haemodynamic parameters including the Respiratory Systolic Variation Test and static preload indicators. Br J Anaesth. 2005;95(6):746.
129. Michard F, Teboul JL. Predicting fluid responsiveness in ICU patients: a critical analysis of the evidence. Chest. 2002;121(6):2000.
130. Berkenstadt H, Friedman Z, Preisman S, et al. Pulse pressure and stroke volume variations during severe haemorrhage in ventilated dogs. Br J Anaesth. 2005;94(6):721.
131. Berkenstadt H, Margalit N, Hadani M, et al. Stroke volume variation as a predictor of fluid responsiveness in patients undergoing brain surgery. Anesth Analg. 2001;92(4):984.
132. Linton R, Band D, O'Brien T, et al. Lithium dilution cardiac output measurement: a comparison with thermodilution. Crit Care Med. 1997;25(11):1796.
133. Kurita T, Morita K, Kato S, et al. Lithium dilution cardiac output measurements using a peripheral injection site comparison with central injection technique and thermodilution. J Clin Monit Comput. 1999;15(5):279.
134. Linton RA, Jonas MM, Tibby SM, et al. Cardiac output measured by lithium dilution and transpulmonary thermodilution in patients in a paediatric intensive care unit. Intensive Care Med. 2000;26(10):1507.
135. McGee WT, Horswell JL, Calderon J, et al. Validation of a continuous, arterial pressure-based cardiac output measurement: a multicenter, prospective clinical trial. Crit Care. 2007;11(5):R105.