This chapter combines Dr. Stoelting’s elegant description of pharmacology with a mathematical approach first presented by Dr. Shafer1 in 1997, and most recently in Miller’s Anesthesia textbook.2,3 The combination of approaches sets a foundation for the pharmacology presented in the subsequent chapters. It also explains the fundamental principles of drug behavior and drug interaction that govern our daily practice of anesthesia.
Receptor Theory
A drug that activates a receptor by binding to that receptor is called an agonist. Most agonists bind through a combination of ionic, hydrogen, and van der Waals interactions (the sum of the attractive or repulsive forces between molecules), making them reversible. Rarely, an agonist will bind covalently to the receptor, rendering the interaction irreversible. Receptors are often envisioned as proteins that are either unbound or are bound to the agonist ligand. When the receptor is bound to the agonist ligand, the effect of the drug is produced. When the receptor is not bound, there is no effect. The receptor state is seen as binary: It is either unbound, resulting in one conformation, or it is bound, resulting in another conformation. Agonists are often portrayed as simply activating a receptor (Fig. 2-1). In this view, the magnitude of the drug effect reflects the total number of receptors that are bound. In this simplistic view, the “most” drug effect occurs when every receptor is bound.

This simple view helps to understand the action of an antagonist (Fig. 2-2). An antagonist is a drug that binds to the receptor without activating the receptor. Antagonists typically bind with ionic, hydrogen, and van der Waals interactions, rendering them reversible. Antagonists block the action of agonists simply by getting in the way of the agonist, preventing the agonist from binding to the receptor and producing the drug effect. Competitive antagonismis present when increasing concentrations of the antagonist progressively inhibit the response to the agonist. This causes a rightward displacement of the agonist dose-response (or concentration-response) relationship. Noncompetitive antagonism is present when, after administration of an antagonist, even high concentrations of agonist cannot completely overcome the antagonism. In this instance, either the agonist is bound irreversibly (and probably covalently) to the receptor site, or it binds to a different site on the molecule and the interaction is allosteric (based on a change in shape and thereby the activity of the receptor). Noncompetitive antagonism causes both a rightward shift of the dose-response relationship as well as a decreased maximum efficacy of the concentration versus response.

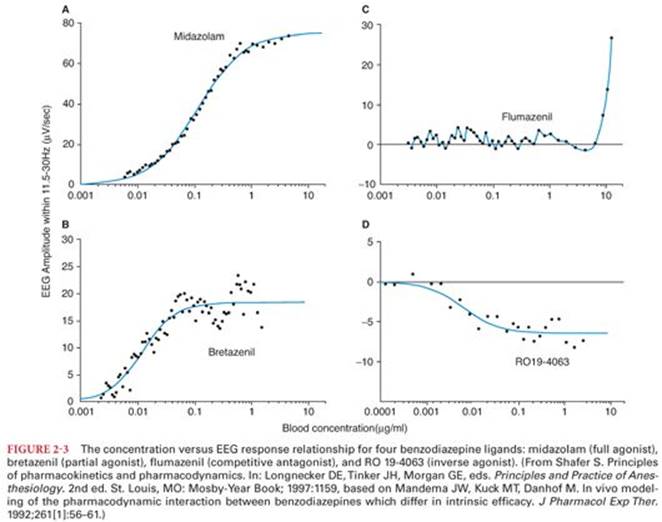
Although this simple view of activated and inactivated receptors explains agonists and antagonists, it has a more difficult time with partial agonists and inverse agonists (Fig. 2-3). A partial agonist is a drug that binds to a receptor (usually at the agonist site) where it activates the receptor but not as much as a full agonist. Even at supramaximal doses, a partial agonist cannot cause the full drug effect. Partial agonists may also have antagonist activity in which case they are also called agonist-antagonists. When a partial agonist is administered with a full agonist, it decreases the effect of the full agonist. For example, butorphanol acts as a partial agonist at the µ opioid receptor. Given alone, butorphanol is a modestly efficacious analgesic. Given along with fentanyl, it will partly reverse the fentanyl analgesia, and in individuals using opioids chronically, may precipitate withdrawal. Inverse agonists bind at the same site as the agonist (and likely compete with it), but they produce the opposite effect of the agonist. Inverse agonists “turn off” the constitutive activity of the receptor. The simple view of receptors as bound or unbound does not explain partial agonists or inverse agonists.
It turns out that receptors have many natural conformations, and they naturally fluctuate between these different conformations (Fig. 2-4). Some of the conformations are associated with the pharmacologic effect, and some are not. In the example shown, the receptor only has two states: an inactive state and an active state that produces the same effect as if an agonist were bound to the receptor, although at a reduced level because the receptor only spends 20% of its time in this activated state.

In this view, ligands do not cause the receptor shape to change. That happens spontaneously. However, ligands change the ratio of active to inactive states by (thermodynamically) favoring one of the states. Figure 2-5 shows the receptor as seen in Figure 2-4 in the presence of an agonist, a partial agonist, an antagonist, and an inverse agonist. Presence of the full agonist causes the conformation of the active state to be strongly favored, causing the receptors to be in this state nearly 100% of the time. The partial agonist is not as effective in stabilizing the receptor in the active state, so the bound receptor only spends 50% of its time in this state. The antagonist does not favor either state; it just gets in the way of binding (as before; see Fig. 2-2). The inverse agonist favors the inactive state, reversing the baseline receptor activity.

Using this information, we can now interpret the action of several ligands for the benzodiazepine receptor (see Fig. 2-3). The actions include full agonism (midazolam), partial agonism (bretazenil), competitive antagonism (flumazenil), and inverse agonism (RO 19-4063). This range of actions can be explained by considering receptor states. Assume that the γ-aminobutyric acid (GABA) receptor has several conformations, one of which is particularly sensitive to endogenous GABA. Typically, there are some GABA receptors in this more sensitive conformation. As a full agonist, midazolam causes nearly all of the GABA receptors to be in the confirmation with increased sensitivity to GABA. Bretazenil does the same thing but not as well. Even when every benzodiazepine receptor is occupied by bretazenil, fewer GABA receptors are in the more sensitive confirmation. Bretazenil simply does not favor that conformation as well as midazolam. When flumazenil is in the binding pocket, it does not change the relative probabilities of the receptor being in any conformation. Flumazenil just gets in the way of other drugs that would otherwise bind to the pocket. RO 19-4063 actually decreases the number of GABA receptors in the more sensitive conformation. Usually, some of them are in this more sensitive conformation, but that number is decreased by the inverse agonist RO 19-4063 (which was never developed as a drug because endogenous benzodiazepines, although anticipated, have not been described). The notion of the drugs having multiple conformations, and drugs acting through favoring particular conformations, helps to understand the action of agonists, partial agonists, antagonists, and inverse agonists.
Receptor Action
The number for receptors in cell membranes is dynamic and increases (upregulates) or decreases (downregulates) in response to specific stimuli. For example, a patient with pheochromocytoma has an excess of circulating catecholamines. In response, there is a decrease in the numbers of β-adrenergic receptors in cell membranes in an attempt to maintain homeostasis. Likewise, prolonged treatment of asthma with a β agonist may result in tachyphylaxis (decreased response to the same dose of β agonist, also called tolerance) because of the decrease in β adrenergic receptors. Conversely, lower motor neuron injury causes an increase in the number of nicotinic acetylcholine receptors in the neuromuscular junction, leading to an exaggerated response to succinylcholine. Changing receptor numbers is one of many mechanisms that contribute to variability in response to drugs.
Receptor Types
Receptors for drug action can be classified by location. Many of the receptors thought to be the most critical for anesthetic interaction are located in the lipid bilayer of cell membranes. For example, opioids, intravenous sedative hypnotics, benzodiazepines, β blockers, catecholamines, and muscle relaxants (most of which are actually antagonists) all interact with membrane-bound receptors. Other receptors are intracellular proteins. Drugs such as caffeine, insulin, steroids, theophylline, and milrinone interact with intracellular proteins. Circulating proteins can also be drug targets; for example, the many drugs that affect components of the coagulation cascade.
There are also drugs that do not interact with proteins at all. Stomach antacids such as sodium citrate simply work by changing gastric pH. Chelating drugs work by binding divalent cations. Iodine kills bacteria by osmotic pressure (intracellular desiccation), and intravenous sodium bicarbonate changes plasma pH. The mechanism of action of these drugs does not involve receptors per se, and hence these drugs will not be further considered in this section.
Proteins function in the body as small machines, catalyzing enzymatic reactions and acting as ion channels among other functions. When a drug binds to a receptor, it changes the activity of the machine, typically by enhancing its activity (e.g., propofol increases the sensitivity of the GABA-A receptor to GABA, the endogenous ligand), decreasing its activity (ketamine decreases the activity of the N-methyl-D-aspartate [NMDA] receptor), or triggering a chain reaction (opioid binding to the µ opioid receptor activates an inhibitory G protein that decreases adenylyl cyclase activity). The protein’s response to binding of the drug is responsible for the drug effect.
Pharmacokinetics
Pharmacokinetics is the quantitative study of the absorption, distribution, metabolism, and excretion of injected and inhaled drugs and their metabolites. Thus, pharmacokinetics describes what the body does to a drug. Pharmacodynamics is the quantitative study of the body’s response to a drug. Thus, pharmacodynamics describes what the drug does to the body. This section will introduce the basic principles of pharmacokinetics. The next section discusses the basic principles of pharmacodynamics.
Pharmacokinetics determines the concentration of a drug in the plasma or at the site of drug effect. Pharmacokinetic variability is a significant component of patient-to-patient variability in drug response and may result from genetic modifications in metabolism; interactions with other drugs; or disease in the liver, kidneys, or other organs of metabolism.4
The basic principles of pharmacokinetics are absorption, metabolism, distribution, and elimination. These processes are fundamental to all drugs. They can be described in basic physiologic terms or using mathematical models. Each serves a purpose. Physiology can be used to predict how changes in organ function will affect the disposition of drugs. Mathematical models can be used to calculate the concentration of drug in the blood or tissue following any arbitrary dose, at any arbitrary time. We will initially tackle the physiologic principles that govern distribution, metabolism, elimination, and absorption, in that order. We will then turn to the mathematical models.
Distribution
When drugs are administered, they mix with body tissues and are immediately diluted from the concentrated injectate in the syringe to the more dilute concentration measured in the plasma or tissue. This initial distribution (within 1 minute) after bolus injection is considered mixing within the “central compartment” (Fig. 2-6). The central compartment is physically composed of those elements of the body that dilute the drug within the first minute after injection: the venous blood volume of the arm, the volume of the great vessels, the heart, the lung, and the upper aorta, and whatever uptake of drug occurs in the first passage through the lungs. Many of these volumes are fixed, but drugs that are highly fat soluble may be avidly taken up in the first passage through the lung, reducing the concentration measured in the arterial blood and increasing the apparent size of the central compartment. For example, first-pass pulmonary uptake of the initial dose of lidocaine, propranolol, meperidine, fentanyl, sufentanil, and alfentanil exceeds 65% of the dose.5

The body is a complex space, and mixing is an ongoing process. Almost by definition, the central compartment is the mixing with a small portion of the blood volume and the lung tissue. Several minutes later, the drug will fully mix with the entire blood volume. However, it may take hours or even days for the drug to fully mix with all bodily tissues because some tissues have very low perfusion.
In the process of mixing, molecules are drawn to other molecules, some with specific binding sites. A drug that is polar will be drawn to water, where the polar water molecules find a low energy state by associating with the charged aspects of the molecule. A drug that is nonpolar has a higher affinity for fat, where van der Waals binding provides numerous weak binding sites. Many anesthetic drugs are highly fat soluble and poorly soluble in water. High fat solubility means that the molecule will have a large volume of distribution because it will be preferentially taken up by fat, diluting the concentration in the plasma. The extreme example of this is propofol, which is almost inseparable from fat. The capacity of body fat to hold propofol is so vast that in some studies the total volume of distribution of propofol has been reported as exceeding 5,000 L. Of course, nobody has a total volume of 5,000 L. It is important to understand that those 5,000 L refer to imaginary aqueous liters or the amount of plasma that would be required to dissolve the initial dose of propofol. Because propofol is so fat soluble, a large amount of propofol is dissolved in the body’s fatty tissues and the concentration measured in the plasma will be low.
Following bolus injection, the drug primarily goes to the tissues that receive the bulk of arterial blood flow: the brain, heart, kidneys, and liver. These tissues are often called the vessel rich group. The rapid blood flow ensures that the concentration in these highly perfused tissues rises rapidly to equilibrate with arterial blood. However, for highly fat soluble drugs, the capacity of the fat to hold the drug greatly exceeds the capacity of highly perfused tissues. Initially, the fat compartment is almost invisible because the blood supply to fat is quite limited. However, with time, the fat gradually absorbs more and more drug, sequestering it away from the highly perfused tissues. This redistribution of drug from the highly perfused tissue to the fat accounts for a substantial part of the offset of drug effect following a bolus of an intravenous anesthetic or fat-soluble opioid (e.g., fentanyl). Muscles play an intermediate role in this process, having (at rest) blood flow that is intermediate between highly perfused tissues and fat.
Protein Binding
Most drugs are bound to some extent to plasma proteins, primarily albumin, α1-acid glycoprotein, and lipoproteins.6 Most acidic drugs bind to albumin, whereas basic drugs bind to α1-acid glycoprotein. Protein binding effects both the distribution of drugs (because only the free or unbound fraction can readily cross cell membranes) and the apparent potency of drugs, again because it is the free fraction that determines the concentration of bound drug on the receptor.
The extent of protein binding parallels the lipid solubility of the drug. This is because drugs that are hydrophobic are more likely to bind to proteins in the plasma and to lipids in the fat. For intravenous anesthetic drugs, which tend to be quite potent, the number of available protein binding sites in the plasma vastly exceeds the number of sites actually bound. As a result, the fraction bound is not dependent on the concentration of the anesthetic and only dependent on the protein concentration.
Binding of drugs to plasma albumin is nonselective, and drugs with similar physicochemical characteristics may compete with each other and with endogenous substances for the same protein binding sites. For example, sulfonamides can displace unconjugated bilirubin from binding sites on albumin, leading to the risk of bilirubin encephalopathy in the neonate.
Age, hepatic disease, renal failure, and pregnancy can all result in decreased plasma protein concentration. Alterations in protein binding are important only for drugs that are highly protein bound (e.g., >90%). For such drugs, the free fraction changes as an inverse proportion with a change in protein concentration. If the free fraction is 2% in the normal state, then in a patient with 50% decrease in plasma proteins, the free fraction will increase to 4%, a 100% increase.
Theoretically, an increase in free fraction of a drug may increase the pharmacologic effect of the drug, but in practice, it is far from certain that there will be any change in pharmacologic effect at all. The reason is that it is the unbound fraction that equilibrates throughout the body, including with the receptor. Plasma proteins only account for a small portion of the total binding sites for drug in the body. Because the free drug concentration in the plasma and tissues represents partitioning with all binding sites, not just the plasma binding sites, the actual free drug concentration that drives drug on and off receptors may change fairly little with changes in plasma protein concentration.
Metabolism
Metabolism converts pharmacologically active, lipid-soluble drugs into water-soluble and usually pharmacologically inactive metabolites. However, this is not always the case. For example, diazepam and propranolol may be metabolized to active compounds. Morphine-6-glucuronide, a metabolite of morphine, is a more potent opioid than morphine itself. In some instances, an inactive parent compound (prodrug) metabolized to an active drug. This is the case with codeine, which is an exceedingly weak opioid. Codeine is metabolized to morphine, which is responsible for the analgesic effects of codeine.
Pathways of Metabolism
The four basic pathways of metabolism are (a) oxidation, (b) reduction, (c) hydrolysis, and (d) conjugation. Traditionally, metabolism has been divided into phase I and phase II reactions. Phase I reactions include oxidation, reduction, and hydrolysis, which increase the drug’s polarity and prepare it for phase II reactions. Phase II reactions are conjugation reactions that covalently link the drug or metabolites with a highly polar molecule (carbohydrate or an amino acid) that renders the conjugate more water soluble for subsequent excretion. Hepatic microsomal enzymes are responsible for the metabolism of most drugs. Other sites of drug metabolism include the plasma (Hofmann elimination, ester hydrolysis), lungs, kidneys, and gastrointestinal tract and placenta (tissue esterases).
Hepatic microsomal enzymes, which participate in the metabolism of many drugs, are located principally in hepatic smooth endoplasmic reticulum. These microsomal enzymes are also present in the kidneys, gastrointestinal tract, and adrenal cortex. Microsomes are vesicle-like artifacts re-formed from pieces of the endoplasmic reticulum when cells are homogenized; microsomal enzymes are those enzymes that are concentrated in these vesicle-like artifacts.
Phase I Enzymes
Enzymes responsible for phase I reactions include cytochrome P450 enzymes, non–cytochrome P450 enzymes, and flavin-containing monooxygenase enzymes. The cytochrome P450 enzyme (CYP) system is a large family of membrane-bound proteins containing a heme cofactor that catalyze the metabolism of endogenous compounds. P450 enzymes are predominantly hepatic microsomal enzymes although there are also mitochondrial P450 enzymes. The designation cytochrome P450 emphasizes this substance’s absorption peak at 450 nm when it is combined with carbon monoxide. The cytochrome P450 system is also known as the mixed function oxidase system because it involves both oxidation and reduction steps; the most common reaction catalyzed by cytochrome P450 is the monooxygenase reaction, for example, insertion of one atom of oxygen into an organic substrate while the other oxygen atom is reduced to water. Cytochrome P450 functions as the terminal oxidase in the electron transport chain.
Individual cytochrome P450 enzymes have evolved from a common protein.7 Cytochrome P450 enzymes, often called CYPs, that share more than 40% sequence homology are grouped in a family designated by a number (e.g., “CYP2”), those that share more than 55% homology are grouped in a subfamily designated by a letter (e.g., “CYP2A”), and individual CYP enzymes are identified by a third number (e.g., “CYP2A6”). Ten isoforms of cytochrome P450 are responsible for the oxidative metabolism of most drugs. The preponderance of CYP activity for anesthetic drugs is generated by CYP3A4, which is the most abundantly expressed P450 isoform, comprising 20% to 60% of total P450 activity. P450 3A4 metabolizes more than one-half of all currently available drugs, including opioids (alfentanil, sufentanil, fentanyl), benzodiazepines, local anesthetics (lidocaine, ropivacaine), immunosuppressants (cyclosporine), and antihistamines (terfenadine).
Drugs can alter the activity of these enzymes through induction and inhibition. Induction occurs through increased expression of the enzymes. For example, phenobarbital induces microsomal enzymes and thus can render drugs less effective through increased metabolism. Conversely, other drugs directly inhibit enzymes, increasing the exposure to their substrates. Famously, grapefruit juice (not exactly a drug) inhibits CYP 3A4, possibly increasing the concentration of anesthetics and other drugs.
Oxidation
Cytochrome P450 enzymes are crucial for oxidation reactions. These enzymes require an electron donor in the form of reduced nicotinamide adenine dinucleotide (NAD) and molecular oxygen for their activity. The molecule of oxygen is split, with one atom of oxygen oxidizing each molecule of drug and the other oxygen atom being incorporated into a molecule of water. Examples of oxidative metabolism of drugs catalyzed by cytochrome P450 enzymes include hydroxylation, deamination, desulfuration, dealkylation, and dehalogenation. Demethylation of morphine to normorphine is an example of oxidative dealkylation. Dehalogenation involves oxidation of a carbon-hydrogen bond to form an intermediate metabolite that is unstable and spontaneously loses a halogen atom. Halogenated volatile anesthetics are susceptible to dehalogenation, leading to release of bromide, chloride, and fluoride ions. Aliphatic oxidation is oxidation of a side chain. For example, oxidation of the side chain of thiopental converts the highly lipid-soluble parent drug to the more water-soluble carboxylic acid derivative. Thiopental also undergoes desulfuration to pentobarbital by an oxidative step.
Epoxide intermediates in the oxidative metabolism of drugs are capable of covalent binding with macromolecules and may be responsible for some drug-induced organ toxicity, such as hepatic dysfunction. Normally, these highly reactive intermediates have such a transient existence that they exert no biologic action. When enzyme induction occurs, however, large amounts of reactive intermediates may be produced, leading to organ damage. This is especially likely to occur if the antioxidant glutathione, which is in limited supply in the liver, is depleted by the reactive intermediates.
Reduction
Cytochrome P450 enzymes are also essential for reduction reactions. Under conditions of low oxygen partial pressures, cytochrome P450 enzymes transfer electrons directly to a substrate such as halothane rather than to oxygen. This electron gain imparted to the substrate occurs only when insufficient amounts of oxygen are present to compete for electrons.
Conjugation
Conjugation with glucuronic acid involves cytochrome P450 enzymes. Glucuronic acid is synthesized from glucose and added to lipid-soluble drugs to render them water soluble. The resulting water-soluble glucuronide conjugates are then excreted in bile and urine. In premature infants, reduced microsomal enzyme activity interferes with conjugation, leading to neonatal hyperbilirubinemia and the risk of bilirubin encephalopathy. The reduced conjugation ability of the neonate increases the effect and potential toxicity of drugs that are normally inactivated by conjugation with glucuronic acid.
Hydrolysis
Enzymes responsible for hydrolysis of drugs, usually at an ester bond, do not involve the cytochrome P450 enzyme system. Hydrolysis often occurs outside of the liver. For example, remifentanil, succinylcholine, esmolol, and the ester local anesthetics are cleared in the plasma and tissues via ester hydrolysis.
Phase II Enzymes
Phase II enzymes include glucuronosyltrasferases, glutathione-S-transferases, N-acetyl-transferases, and sulfotransferases. Uridine diphosphate glucuronosyltransferase catalyzes the covalent addition of glucuronic acid to a variety of endogenous and exogenous compounds, rendering them more water soluble. Glucuronidation is an important metabolic pathway for several drugs used during anesthesia, including propofol, morphine (yielding morphine-3-glucuronide and the pharmacologically active morphine-6-glucuronide), and midazolam (yielding the pharmacologically active 1-hydroxymidazolam). Glutathione-S-transferase (GST) enzymes are primarily a defensive system for detoxification and protection against oxidative stress. N-acetylation catalyzed by N-acetyl-transferase (NAT) is a common phase II reaction for metabolism of heterocyclic aromatic amines (particularly serotonin) and arylamines, including the inactivation of isoniazid.
Hepatic Clearance
The rate of metabolism for most anesthetic drugs is proportional to drug concentration, rending the clearance of the drug constant (i.e., independent of dose). This is a fundamental assumption for anesthetic pharmacokinetics. Exploring this assumption will provide insight into what clearance actually is and how it relates to the metabolism of drugs.
Although the metabolic capacity of the body is large, it is not possible that metabolism is always proportional to drug concentration because the liver does not have infinite metabolic capacity. At some rate of drug flow into the liver, the organ will be metabolizing drug as fast as the metabolic enzymes in the organ allow. At this point, metabolism can no longer be proportional to concentration because the metabolic capacity of the organ has been exceeded.
Understanding metabolism starts with a simple mass balance: the rate at which drug flows out of the liver must be the rate at which drug flows into the liver, minus the rate at which the liver metabolizes drug. The rate at which drug flows into the liver is liver blood flow, Q, times the concentration of drug flowing in, Cinflow. The rate at which drug flows out of the liver is liver blood flow, Q, times the concentration of drug flowing out, Coutflow. The rate of hepatic metabolism by the liver, R, is the difference between the drug concentration flowing into the liver and the drug concentration flowing out of the liver, times the rate of liver blood flow:
![]()
This relationship is illustrated in Figure 2-7.

Metabolism can be saturated because the liver does not have infinite metabolic capacity. A common equation used for this saturation processes is:
![]()
“Response” in Equation 2-2 varies from 0 to 1, depending on the value of C. In this context, Response is the fraction of maximal metabolic rate. Response = 0 means no metabolism, and Response = 1 means metabolism at the maximal possible rate. C refers to whatever is driving the response. In this chapter, C means drug concentration. When C is 0, the response is 0. If C is greater than 0 but much less than C50, the denominator is approximately C50 and the response is nearly proportional to C: ![]() . If we increase C even further to exactly C50, then the response is
. If we increase C even further to exactly C50, then the response is ![]() , which is simply 0.5. That is where the name “C50” comes from: it is the concentration associated with 50% response. As C becomes much greater than C50, the equation approaches
, which is simply 0.5. That is where the name “C50” comes from: it is the concentration associated with 50% response. As C becomes much greater than C50, the equation approaches ![]() , which is 1. The shape of this relationship is shown in Figure 2-8. The relationship is nearly linear at low concentrations, but at high concentrations, the response saturates at 1.
, which is 1. The shape of this relationship is shown in Figure 2-8. The relationship is nearly linear at low concentrations, but at high concentrations, the response saturates at 1.

To understand hepatic clearance, we must understand the relationship between hepatic metabolism and drug concentration. But what concentration determines the rate of metabolism: the concentration flowing into the liver, the average concentration within the liver, or the concentration flowing out of the liver? All have been used, but the most common views the rate of metabolism as a function of the concentration flowing out of the liver, Coutflow.
We can expand our equation of metabolism to include the observation that the rate of metabolism, R, approaches saturation at the maximum metabolic rate, Vm, as a function of Coutflow:

The saturation equation appears at the end of the aforementioned equation. Vm is the maximum possible metabolic rate. The saturation part of this equation, ![]() , determines fraction of the maximum metabolic rate. Km, the “Michaelis constant,” is the outflow concentration at which the metabolic rate is 50% of the maximum rate (Vm). This relationship is shown in Figure 2-9. The x-axis is the outflow concentration, Coutflow, as a fraction Km. The y-axis is the rate of drug metabolism as a fraction of Vm. By normalizing the x- and y-axis in this manner, the relationship shown in Figure 2-9 is true for all values of Vm and Km. As long as the outflow concentration is less than one-half of Km (true for almost all anesthetic drugs), there is a nearly proportional change in metabolic rate with a proportional change in outflow concentration. Another interpretation is that metabolism will be proportional to concentration as long as the metabolic rate is less than one-third of the maximum metabolic capacity.
, determines fraction of the maximum metabolic rate. Km, the “Michaelis constant,” is the outflow concentration at which the metabolic rate is 50% of the maximum rate (Vm). This relationship is shown in Figure 2-9. The x-axis is the outflow concentration, Coutflow, as a fraction Km. The y-axis is the rate of drug metabolism as a fraction of Vm. By normalizing the x- and y-axis in this manner, the relationship shown in Figure 2-9 is true for all values of Vm and Km. As long as the outflow concentration is less than one-half of Km (true for almost all anesthetic drugs), there is a nearly proportional change in metabolic rate with a proportional change in outflow concentration. Another interpretation is that metabolism will be proportional to concentration as long as the metabolic rate is less than one-third of the maximum metabolic capacity.

So far, we have talked about the rate of metabolism and not about hepatic clearance. If the liver could completely extract the drug from the afferent flow, then clearance would equal liver blood flow, Q. However, the liver cannot remove every last drug molecule. There is always some drug in the effluent plasma. The fraction of inflowing drug extracted by the liver is ![]() . This is called the extraction ratio. Clearance is the amount of blood completely cleared of drug per unit time. We can calculate clearance as the liver blood flow times the extraction ratio
. This is called the extraction ratio. Clearance is the amount of blood completely cleared of drug per unit time. We can calculate clearance as the liver blood flow times the extraction ratio

With this basic understanding of clearance, let us divide each part of Equation 2-3 by Cinflow:

The third term is clearance as defined in Equation 2-4: Q times the extraction ratio. Thus, each term in Equation 2-4 must be clearance. Let us consider them in order.
The first term tells us that Clearance =  . This indicates that clearance is a proportionality constant that relates inflowing (e.g., arterial) concentration to the rate of metabolism. If we want to maintain a given steady-state arterial drug concentration, we must infuse drug at the same rate that it is being metabolized. With this understanding, we can rearrange the equation to say: Infusion rate = metabolic rate = Clearance × Cinflow. Thus, the infusion rate to maintain a given concentration is the clearance times the desired concentration.
The third and fourth terms,

and

are more interesting if taken together. Remembering that ![]() is the extraction ratio, these equations relate clearance to liver blood flow and the extraction ratio, as shown in Figure 2-10.8 For drugs with an extraction ratio of nearly 1 (e.g., propofol), a change in liver blood flow produces a nearly proportional change in clearance. For drugs with a low extraction ratio (e.g., alfentanil), clearance is nearly independent of the rate of liver blood flow. This makes intuitive sense. If nearly 100% of the drug is extracted by the liver, then the liver has tremendous metabolic capacity for the drug. In this case, flow of drug to the liver is what limits the metabolic rate. Metabolism is “flow limited.” The reduction in liver blood flow that accompanies anesthesia can be expected to reduce clearance. However, moderate changes in hepatic metabolic function per se will have little impact on clearance because hepatic metabolic capacity is overwhelmingly in excess of demand.
is the extraction ratio, these equations relate clearance to liver blood flow and the extraction ratio, as shown in Figure 2-10.8 For drugs with an extraction ratio of nearly 1 (e.g., propofol), a change in liver blood flow produces a nearly proportional change in clearance. For drugs with a low extraction ratio (e.g., alfentanil), clearance is nearly independent of the rate of liver blood flow. This makes intuitive sense. If nearly 100% of the drug is extracted by the liver, then the liver has tremendous metabolic capacity for the drug. In this case, flow of drug to the liver is what limits the metabolic rate. Metabolism is “flow limited.” The reduction in liver blood flow that accompanies anesthesia can be expected to reduce clearance. However, moderate changes in hepatic metabolic function per se will have little impact on clearance because hepatic metabolic capacity is overwhelmingly in excess of demand.

Conversely, for drugs with an extraction ratio considerably less than 1, clearance is limited by the capacity of the liver to take up and metabolize the drug. Metabolism is “capacity limited.” Clearance will change in response to any change in the capacity of the liver to metabolize such drugs, such as might be caused by liver disease or enzymatic induction. However, changes in liver blood flow, as might be caused by the anesthetic state itself, usually have little influence on the clearance because the liver only handles a fraction of the drug it sees. This relationship can be seen in Figure 2-11.

We can also put the third and fourth terms of the clearance equation together to show how extraction ratio governs the response of clearance to changes in metabolic capacity (Vm). Figure 2-11 shows the clearance for drugs with an extraction ratio ranging from 0.1 to 1, based on a liver blood flow of 1.4 L per minute. The extraction ratios were calculated for a Vm = 1. Changes in Vm, as might be caused by liver disease (reduced Vm) or enzymatic induction (increased Vm) have little effect on drugs with a high extraction ratio. However, drugs with a low extraction ratio have a nearly linear change in clearance with a change in intrinsic metabolic capacity (Vm).
Vm and Km are usually not known and condensed into a single term, ![]() . This term summarizes the hepatic metabolic capacity and is called intrinsic clearance. Because clearance =
. This term summarizes the hepatic metabolic capacity and is called intrinsic clearance. Because clearance =  , consider what happens if hepatic blood flow increases to infinity (this is a thought experiment). At super high hepatic blood flow, Coutflow becomes indistinguishable from Cinflow because the finite hepatic capacity only metabolizes an infinitesimal fraction of the drug flowing through the liver. As a result, clearance becomes
 ![]() . We can solve for this in the “linear range” by finding clearance when Cinflow = 0,
. We can solve for this in the “linear range” by finding clearance when Cinflow = 0, ![]() . This is the intrinsic clearance, Clint. It can be demonstrated algebraically from the definition of Clint that in the linear range, Clint is directly related to the extraction ratio:
. This is the intrinsic clearance, Clint. It can be demonstrated algebraically from the definition of Clint that in the linear range, Clint is directly related to the extraction ratio: ![]() . Combining this with Equation 2-5 yields the relationship between hepatic clearance and Clint:
. Combining this with Equation 2-5 yields the relationship between hepatic clearance and Clint:

The relationship between intrinsic clearance and extraction ratio is shown in Figure 2-12, calculated at a hepatic blood flow of 1,400 mL/min. In general, true hepatic clearance and extraction ratio are more useful concepts for anesthetic drugs than the intrinsic clearance. However, intrinsic clearance is introduced here because it is occasionally used in pharmacokinetic analyses of drugs used during anesthesia.

So far, we have focused on linear pharmacokinetics, that is, the pharmacokinetics of drugs whose metabolic rate at clinical doses is less than Vm/3. The clearance of such drugs is generally expressed as a constant (e.g., propofol clearance = 1.6 L per minute). Some drugs, such as phenytoin, exhibit saturable pharmacokinetics (i.e., have such low Vm that typical doses exceed the linear portion of Figure 2-9). The clearance of drugs with saturable metabolism is a function of drug concentration, rather than a constant.
Renal Clearance
Renal excretion of drugs involves (a) glomerular filtration, (b) active tubular secretion, and (c) passive tubular reabsorption. The amount of drug that enters the renal tubular lumen depends on the fraction of drug bound to protein and the glomerular filtration rate (GFR). Renal tubular secretion involves active transport processes, which may be selective for certain drugs and metabolites, including protein-bound compounds. Reabsorption from renal tubules removes drug that has entered tubules by glomerular filtration and tubular secretion. This reabsorption is most prominent for lipid-soluble drugs that can easily cross cell membranes of renal tubular epithelial cells to enter pericapillary fluid. Indeed, a highly lipid-soluble drug, such as thiopental, is almost completely reabsorbed such that little or no unchanged drug is excreted in the urine. Conversely, production of less lipid-soluble metabolites limits renal tubule reabsorption and facilitates excretion in the urine.
The rate of reabsorption from renal tubules is influenced by factors such as pH and rate of renal tubular urine flow. Passive reabsorption of weak bases and acids is altered by urine pH, which influences the fraction of drug that exists in the ionized form. For example, weak acids are excreted more rapidly in alkaline urine. This occurs because alkalinization of the urine results in more ionized drug that cannot easily cross renal tubular epithelial cells, resulting in less passive reabsorption.
Renal blood flow is inversely correlated with age, as is creatinine clearance, which is closely related to GFR because creatinine is water soluble and not resorbed in the tubules. Creatinine clearance can be predicted from age and weight according to the equation of Cockroft and Gault9:
Men:

Women:
85% of the aforementioned equation.
Equation 2-7 shows that age is an independent predictor of creatinine clearance. Elderly patients with normal serum creatinine have about half the GFR than younger patients. This can be seen graphically in Figure 2-13.

Absorption
Classically, pharmacokinetics is taught as “absorption, distribution, metabolism, and elimination.” Because most anesthetic drugs are administered intravenously and inhaled anesthetic pharmacokinetics are discussed elsewhere, this order has been changed in this textbook to put absorption at the end of the list. Absorption is simply not particularly relevant for most anesthetic drugs.
Ionization
Most drugs are weak acids or bases that are present in solutions in ionized and nonionized form. The nonionized molecule is usually lipid soluble and can diffuse across cell membranes including the blood–brain barrier, renal tubular epithelium, gastrointestinal epithelium, placenta, and hepatocytes (Table 2-1). As a result, it is usually the nonionized form of the drug that is pharmacologically active, undergoes reabsorption across renal tubules, is absorbed from the gastrointestinal tract, and is susceptible to hepatic metabolism. Conversely, the ionized fraction is poorly lipid soluble and cannot penetrate lipid cell membranes easily (see Table 2-1). A high degree of ionization thus impairs absorption of drug from the gastrointestinal tract, limits access to drug-metabolizing enzymes in the hepatocytes, and facilitates excretion of unchanged drug, as reabsorption across the renal tubular epithelium is unlikely.

Determinants of Degree of Ionization
The degree of drug ionization is a function of its dissociation constant (pK) and the pH of the surrounding fluid. When the pK and the pH are identical, 50% of the drug exists in both the ionized and nonionized form. Small changes in pH can result in large changes in the extent of ionization, especially if the pH and pK values are similar. Acidic drugs, such as barbiturates, tend to be highly ionized at an alkaline pH, whereas basic drugs, such as opioids and local anesthetics, are highly ionized at an acid pH. Acidic drugs are usually supplied in a basic solution to make them more soluble in water and basic drugs are usually supplied in an acidic solution for the same reason, unless the pH affects drug stability, as is the case for most ester local anesthetics.
Ion Trapping
Because it is the nonionized drug that equilibrates across lipid membranes, a concentration difference of total drug can develop on two sides of a membrane that separates fluids with different pHs,10 because the ionized concentrations will reflect the local equilibration between ionized and nonionized forms based on the pH. This is an important consideration because one fraction of the drug may be more pharmacologically active than the other fraction.
Systemic administration of a weak base, such as an opioid, can result in accumulation of ionized drug (ion trapping) in the acid environment of the stomach. A similar phenomenon occurs in the transfer of basic drugs, such as local anesthetics, across the placenta from mother to fetus because the fetal pH is lower than maternal pH. The lipid-soluble nonionized fraction of local anesthetic crosses the placenta and is converted to the poorly lipid-soluble ionized fraction in the more acidic environment of the fetus. The ionized fraction in the fetus cannot easily cross the placenta to the maternal circulation and thus is effectively trapped in the fetus. At the same time, conversion of the nonionized to ionized fraction maintains a gradient for continued passage of local anesthetic into the fetus. The resulting accumulation of local anesthetic in the fetus is accentuated by the acidosis that accompanies fetal distress. The kidneys are the most important organs for the elimination of unchanged drugs or their metabolites. Water-soluble compounds are excreted more efficiently by the kidneys than are compounds with high lipid solubility. This emphasizes the important role of metabolism in converting lipid-soluble drugs to water-soluble metabolites. Drug elimination by the kidneys is correlated with endogenous creatinine clearance or serum creatinine concentration. The magnitude of change in these indices provides an estimate of the necessary change adjustment in drug dosage. Although age and many diseases are associated with a decrease in creatinine clearance and requirement for decreased dosing, pregnancy is associated with an increase in creatinine clearance and higher dose requirements for some drugs.
Route of Administration and Systemic Absorption of Drugs
The choice of route of administration for a drug should be determined by factors that influence the systemic absorption of drugs. The systemic absorption rate of a drug determines the magnitude of the drug effect and duration of action. Changes in the systemic absorption rate may necessitate an adjustment in the dose or time interval between repeated drug doses.
Systemic absorption, regardless of the route of drug administration, depends on the drug’s solubility. Local conditions at the site of absorption alter solubility, particularly in the gastrointestinal tract. Blood flow to the site of absorption is also important in the rapidity of absorption. For example, increased blood flow evoked by rubbing or applying heat at the subcutaneous or intramuscular injection site enhances systemic absorption, whereas decreased blood flow due to vasoconstriction impedes drug absorption. Finally, the area of the absorbing surface available for drug absorption is an important determinant of drug entry into the circulation.
Oral Administration
Oral administration of a drug is often the most convenient and economic route of administration. Disadvantages of the oral route include (a) emesis caused by irritation of the gastrointestinal mucosa by the drug, (b) destruction of the drug by digestive enzymes or acidic gastric fluid, and (c) irregularities in absorption in the presence of food or other drugs. Furthermore, drugs may be metabolized by enzymes or bacteria in the gastrointestinal tract before systemic absorption can occur.
With oral administration, the onset of drug effect is largely determined by the rate and extent of absorption from the gastrointestinal tract. The principal site of drug absorption after oral administration is the small intestine due to the large surface area of this portion of the gastrointestinal tract. Changes in the pH of gastrointestinal fluid that favor the presence of a drug in its nonionized (lipid-soluble) fraction thus favor systemic absorption. Drugs that exist as weak acids (such as aspirin) become highly ionized in the alkaline environment of the small intestine, but absorption is still great because of the large surface area. Furthermore, absorption also occurs in the stomach, where the fluid is acidic.
First-Pass Hepatic Effect
Drugs absorbed from the gastrointestinal tract enter the portal venous blood and thus pass through the liver before entering the systemic circulation for delivery to tissue receptors. This is known as the first-pass hepatic effect. For drugs that undergo extensive hepatic extraction and metabolism (propranolol, lidocaine), it is the reason for large differences in the pharmacologic effect between oral and intravenous doses.
Oral Transmucosal Administration
The sublingual or buccal route of administration permits a rapid onset of drug effect because this blood bypasses the liver and thus prevents the first-pass hepatic effect on the initial plasma concentration of drug. Venous drainage from the sublingual area is into the superior vena cava. Evidence of the value of bypassing the first-pass hepatic effect is the efficacy of sublingual nitroglycerin. Conversely, oral administration of nitroglycerin is ineffective because extensive first-pass hepatic metabolism prevents establishment of a therapeutic plasma concentration. Buccal administration is an alternative to sublingual placement of a drug; it is better tolerated and less likely to stimulate salivation. The nasal mucosa also provides an effective absorption surface for certain drugs.
Transdermal Administration
Transdermal administration of drugs provides sustained therapeutic plasma concentrations of the drug and decreases the likelihood of loss of therapeutic efficacy due to peaks and valleys associated with conventional intermittent drug injections. This route of administration is devoid of the complexity of continuous infusion techniques, and the low incidence of side effects (because of the small doses used) contributes to high patient compliance. Characteristics of drugs that favor predictable transdermal absorption include (a) combined water and lipid solubility, (b) molecular weight of <1,000, (c) pH 5 to 9 in a saturated aqueous solution, (d) absence of histamine-releasing effects, and (e) daily dose requirements of <10 mg. Scopolamine, fentanyl, clonidine, estrogen, progesterone, and nitroglycerin are drugs available in transdermal delivery systems. Unfortunately, sustained plasma concentrations provided by transdermal absorption of scopolamine and nitroglycerin may result in tolerance and loss of therapeutic effect.
It is likely that transdermal absorption of drugs initially occurs along sweat ducts and hair follicles that function as diffusion shunts. The rate-limiting step in transdermal absorption of drugs is diffusion across the stratum corneum of the epidermis. Differences in the thickness and chemistry of the stratum corneum are reflected in the skin’s permeability. For example, skin may be 10 to 20 µm thick on the back and abdomen compared with 400 to 600 µm on the palmar surfaces of the hands. Likewise, skin permeation studies have shown substantial regional differences for systemic absorption of scopolamine. The postauricular zone, because of its thin epidermal layer and somewhat higher temperature, is the only area that is sufficiently permeable for predictable and sustained absorption of scopolamine. The stratum corneum sloughs and regenerates at a rate that makes 7 days of adhesion the duration limit for one application of a transdermal system. Contact dermatitis at the site of transdermal patch applications occurs in a significant number of patients.
Rectal Administration
Drugs administered into the proximal rectum are absorbed into the superior hemorrhoidal veins and subsequently transported via the portal venous system to the liver (first-pass hepatic effect), where they are exposed to metabolism before entering the systemic circulation. On the other hand, drugs absorbed from a low rectal administration site reach the systemic circulation without first passing through the liver. These factors, in large part, explain the unpredictable responses that follow rectal administration of drugs. Furthermore, drugs may cause irritation of the rectal mucosa.
Pharmacokinetic Models
In the following section, several common, useful pharmacokinetic models are derived. Although it is not necessary for every clinician to be able to derive these models, a consideration of where they come from takes them out of the “black box” and allows consideration of their representative parts.
Zero- and First-Order Processes
The consumption of oxygen and production of carbon dioxide are processes that happen at a constant rate. These are called zero-order processes. The rate of change (dx/dt) for a zero-order process is ![]() . This says the rate of change is constant. If x represents an amount of drug and t represents time, then the units of k are amount/time. If we want to know the value of x at time t, x(t), we can compute it as the integral of this equation from time 0 to time t, x(t) = x0 + k · t, where x0 is the value of x at time 0. This is the equation of a straight line with a slope of k and an intercept of x0.
. This says the rate of change is constant. If x represents an amount of drug and t represents time, then the units of k are amount/time. If we want to know the value of x at time t, x(t), we can compute it as the integral of this equation from time 0 to time t, x(t) = x0 + k · t, where x0 is the value of x at time 0. This is the equation of a straight line with a slope of k and an intercept of x0.
Many processes occur at a rate proportional to the amount. For example, the interest payment on a loan is proportional to the outstanding balance. The rate at which water drains from a bathtub is proportional to amount (height) of water in the tub. These are examples of first-order processes. The rate of change in a first-order process is only slightly more complex than for a zero-order process, ![]() . In this equation, x has units of amount already, so the units of k are 1/time. The value of x at time t, x(t), can be computed as the integral from time 0 to time t, x(t) = x0 ekt, where x0 is the value of x at time 0. If k > 0, x(t) increases exponentially to infinity. If k < 0, x(t) decreases exponentially to 0. In pharmacokinetics, k is negative because concentrations decrease over time. For clarity, the minus sign is usually explicit, so k is expressed as a positive number. Thus, the identical equation for pharmacokinetics, with the minus sign explicitly written, is
. In this equation, x has units of amount already, so the units of k are 1/time. The value of x at time t, x(t), can be computed as the integral from time 0 to time t, x(t) = x0 ekt, where x0 is the value of x at time 0. If k > 0, x(t) increases exponentially to infinity. If k < 0, x(t) decreases exponentially to 0. In pharmacokinetics, k is negative because concentrations decrease over time. For clarity, the minus sign is usually explicit, so k is expressed as a positive number. Thus, the identical equation for pharmacokinetics, with the minus sign explicitly written, is
![]()
Figure 2-14A shows the exponential relationship between x and time. x continuously decreases over time. Taking the natural logarithm of both sides of x(t) = x0 e−kt gives:


This is the equation of a straight line, as shown in Figure 2-14B, where the vertical axis is ln [x(t)], the horizontal axis is t, the intercept is ln(x0), and the slope of the line is −k. How long will it take for x to go from some value, x1, to half that value, x1/2? Because k is the slope of a straight line relating ln(x) to time, it follows that

where t½ is the “half-life,” the time required for a 50% decrease in x. The natural log of 2 is close enough to 0.693 for the authors’ purposes that “≈” is replaced with “=” for readability. Thus, the relationship of the slope (or “rate constant”), k, to half-life, t½ is ![]() . If we measure the time it takes for x to fall by 50%, t½, then we know the rate constant, k. Conversely, if we know k, the rate constant, we can easily calculate the time it will take for x to fall by 50% as
. If we measure the time it takes for x to fall by 50%, t½, then we know the rate constant, k. Conversely, if we know k, the rate constant, we can easily calculate the time it will take for x to fall by 50% as

Physiologic Pharmacokinetic Models
It is possible to analyze volumes and clearances for each organ in the body and construct models of pharmacokinetics by assembling the organ models into physiologically and anatomically accurate models of the entire animal. Figure 2-15 shows such a model for thiopental in rats.11 However, models that work with individual tissues are mathematically cumbersome and do not offer a better prediction of plasma drug concentration than models that lump the tissues into a few compartments. If the goal is to determine how to give drugs in order to obtain therapeutic plasma drug concentrations, then all that is needed is to mathematically relate dose to plasma concentration. For this purpose, “compartmental” models are usually adequate.

Compartmental Pharmacokinetic Models
Compartmental models are built on the same basic concepts as physiologic models. The “one-compartment model” (Fig. 2-16A) contains a single volume and a single clearance, as though we were buckets of fluid. For anesthetic drugs, we resemble several buckets connected by pipes. These are usually modeled using two- or three-compartment models, Figure 2-16B,C. The volume to the left in the two-compartment model and in the center of the three-compartment model is the central volume where drug is injected. The other volumes are peripheral volumes of distribution. The sum of the all volumes is the volume of distribution at steady state, Vdss. The clearance leaving the central compartment for the outside is the “systemic” clearance, in that it clears drug from the entire system. The clearances between the central compartment and the peripheral compartments are the “intercompartmental” clearances. Although the concept of compartments yields useful mathematics for planning dosing, when experimental animals were flash frozen at different times following administration of anesthetic drugs, and characterized using physiologic models, compartments identified in simple compartment model could not be anatomically identified.12 Other than clearance, none of the parameters of compartment models readily translates into any anatomic structure or physiologic process.

One-Compartment Model
Bolus Pharmacokinetics
Returning to the one-compartment bucket, call the amount of drug poured into the bucket x0 (x at time 0). The initial concentration is x0/V, where V is the volume of fluid in the bucket. Remembering that the definition of concentration is dose (or amount) per volume, we can rearrange this to calculate the dose required to achieve a specific target concentration, CT (target concentration), based on V, the volume in the bucket: Dose = CT × V.
Let us assume that the fluid is being circulated through a clearing organ at a constant rate, which we will call clearance, Cl. What is the rate, dx/dt, that drug, x, is leaving the bucket? Because concentration is x/V and Cl is the rate that the fluid in the bucket is through the clearing organ, then the rate at which the drug is leaving must be x/V × Cl, which is the concentration times the flow rate. This rate is a first-order process if, and only if, it equals a constant, k, times the amount of drug, x, in the bucket. It does because we can arrange the equation as x × Cl/V. Because Cl and V are both constants, we can define k as Cl/V. Therefore, the rate is x × k, which defines a first-order process. This can be rearranged to yields the fundamental identity of linear pharmacokinetics:

What does this identity tell us about the relationship between half-life, volume, and clearance? Rearranging the aforementioned equation as k = ![]() and remembering that t½ =
and remembering that t½ = ![]() , we can conclude that half-life is proportional to volume and inversely proportional to clearance.
, we can conclude that half-life is proportional to volume and inversely proportional to clearance.

Consider two alternative models, one with a large volume and a small clearance, Figure 2-17A, and one with a small volume and a large clearance, Figure 2-17B. It is (hopefully) intuitively obvious that following bolus injection, concentrations will fall more quickly (shorter half-life) with the larger clearance, as predicted by Equation 2-12.

Because this is a first-order process, let us calculate the concentration of drug that remains in the bucket as drug is being cleared following bolus injection. Using the equation that describes first-order processes, x(t) = x0 e−kt, x(t) is the amount of drug at time t, x0 is the amount of drug right after bolus injection, and k is the rate constant (Cl/V). If we divide both sides by V, and remember that x/V is the definition of concentration, we get the equation that relates concentration following an intravenous bolus to time and initial concentration:

This equation defines the “concentration over time” curve for a one-compartment model and has the log linear shape seen in Figure 2-14B.
In a typical experiment, we start with the concentrations, as seen in Figure 2-14, and calculate clearance in one of two ways. First, we can calculate V by rearranging the definition of concentration, V = dose/initial concentration = dose/C0. If you know the dose and you measure C0 in the experiment, you can calculate V. If you then fit the log (C) line versus time line to a straight line, you can directly measure the slope, −k. You can then calculate clearance as k· V.
A more general solution is to consider the integral of the concentration over time curve, C (t) = C0 e−kt, known in pharmacokinetics as the area under the curve, or AUC:

We can rearrange the right side and the last term on the left side to solve for clearance, Cl:
![]()
Because x0 is the dose of drug, clearance equals the dose divided by the AUC. This fundamental property of linear pharmacokinetic models applies to one-compartment models, multicompartment models, and to any type of intravenous drug dosing (provided the total dose administered systemically is used as the numerator). It directly follows that AUC is proportional to dose for linear models (i.e., models where Clis constant).
Infusion Pharmacokinetics
If you give an infusion at a rate of I (for Input), the plasma concentration will rise as long as the rate of drug going in the body, I, exceeds the rate at which drug leaves the body, C · Cl, where C is the drug concentration. Once, I = C · Cl, drug is going in and coming out at the same rate, and the body is at steady state. We can calculate the concentration at steady state by observing that the rate of drug going in must equal the rate of drug coming out. We have determined that that rate of drug metabolism at steady state is themetabolic rate = Css · Cl, where Css is the arterial concentration at steady state. Because by definition at steady state the infusion rate equals the metabolic rate, the infusion rate, I, at steady state must be I = Css · Cl. Solving this for the concentration at steady state, Css gives Css = ![]() . Thus, the steady-state concentration during an infusion is the rate of drug input divided by the clearance. It follows that if we want to calculate the infusion rate that will achieve a given target concentration, CT, at steady state, then the infusion rate must be CT · Cl.
. Thus, the steady-state concentration during an infusion is the rate of drug input divided by the clearance. It follows that if we want to calculate the infusion rate that will achieve a given target concentration, CT, at steady state, then the infusion rate must be CT · Cl.
![]() is similar in form to the equation describing the concentration following a bolus injection: C0 =
is similar in form to the equation describing the concentration following a bolus injection: C0 = ![]() . Thus, volume is a scalar relating bolus to initial concentration, and clearance is a scalar relating infusion rate to steady-state concentration. It follows that the initial concentration following a bolus is independent of the clearance, and the steady-state concentration during a continuous infusion is independent of the volume.
. Thus, volume is a scalar relating bolus to initial concentration, and clearance is a scalar relating infusion rate to steady-state concentration. It follows that the initial concentration following a bolus is independent of the clearance, and the steady-state concentration during a continuous infusion is independent of the volume.
During an infusion, the rate of change in the amount of drug, x, is rate of inflow, I, minus the rate of outflow, k · x, which is represented as ![]() = I − kx. We can calculate x at any time t as the integral from time 0 to time t. Assuming that we are starting with no drug in the body (i.e., x0 = 0) the result is x(t) =
= I − kx. We can calculate x at any time t as the integral from time 0 to time t. Assuming that we are starting with no drug in the body (i.e., x0 = 0) the result is x(t) = ![]() . If we divide both sides by volume, V, and remember that Cl = k · V, we can solve this equation for concentration: C(t) =
. If we divide both sides by volume, V, and remember that Cl = k · V, we can solve this equation for concentration: C(t) = ![]() . This is the equation for concentration during an infusion in a one-compartment model.
. This is the equation for concentration during an infusion in a one-compartment model.
As t → ![]() , e-kt→ 0 the equation x(t) =
, e-kt→ 0 the equation x(t) = ![]() reduces to xss =
reduces to xss = ![]() . During an infusion, the amount in the body approaches xss (steady state) asymptotically, only reaching it at infinity. However, we can calculate how long does it take to get to half of the steady-state amount,
. During an infusion, the amount in the body approaches xss (steady state) asymptotically, only reaching it at infinity. However, we can calculate how long does it take to get to half of the steady-state amount, ![]() . If Xss =
. If Xss = ![]() , then
, then ![]() . Because
. Because ![]() is the amount of drug when we are halfway to steady state, we can substitute that for the amount of drug in our formula x(t) =
is the amount of drug when we are halfway to steady state, we can substitute that for the amount of drug in our formula x(t) = ![]() , giving us
, giving us ![]() , and solve that for t. The solution is t½ =
, and solve that for t. The solution is t½ = ![]() . This is the time to rise to half steady state. Recall that t½, the half time to decrease to 0, following a bolus injection was
. This is the time to rise to half steady state. Recall that t½, the half time to decrease to 0, following a bolus injection was ![]() . We again have a parallel between boluses and infusions. Following a bolus, it takes 1 half-life to reduce the concentrations by half, and during an infusion, it takes 1 half-life to increase the concentration halfway to steady state. Similarly, it takes 2 half-lives to reach 75%, 3 half-lives to reach 87.5%, and 5 half-lives to reach 97% of the steady-state concentration. By 4 to 5 half-lives, we typically consider the patient to be at steady state, although the concentrations only asymptotically approach the steady-state value.
. We again have a parallel between boluses and infusions. Following a bolus, it takes 1 half-life to reduce the concentrations by half, and during an infusion, it takes 1 half-life to increase the concentration halfway to steady state. Similarly, it takes 2 half-lives to reach 75%, 3 half-lives to reach 87.5%, and 5 half-lives to reach 97% of the steady-state concentration. By 4 to 5 half-lives, we typically consider the patient to be at steady state, although the concentrations only asymptotically approach the steady-state value.
Absorption Pharmacokinetics
When drugs are given intravenously, every molecule reaches the systemic circulation. When drugs are given by a different route, such as orally, transdermally, or intramuscularly, the drug must first reach the systemic circulation. Oral drugs may be only partly absorbed. What is absorbed then has to get past the liver (“first-pass hepatic metabolism”) before reaching the systemic circulation. Transdermally applied drugs may be rubbed off, removed with soap or alcohol, or be sloughed off with the stratum corneum without being absorbed. The dose of drug that eventually reaches the systemic circulation with alternative routes of drug delivery is the administered dose times f, the fraction “bioavailable.”
Alternative routes of drug delivery are often modeled by assuming the drug is absorbed from a reservoir or depot, usually modeled as an additional compartment with a monoexponential rate of transfer to the systemic circulation, A(t) = f · Doral · ka · e−kat, where A(t) is the absorption rate at time t, f is the fraction bioavailable, Doral is the dose taken orally (or intramuscularly, applied to the skin, etc). ka is the absorption rate constant. Because the integral of kae−kat is 1, the total amount of drug absorbed is f · Doral. To compute the concentrations over time, we first reduce the problem to differential equations and integrate. The differential equation for the amount, x, with oral absorption into a one-compartment disposition model is:

This is simply the rate of absorption at time t, A(t), minus the rate of exit, k · x. The amount of drug, x, in the compartment at time t is the integral of this from 0 to time t:

This equation describes the amount of drug in the systemic circulation following first-order absorption from a depot, such as the stomach, an intramuscular injection, the skin, or even an epidural dose. To describe the concentrations, rather than amounts of drug, it is necessary to divide both sides by V, the volume of distribution.
Multicompartment Models
The previous section used one-compartment model to introduce concepts of rate constants and half-lives and relate them to the physiologic concepts of volume and clearance. Unfortunately, none of the drugs used in anesthesia can be accurately characterized by one-compartment models because anesthetic drugs distribute extensively into peripheral tissues. To describe the pharmacokinetics of intravenous anesthetics, we must extend the one-compartment model to account for this distribution.
The plasma concentrations over time following an intravenous bolus resemble the curve in Figure 2-18. In contrast to Figure 2-14, Figure 2-18 is not a straight line even though it is plotted on a log y-axis. This curve has the characteristics common to most drugs when given by intravenous bolus. First, the concentrations continuously decrease over time. Second, the rate of decline is initially steep but becomes less steep over time until we get to a portion that is “log-linear.”

Many anesthetic drugs appear to have three distinct phases, as suggested by Figure 2-18. There is a “rapid distribution” phase (red in Fig. 2-18) that begins immediately after bolus injection. Very rapid movement of the drug from the plasma to the rapidly equilibrating tissues characterizes this phase. Often, there is a second “slow distribution” phase (blue in Fig. 2-18) that is characterized by movement of drug into more slowly equilibrating tissues and return of drug to the plasma from the most rapidly equilibrating tissues. The terminal phase (green in Fig. 2-18) is a straight line when plotted on a semilogarithmic graph. The distinguishing characteristic of the terminal elimination phase is that the plasma concentration is lower than the tissue concentrations, and the relative proportion of drug in the plasma and peripheral volumes of distribution remains constant. During this “terminal phase,” drug returns from the rapid and slow distribution volumes to the plasma and is permanently removed from the plasma by metabolism or excretion.
The presence of three distinct phases following bolus injection is a defining characteristic of a mammillary model with three compartments (a mammillary model consists of a central compartment with peripheral compartments connecting to it. There are no interconnections among other compartments). It is possible to develop “hydraulic” models, as shown in Figure 2-19, for intravenous drugs.13 In this model, there are three tanks, corresponding (from left to right) with the slowly equilibrating peripheral compartment, the central compartment (the plasma, into which drug is injected), and the rapidly equilibrating peripheral compartment. The horizontal pipes represent intercompartmental clearance or (for the pipe draining onto the page) metabolic clearance. The volumes of each tank correspond with the volumes of the compartments for fentanyl. The cross-sectional areas of the pipes correlate with fentanyl systemic and intercompartmental clearances. The height of water in each tank corresponds to drug concentration.

We can follow the processes that decrease drug concentration over time following bolus injection. Initially, drug flows from the central compartment to both peripheral compartments and is eliminated via the drain pipe through metabolic clearance. Because there are three places for drug to go, the central compartment concentration decreases very rapidly. At the transition between the red and the blue lines, there is a change in the role of the most rapidly equilibrating compartment. At this transition, the central compartment concentration falls below the concentration in the rapidly equilibrating compartment, and the direction of flow between them is reversed. After this transition (blue line), drug in the plasma only has two places to go: the slowly equilibrating compartment or out the drain pipe. These processes are partly offset by the return of drug to the plasma from the rapidly equilibrating compartment, which slows the decrease in plasma concentration. Once the concentration in the central compartment falls below both the rapidly and slowly equilibrating compartments (green line), then the only method of decreasing the plasma concentration is clearance out the drain pipe. Drug accumulated in the rapidly and slowly equilibrating compartments acts as an enormous drag on the system, and the little drain pipe now is working against the entire body store of drug.
Curves that continuously decrease over time, with a continuously increasing slope (i.e., curves that look like Figs. 2-18 and 2-19), can be described by a sum of negative exponentials, as shown in Figure 2-20, which shows how three single exponential curves are added together to get a sum of exponentials that describes the plasma concentrations over time after bolus injection:
![]()

where t is the time since the bolus; C(t) is the drug concentration following a bolus dose; and A, α, B, β, C, and γ are parameters of a pharmacokinetic model. A, B, and C are called coefficients, whereas α, β, and γ are called exponents. Following a bolus injection, all six of the parameters (A, α, B, β, C, and γ) will be greater than 0.
The main reason that polyexponential equations are used is that they work. These equations describe reasonably accurately the plasma concentrations observed after bolus injection, except for the misspecification in the first few minutes mentioned previously.
Polyexponential equations permit us to use the one-compartment ideas just developed, with some generalization of the concepts. C (t) = Ae−αt + Be−βt + Ce−γt says that the concentrations over time are the algebraic sum of three separate functions, Ae−αt, Be−βt, and Ce−γt. Typically, α > β > γ by about 1 order of magnitude. At time 0 (t = 0), Equation 2-18 reduces to C0 = A + B + C. In other words, the sum of the coefficients A, B, and C equals the concentration immediately following a bolus. It thus follows that A + B + C = bolus amount / V1.
Constructing pharmacokinetic models represents a trade-off between accurately describing the data, having confidence in the results, and mathematical tractability. Adding exponents to the model usually provides a better description of the observed concentrations. However, adding more exponents terms usually decreases our confidence in how well we know each coefficient and exponential, and greatlyincreases the mathematical burden of the models. This is why most pharmacokinetic models are limited to two or three exponents.
Polyexponential models can be mathematically transformed from the admittedly unintuitive exponential form C (t) = Ae−αt + Be−βt + Ce−γt to a more easily visualized compartmental form, as shown in Equation 2-16. Micro-rate constants, expressed as kij, define the rate of drug transfer from compartment i to compartment j. Compartment 0 is the compartment outside the model, so k10 is the micro-rate constant for irreversible removal of drug from the central compartment (analogous to k for a one-compartment model). The intercompartmental micro-rate constants (k12, k21, etc.) describe the movement of drug between the central and peripheral compartments. Each peripheral compartment has at two micro-rate constants, one for drug entry and one for drug exit. The micro-rate constants for the two- and three-compartment models can be seen in Figure 2-16. The differential equations describing the rate of change for the amount of drugs in compartments 1, 2, and 3 follow directly from the micro-rate constants. For the two-compartment model, the differential equations for each compartment are:

where I is the rate of drug input. For the three-compartment model, the differential equations for each compartment are:

For the one-compartment model, k was both the rate constant and the exponent. For multicompartment models, the relationships are more complex. The interconversion between the micro-rate constants and the exponents becomes exceedingly complex as more exponents are added, because every exponent is a function of every micro-rate constant and vice versa. Individuals interested in such interconversions can find them in the Excel spreadsheet “convert.xls,” which can be downloaded from http://anesthesia.stanford.edu/pkpd. This is useful because publications on pharmacokinetics may use one or another system and it is difficult to compare without converting the exponents to micro-rate constants.
The Time Course of Drug Effect
The plasma is not the site of drug effect for anesthetic drugs. There is a time lag between plasma drug concentration and effect site drug concentration. Consider the different rate of onset for fentanyl and alfentanil. Figure 2-21 is from work by Stanski and colleagues.14,15 The black bar in Figure 2-21A shows the duration of a fentanyl infusion.14 Rapid arterial samples document the rise in fentanyl concentration. The time course of EEG effect (spectral edge) lags 2 to 3 minutes behind the rapid rise in arterial concentration. This lag is called hysteresis. The plasma concentration peaks at the moment the infusion is turned off. Following the peak plasma concentration (and the Disney logo that appears at peak plasma concentration), the plasma fentanyl concentration rapidly decreases. However, the offset of fentanyl drug effect lags well behind the decrease in plasma concentration. Figure 2-21B shows the same study design in a patient receiving alfentanil. Because of alfentanil’s rapid blood–brain equilibration, there is less hysteresis (delay) with alfentanil than with fentanyl.

The relationship between the plasma and the site of drug effect is modeled with an “effect site” model, as shown in Figure 2-22. The site of drug effect is connected to the plasma by a first-order process. The equation that relates effect site concentration to plasma concentration is:


where Ce is the effect site concentration and Cp is the plasma drug concentration. ke0 is the rate constant for elimination of drug from the effect site. It is most easily understood in terms of its reciprocal, 0.693/ke0, the half-time for equilibration between the plasma and the site of drug effect.
Figure 2-23 shows the plasma and effect site concentrations predicted by the model (see Fig. 2-22) for fentanyl and alfentanil. The plasma concentrations (black lines) are not very different. However, the effect site concentrations (red lines) show that alfentanil equilibrates more quickly. There are two consequences. First, the peak effect is sooner (obviously). Second, the rapid equilibration of alfentanil allows the brain to “see” the initial high plasma concentrations, producing a relatively greater rise in effect site concentrations than observed with fentanyl. This permits alfentanil to deliver relatively more “bang” for a bolus.

The constant ke0 has a large influence on the rate of rise of drug effect, the rate of offset of drug effect, the time to peak effect,16 and the dose that is required to produce the desired drug effect.
Dose Calculations
Bolus Dosing
We noted previously that we can rearrange the definition of concentration to find the amount of drug required to produce any desired target concentration for a known volume, amount = CT × volume. Many introductory pharmacokinetic texts suggest using this formula to calculate the loading bolus required to achieve a given concentration. The problem with applying this concept to the anesthetic drugs is that there are several volumes: V1 (central compartment), V2 and V3 (the peripheral compartments), and Vdss, the sum of the individual volumes. V1 is usually much smaller than Vdss, and so it is tempting to say that the loading dose should be something between CT × V1 and CT × Vdss.
That proves to be a useless suggestion. Consider the initial dose of fentanyl. The C50 for fentanyl to attenuate hemodynamic response to intubation (when combined with an intravenous hypnotic) is approximately 2 ng/mL. The V1 and Vdss for fentanyl are 13 L and 360 L, respectively. The dose of fentanyl thus ranges from a low of 26 µg (based on the V1 of 13 L) to a high 720 µg (based on the Vdss of 360 L). A fentanyl bolus of 26 µg achieves the desired concentration in the plasma for an initial instant (Fig. 2-24). Unfortunately, the plasma levels almost instantly decrease below the desired target, and the effect site levels are never close to the desired target. A fentanyl bolus of 720 µg, not surprisingly, produces an enormous overshoot in the plasma levels that persists for hours. It is absurd to use equations to calculate the fentanyl dose if the resulting recommendation is “pick a dose between 26 and 720 µg.”

Conventional approaches to calculate a bolus dose are designed to produce a specific plasma concentration. This makes little sense because the plasma is not the site of drug effect. By knowing the ke0 (the rate constant for elimination of drug from the effect site) of an intravenous anesthetic, we can design a dosing regimen that yields the desired concentration at the site of drug effect. If we do not want to overdose the patient, we should select the bolus that produces the desired peak concentration in the effect site.
The decline in plasma concentration after the bolus, up to the time of peak effect, can be thought of as a dilution of the bolus into a larger volume than the volume of the central compartment. One interesting characteristic of the equilibration between the plasma and the effect site is that at the time of peak effect, the plasma and the effect site concentrations are the same (if they were not the same, then it would not be the peak because there would be a gradient driving drug in or out of the effect site). This introduces the concept of Vdpe, the apparent volume of distribution at the time of peak effect. The size of this volume can be readily calculated from the observation that the plasma and effect site concentrations are the same at the time of peak effect:

where Cpe is the plasma concentration at the time of peak effect. We can arrange this equation to calculate the dose that provides the desired peak effect site concentration: bolus dose = CT × Vdpe. For example, the Vdpe for fentanyl is 75 L. Producing a peak fentanyl effect site concentration of 2 ng/mL requires 150 µg for the typical patient, which produces a peak effect in 3.6 minutes. This is a much more reasonable dosing guideline than the previous recommendation of picking a dose between 26 and 760 µg. Table 2-2 lists V1 and Vdpe for fentanyl, alfentanil, sufentanil, remifentanil, propofol, thiopental, and midazolam. Table 2-3 lists the time to peak effect and the t½ ke0 (half-life at the site of drug effect) of the commonly used intravenous anesthetics. Of course, individuals may differ from the typical patient. The individual characteristics that drive the differences may be known (age, weight, renal or hepatic dysfunction) in which case they can be built into the pharmacokinetic model if they are found to be significant. On the other hand, they may be unknown, in which case pharmacodynamic monitoring is required to fine tune dosing.


Maintenance Infusion Rate
As explained previously, to maintain a given target concentration, CT, drug must be delivered at the same rate that drug is exiting the body. Thus, the maintenance infusion rate at steady state is maintenance infusion rate = CT × ClS. However, this equation only applies after peripheral tissues have fully equilibrated with the plasma, which may require many hours. At all other times, this maintenance infusion rate underestimates the infusion rate to maintain a target concentration.
In some situations, this simple rate calculation may be acceptable. For example, if an infusion at this rate is used after a bolus based on Vdpe (apparent volume of distribution at time of peak effect), and the drug has a long delay between the bolus and peak effect, then much of the distribution of drug into the tissues may have occurred by the time of peak effect site concentration. In this case, the maintenance infusion rate calculated as clearance times target concentration may be satisfactory because Vdpe is sufficiently higher than V1 to account for the distribution of drug into peripheral tissues. Unfortunately, most drugs used in anesthesia have sufficiently rapid plasma-effect site equilibration that Vdpe does not adequately encompass the distribution process, making this approach unsuitable.
The mathematically and clinically sound approach accounts for tissue distribution. Initially, the infusion rate is higher than the simple calculation because it is necessary to replace the drug that gets taken up by peripheral tissues. However, the net flow of drug into peripheral tissues decreases over time. Therefore, the infusion rate required to maintain any desired concentration must also decrease over time. Following bolus injection, the equation to maintain the desired concentration is:

This equation indicates that a high infusion rate is initially required to maintain CT. Over time, the infusion rate gradually decreases (Fig. 2-25). At equilibrium (t = ∞), the infusion rate decreases to CT V1 k10, which is the same as CT× Cl. Nobody wants to mentally solve such an equation during administration of an anesthetic. Fortunately, there are simple techniques that can be used in place of solving such a complex expression.

Figure 2-26 is a nomogram in which the Equation 2-14 has been solved, showing the infusion rates over time necessary to maintain any desired concentration of fentanyl, alfentanil, sufentanil, and propofol. This nomogram is complex, and not even the authors use it. The point in including it is to show how infusion rates must be turned down over time as drug accumulates. The y-axis represents the target concentration, CT. The suggested target initial concentrations (shown in red) are based on the work of Vuyk and colleagues,17 and appropriately scaled for fentanyl and sufentanil. The x-axis is the time since the beginning of the anesthetic. The intersections of the target concentration line and the diagonal lines indicates the infusion rate appropriate at each point in time. For example, to maintain a fentanyl concentration of 1.0 ng/mL, the appropriate rates are 3.0 µg/kg/hour at 15 minutes, 2.4 µg/kg/hour at 30 minutes, 1.8 µg/kg/hour at 60 minutes, 2.1 µg/kg/hour at 120 minutes, and 0.9 µg/kg/hour at 180 minutes.

Another approach to determine infusion rates for maintenance of anesthesia to a desired target concentration is through the use of a specialized slide rule.18 Figure 2-27 illustrates such a slide rule for propofol. As described by Bruhn et al.,18 “The bolus dose required to reach a given target plasma concentration is the product of the (weight-related) distribution volume and required concentration. Similarly, the infusion rate at a particular time point is the product of target concentration, body weight, and a correction factor that depends on the time elapsed from the start of the initial infusion. This factor can be determined for each time point using a PK simulation program.”

The best approach is through the use of target-controlled drug delivery. With target-controlled drug delivery, the user simply sets the desired plasma or effect site concentration. Based on the drug’s pharmacokinetics and the mathematical relationship between patient covariates (e.g., weight, age, gender) and individual pharmacokinetic parameters, the computer calculates the dose of drug necessary to rapidly achieve and then maintain any desired concentration. Most critically, it can raise and lower concentrations in a controlled fashion, a calculation that cannot be captured in any simple nomogram. Such computerized controlled drug delivery systems are now widely available.
Context Sensitive Half-time
Special significance is often ascribed to the smallest exponent, which determines the slope of the final log-linear portion of the curve. When the medical literature refers to the half-life of a drug, unless otherwise stated, the half-life is based on the terminal half-life (i.e., 0.693/smallest exponent). However, the terminal half-life for drugs with more than 1 exponential term is nearly impossible to interpret. The terminal half-life sets an upper limit on the time required for the concentrations to decrease by 50% after drug administration. Usually, the time for a 50% decrease will be much faster than that upper limit. A more useful concept is the “context-sensitive half-time,” shown in Figure 2-28,19 which is the time for the plasma concentration to decrease by 50% from an infusion that maintains a constant concentration. The “context” is the duration of the infusion. The context-sensitive half-time increases with longer infusion durations, because it takes longer for the concentrations to fall if drug has accumulated in peripheral tissues.

The context-sensitive half-time is based on the time for a 50% decrease, which was chosen both to provide an analogy to half-life, and because, very roughly, a 50% reduction in drug concentration appears necessary for recovery after administration of most intravenous hypnotics at the termination of surgery. Of course, decreases other than 50% may be clinically relevant. Additionally, the context-sensitive half-time does not consider plasma-effect site disequilibrium and thus may be misleading for drugs with very slow plasma-effect site equilibration. A related but more clinically relevant representation is the context-sensitive effect site decrement time, as shown in Figure 2-29. For example, the upper black line in Figure 2-29 is the context-sensitive 20% effect site decrement time for fentanyl, that is, the time required for fentanyl effect site concentrations to fall by 20%, based on the duration of a fentanyl infusion. Context-sensitive half-time and effect site decrement times are more useful than elimination half-time in characterizing the clinical responses to drugs.20

Pharmacodynamics
Pharmacodynamics is the study of the intrinsic sensitivity or responsiveness of the body to a drug and the mechanisms by which these effects occur. Thus, pharmacodynamics may be viewed as what the drug does to the body. Structure–activity relationships link the actions of drugs to their chemical structure and facilitate the design of drugs with more desirable pharmacologic properties. The intrinsic sensitivity is determined by measuring plasma concentrations of a drug required to evoke specific pharmacologic responses. The intrinsic sensitivity to drugs varies among patients and within patients over time with aging. As a result, at similar plasma concentrations of a drug, some patients show a therapeutic response, others show no response, and in others, toxicity develops.
The basic principles of receptor theory were covered in the first section of this chapter. This section focuses on methods of evaluating clinical drug effects such as dose-response curves, efficacy, potency, the median effective dose (ED50), the median lethal dose (LD50), and the therapeutic index.
Concentration versus Response Relationships
The most fundamental relationship in pharmacology is the concentration (or dose) versus response curve, shown in Figure 2-30. This is the time-independent relationship between exposure to the drug (x-axis) and the measured effect (y-axis). The exposure can be the concentration, the dose, the area under the concentration versus time curve, or any other measure of drug exposure that is clinically meaningful. The measured effect can be an absolute response (e.g., twitch height), a normalized response (e.g., percentage of twitch depression), a population response (e.g., fraction of subjects moving at incision), or any physiologic response (chloride current). The standard equation for this relationship is the “Hill” equation, sometimes called the sigmoid-Emax relationship:


In this equation, E0 is the baseline effect in the absence of drug, and Emax is the maximum possible drug effect. C is typically concentration or dose, although other measures of drug exposure (e.g., dose, peak concentration, area under the concentration vs. time curve) can be used. C50 is the concentration associated with 50% of peak drug effect and is a measure of drug potency. The term ![]() is a modification of the saturation equation
is a modification of the saturation equation ![]() presented in the prior section. Previously, it did not have an exponent. However, when used in pharmacodynamic models, the exponent γ, also called the Hill coefficient, appears. The exponent relates to the “sigmoidicity” and steepness of the curve. If γ is less than 1 and the curve is plotted on a standard x-axis, then the curve appears hyperbolic (see Fig. 2-8). If γ is greater than 1, then the curve appears sigmoidal, as in Figure 2-30. If the x-axis is plotted on a log scale, then the curve will always appear sigmoidal regardless of the value of γ.
presented in the prior section. Previously, it did not have an exponent. However, when used in pharmacodynamic models, the exponent γ, also called the Hill coefficient, appears. The exponent relates to the “sigmoidicity” and steepness of the curve. If γ is less than 1 and the curve is plotted on a standard x-axis, then the curve appears hyperbolic (see Fig. 2-8). If γ is greater than 1, then the curve appears sigmoidal, as in Figure 2-30. If the x-axis is plotted on a log scale, then the curve will always appear sigmoidal regardless of the value of γ.
Potency and Efficacy
There are two problems with the term potency. Clinicians often use potency to refer to the relative dose of two drugs, such as the relative potency of fentanyl and morphine. The problem with this definition is that when drugs have very different time courses, the relative potency varies depending on the time of the measurement. Fentanyl reaches peak effect 3.5 minutes after injection. Morphine reaches peak effect 90 minutes after injection. As a result, the “relative potency” 3.5 minutes after injection indicates that fentanyl is far more potent than morphine. However, when morphine has reached its peak effect 90 minutes after injection, the effect of the fentanyl has almost entirely dissipated. Measured 90 minutes after injection, morphine is more potent. From therapeutic perspective, potency is often defined in terms of relative doses.
However, from a pharmacologic perspective, potency is more logically described in terms of the concentration versus response relationship. As shown in Figure 2-31, a drug with a left-shifted concentration versus response curve (i.e., lower C50) is considered more potent, whereas a drug with a right-shifted dose versus response curve is less potent. To be precise, potency should be defined in terms of a specific drug effect (e.g., 50% of maximal effect of a full agonist). This is particularly important if the two drugs have differing Hill coefficients or efficacies (Emax).

Efficacy is a measure of the intrinsic ability of a drug to produce a given physiologic or clinical effect (see Fig. 2-30). Consider the example of benzodiazepines given earlier (see Fig. 2-3). Intrinsic efficacy ranged from full effect for midazolam to partial effect for bretazenil, to no effect for flumazenil. The difference between a full agonist, a partial agonist, and an antagonist represents differences in efficacy. Efficacy refers to the position of the concentration versus response curve in the y-axis, whereas potency refers to relative drug concentration for a particular response on the y-axis.
Two drugs may have the same C50, but different efficacies. Because C50 is defined relative to the maximum drug effect, the drug with lower efficacy demonstrates less effect at C50 (Fig. 2-32) and is therefore less potent. This introduces the second problem with the term potency. One can only compare potencies by comparing C50 values if the maximum effect and the Hill coefficient are identical for both drugs. If not, then potency must be described in terms of a specific drug effect (a specific point on the y-axis of the dose vs. response curve).

Effective Dose and Lethal Dose
The ED50 is the dose of a drug required to produce a specific desired effect in 50% of individuals receiving the drug. The LD50 is the dose of a drug required to produce death in 50% of patients (or, more often, animals) receiving the drug. The therapeutic index is the ratio between the LD50 and the ED50 (LD50/ED50). The larger the therapeutic index of a drug, the safer the drug is for clinical administration. The relationship among ED50, LD50, and therapeutic index is shown in Figure 2-33. The classic calculation of LD50 is not clinically very helpful in anesthesia where we expect 100% of patients to fall asleep and nobody to die. A more effective ratio is the LD1/ED99 ratio. That ratio shows a far smaller margin of safety and actually is reversed in Figure 2-33, meaning that there is appreciable risk of death, even at subtherapeutic doses in some individuals. Anesthetic drugs have uniquely low therapeutic ratio, and thus require enormous vigilance for their safe use.

Drug Interactions
Actions at Different Receptors
Opioids potently reduce the minimum alveolar concentration (MAC) of inhaled anesthetics required to suppress movement to noxious stimulation (Fig. 2-34).21,22 Initially, the interaction is profound, with approximately 50% reduction in MAC at a plasma fentanyl concentration of 1.5 ng/mL. However, after the initial reduction in MAC, there is fairly limited benefit from additional fentanyl. The clinical pearl is that a modest amount of opioid dramatically reduces the concentrations of inhalational anesthetic required to prevent movement. The second pearl is that even with huge doses of opioids, some hypnotic component must be added to the anesthetic to prevent movement.

Similar work has been done for propofol. Vuyk and colleagues17 characterized the interaction of propofol with alfentanil. As shown in Figure 2-35, the interaction is markedly synergistic, with modest amounts of alfentanil greatly decreasing the amount of propofol associated with 50% chance of response to intubation or surgical incision. Vuyk and colleagues17 also documented a similar interaction of propofol and alfentanil on return of consciousness.

Hendrickx and colleagues23 have recently surveyed the interaction of anesthetic drugs that affect nociception, analgesia, and hypnosis (Fig. 2-36). They examined two endpoints: “hypnosis,” defined as loss of consciousness in humans and loss of righting reflex in animals, and “immobility,” defined as the loss of movement response to noxious stimulation in a nonparalyzed subject. As shown in Figure 2-36, the interaction between pairs of intravenous drugs and intravenous drugs and inhaled anesthetics is typically synergistic. An exception is the combination of the NMDA antagonists, ketamine and nitrous oxide, which demonstrate synergy, additivity, or infra-additivity in different models that have been studied. By contrast, the inhaled anesthetics are strictly additive in their interactions with other inhaled anesthetics, potentially suggesting a common mechanism of action.

Classic interaction studies, such as those described earlier, examine the concentrations associated with a particular response (such as a 50% chance of moving) for two drugs, evaluated separately and in combination. However, a more general view is that any combination of two drugs is associated with a response. This is best viewed as a “response surface” in which the x-axis and y-axis of the surface are concentrations (or doses) of drugs A and B, and the Z axis is the response to the particular combination. Minto et al.24 have proposed a mathematical framework for response surfaces for a variety of interaction surfaces of interest to anesthesiologists. Figure 2-37 shows six examples of possible response surfaces, depending on the nature of the interaction.

Stereochemistry
Stereochemistry is the study of how molecules are structured in three dimensions.25,26 Chirality is a unique subset of stereochemistry, and the term chiral is used to designate a molecule that has a center (or centers) of three-dimensional asymmetry. This kind of molecular configuration is almost always a function of the unique, tetrahedral bonding characteristics of the carbon atom.
Chirality is the structural basis of enantiomerism. Enantiomers (substances of opposite shape) are a pair of molecules existing in two forms that are mirror images of one another (right and left hand) but cannot be superimposed. In every other aspect, enantiomers are chemically identical. A pair of enantiomers is distinguished by the direction in which, when dissolved in solution, they rotate polarized light either clockwise (dextrorotatory, d [+]) or counterclockwise (levorotatory, l [−]). These observed signs of rotation, d(+) and l(−), are often confused with the designations D and L used in protein and carbohydrate chemistry. The characteristic of rotation of polarized light is the origin of the term optical isomers. When the two enantiomers are present in equal proportions (50:50), they are referred to as a racemic mixture. A racemic mixture does not rotate polarized light because the optical activity of each enantiomer is canceled by the other. The most applicable and unambiguous convention for designating isomers is the sinister (S) and rectus (R) classification that specifies the absolute configuration in the name of the compound.26 Molecular interactions that are the mechanistic foundation of pharmacokinetics and pharmacodynamics are stereoselective (relative difference between enantiomers) or stereospecific (absolute difference between enantiomers).26 The “lock and key” hypothesis of enzyme-substrate activity emphasizes that biologic systems are inherently stereospecific. The pharmacologic extension of this concept is that drugs can be expected to interact with other biologic components in a geometrically specific way.25 Pharmacologically, not all enantiomers are created equal. Drug-specific, drug-enzyme, and drug-protein binding interactions are virtually always three-dimensionally exacting. Enantiomers can exhibit differences in absorption, distribution, clearance, potency, and toxicity (drug interactions). Enantiomers can even antagonize the effects of one another.
The administration of a racemic drug mixture may in fact represent pharmacologically two different drugs with distinct pharmacokinetic and pharmacodynamic properties. The two enantiomers of the racemic mixture may have different rates of absorption, metabolism, and excretion as well as different affinities for receptor binding sites. Although only one enantiomer is therapeutically active, it is possible that the other enantiomer contributes to side effects. The therapeutically inactive isomer in a racemic mixture should be regarded as an impurity.27 A cogent theoretical argument is that studies on racemic mixtures may be scientifically flawed if the enantiomers have different pharmacokinetics or pharmacodynamics.25 An estimated one-third of drugs in clinical use are administered as racemic mixtures, but their use is likely to decrease in the future although the clinical advantages of single enantiomers must be balanced against the increased costs of drugs.26 Enantiomer-specific drug studies are likely to become more common in the future. Regulatory agencies and pharmaceutical companies are increasingly aware of the importance of identification of the therapeutic enantiomer in pharmacology and are likely to avoid the scientific ambiguities associated with the development of racemic drugs.25,28 Progress in chemical engineering technology has greatly simplified the separation and the preparation of individual enantiomers.
Clinical Aspects of Chirality
More than one-third of all synthetic drugs are chiral, although most of them are utilized clinically as racemic mixtures.26,29 In addition to thiopental, methohexital and ketamine are administered as racemic mixtures. The majority of inhaled anesthetics are chiral with the notable exception of sevoflurane. Most evidence suggests that enantiomer-selective effects for volatile anesthetics are relatively weak in contrast to much stronger evidence for specific drug-receptor interactions for intravenous anesthetics.29 Local anesthetics, including mepivacaine, prilocaine, and bupivacaine, have a center of molecular asymmetry. The S (+) enantiomer of ketamine is more potent than the R (−) form and is also less likely to produce emergence delirium. Similarly, in addition to pharmacokinetic differences, the cardiac toxicity of bupivacaine is thought to be predominantly due to the R-bupivacaine isomer. Ropivacaine is the S-enantiomer of a bupivacaine homolog, which has decreased cardiac toxicity. Likewise, the S-enantiomer of bupivacaine, levobupivacaine is associated with less cardiac toxicity than bupivacaine. Cisatracurium is an isomer of atracurium that lacks histamine-releasing potential. Drugs used in anesthesia that occur naturally reflect the importance of stereochemistry, with morphine (actually l-morphine) and d-tubocurarine being examples. Because these drugs are synthesized by nature’s stereospecific enzymatic machinery, they exist in a single form before they are extracted and purified.25
Individual Variability
The response to many drugs varies greatly among patients.30 After administration of identical doses, some patients may have clinically significant adverse effects, whereas others may exhibit no therapeutic response. Some of this diversity of response can be ascribed to differences in the rate of drug metabolism, particularly by the cytochrome P450 family of enzymes. The incorporation of pharmacogenetics into clinical medicine may become useful in predicting patient responses to drugs.
Variability of individual responses to a drug often reflects differences in pharmacokinetics and/or pharmacodynamics among patients (Table 2-4).4 This may even account for differences in pharmacologic effects of drugs in the same patient at different times. Accurate dosing is difficult to achieve in the presence of interindividual variability and it is not unusual to find a twofold or more variation in plasma concentrations achieved in different individuals using the same dosing scheme. This is true for inhaled as well as injected drugs. Furthermore, there may be a fivefold range in the plasma concentrations of a drug required to achieve the same pharmacologic effect in different individuals, and this range may be even greater if tolerance has developed in some individuals.

The relative importance of the numerous factors that contribute to variations in individual responses to drugs depends, in part, on the drug itself and its usual route of excretion. Drugs excreted primarily unchanged by the kidneys tend to exhibit smaller differences in pharmacokinetics than do drugs that are metabolized. The most important determinant of metabolic rate is genetic. Changes in metabolic rate have little impact on drugs with a high extraction ratio as the efficiency of extraction is so great that hepatic blood flow is a more rate-limiting factor than metabolism. Conversely, the systemic clearance of low-extraction drugs is highly susceptible to small changes in the rate of metabolism. For example, the systemic clearance of alfentanil is exquisitely sensitive to CYP induction and inhibition, whereas clearance of high-extraction opioids such as fentanyl and sufentanil is minimally influenced.31Interindividual variability in the response to the prodrug codeine is determined by activity of CYP2D6-mediated O-demethylation to morphine and morphine-6-glucuronide. CYP2D6-deficient individuals have diminished or absent morphine formation following administration of codeine, whereas individuals with CYP2D6 gene amplification experience exaggerated opioid effects following administration of codeine (“codeine intoxication”).32 Quinidine inhibits CYP2D6 and markedly diminishes codeine metabolism the active metabolite, morphine. The dynamic state of receptor concentrations, as influenced by diseases and other drugs, also influences the variation in drug responses observed among patients. Finally, inhaled anesthetics, by altering circulatory, hepatic, and renal function, may influence the pharmacokinetics of injected drugs.
In clinical practice, the impact of interpatient variability may be masked by the administration of high doses of a drug. For example, the administration of 2 to 3 × ED95 of a nondepolarizing neuromuscular blocking drug is common practice for achieving a skeletal muscle paralysis in all patients. Inter-patient variability, however, is manifest if the level of neuromuscular blockade and duration of action is monitored. Furthermore, it is common practice in anesthesia to administer drugs in proportion to body weight although pharmacokinetic and pharmacodynamic principles may not support this practice. In attempts to minimize interindividual variability, computerized infusion systems (target-controlled infusion systems) have been developed to deliver intravenous drugs (alfentanil, remifentanil, etomidate, propofol) to achieve a desired (target) concentration (reviewed in reference 3).
Elderly Patients
In elderly patients, variations in drug response most likely reflect (a) decreased cardiac output, (b) increased fat content, (c) decreased protein binding, and (d) decreased renal function. Decreased cardiac output decreases hepatic blood flow and, thus, delivery of drug to the liver for metabolism. This decreased delivery, combined with the possibility of decreased hepatic enzyme activity, may prolong the duration of action of drugs such as lidocaine and fentanyl.33 An enlarged fat compartment may increase the Vd and lead to the accumulation of lipid-soluble drugs such as diazepam and thiopental.34 Increased total body fat content and decreased plasma protein binding of drugs accounts for the increased Vd that accompanies aging. A parallel decrease in total body water accompanies increased fat stores. The net effect of these changes is an increased vulnerability of elderly patients to cumulative drug effects. Effects of age on PK and PD are discussed in detail in Chapter 46.
Enzyme Activity
Alterations in enzyme activity as reflected by enzyme induction may be responsible for variations in drug responses among individuals. For example, cigarette smoke contains polycyclic hydrocarbons that induce mixed-function hepatic oxidases, leading to increased dose requirements for drugs such as theophylline and tricyclic antidepressants. Acute alcohol ingestion can inhibit metabolism of drugs. Conversely, chronic alcohol use (>200 g per day) induces microsomal enzymes that metabolize drugs. Because of enzyme induction, this accelerated metabolism may manifest as tolerance to drugs such as barbiturates.
Genetic Disorders
Variations in drug responses among individuals are due, in part, to genetic differences that may also affect receptor sensitivity. Genetic variations in metabolic pathways (rapid vs. slow acetylators) may have important clinical implications for drugs such as isoniazid and hydralazine. Pharmacogenetics describes genetically determined disease states that are initially revealed by altered responses to specific drugs. Examples of diseases that are unmasked by drugs include (a) atypical cholinesterase enzyme revealed by prolonged neuromuscular blockade after administration of succinylcholine or mivacurium; (b) malignant hyperthermia triggered by succinylcholine or volatile anesthetics; (c) glucose-6-phosphate dehydrogenase deficiency, in which certain drugs cause hemolysis; and (d) intermittent porphyria, in which barbiturates may evoke an acute attack.
Drug Interactions
A drug interaction occurs when a drug alters the intensity of pharmacologic effects of another drug given concurrently. Drug interactions may reflect alterations in pharmacokinetics (increased metabolism of neuromuscular blocking drugs in patients receiving anticonvulsants chronically) or pharmacodynamics (decrease in volatile anesthetic requirements produced by opioids). The net result of a drug interaction may be enhanced or diminished effects of one or both drugs, leading to desired or undesired effects. A physicochemical drug interaction occurs when two incompatible drugs are mixed in the same solution (precipitate of the conjugate salt of a weak acid and weak base when pancuronium and thiopental are mixed together in the same intravenous tubing). The potential for drug interactions in the perioperative period is great, considering the large number of drugs from different chemical classes that are likely to be part of anesthesia management. For example, a typical “balanced anesthetic” may include benzodiazepines, sedative-hypnotics, opioids, neuromuscular blocking drugs, anticholinergics, anticholinesterases, sympathomimetics, sympathetic nervous system blocking drugs, and antibiotics.
An example of a beneficial drug interaction is the concurrent administration of propranolol with hydralazine to prevent compensatory increases in heart rate that would offset the blood pressure–lowering effects of hydralazine. Interactions between drugs are frequently used to counter the effects of agonist drugs, as reflected by the use of naloxone to antagonize opioids. Adverse drug interactions typically manifest as impaired therapeutic efficacy and/or enhanced toxicity. In this regard, one drug may interact with another to (a) impair absorption, (b) compete with the same plasma protein-binding sites, (c) alter metabolism by enzyme induction or inhibition, or (d) change the rate of renal excretion.
References
1. Shafer S. Principles of pharmacokinetics and pharmacodynamics. In: Longnecker DE, Tinker JH, Morgan GE, eds. Principles and Practice of Anesthesiology. 2nd ed. St. Louis, MO: Mosby-Year Book; 1997:1159.
2. Shafer S, Flood P, Schwinn D. Basic principles of pharmacology. In: Miller RD, Eriksson LI, Fleisher LA, et al, eds. Miller’s Anesthesia. Vol 1. 7th ed. Philadelphia, PA: Churchill Livingstone; 2010:479–514.
3. Glass PSA, Shafer S, Reves JG. Intravenous drug delivery systems. In: Miller RD, Eriksson LI, Fleisher LA, et al, eds. Miller’s Anesthesia. Vol 1. 7th ed. Philadelphia, PA: Churchill Livingstone; 2010:825–858.
4. Wood M. Variability of human drug response. Anesthesiology. 1989;71:631–634.
5. Boer F, Bovill JG, Burm AGL, et al. Effect of ventilation on first-pass pulmonary retention of alfentanil and sufentanil in patients undergoing coronary artery surgery. Br J Anaesth. 1994;73:458–463.
6. Wood M. Plasma drug binding: implications for anesthesiologists. Anesth Analg. 1986;65:786–804.
7. Nelson DR. Cytochrome P450 and the individuality of species. Arch Biochem Biophys. 1999;369:1–10.
8. Wilkinson GR, Shand DG. Commentary: a physiological approach to hepatic drug clearance. Clin Pharmacol Ther. 1975;18:377–390.
9. Cockcroft DW, Gault MH. Prediction of creatinine clearance from serum creatinine. Nephron. 1976;16:31–41.
10. Hug CC. Pharmacokinetics of drugs administered intravenously. Anesth Analg. 1978;57:704–723.
11. Ebling WF, Wada DR, Stanski DR. From piecewise to full physiologic pharmacokinetic modeling: applied to thiopental disposition in the rat. J Pharmacokinet Biopharm. 1994;22:259–292.
12. Wada DR, Björkman S, Ebling WF, et al. Computer simulation of the effects of alterations in blood flows and body composition on thiopental pharmacokinetics in humans. Anesthesiology. 1997;87:884–899.
13. Youngs EJ, Shafer SL. Basic pharmacokinetic and pharmacodynamic principles. In: White PF, ed. Textbook of Intravenous Anesthesia. Baltimore, MD: Lippincott Williams & Wilkins; 1997:10.
14. Scott JC, Ponganis KV, Stanski DR. EEG quantitation of narcotic effect: the comparative pharmacodynamics of fentanyl and alfentanil. Anesthesiology. 1985;62:234–241.
15. Scott JC, Stanski DR. Decreased fentanyl and alfentanil dose requirements with age. A simultaneous pharmacokinetic and pharmacodynamic evaluation. J Pharmacol Exp Ther. 1987;240:159–166.
16. Minto CF, Schnider TW, Gregg KM, et al. Using the time of maximum effect site concentration to combine pharmacokinetics and pharmacodynamics. Anesthesiology. 2003;99:324–333.
17. Vuyk J, Lim T, Engbers FH, et al. The pharmacodynamic interaction of propofol and alfentanil during lower abdominal surgery in women. Anesthesiology. 1995;83:8–22.
18. Bruhn J, Bouillon TW, Ropcke H, et al. A manual slide rule for target-controlled infusion of propofol: development and evaluation. Anesth Analg. 2003;96:142–147.
19. Hughes MA, Glass PSA, Jacobs JR. Context-sensitive half-time in multicompartment pharmacokinetic models for intravenous anesthetic drugs. Anesthesiology. 1992;76:334–341.
20. Fisher DM. (Almost) everything you learned about pharmacokinetics was (somewhat) wrong! Anesth Analg. 1996;83:901–903.
21. Sebel PS, Glass PS, Fletcher JE, et al. Reduction of the MAC of desflurane with fentanyl. Anesthesiology. 1992;76:52–59.
22. McEwan AI, Smith C, Dyar O, et al. Isoflurane minimum alveolar concentration reduction by fentanyl. Anesthesiology. 1993;78:864–869.
23. Hendrickx JF, Eger EI II, Sonner JM, et al. Is synergy the rule? A review of anesthetic interactions producing hypnosis and immobility. Anesth Analg. 2008;107:494–506.
24. Minto CF, Schnider TW, Short TG, et al. Response surface model for anesthetic drug interactions. Anesthesiology. 2000;92:1603–1616.
25. Egan TD. Stereochemistry and anesthetic pharmacology: joining hands with the medicinal chemists. Anesth Analg. 1996;83:447–450.
26. Nau C, Strichartz GR. Drug chirality in anesthesia. Anesthesiology. 2002;97:497–502.
27. Ariens EJ. Stereochemistry, a basis for sophisticated nonsense in pharmacokinetics and clinical pharmacology. Eur J Clin Pharmacol. 1984;26:663–668.
28. Nation RL. Chirality in new drug development. Clinical pharmacokinetic considerations. Clin Pharmacokinet. 1994;27:249–255.
29. Burke D, Henderson DJ. Chirality: a blueprint for the future. Br J Anaesth. 2002;88:563–576.
30. Caraco Y. Genes and the response to drugs. N Engl J Med. 2004;351:2867–2869.
31. Kharasch ED, Russell M, Mautz D, et al. The role of cytochrome P450 3A4 in alfentanil clearance: implications for interindividual variability in disposition and perioperative drug interactions. Anesthesiology. 1997;87:36–50.
32. Gasche Y, Daali Y, Fathi M, et al. Codeine intoxication associated with ultrarapid CYP2D6 metabolism. N Engl J Med. 2004;351:2827–2831.
33. Bentley JB, Borel JD, Nad RE, et al. Age and fentanyl pharmacokinetics. Anesth Analg. 1982;61:968–971.
34. Jung D, Mayersohn M, Perrie D, et al. Thiopental disposition as a function of age in female patients undergoing surgery. Anesthesiology. 1982;56:263–268.