
Appendix A
Normal Values of Erythrocytes, Leukocytes, and Platelets in Adult Human Blood*
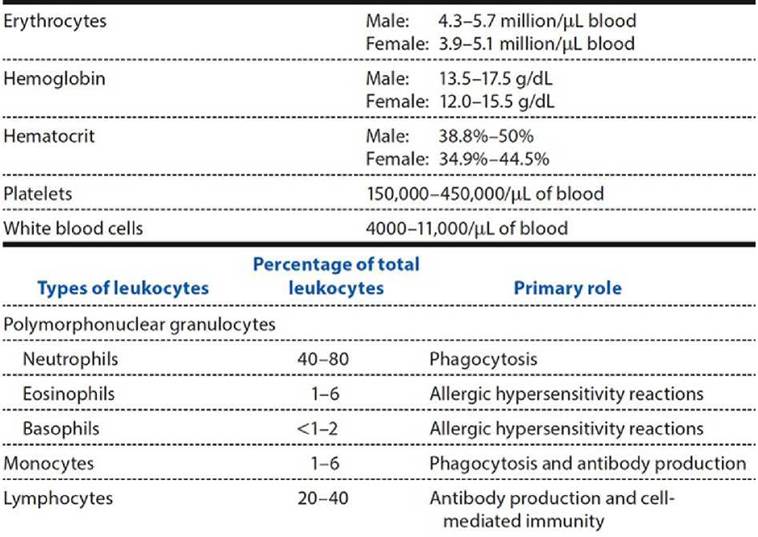
*Normal reference ranges vary somewhat with age and race. They may also vary from laboratory to laboratory. To confuse the issue further, various unit measurements are used to report blood data, and so caution must be used in examining data.
Appendix B
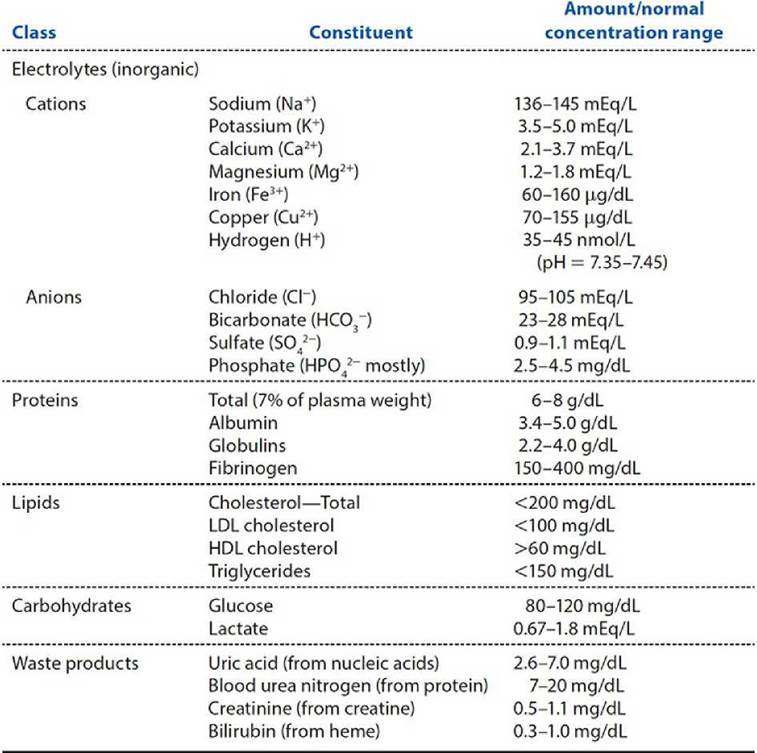
Some Normal Constituents of Adult Human Plasma
Appendix C
Key Cardiovascular Variables and Their Normal
Determinants1
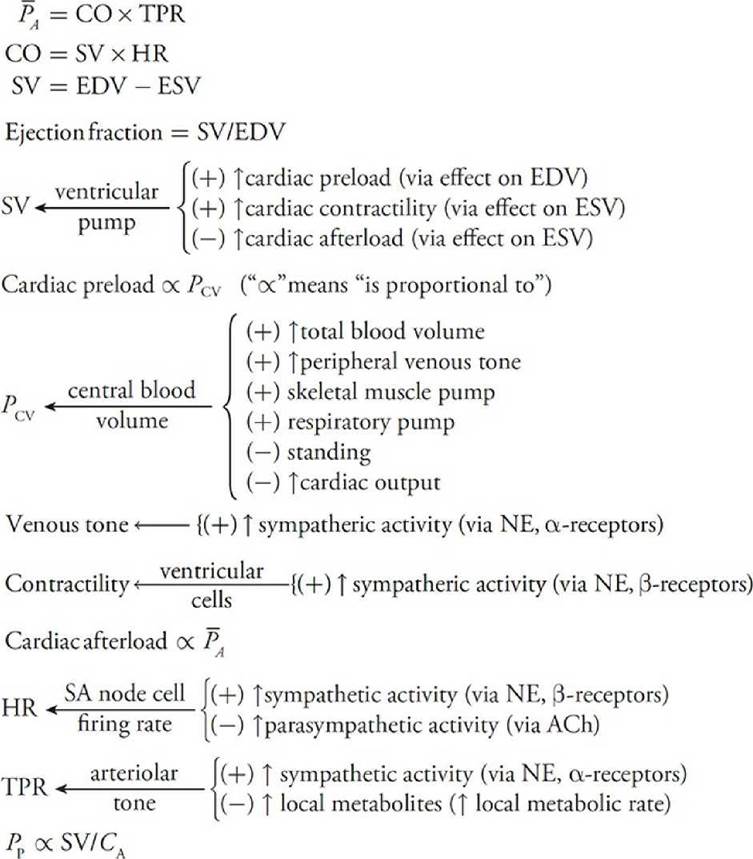
1 PA , mean arterial pressure; CO, cardiac output; TPR, total peripheral resistance; SV, stroke A volume; HR, heart rate; ESV, end-systolic volume; EDV, end-diastolic volume; Pcv, central venous pressure; NE, norepinephrine; ACh, acetylcholine; Pp, arterial pulse pressure; СA, arterial compliance; SA, sinoatrial.
Appendix D
Hemostasis
Whenever damage occurs to a blood vessel, a variety of processes are evoked that are aimed at preventing or stopping blood from exiting the vascular space. The 3 primary processes are summarized in the following list:
I. Platelet aggregation and plug formation: Occur as a result of the following steps:
A. Vessel injury with endothelial damage and collagen exposure.
B. Platelet adherence to collagen (mediated by the plasma protein, von Willebrand factor).
C. Platelet shape change (from disks to spiny spheres) and degranulation with release of the following:
1. Adenosine diphosphate, which causes platelet aggregation and “plugs” the hole.
2. Thromboxane, which causes vasoconstriction and potentiates platelet adhesion and aggregation.
II. Local vasoconstriction: Mediated largely by thromboxane but may also be induced by local release of other chemical signals that constrict local vessels and reduce blood flow.
III. Blood clotting: The formation of a solid gel made up of the protein, fibrin, platelets, and trapped blood cells.
The critical step in blood clotting is the formation of thrombin from prothrombin, which then catalyzes the conversion of fibrinogen to fibrin. The final clot is stabilized by covalent cross-linkages between fibrin strands catalyzed by factor XIIIa (the formation of which is catalyzed by thrombin).
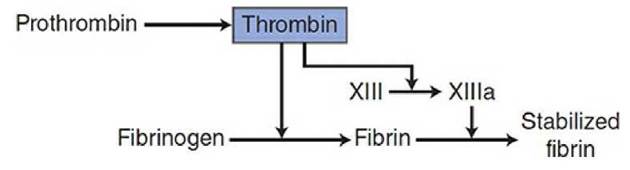
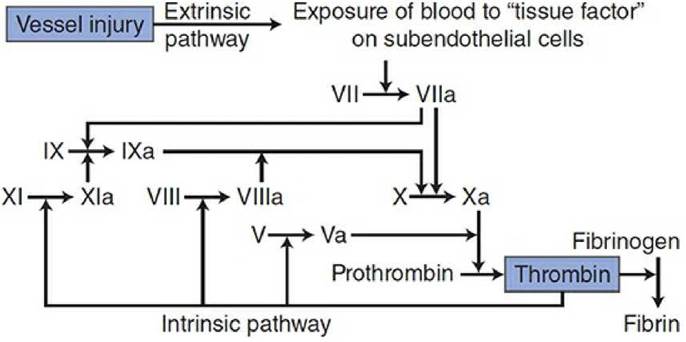
The cascade of reactions that leads from vessel injury to the formation of thrombin is shown in the figure below and is described as follows:
A. Vessel injury or tissue damage with blood exposure to subendothelial cells that release thromboplastin (“tissue factor”).
B. The plasma protein factor VII binds to the tissue factor, which converts it to an activated form, factor VIIa.
C. VIIa catalyzes the conversion of both factors IX and X to activated forms IXa and Xa, respectively.
D. IXa also helps convert factor X to Xa (Stuart factor).
E. Xa converts prothrombin to thrombin.
F. Thrombin.
1. Activates platelets (makes them sticky, induces degranulation, and promotes attachment of various factors that participate in clotting).
2. Converts fibrinogen to fibrin.
3. Recruits the “intrinsic pathway,” which amplifies further formation of factor Xa and facilitates the conversion of prothrombin to thrombin by promoting the following reactions:
a. Conversion of factor XI to its activated form, XIa, which then converts factor IX to IXa, which then attaches to activated platelets and converts factor X to Xa.
b. Conversion of factor VIII (missing in hemophiliacs) to its activated form, VIIIa, which attaches to activated platelets and accelerates conversion of factor X to Xa.
c. Conversion of factor V to its activated form, Va, which attaches to activated platelets and accelerates conversion of prothrombin to thrombin.
Several agents clinically used as anticoagulants interfere with various steps in this clotting process. Aspirin and other cyclooxygenase inhibitors are anticoagulants because they prevent the formation of thromboxane. Dicoumarol and coumadin block the activity of vitamin K, which is necessary for synthesis of many of the clotting factors by the liver. Specific inhibitors of the actions of various clotting factors are also now available. Heparin activates a plasma protein called antithrombin III, which, in turn, inactivates thrombin and several of the other clotting factors. In addition, a separate class of drugs that focus on preventing platelet aggregation are also useful in preventing clot formation. Because calcium is an important clotting cofactor, calcium chelators such as EDTA, oxalate, and citrate are used to prevent stored blood from clotting. Various thrombolytic agents modeled after the endogenous tissue plasminogen activator ( tPA) are also available that promote dissolution of the fibrin clot after it is formed. These agents promote the formation of plasmin from plasminogen, which enzymatically attacks the clot, turning it into soluble peptides.
Appendix E
Analysis of the Arterial Baroreflex
For most purposes, the simple “thermostat analogy” provides a sufficient understanding of how the arterial baroreflex operates. However, in certain situations—especially when there are multiple disturbances on the cardiovascular system—a more detailed understanding is helpful. Consequently, the operation of the arterial baroreflex is presented in this appendix with a more formal control system approach.
The complete arterial baroreceptor reflex pathway is a control system made up of two distinct portions, as shown in Figure E—1: (1) an effector portion, including the heart and peripheral blood vessels; and (2) a neural portion, including the arterial baroreceptors, their afferent nerve fibers, the medullary cardiovascular centers, and the efferent sympathetic and parasympathetic fibers. Mean arterial pressure is the output of the effector portion and simultaneously the input to the neural portion. Similarly, the activity of the sympathetic (and parasympathetic) cardiovascular nerves is the output of the neural portion of the arterial baroreceptor control system and, at the same time, the input to the effector portion. For convenience, we omit continual reference to parasympathetic nerve activity in the following discussion. Throughout, however, an indicated change in sympathetic nerve activity should usually be taken to imply a reciprocal change in the activity of the cardiac parasympathetic nerves.
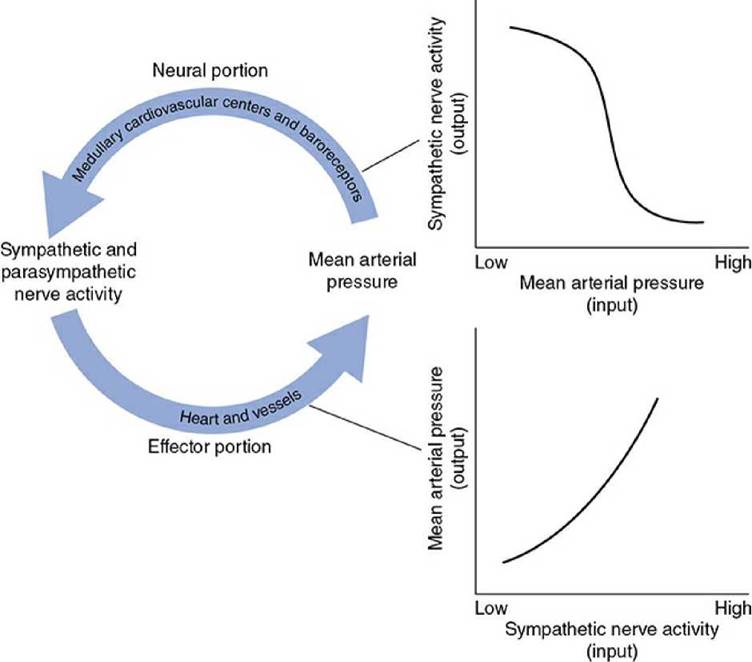
Figure E-1. Neural and effector portions of the arterial baroreceptor control system.
A host of reasons why mean arterial pressure increases when the heart and peripheral vessels receive increased sympathetic nerve activity were discussed in this textbook. All this information is summarized by the curve shown in the lower graph in Figure E-1, which describes the operation of the effector portion of the arterial baroreceptor system alone. In Chapter 9, how increased mean arterial pressure acts through the arterial baroreceptors and medullary cardiovascular centers to decrease the sympathetic activity has also been discussed. This information is summarized by the curve shown in the upper graph in Figure E-1, which describes the operation of the neural portion of the arterial baroreceptor system alone.
When the arterial baroreceptor system is intact and operating as a closed loop, the effector portion and neural portion retain their individual rules of operation, as described by their individual function curves in Figure E-1. Yet in the closed loop, the two portions of the system must interact until they come into balance with each other at some operating point with a mutually compatible combination of mean arterial pressure and sympathetic activity. The analysis of the complete system begins by plotting the operating curves for the neural and effector portions of the systems together on the same graph, as shown in Figure E-2A. To accomplish this superimposition, the graph for the neural portion (the upper graph in Figure E-1) was flipped to interchange its vertical and horizontal axes. Consequently, the neural curve (but not the effector curve) in Figure E-2A must be read in the unusual sense that its independent variable, arterial pressure, is on the vertical axis and its dependent variable, sympathetic nerve activity, is on the horizontal axis.
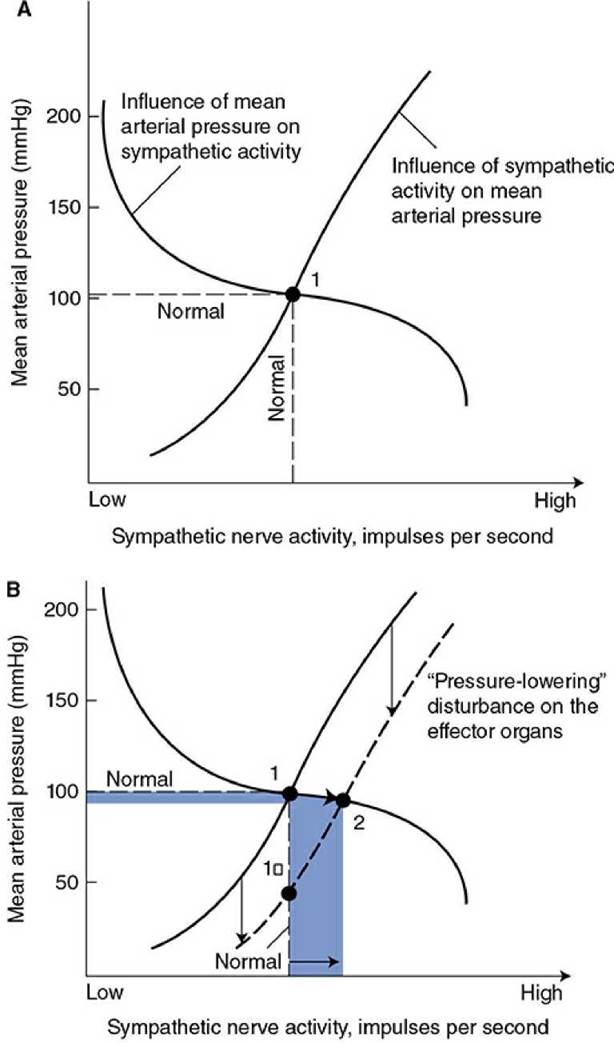
Figure E-2. Operation of the arterial baroreceptor control system: ( A) normal balance and ( B) operating point shift with disturbance on the effector portion.
Whenever there is any outside disturbance on the cardiovascular system, the operating point of the arterial baroreceptor system shifts. This happens because all cardiovascular disturbances cause a shift in one or the other of the two curves in Figure E-2A. For example, Figure E-2B shows how the operating point for the arterial baroreceptor system is shifted by a cardiovascular disturbance that lowers the operating curve of the effector portion. The disturbance in this case could be anything that reduces the arterial pressure produced by the heart and vessels at each given level of sympathetic activity. Blood loss, for example, is such a disturbance because it lowers central venous pressure and, through the Starling law, lowers cardiac output and thus mean arterial pressure at any given level of cardiac sympathetic nerve activity. Metabolic vasodilation of arterioles in exercising skeletal muscle is another example of a pressure-lowering disturbance on the effector portion of the system because it lowers the total peripheral resistance and thus the arterial pressure that the heart and vessels produce at any given level of sympathetic nerve activity.
As shown by point 2 in Figure E-2B, any pressure-lowering disturbance on the heart or vessels causes a new balance to be reached within the baroreceptor system at a slightly lower than normal mean arterial pressure and a higher than normal sympathetic activity level. Note that the point 1' in Figure E-2B indicates how far the mean arterial pressure would have fallen as a consequence of the disturbance, had not the sympathetic activity been automatically increased above normal by the arterial baroreceptor system.
As indicated previously in Chapter 9 and in this appendix, many disturbances act on the neural portion of the arterial baroreceptor system rather than directly on the heart or vessels. These disturbances shift the operating point of the cardiovascular system because they alter the operating curve of the neural portion of the system. For example, the influences listed in Figure 9-4 that raise the set point for arterial pressure do so by shifting the operating curve for the neural portion of the arterial baroreceptor system to the right, as shown in Figure E-3A, because they increase the level of sympathetic output from the medullary cardiovascular centers at each and every level of arterial pressure (i.e., at each and every level of input from the arterial baroreceptors). For example, a sense of danger will cause the components of the arterial baroreceptor system to come into balance at a higher than normal arterial pressure and a higher than normal sympathetic activity, as shown by point 2 in Figure E-3A. Conversely, but not shown in Figure E-3, any of the set-point-lowering influences listed in Figure 9-4 acting on the medullary cardiovascular centers will shift the operating curve for the neural portion of the arterial baroreceptor system to the left, and a new balance will be reached at lower than normal arterial pressure and sympathetic activity.
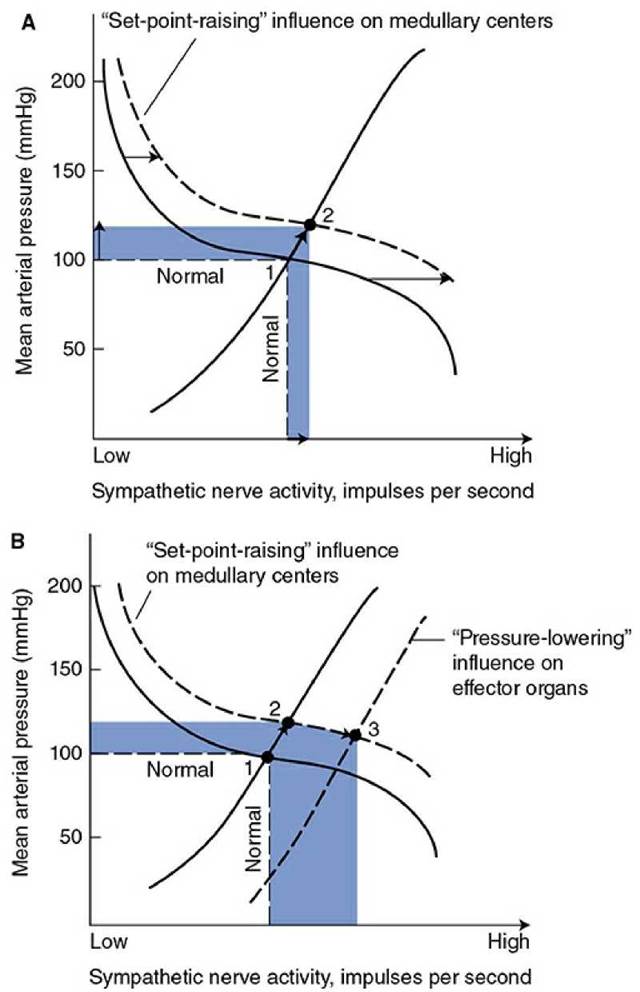
Figure E-3. The effect of neural influences on the arterial baroreceptor control system: ( A) operating point shift with disturbance on the neural portion and ( B) operating point shift with disturbances on both neural and effector portions.
Many physiological and pathological situations involve simultaneous disturbances on both the neural and effector portions of the arterial baroreceptor system. Figure E-3A illustrates this type of situation. The setpoint-increasing disturbance on the neural portion of the system alone causes the equilibrium to shift from point 1 to point 2. Superimposing a pressure-lowering disturbance on the heart or vessels further shifts the equilibrium from point 2 to point 3. Note that, although the response to the pressure-lowering disturbance in Figure E-3B (point 2 to point 3) starts from a higher than normal arterial pressure, it is essentially identical to that which occurs in the absence of a set-point-increasing influence on the cardiovascular center (see Figure E-2B). Thus, the response is an attempt to prevent the arterial pressure from falling below that at point 2. The overall implication is that any of the set-point-increasing influences on the medullary cardiovascular centers listed in Figure 9-4 cause the arterial baroreceptor system to regulate arterial pressure to a higher than normal value. Conversely, the set-point-lowering influences on the medullary cardiovascular centers listed in Figure 9-4 would cause the arterial baroreceptor system to regulate arterial pressure to a lower than normal value.
Several situations that involve a higher than normal sympathetic activity at a time when arterial pressure is itself higher than normal are discussed in Chapters 10 and 11. It should be noted that higher than normal sympathetic activity and higher than normal arterial pressure can exist together only when there is a set-point-raising influence on the neural portion of the arterial baroreceptor system.