
It is probably obvious that for most subjects the quality of understanding is limited by the quality of information. If our information is faulty, so is our understanding. Conversely, as we learn more, our understanding of processes and events will improve. The advent of shared databases, the internet, and other communication tools has given us unprecedented insight into unfolding events around the world. Similarly, advances in molecular, biochemical, and other diagnostic technologies are changing the limits of genetic testing and screening. But we must put this into an historical perspective. Molecular insights have set the foundation for recent changes in the relatively short history of technological advancement. Not long ago, resources like personalized DNA databases and targeted genetic testing were hardly even imaginable. But today, the only certain prediction about the future of individualized genomic data is that information will increase.
When considering available genetic tests, one quite reasonable question is: “why not just get the most detailed information first? Do a DNA sequence.” This is, after all, the age of genomics (Figure 11-1). DNA sequencing is being applied to identify genetic variation among individuals, within population groups, and in hundreds of species throughout the animal and plant worlds. But sequencing can be comparatively expensive and time consuming. In addition, it can give more information than is really necessary to answer most clinical questions. Indeed, sometimes the mass of information can actually bury the key result.
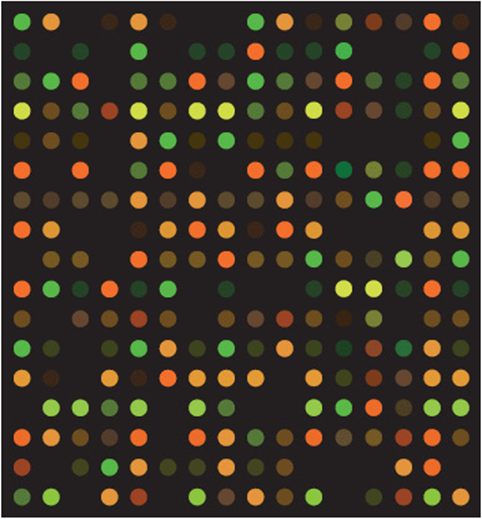
Figure 11-1. A small portion of a large DNA microarray or “gene chip.” Each of the colored spots shows binding of fluorescently-labeled cDNA made from the RNA isolated from a tissue sample. Spot color indicates the amount of binding and thus the relative amount of RNA in the original sample.
In this chapter we will explore some of the growing array of genetic tests that are currently available, although we must recognize that this field will advance rapidly as new techniques are discovered and applied. This creates a continuing challenge for physicians and genetic counselors. But that is not bad. A growing battery of analytical tools and data sources—in other words, the “information challenge”—is good news for the medical profession and for patients. Still, it means that all of us need to stay up-to-date on new advances. This chapter will focus on some of the practical aspects of testing and evaluating genetic conditions in patients. What are some of the tools available to analyze a patient’s condition? What principles guide screening and interpretation? Not surprisingly, the topic of this chapter will probably change almost daily in the world of the practicing clinician.
But behind this advance in technology hides an age-old question. What does it all mean? It is not uncommon for the results of a DNA screen to report “finding of unknown clinical significance.” The warning should be clear. More information does not necessarily make you smarter.
Part 1: Background and Systems Integration
Linkage Disequilibrium
Segregation patterns were discussed in Chapter 5 on Cytogenetics. There we saw that, if two genes are on different chromosomes or are more than 50 map units apart on the same chromosome, they will assort independently. In the Mendelian cross of A a B b × a a b b, for example, the four segregating types from the dihybrid parent will each have an expected frequency of ¼: AB, Ab, aB, and ab. But if the two genes are located closely together on the same chromosome, there will be a tendency for the linked alleles to be inherited together, so the four types will deviate from expected equilibrium values. Depending upon the arrangement of alleles in the dihybrid parent, two of these four combinations (say, AB and ab) will occur more often than expected by chance.
When we generalize from this familiar Mendelian mating to view the behavior of genes in the population, the same basic expectation still holds. Alleles combine as a function of their frequency in the mating. In a population, however, the frequencies of the A and a alleles (and of the B and b alleles) are generally very different. Still, the alleles are predicted to assort as a function of their individual frequencies, an application of the product rule of probability. But if there is some association between these two genes in the population, such as being closely linked together on the same chromosome, allele combinations will not be at random (i.e., they will not be at equilibrium). In other words, there will be linkage disequilibrium.
Linkage disequilibrium is generally expressed in terms of the expectations from matrix algebra as shown in Figure 11-2. The determinant of a matrix (D) is the difference between the products of the two cisand two transassociations of gametes, (A B × a b) – (A b × a B). Thus, D is formally the “gametic determinant,” the determinant of a matrix composed of the four combinations of alleles at two loci. In the context of genetics, it is the difference between the cis and trans linkages in the population sample and is simply a measure of association. If there is no preferred association between the two variables, they are “dis-associated” and the cis arrangements have the same frequency as the trans arrangements. In that case the value of D is zero. But if alleles at the A and B loci are linked, either in cis or in trans, the value of D is significantly positive or negative, depending on whether the cis or the trans linkages are favored. This idea is applied broadly in measuring the association between segregating DNA markers and traits of genetic interest.
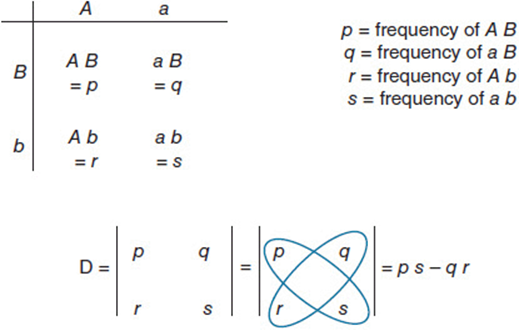
Figure 11-2. Linkage disequilibrium is measured by the gametic determinant, D, which quantifies the deviation from random association (or linkage equilibrium) between pairs of alleles. It is the determinant of a matrix composed of the four ways in which alleles of two genes can be linked. The product of the two cis linkages, p and s, should equal the product of the two trans linkages, q and r, unless there is some nonrandom association among alleles.
As with most metrics, however, there are caveats. For example, there can be statistical association without functional association if, for example, the population has recently gone through a bottleneck and recombination has not yet had time to achieve linkage equilibrium. In addition, a functional association among alleles is usually strong evidence of linkage between those genes, but related genetic functions showing linkage disequilibrium need not always be linked chromosomally. They may simply be linked by function.
Types of Genetic Tests
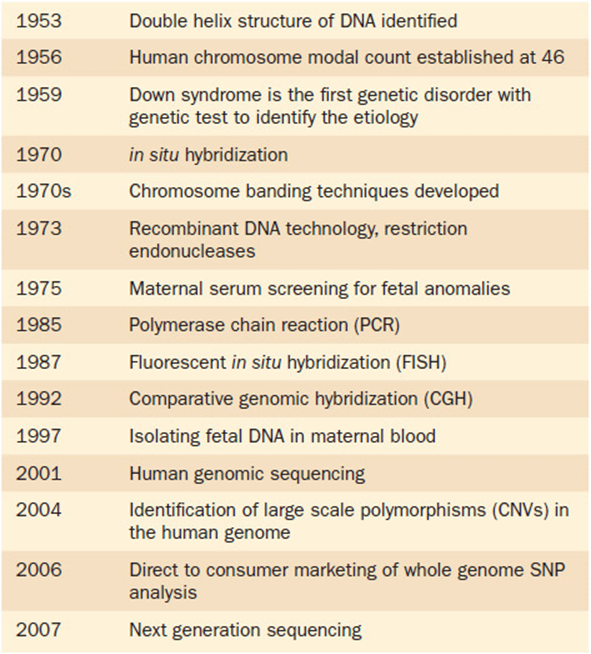
The ability to detect diagnostically relevant markers in the human genome depends on several layers of information. Some important landmarks in the history of genetic testing are shown in Table 11-1. There is no question that new techniques will continue to improve the quality of diagnosis. Available techniques differ in their cost, their ease of availability, and their ability to resolve specific underlying genetic conditions. No one technique is appropriate for all situations. Furthermore, knowing the genetic source of a condition is only the first step of the process. Treatment options, if any, are a separate question.
Table 11-1. Timeline Noting Important Milestones in Genetic Testing
At one end of the spectrum of genetic connections, a karyotype allows us to identify large-scale changes in chromosome number and structure. Some examples of this were discussed in Chapter 5. Using high resolution karyotype images of prometaphase chromosomes, which are incompletely condensed, about 800 to 1000 chromosomal bands can be detected (Figure 11-3). Thus, each band contains on average about 25 genes. Changes in chromosome structure that involve losses or duplications of big sections can be diagnosed this way, as of course can any change in whole chromosome number.
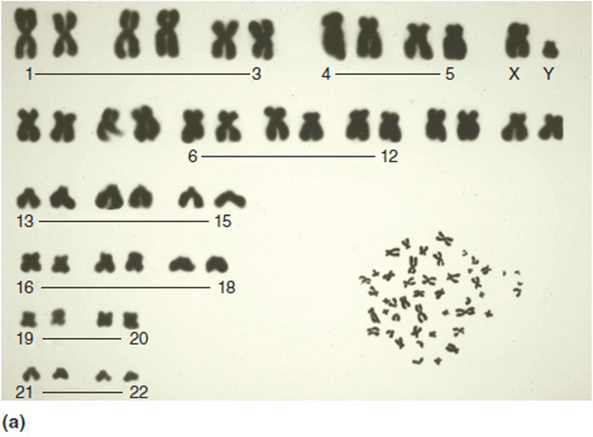

Figure 11-3. (a) Low resolution karyotype. Random spread in lower right corner. No banding pattern seen. (b) Prometaphase (high resolution) karyotype. Lower panel is a random spread. The upper panel shows the chromosomes arranged by size and number (karyotype). Note the extended banding; this is about a 600-band study.
In the next several sections, we will explore some widely-applied techniques that give higher-resolution information about a patient’s genome. There is no question that these approaches will change rapidly as existing techniques are refined and new ones are designed and implemented.
Fluorescent in situ Hybridization (FISH)
Any cloned locus can be mapped to its position on a metaphase chromosome by fluorescent in situ hybridization (FISH). A sample of cells arrested in the process of division is placed on a microscope slide, and the chromosomes are fixed and the DNA is carefully denatured while still retaining its fundamental chromosome organization. A labeled probe prepared from a cloned DNA fragment is then placed on the slide and incubated to allow hybridization to occur on the chromosome in situ. After removing un-hybridized probe, the chromosome can be viewed under UV light with a microscope so that fluorescent regions and chromosome banding landmarks can be correlated (Figure 5-24). The resolution of this technique, however, is only as good as the resolution of karyotype bands. Standard DNA cloned fragments of about 100 kb each for use as FISH probes are available from many genetic resource centers worldwide as bacterial artificial chromosomes (BACs).
Single Nucleotide Polymorphism (SNP) Analysis
A growing application of linkage disequilibrium associated with genome sequencing is found in single nucleotide polymorphism (SNP) analysis. SNPs (typically pronounced “snips”) are single nucleotide differences that fit the definition of polymorphism, i.e., in which the most common form is found at a frequency of less than 99% in a population. One of the leaders in SNP discovery is The SNP Consortium (TSC), a group of pharmaceutical companies and the U.K. Wellcome Trust that has discovered over 1.8 million SNPs in the human genome. Some of the laboratories are now characterizing representative SNPs for their allele frequencies in several world populations. There are an estimated 10 million SNPs in the human genome and the objective is to develop a SNP database for association studies.
The importance of SNPs is mainly in their role as DNA locus markers. While it is true that some SNPs can be the basis of a mutant phenotype in a coding region, others serve as neutral landmarks for association mapping. This allows their cosegregation with a trait of interest to be followed in order to localize the trait’s genetic placement. In that way, they are used for applications ranging from mapping the most important genetic components for a polygenic trait to allowing comparisons among DNA samples in forensic or parental investigations. As targeted sequencing efficiency expands, SNP markers can help in individual decisions like identifying the medications that might be most appropriate for specific genotypes.
A related approach is the basis of the International HapMap Project, an international project to identify chromosomal regions. It would be prohibitively expensive to screen all 10 million SNPs to map a trait, so the HapMap Project focuses on linked groups, or haplotypes. Each haplotype can be represented by a unique SNP, called a tag SNP, so the number that needs to be tracked to map a given target gene is reduced to about 500,000. This will be discussed further in Chapter 15 (Population Genetics).
Array-Based Comparative Genomic Hybridization (aCGH)
The comparative genomic hybridization (CGH) is a technique to measure DNA changes in DNA copy number. It is applied, for example, in screening tumor cells for deletions, duplications, and aneuploidy with high efficiency. For array-based CGH, control DNA is labeled with one fluorescent dye (yellow), and the test DNA is labeled in a contrasting way (red). The two samples are mixed, yielding an orange spot on the microarray for each section in which the control and test samples are the same genomic concentration. But if the genomic region in the test sample differs from the control, the microarray spot will fluoresce differently. Red indicates a duplication, and thus a relative excess of red label from the test sample, while a yellow fluorescent spot indicates a deletion in the test DNA and thus a relative excess of yellow label from the control sample. In general this technique gives specific genome map information and can detect any change larger than 50 kb or so, although some applications of the technique can have a resolution of 100 bp or less.
Gene Sequencing Strategies
Techniques for determining the DNA sequence of a gene first developed in the early 1970s, and the chain-termination method developed by Frederick Sanger soon became the preferred approach. Dideoxy sequencing (or Sanger sequencing) uses a modified DNA replication reaction in which a proportion of a given dideoxyribonucleotide (ddNTP; Figure 11-4) is added to the mix. As the name suggests, a dideoxyribonucleotide is missing two oxygens (“di”-“deoxy”; –H instead of –OH at both the 2′ and the 3′ positions) in comparison to the deoxyribonucleotides of normal DNA, which is missing a hydroxyl group at only the 2′ position. The replication enzyme responsible for extending the new DNA chain requires a 3′–OH for addition of a new nucleotide. When it encounters the 3′–H of a dideoxyribonucleotide instead, chain elongation stops. Four complementary sequencing reactions are set up, each with a portion of one of the dideoxynucleotides (ddATP, ddTTP, ddCTP, or ddGTP) included in the reaction (Figure 11-5). Fragment lengths are compared by running these four reactions side-by-side so the nucleotide that caused termination can be determined for each size of fragment. The resulting list is the sequence of nucleotides making up the complementary (newly synthesized) strand.
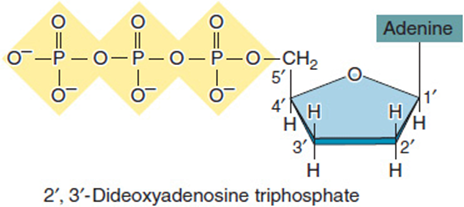
Figure 11-4. A dideoxynucleotide, ddATP?. The 3′ group is missing an oxygen molecule, so DNA polymerase cannot attach a new nucleotide to this position. Chain elongation stops. (Reprinted with permission from Brooker RJ: Genetics: Analysis and Principles, 3rd ed. New York: McGraw-Hill, 2008.)
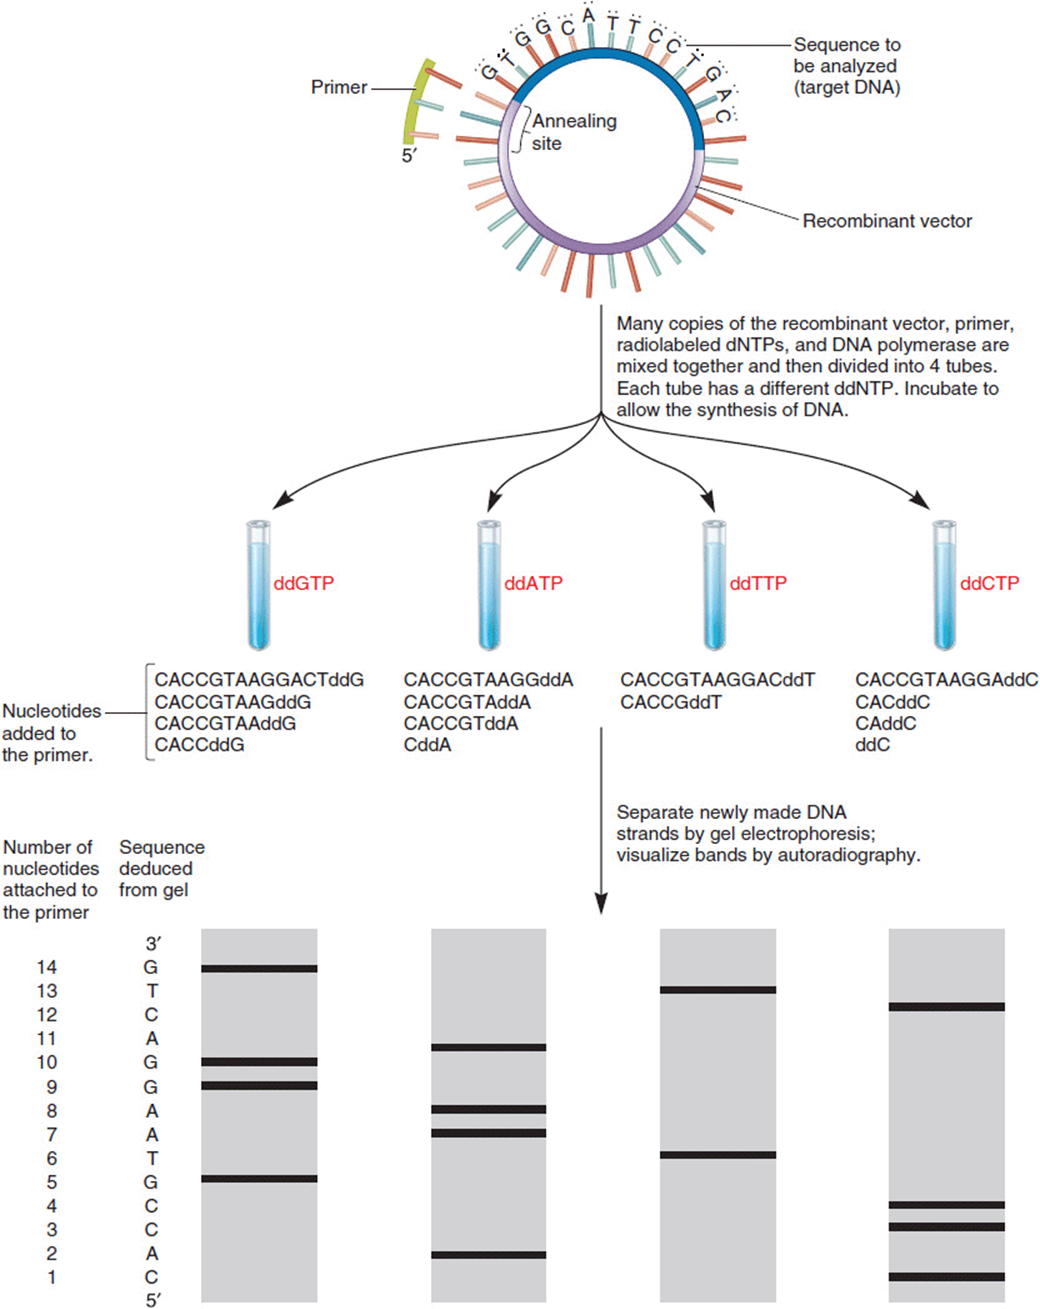
Figure 11-5. An example of DNA sequencing by the dideoxy method of Sanger. Beginning with a single-stranded DNA template, reactions are carried out with a primer, the four dNTPs, and polymerase. In each of four reactions, however, a small proportion of one of the dideoxynucleotides (ddNTPs) is included. When one of these is incorporated into the growing strand, chain elongation stops. The lengths of all strands ending in a given ddNTP can be read by their migration distances on a gel. Comparing across all four kinds of gels, one can read the termination nucleotides and deduce the sequence. (Reprinted with permission from Brooker RJ: Genetics: Analysis and Principles, 3rd ed. New York: McGraw-Hill, 2008.)
Modifications of this approach use radioactively-tagged nucleotides or a fluorescently-labeled primer which support automation of the sequencing process. Dye-terminator sequencing, for example, involves four separate fluorescent dyes, one for each ddNTP. The resulting strands pass along thin capillary tubes past a laser fluorescence detector that determines the incorporated ddNTP by its emitted wavelength (Figure 11-6). A common limitation of automated sequencing is the length of fragments, up to about 1000 bases, that can be processed efficiently. This limitation is due, at least in part, to the reduced ability to distinguish long fragments that differ by only one nucleotide at a time. Techniques that sequence individual DNA molecules are also being developed.
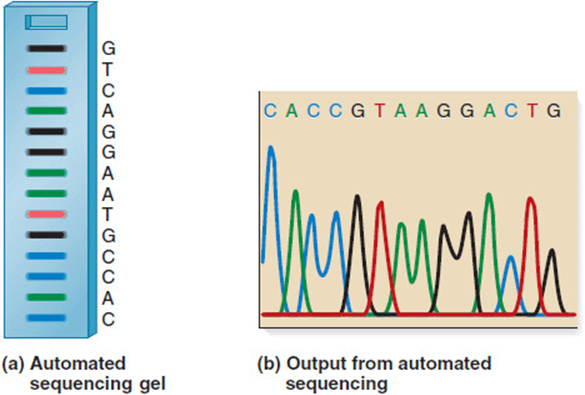
Figure 11-6. Automated sequencing is based on reading the nucleotide incorporated into each terminal (ddNTP) position by its fluorescence. As each length of fragment is passed along a capillary tube, a fluorescence detector reads and records its wavelength. This readout is complementary to the original template DNA being sequenced. (Reprinted with permission from Brooker RJ: Genetics: Analysis and Principles, 3rd ed. New York: McGraw-Hill, 2008.)
High-Throughput Sequencing
The application of advanced genetic screening for patient diagnoses and research requires rapid and inexpensive sequencing technologies. This is an area of medical genetics that is expected to continue to grow rapidly. One avenue of development is high-throughput technologies in which thousands, or even millions, of sequences are processed at the same time.
One early example of a high-throughput approach is massively parallel signature sequencing (MPSS), a bead-based system. Although it was only performed by the original company, Lynx Therapeutics, before becoming obsolete, many of its properties are found in the “next-gen” outputs of later sequencing systems. These yield hundreds of thousands of short DNA sequences for cDNAs or PCR products.
Next Gen Sequencing
One of the first “next generation,” or next gen, systems was Polony sequencing used to sequence a complete Escherichia coli genome in 2005 with high accuracy at a significantly reduced cost. It applied a multiplex sequencing approach to read millions of immobilized DNA strands at a fraction of the cost of more traditional Sanger dideoxy sequencing.
A sequencing-by-synthesis process is called pyrosequencing. Prepared single-stranded DNA fragments 300 to 800 bp long are attached to beads in a water-in-oil emulsion before being amplified by PCR. Each bead is then placed in a tiny well on a fiber-optic chip. After adding the sequencing reactants, the four DNA nucleotides are added in a fixed order to all wells of the plate. Each time the appropriate nucleotide is added to the growing strand, it generates a light signal that is recorded by a camera. 454 pyrosequencing depends on large-scale parallel sequencing that can yield about 500 Mb of data per 10-hour run. In 2006, 454 Life Sciences, a biotechnology company that specializes in this high-throughput approach, reported sequencing the first million base pairs from the Neanderthal genome, and in 2007 its Project Head Jim reported the completion of the first sequence from an individual, James Watson, codiscoverer of DNA structure.
In contrast to pyrosequencing, Illumina sequencing extends the DNA only one nucleotide at a time. It uses reversible dye-terminators and four types of fluorescently-labeled ddNTPs that are incorporated and photographed, before the dye and terminal 3′ blocker are removed and the next cycle is initiated. In 2010, the full Neanderthal genome was published using a combination of 454 and Illumina sequencing technologies.
Whole Exome Sequencing
As you remember, the exon is the portion of the DNA sequence that codes for the mature mRNA molecule, i.e., the part of a gene that codes for a protein. This accounts for most but not all of the genes in the human genome. Using microarrays to capture DNA segments that match a defined set of coding exons, sequencing focuses on the coding portion of the genome. This can be called “exome capture.” When applied clinically, however, it is important to keep in mind that the functional defect may be not actually be in an exon, but instead may be upstream, in an intron, or may be in a gene that does not code for a protein. In these cases, this technique will miss the DNA site of the problem.
RNA or Transcriptome Sequencing
RNA sequencing focuses on a more limited target, specifically the expressed RNAs present in the tissue at a given time. For that reason, it is especially valuable for the study of diseases like cancer. This supports the development of a whole new field of study, transcriptomics, which explores the results of gene regulation rather than the larger picture of genome content.
Although there are different technical systems to accomplish RNA sequencing, they often target mRNA with its 3′polyadenylated (poly-A) tail to separate coding from noncoding mRNA (only coding mRNA has a poly-A tail). This can be done using magnetic beads with poly-T oligonucleotides attached. After reverse transcription, the resulting cDNA can be sequenced by a choice of the techniques described here.
A side benefit of this approach is the “flow-through,” i.e., the RNA without a poly-A tail. The large ribosomal RNA fraction can also be removed, using probe hybridization. The resulting fraction is a rich resource for noncoding RNA gene discovery.
Genome-Wide Association Studies (GWAS)
Studies of gene associations date back to the beginning of experimental genetics. After all, even classical gene mapping is done by measuring associations. But the power of computer analyses applied to very large datasets has brought this approach to a new level of sophistication. Genome-wide association study (GWAS) focuses on how a trait of interest appears in combination with genetic markers like SNPs spread among all the chromosomes. In contrast to more targeted linkage studies, GWAS simply looks for connections. It is, in effect, an approach that combines linkage disequilibrium associations with the high resolution markers provided by SNPs.
Associations have already been identified for more than a hundred human diseases and phenotypic characters. But the strength of the GWAS approach is also its weakness. It simply looks for associations. Associations can lead to the discovery of a causal connection between a marker and a trait, but not all associations are functional. A rum and cola drink can be intoxicating. So can bourbon and cola. But that does not mean that cola is the intoxicating element, even though it is superficially the common factor. The large numbers of tests that are performed lend themselves to accidental or false-positive associations that can be misleading.
Other Approaches
Other techniques being developed include sequencing individual molecules as they pass through nanopores, sequencing with microchips, and microfluidic sequencing in which thermal cycle amplification and electrophoretic separation of fragments are done on a small glass wafer. The creativity of these DNA technologies will undoubtedly have a growing influence on diagnostic approaches and upon our knowledge of normal genetic control of development in complex biological systems.
Genetic Screening
Genetic screening is the search in a defined population for individuals with:
1. a particular disorder
2. a predisposition to a disease
3. changes that may lead to a disease in their descendants, or
4. changes that can produce other variants not known to be associated with disease.
A genetic test is done with the directed purpose of achieving a diagnosis, i.e., is a problem present or not. Screening is performed to measure a person’s result against a population-based standard to try and define who is at higher risk for a condition. Diagnostic testing is then offered to, or performed on, persons for whom screening shows they are at higher risk. Often, the laboratory procedures for screening and testing are exactly the same—such as in tandem mass spectrometry used in newborn screening—but the definitions of “normal” are different. Likewise, the reason for performing the study in the first place is different.
Genetic screening should be designed to maximize both sensitivity and specificity. A perfect screen would have 100% sensitivity and specificity. As a quick review, the sensitivity of a diagnostic test refers to how well the technique identifies the presence of a condition. If the test shows the presence of the condition in 19 out of the 20 times it occurs, the test’s sensitivity is 95%. Those individuals correctly flagged by the screening would be termed “true positives.” Those missed by the screen would “false negatives.”
A test’s specificity, on the other hand, refers to those instances when the condition is “detected,” but is actually absent. These errors are called “false positives,” and 100% specificity refers to having no false positives. Of course those correctly identified as not having the condition would be the “true negatives.” All types of screening should then be designed to maximize the detection of the targeted condition (true positives) and minimize the false positives. While in theory this sounds straightforward, in practice this may not be easy to do. Many factors such as cost, limits in methodology, and sample procurement may limit these parameters in a given screen.
Traditionally, genetic screening has been based on several key principles.
1. The condition must be sufficiently frequent in the screened population for associations to be identified statistically.
2. The condition should be serious or fatal without intervention.
3. But, the condition should also be treatable or preventable.
4. An effective follow-up program should be feasible.
5. The required screening and management must be cost effective.
6. Specimens must be easy to collect.
7. Analysis of the results must lend itself to mass screening and be simple, reliable, and reproducible.
While these are certainly the classically defined principles, in practice they do not always apply well. For instance, the changes in newborn screening over the last decade have significantly affected this list. There are conditions now identified in newborns that meet criteria #2, but not #3. Non-ketotic hyperglycinemia is one such example. For such conditions we have moved from screening because we can treat, to screening because we can test. The logic in the latter situation would be that treatments may be found in previously “untreatable” conditions if the cases can be identified early. A similar situation exists with maternal serum analyte screening for chromosomal aneuploidy. Trisomy 18 is fatal with or without intervention and is neither treatable nor preventable in a way that increases survivability.
Part 2: Medical Genetics
Genetic Testing
The completion of the Human Genome Project (HGP) has spurred many remarkable advances in human genetics. Undoubtedly, one of the most significant spin offs has been the advancement in genetic diagnostic testing. The last decade has seen a veritable explosion of new technologies that can be directly applied in the clinical realm. In Chapter 1, a timeline of technological events and milestones in medical genetics was presented. The overall “newness” of medical genetics itself is apparent. Even more impressive are the specific advances in diagnostic testing.
It is amazing to see that it was not until 1956 that the chromosome modal number of 46 was firmly established for humans. Shortly after that, in 1959, the chromosomal imbalance of trisomy 21 was identified, making this the first condition that had a specific genetic abnormality that could be used in the diagnosis of the condition (i.e., Down syndrome). After that, chromosomal analysis remained the mainstay of clinical genetic testing for the next several decades. Cytogenetic techniques (such as extended banding methods) improved over this time, but relatively few “new” testing modalities were available. Beginning about the mid-1980s things began to change. Advances in molecular techniques were refined and then applied in clinical diagnostics. Since 2001, with the completion of the Human Genome Project, further advances have been developed at a staggering pace. New technologies are introduced into the clinics, only to become outdated in a couple of years. The last decade has seen numerous diagnostic modalities come and go almost before their full utility has become known. Table 11-1 provides a timeline for some of the major advances in genetic diagnostics over the past 60 years.
Discussions on genetic testing should probably start with the question: “what is a genetic test?” In the strictest sense, a genetic test would be defined as a diagnostic investigation that involves the analysis of DNA. This could include chromosomal analysis, linkage studies, in situ hybridization, or gene sequencing. In the broader sense, genetic testing could include non-DNA based tests for genetic disorders such as performing enzyme analysis or measuring metabolites for an inborn error of metabolism. Thus, there are numerous “types” of genetic tests.
In the first section of this chapter, the major categories of types of genetic tests are discussed in light of the technology involved. Another way to organize thinking about genetic tests would be by indication, i.e., by the reason for which they are performed. In general the methodologies are the same, with the difference being the “Why?” Diagnostic testing is performed to identify a specific genetic cause (etiology) of a medical condition. Carrier testingis used to identify a person who is unaffected with a particular condition, but who may harbor a genetic change that can be heritable. Prenatal testinginvolves identifying genetic changes in the unborn fetus. This type of testing of course requires obtaining fetal cells. This can be accomplished via several mechanisms including chorionic villus sampling, amniocentesis, cordocentesis, and even isolating fetal cells or naked fetal DNA from the maternal circulation. It is also now possible to do preimplantation testing. This involves performing the test on cells from a developing embryo prior to implantation during assisted reproduction. The amazing part of this technology is that cells can be removed from the developing embryo during the pluripotent stage of development without apparent disruption of normal embryonic development.
Sometimes genetic testing may be performed in an asymptomatic individual who is at risk for developing a disorder in the future. This has been termed predictive or pre-symptomatic testing. Again, the methodologies are much the same as for any other genetic indication. However, the ethical issues involved in this type of testing can be quite complex—especially if testing for conditions that may develop later in the patient’s life and for which there is no effective treatment or prevention. As frequently demonstrated by the entertainment industry, genetic testing may be used in forensic investigation. Forensic testing, then is the application of genetic testing technologies applied in the investigation of criminal or legal matters.
Advances in Genetic Testing
The application of new genetic technology to clinical medicine typically has not lagged far behind the original development of the techniques. As new methods are developed in research laboratories, there is a strong impetus to translate these into clinically applicable (diagnostic) tests.
Cytogenetics
Cytogenetic studies became readily available in the 1970s. Early karyotypes displayed chromosomes in the metaphase stage of cell replication. These chromosomes were tightly packed and did not display many (if any) discernible bands (Figure 11-3a). At this level of resolution the only changes that could be identified were changes in whole chromosome number (aneuploidy) or large duplications/deletions. Over the past four decades, improvements in cytogenetic techniques have produced studies that are much less compact and display a much larger number of identifiable bands (Figure 11-7a). At the time of this writing, the accepted standard for a clinical karyotype is a prometaphase study that exhibits 650 to 700 bands (Figure 11-7b). At this level of resolution, 1 band corresponds to approximately 4 to 5 Mb of nucleotides. Thus, at the level of what the eye can see by the microscope, changes involving a handful of genes can be seen. While chromosome studies are still a major tool in the geneticist’s tool box, the overall utility is decreasing as newer techniques are introduced.
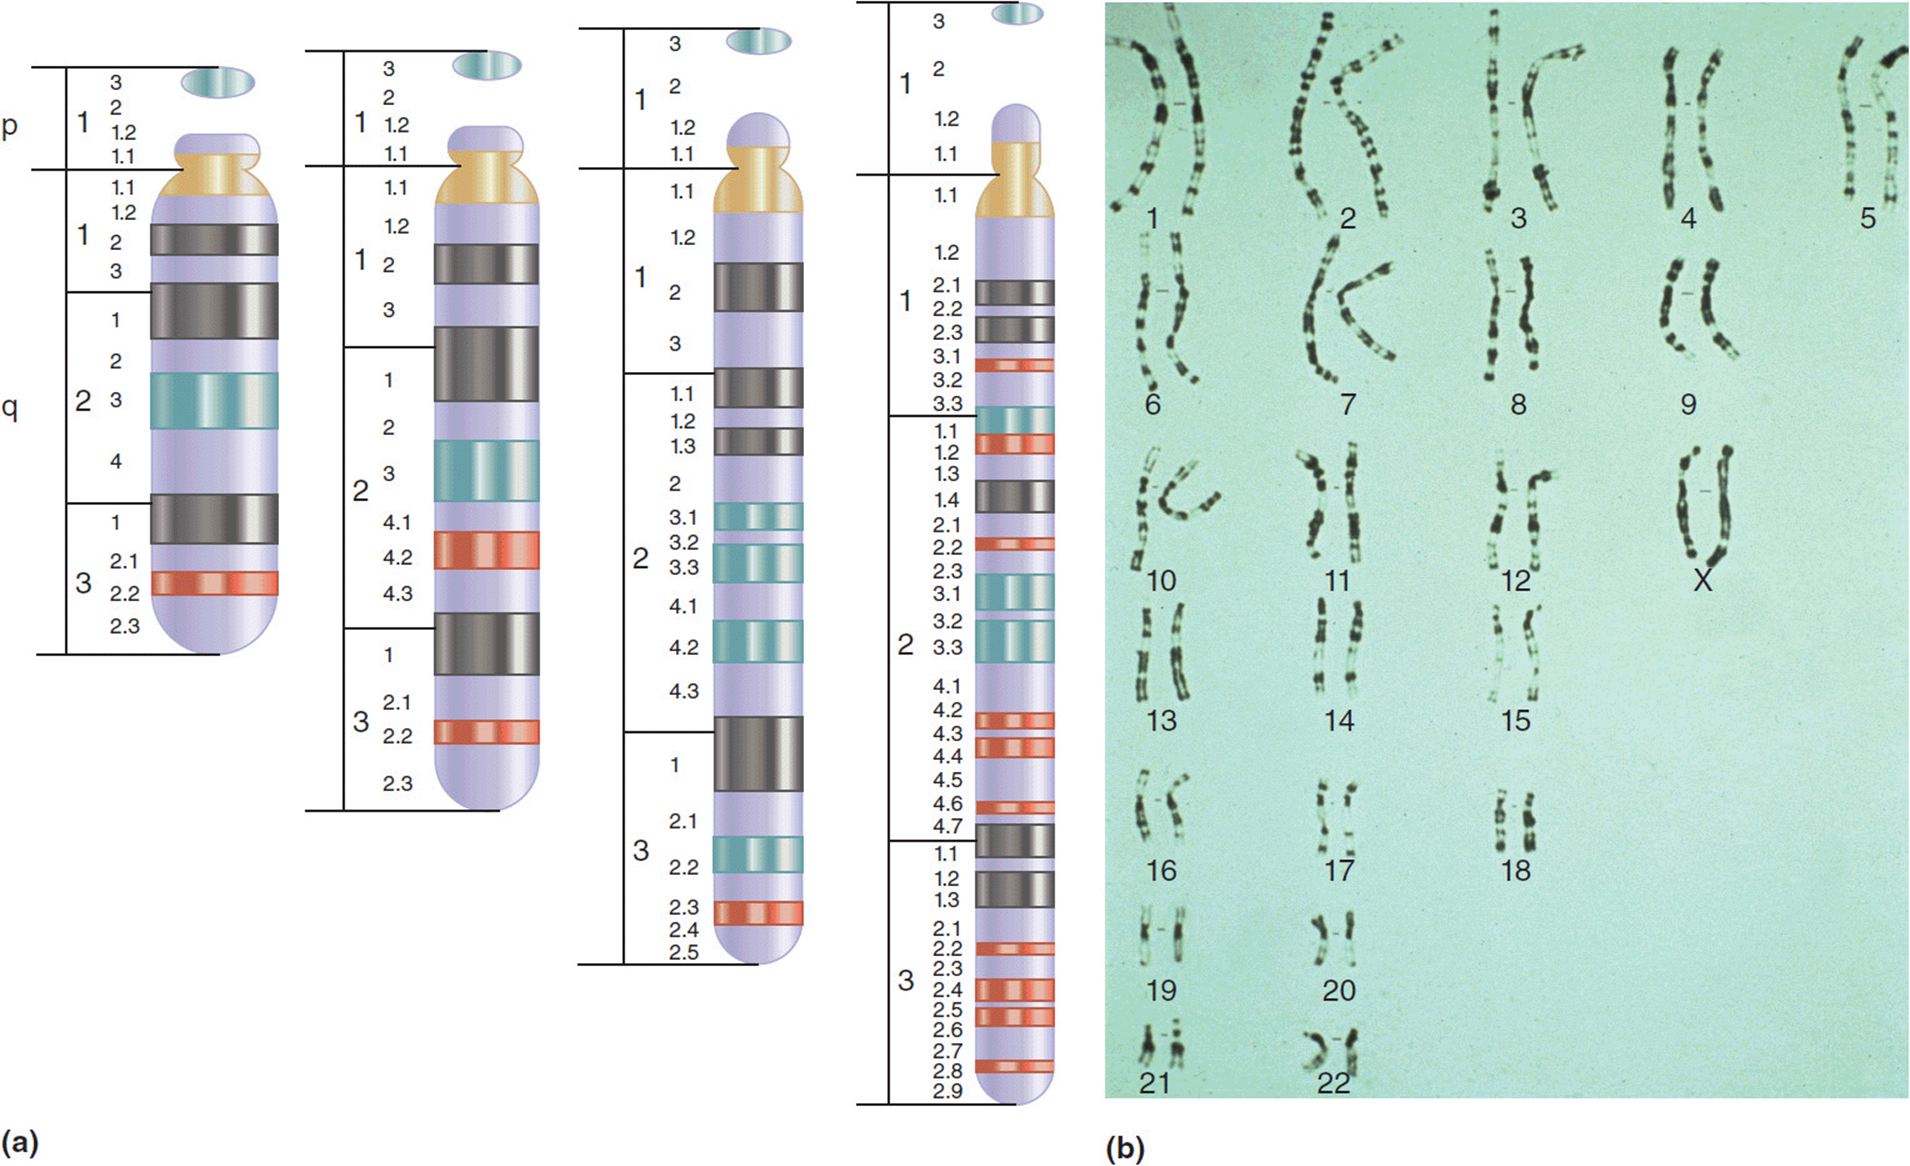
Figure 11-7. (a) Schematic demonstrating the increasing levels of resolution seen with increased banding of chromosomes. (b) High resolution (prometaphase) karyotype showing resolution at about 750 observable bands. (b: Reproduced with permission of Warren G. Sanger, PhD, University of Nebraska Medical Center, Omaha, Nebraska.)
Fluorescent in situ hybridization
Fluorescent in situhybridization (FISH) as described in the first section of this chapter utilizes fluorescent probes attached to known segments of DNA to identify submicroscopic changes in the chromosomes (Figure 5-24). In the 1980s FISH detectable chromosome changes were reported in association with well-described genetic syndromes, which previously had no definable etiology. Using this technology, genetic confirmation of a clinically suspected condition was possible for several such conditions.
Williams syndrome is characterized by short stature, infantile hypercalcemia, cognitive deficits, congenital heart malformations other vascular anomalies, and a distinctive personality type described as loquaciousness (a “cocktail personality”). Patients with Williams syndrome have a distinct facial appearance: small upturned nose, long philtrum (length between the nose and upper lip), wide mouth, full lips, small chin, and puffiness around the eyes). For those patients with Williams syndrome that have blue or green eyes, a “starburst” (stellate) pattern can be seen in the iris (Figure 11-8). As with most genetic syndromes, the features can vary greatly from person to person, from striking to barely noticeable.
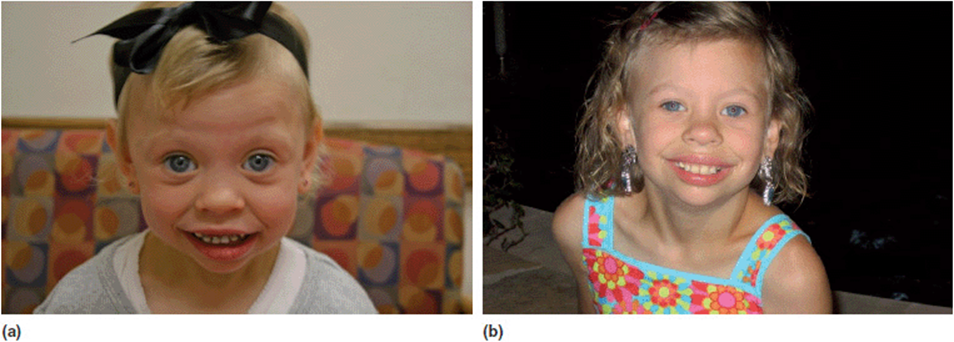
Figure 11-8. (a) Preschool girl with Williams syndrome at the time of diagnosis. (b) Same young lady, school age.
Prior to the advent of FISH testing, the diagnosis of Williams syndrome was made solely on clinical criteria. For many cases the clinical parameters were unambiguous and a clinical diagnosis could be made with certainty. In the more subtle cases, it was often difficult to settle on a diagnosis with any degree of confidence. This often led to many robust discussions among geneticists for these patients: did they have Williams syndrome or something else? Ultimately a FISH detectable deletion of chromosome 7q11.23 was discovered in patients with Williams syndrome (Figure 11-9). This particular deletion has been shown to be present in over 95% of patients with Williams syndrome. At the time of its development, the FISH test was indeed exciting and revolutionary. Finally there was a molecular test that could confirm or rule out the diagnosis. This was very satisfying to clinicians and patients/their families alike.
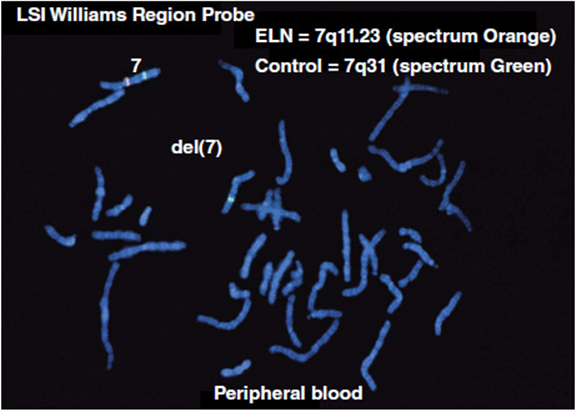
Figure 11-9. Single locus FISH test demonstrating a 7q11.23 deletion seen in patients with Williams syndrome. Note the absence of the orange probe on one of the chromosome 7’s (Courtesy Dr. Warren G. Sanger, University of Nebraska Medical Center.)
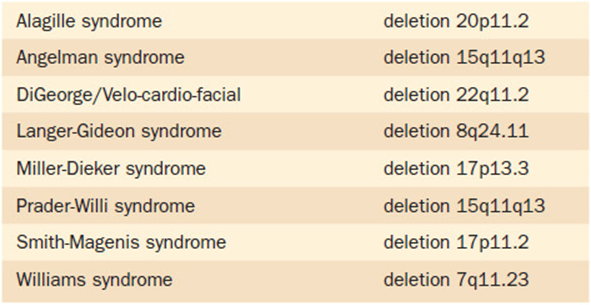
Another interesting part of this story is the insight that further understanding of this deletion has provided to the pathogenesis of Williams syndrome. One of the genes known to be in the deleted Williams syndrome “critical region” is the elastin gene. As the name would imply, elastin is a connective tissue protein with elastic properties. The deletion in Williams syndrome typically involves only one copy of the region. Thus, patients with Williams syndrome will have haplo-insufficiency of the genes—and their products–in this region. Many of the physical and cardiovascular changes in Williams syndrome can be attributed to having only half of the normal amount of elastin in their tissues. As mentioned, there are several other syndromes besides Williams syndrome that can also have diagnostic confirmation by such “single locus FISH” testing. The identification of these conditions has led to the designation of a new category of conditions: micro-duplication/micro-deletion syndromes (Table 11-2).
Table 11-2. Microdeletion Syndromes That Can Be Diagnosed Utilizing Single Locus FISH (Fluorescent in situ Hybridization)
Over the past two decades, FISH technology has been used in many other different types of clinical diagnostics. Probe panels that have whole chromosome coverage can be used for chromosome painting(Figure 5-26a). This type of technology is particularly helpful in identifying unknown segments of abnormal chromosomes, such as marker chromosomes. In addition, different colored probes corresponding to different chromosomal regions can be applied as a multi-color FISH study (Figure 11-10b).
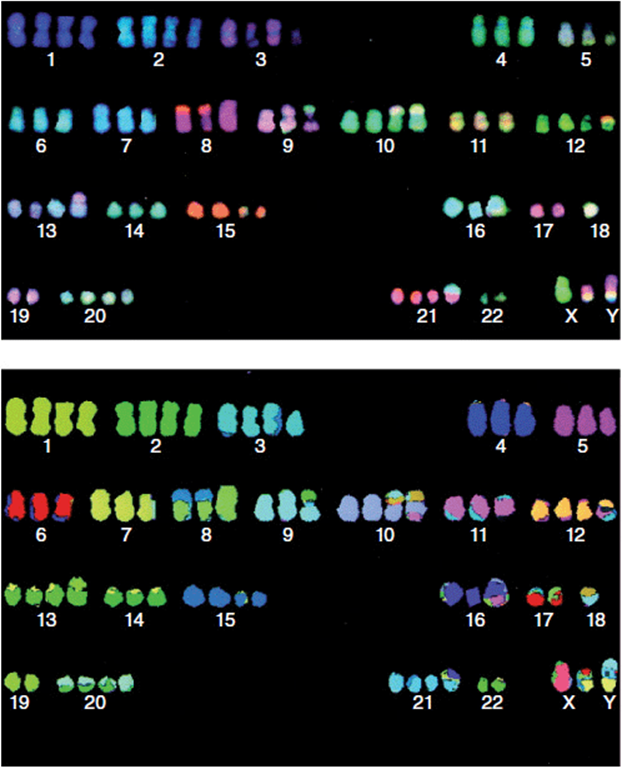
Figure 11-10. Multi-color FISH study. (Reprinted with permission from MacLeod RAF, Nagel S, Kaufmann M, et al: Multicolor-FISH analysis of a natural killer cell line (NK-92). Leukemia Research. 2002 Nov;26(11):1027-1033.)
One practical advantage of FISH studies over conventional chromosome testing is that FISH testing can be done on nondividing (interphase stage) cells. In the interphase cell, the DNA of the chromosomes is “uncoiled.” That is, the DNA has not been compacted into discrete visible chromosome structures. In this form, the chromosomes cannot be visualized, and thus the study is non-interpretable. To obtain a usable karyotype, living cells need to be obtained and then cultured. Any cell capable of dividing can be used. The most common cell type used is white blood cells (neutrophils), because they are relatively easy to obtain, and they readily divide with a little prompting in the laboratory. Other cell types used for clinical studies include fibroblasts obtained from a skin biopsy or amniocytes obtained during amniocentesis for prenatal studies.
The cultured cells are then allowed to grow and further divide. In the middle of the cell division, the cells are treated with a compound called colchicine, which interferes with the formation of microtubules and thus of the spindle fibers in cell division. This then halts the cells while in the midst of mitosis at the time of metaphase or prometaphase. At these stages the chromosomes are discrete and readily visualized, so they can be analyzed for structural changes. Typically cytogenetic results could be available within 72 hours using this process. However, there are clinical situations in which knowing the modal number of chromosomes earlier than that can be extremely helpful. Examples of such situations would include prenatal diagnosis, or a child born with a disorder of sexual differentiation, or a child with a suspected chromosome aneuploidy (such as trisomy 13) in which critical case management issues hinge on knowing the karyotype information. The nature of FISH technology does not require dividing cells, and thus can allow for more rapid diagnoses in such situations (Figure 11-11).
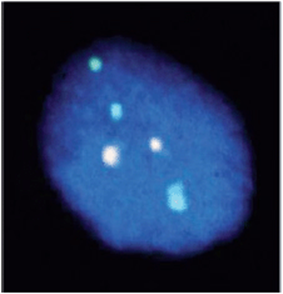
Figure 11-11. Interphase FISH on an amniocentesis specimen. This study demonstrates the prenatal identification of trisomy 13.
The next major advancement in genetic testing technology became available in the late 1990s with the advent of the subtelomeric FISH panel. Because of their biology, the telomeric regions of the chromosomes undergo a great deal of rearranging. As such, these are regions of the chromosomes that have a high chance of generating imbalances. This panel was developed as a set of 41 FISH probes hybridizing to the subtelomeric regions of each chromosome (Figure 11-12). One side note: there are 41 rather than 46 probes, because the five acrocentric chromosomes (13, 14, 15, 21, and 22) do not have a “p” arm. The use of the subtelomeric FISH panel in clinical diagnostics was revolutionary. One example is in the genetic evaluation of mental retardation (MR). The diagnostic yield (rate of identifying a positive result) for subtelomeric FISH was shown to be 7.5% for severe to profound MR and 0.5% for mild to moderate cases. While to many these numbers may not seem all that impressive, this was a major leap in testing yields for clinical geneticists. Prior to subtelomeric FISH testing, the chromosome test was the major diagnostic tool. Down syndrome at an incidence of 1 in 800 live births was the most commonly identified cause of mental retardation. Further advances in technology have now made subtelomeric FISH obsolete.
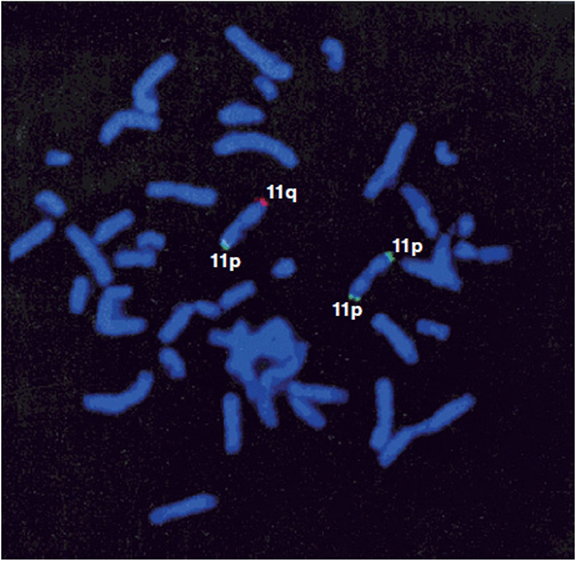
Figure 11-12. Metaphase spread hybridized with the subtelomeric probe for 11p (green) and 11q (red). (Reprinted with permission from Clarkson B, Pavenski K, Dupuis L, et al: Detecting Rearrangements in Children Using Subtelomeric FISH and SKY. American Journal of Medical Genetics, 2002, 107:267-274.)
Chromosomal microarray
A microarray is large numbers of molecules distributed in a very small space—often arranged as rows of embedded wells on a microscope slide. Chromosomal microarray (CMA) refers to the application of microarray technology to accomplish whole genome scanning utilizing any one of a number of different platforms. This testing modality will identify micro-duplications or micro-deletions in the patient’s genome.
In Chapter 5 we introduced the technique of array comparative genomic hybridization (aCGH). This technique utilizes slides with hundreds of thousands of tiny wells imbedded with probes composed of short segments of known DNA sequences (Figure 5-28). The patient’s DNA is hybridized to these probes coupled with fluorescent markers (i.e., FISH probes), which are read by automated color detecting lasers. The pace at which aCGH technology has advanced over the past 10 years is staggering. The original aCGH chip that was available for clinical use had about 400 DNA probes that were obtained from DNA constructs called bacterial artificial chromosomes (BACs). Over the past 10 years aCGH platforms have mostly transitioned to oligonucleotide derived probes, which has allowed the addition of many more probes. At the time of this writing, the standard aCGH oligonucleotide chip used in the clinical setting has between 180,000 and 205,000 probes! With this technology, there is now clinically available high resolution whole genome analysis in a single technology. The resolution of this current platform is coverage of the genome at around 1 Mb intervals. To put this in perspective, one of the larger known human genes, dystrophin, is about 1.8 Mb in size, so a standard oligonucleotide array will have two or more probes within the dystrophin gene! It is worth noting that the probes used in such studies are not evenly distributed across the genome. Certain regions have a higher density of coverage due either to more knowledge of, or interest in, certain regions. Further refinements and different approaches to aCGH are constantly being developed.
Another CMA platform uses SNPs as the standards for comparisons. “SNP chips” utilize literally millions of known SNPs to compare to the patients genome. In general the information that is garnered from SNP analysis is comparable to that obtained from aCGH chips. However, SNP chips have the added advantage of providing information such as identifying areas of uniparental disomy (see Chapter 12) and runs of homozygosity by descent (common regions of the genome due to consanguinity).
The results of CMA studies report the identification of changes in “copy numbers.” In the normal situation, there should be two copies of every probe (with the exception of X-linked genes in males). The results of CMA studies, then, report copy number variants (CNVs)—that is deviations from the normal (modal) number of copies expected at a genetic locus that are found with the patient. When a CNV is identified in a patient, the next step is to determine its significance. At present, the rapid advances in testing technology have outpaced clinical understanding. Currently for many identified CNVs the significance is simply not known. Given the knowledge base and collective experience of laboratory geneticists, an identified CNV will be classified and reported by the laboratory as either benign (known not to be disease causing), pathogenic (known to be disease causing), or of unknown clinical significance.
The clinical impact of chromosomal microarray studies cannot be overstated. The application of CMA studies has tremendously increased the ability to identify specific genetic diagnoses. In fact, current clinical guidelines list CMA as a “first tier” diagnostic test for the work-up of multiple congenital anomalies, cognitive deficits, and autism. It is extremely gratifying for geneticists (and for the patients and their families) to be able to identify a cause of their problems after decades of searching. It is interesting to note, however, that the increase in diagnostic yield has not been in direct proportion to the number of probes added. For instance, the diagnostic yield noted in mental retardation using aCGH has increased from about 5% with the 400 panel probe chip to 15% with the 180,000 chip.
Not surprisingly, introducing a test that scans the genome in 180,000 places has produced many unexpected results, beyond the straightforward diagnostics. While CGH studies now provide diagnostic answers in previously undiagnosable cases, they also identify CNVs for which little to no clinical information exists. These findings have been designated “copy number variants of unknown clinical significance.” Identifying such changes during the course of a diagnostic evaluation can be difficult both for the family and the clinician. But, as noted earlier, the increase in the number of probes has not led to an equivalent increase in diagnostic yield. For instance, the jump from a 44,000 chip probe to an 180,000 chip probe increased the yield of true diagnostics by only about 3%.
An interesting phenomenon associated with the application of CMA diagnostics has been the identification of new “syndromes without names.” Traditionally, genetic syndromes have been associated with an eponymic designation (e.g., Down syndrome, Turner syndrome, and so forth). In the early days of medical genetics, syndromes were described clinically and then paired with a name of a person critical in the description of the condition. Later, an associated genotype might be identified. So, for example, in 1866 John Langdon Down made the key description of the syndrome to which his name is forever linked. Later, in 1959, cytogenetic analysis identified the genotypic correlation—trisomy of chromosome 21—with the syndrome.
With the introduction of whole genome analysis (such as CMA studies), individuals have now been identified with specific chromosomal changes in which the order of these events has been reversed. That is, in these cases, the genotypic abnormality is identified before any clinical description of the conditions has been made. By default, the condition is actually known by its genetic description. For example micro-deletions of chromosome 1q21.1 have been identified in a large number of patients with neurodevelopmental and neurobehavioral problems. This condition shows a large range of variability and may also involve structural congenital anomalies (Figure 11-13). The identification of this CNV has preceded any phenotypic description, and thus has no associated eponym. The condition is simply referred to as the “1q21.1 microdeletion syndrome.” It is fascinating to note that many families find this unsettling. They would like to know: “what is the “name” of the condition that the patient has?”
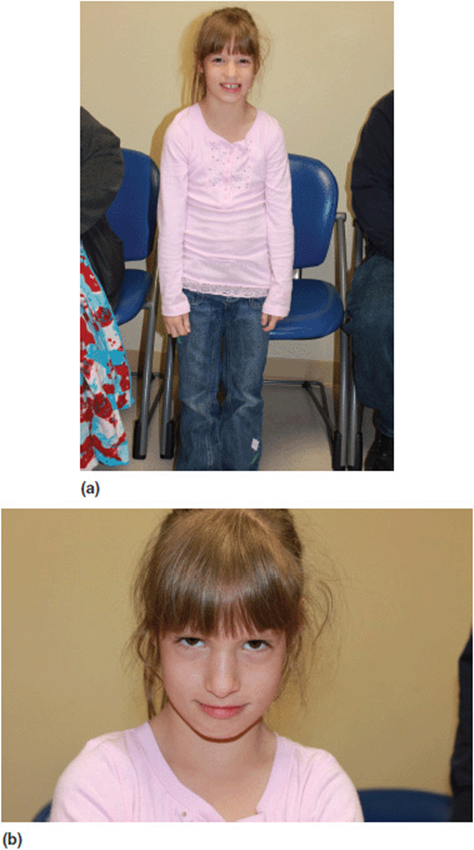
Figure 11-13. Patient with 1q21.1 deletion. The child has mild developmental delays and neurobehavioral problems.
Finally as exciting and revolutionary as these advances in testing are, their long-term utility is in question. Just as subtelomeric FISH panels came and went in a matter of a few years, it is likely that newer developments in genetic testing technology may make them obsolete in an equally short period of time. We fear that, even at the time of the publication, what we have written here may be in need of updating. But for future patients, that advance in knowledge is a wonderful thing.
Determination of nucleotide sequences
Another approach to genetic testing involves determining the actual nucleotide(s) present within a specific gene. Early clinical tests used restriction endonucleases that could identify specific polymorphisms at targeted nucleotide positions of specific genes. While accurate, this methodology was limited in which genes and specific polymorphisms could be tested. DNA sequencing utilizes a variety of methods to identify the order and type (A, G, T, or C) of the nucleotide bases for a specific gene (Figure 11-14). Advances in sequencing technology eventually allowed clinicians to request sequencing of entire genes. As with most new technologies, early gene sequencing studies took a long time and cost a considerable amount of money. Continued improvements included the development of newer sequencing techniques that utilize methods to analyze numerous sequences at once for study. This greatly increased the speed of sequencing from linear sequencing (starting at the beginning of one gene and sequencing it from start to finish). High throughput sequencing was developed using this principle and was significantly faster than linear sequencing because of advances in automation and multi-sample processing. Although this process involved longer runs of sequencing, it still required performing each sequence just once. High throughput sequencing can be used to identify mutations in specific genes known to be associated with a specific disorder that is suspected in a particular patient (Figure 11-15).
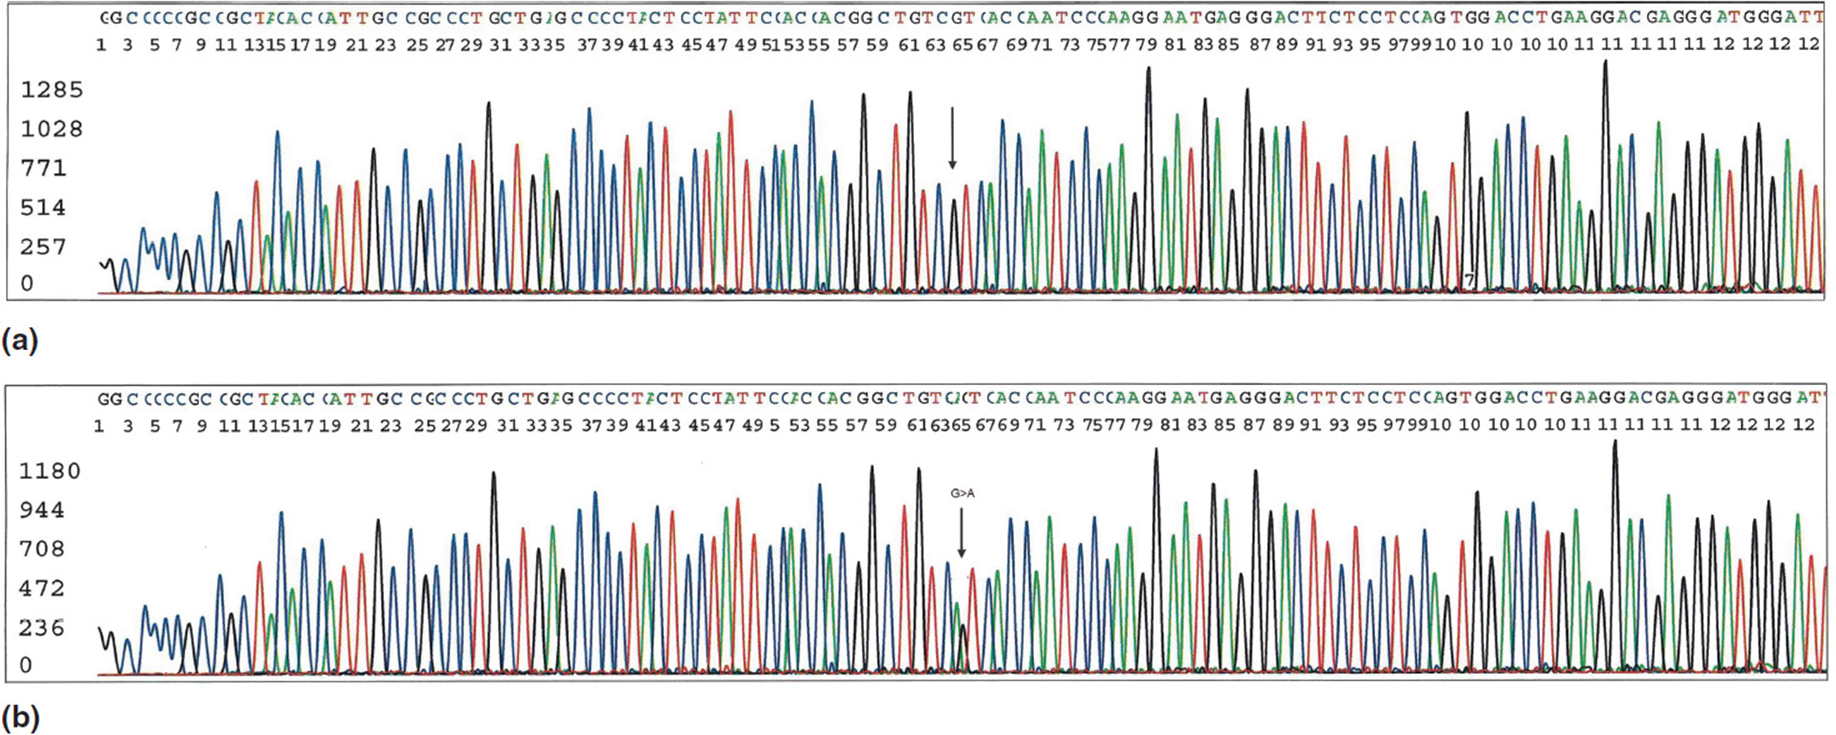
Figure 11-14. Sanger method of DNA sequencing. This particular test is sequencing of exon 4 of the transthyretin (TTR) gene. Mutations in this region have been associated with hereditary amyloidosis. (a) Normal sequencing results. (b) Note the mutation (G > A change) at position 64 in this read out. (Courtesy of Dr. Charles Sailey, Arkansas Children’s Hospital.)
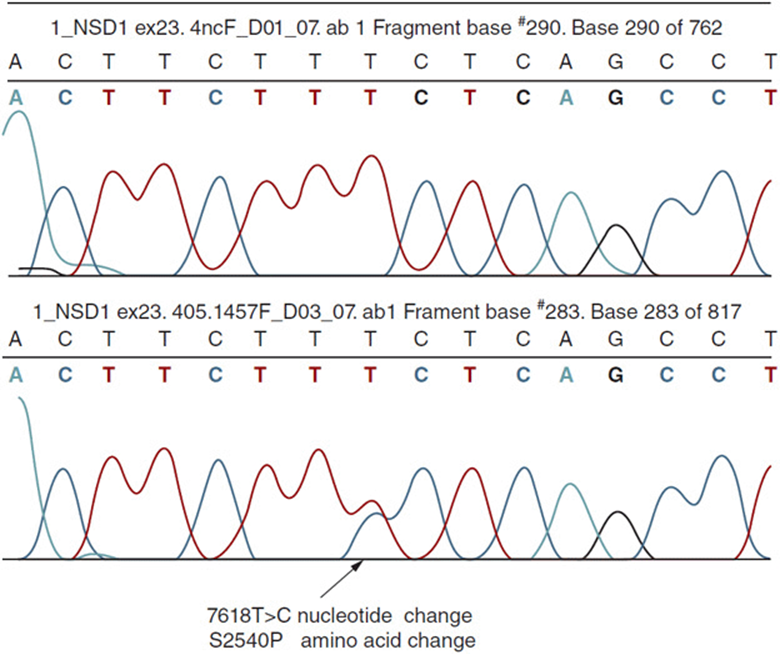
Figure 11-15. Diagram demonstrating a single nucleotide polymorphism (mutation) in the NSD1 gene associated with Sotos syndrome. (Courtesy of Dr. Darrel Waggoner, University of Chicago.)
The most recent advancement has been the advent of massively parallel sequencing often referred to as Next Gen sequencing. There are multiple clinical applications of next gen sequencing now available to clinicians. Currently there are two major types of studies. Whole exome sequencing provides genomic information on all of the known coding regions (exomes) of the human genome. Whole exome sequencing is accomplished by “exome capture,” which pulls a defined set of matching coding exons from within the full genomic DNA using microarrays and then sequencing the identified sequences. Since exomic sequences account for only about 1% to 2% of the entire human genome, this allows for much less data to handle than whole genome sequencing. Since the exons are the coding portions of the genomic material, the majority of truly pathologic mutations are predicted to occur in these sequencings. A small number of pathologic mutations in the noncoding regions may cause disease by changing splice sites or altering gene regulation, but these would represent a small fraction of known disease causing polymorphisms. Whole genome sequencing, then, is simply sequencing all 3 billion bp in the human genome.
It is hard to over-express just how amazing these advances have been. In the late 1970s using the chemical degradation sequencing methods developed by Maxam and Gilbert, gene sequencing could proceed at a pace of 1.5 kb (1500 bp) of DNA per person-work year. At the time of this writing, genomic DNA can be sequenced at the rate of 3 Gb of DNA per person-work year. Because of the rapid pace at which this science is advancing, it is highly likely that this number will already be out of date by the time of publication! The Human Genome Project, which was completed in 2001, took over 12 years and $15 billion to sequence the human genome. Many advances in techniques actually happened in the midst of the project that helped speed it to completion. Toward the end of the project, it was possible to sequence the 3 billion bp of the human genome in 3 years for about $4 billion. Using current technology, it can be achieved in 1 month for around $25,000. At the time of this writing, there are several commercial laboratories that offer clinical (fee for service) whole genomic testing. Currently whole exome sequencing can be obtained for $7000 to $9000. Likewise, whole genome sequencing can be ordered for around $20,000. If you are not astounded by this information, you have watched way too many sci-fimovies in your lifetime!
Of course technology is not going to stand still. Already predictions are being made for further advances that should produce sequencing rates of 60 Gb per hour in the next 2 to 3 years at a cost of around $1000, and being completed from start to finish in a couple of hours. As was already highlighted earlier in the discussions on CGH, the “brute force” genetics that happen in the laboratory have to be interpretable before bringing the techniques into the clinical realm. As mentioned in Chapter 7 (Mutations), it is predicted that all people have about 30,000 identifiable polymorphisms in their genome. Thus, if one were to perform whole genome sequencing on an individual, the test would be expected to identify 30,000 positive results. Just think what that laboratory report would look like! Obviously a simple reporting of all identifiable polymorphisms would not be useful for anyone. The real key for introducing whole genome sequencing into the clinical setting is going to lie in its interpretation. Information is going to have to be culled, sorted, and prioritized into some meaningful, useful format. This has led several prominent geneticists to speak of the “one thousand dollar genome with the million dollar interpretation”!
Practical Issues in Genetic Testing
As exciting as the advances in genetic testing may be, the excitement must be tempered with an understanding of many practical issues involved with such rapid developments. Many of the issues include cost factors, ethical considerations, and pragmatic details of actually getting the test done. There is also the reality that there is no treatment for most of the diagnosable conditions: there is currently no way to correct a genetic defect. A full discussion of these issues would require more space than we can include in this book. The ethical issues alone could fill a few volumes. However, we should mention several of the more pressing issues in genetic testing.
The first consideration is simply “should the test be done?” The old adage that “just because you have a hammer doesn’t mean you hit everything with it” applies to genetic testing. While the science may be exciting, it is always crucial that the best interest of the patient be the paramount factor in making decisions regarding their care. When ordering a genetic test, several important factors should be considered. It is imperative that the patient be provided true informed consent in this process. While this is true of all medical testing, the highly sensitive and personal nature of genetic testing makes this even more critical. Prior to ordering any genetic tests, the patient should be informed of key pieces of information including what will the test tell them/not tell them. Also the utility of the test should be reviewed. For some conditions having a genetic diagnosis may not be the right choice. Particular consideration should be given for conditions that are done for predictive/pre-symptomatic reasons (i.e., testing to see if the patient will develop the condition in the future). This can be especially intense if the condition is a later onset progressive condition for which there is no prevention or treatment. Figure 11-16 depicts a continuum of testing utility from high utility to potentially harmful.
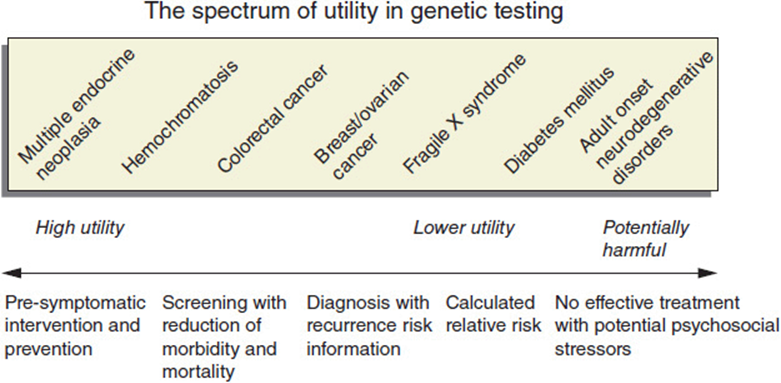
Figure 11-16. Spectrum of utility of genetic testing from high to potentially harmful to the patient.
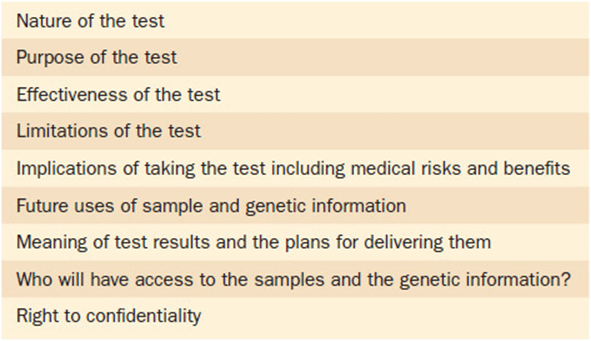
There are many more key elements in a complete informed consent for genetic testing. The most common reason that patients will decline testing is over fear of genetic discrimination. The concern is: “can my genetic information be used against me?” Questions are raised about how this information might affect aspects of their life, such as confidentiality, insurability, or employment. The past several years have seen great improvements in protecting patients’ rights in regards to genetic testing. A landmark piece of legislation was passed in 2008. The Genetic Information Non-Discrimination Act (GINA) provides key safeguards for patients undergoing genetic testing. Important aspects of this bill include protection against loss of health insurance and employment discrimination. While this bill has been a tremendous source of protection and comfort for patients considering genetic testing, it is still not all-encompassing. For instance life insurance (as compared to health insurance) is not a protected element. This information should be fully discussed with patients prior to having genetic testing. Table 11-3provides a list of some of the key elements that should be part of a fully executed informed consent. Another important piece of legislation that will be helpful in assuring that patients have access to genetic testing is the Affordable Care Act. The legislation as constructed mandates that as of 2011 children cannot be discriminated against by insurance as having a “preexisting condition,” and in 2014 this will apply to everyone. Thus, someone diagnosed with a genetic condition at age 2 years, 12 years, or 25 years will not be refused insurance coverage.
Table 11-3. Important Elements of Informed Consent in Genetic Testing
Patients should also be informed of what the potential costs and nonmonetary investments of testing might be. This should be reviewed in light of what the potential benefits are and the balance between the two (i.e., the cost: benefit ratio). Costs of the test, of course, include the actual fee for performing the test. For some genetic tests the cost can be relatively modest (less than $200), but for others it may be several thousands of dollars. It is important to note that the “cost” of the test for the patient includes much more than just the dollar amount of the bill. Other costs to the patient include lost time from work or school, anxiety over the testing, and even physical discomfort if the test requires an invasive procedure such as a spinal tap or sedation for the procedure. Another very real concern is third-party coverage of the tests. At all levels, governments, agencies, and corporations are trying to reduce health care costs by any means feasible. Genetic tests are particularly vulnerable in this environment as they are poorly understood and constantly changing. As such, many third-party payers have taken the stance that “new” is synonymous with “investigational.” Unfortunately a great deal of time and effort is often required on the part of the patient and the ordering health care provider to determine whether third-party payers will or will not cover a particular test. Hopefully help in the form of additional legislation will be forthcoming. One can only hope.
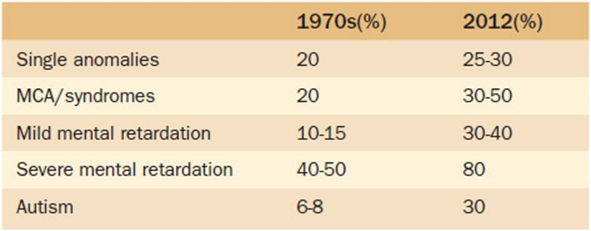
Another important aspect to be discussed with patients undergoing genetic testing is the diagnostic yield of the test. That is, if the test is performed, what is the chance that it will actually give an answer? While all of the technological advances we have described are indeed exciting, it is important to recognize that they still do not always give an answer. Not by a long shot. Currently, diagnostic yields are reported by diagnostic categories. Such categories include conditions such as multiple congenital anomalies, cognitive impairments (mental retardation, learning disabilities), cerebral palsy, or autism. Table 11-4 lists the most recently reported yields in the diagnosis of some of these major categories now as compared to 30 years ago. Again, it is exciting to note the impressive gains, but you must also recognize how much is still unknown. Once more, we emphasize the need to discuss this aspect of testing with the patient before proceeding. In the light of the fact that an answer is often not found, the patients should be informed of options for extraction and storage of DNA for future use. This option can be particularly important for family members if the patient being tested is critically ill and potentially may not survive to have testing done in the future when more advances are anticipated.
Table 11-4. Reported Diagnostic Yields for Selected Conditions
The approach to genetic testing can be quite simple, such as testing a patient for sickle cell anemia in which only one mutation in a single gene is known to cause the condition. Conversely the differential diagnosis may be quite broad and include testing options for several quite different etiologies. In general, the “shotgun” approach of ordering many tests at one time is discouraged. A stepwise (tiered) approach is preferable. For most major diagnostic categories, national guidelines have been developed outlining such suggested approaches for each. A significant question arises as to how any one practitioner can be aware of all the possible diagnostic genetic tests (which number in the thousands) and published testing algorithms out there? Fortunately, online (internet based) resources exist to help. One such resource is a federally funded site that acts as an information clearing house for genetic testing. This is a wonderful continually-updated resource for this type of information. We encourage you to add http:\genetests.org to your Favorites on the web browser.
One final topic about genetic testing is worth mentioning here. In recent years, several commercial companies have begun to market a variety of different genetic tests directly to individuals, bypassing the patient’s health care provider. Some of the more popular types offered in this manner include paternity, lineage/ethnicity/genealogy, and nutrigenomic testing. This so-called “direct to consumer marketing” has certainly raised a lot of concerns and prompted robust debate on both sides. Issues debated in this arena include voiced concerns over the paternalism of medical establishment versus unchecked recklessness for capitalism. Some of the key questions in this dialogue include:
1. How will privacy be handled?
2. What constitutes a “medical test”?
3. Who should regulate all of this?
4. How will informed consent be assured?
5. Who will guarantee the value of such information?
It will be fascinating to watch how this all plays out over the next many years!
Genetic Screening
Genetic screening as noted in the first section of this chapter is not the same as testing. In general the methodology is the same. The difference is in the “Why.” Testing is a diagnostic endeavor to identify the cause of a person’s disease or disorder. Screening is the search in a population for “healthy” persons who possess a genotype which:
1. is associated with a predisposition to a disease
2. may lead to a disease in their descendants, or
3. produce other variants not known to be associated with disease.
Genetic screening can be conducted at many different levels. One way to look at the different types of screening is by the timing of screening (i.e., at what point in an individual’s life cycle is the screening accomplished). Table 11-5 lists several types of screening grouped by the timing that the screening is typically performed. Another way to look at screening is by the type of person(s) to be screened. Individual screening involves checking single persons for a specific condition. The person is being evaluated not because of a symptom or problem, but rather because of their relative potential for having a problem. Examples of individual screening include lead screening in a pediatric patient, heterozygote (carrier) testing of the parents of a child with cystic fibrosis, or likewise testing the mothers of boys with fragile-X syndrome.
Table 11-5. Timing and Types of Screening
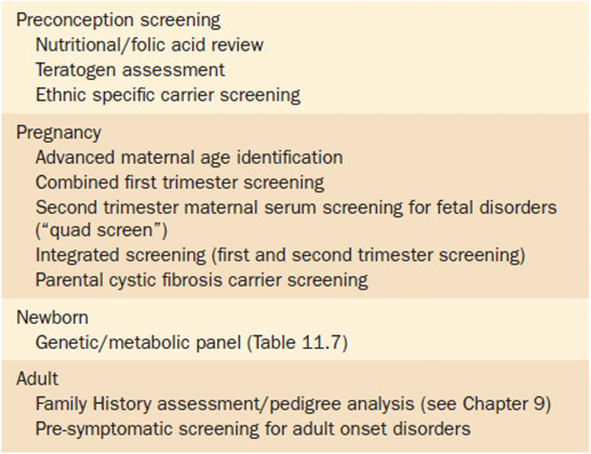
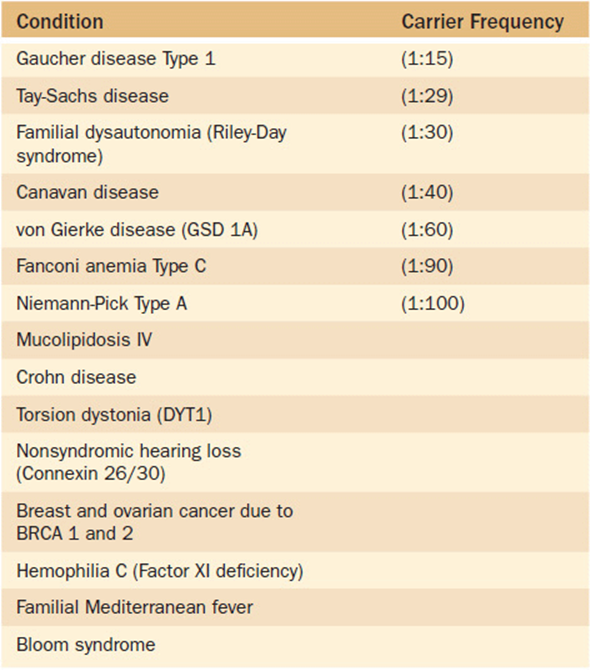
Alternatively, selected population screening can be used to screen certain subgroups of the population for conditions known to occur at a higher frequency in that group. One such selection criterion is screening based upon ethnicity. Certain ethnic groups are at such a high risk for a particular condition that selected screening is warranted (with the condition occurring at a low frequency in general population). Table 11-6 lists some of the better known ethnic-associated conditions for which selected population screening might be appropriate. One group that bears further mention is persons of Eastern European descent (Ashkenazi Jewish population). This specific ethnic group is known to have a higher frequency of carriers of several monogenic disorders (Table 11-7). As noted previously in Chapter 9(Family History and Pedigree Analysis), health care providers should have family history information—including ethnicity—as part of every patient’s medical record. If a patient reports Ashkenazi Jewish ancestry, the health care provider should be aware of the potential disorders that are associated with it and provide targeted screening upon request. This is particularly crucial to ascertain prior to pregnancy as some of the screening methodologies are much more complicated during pregnancy. In general, however, persons of Ashkenzi Jewish descent are well aware of these risk factors, and as a community are well organized and proactive in supporting their community in such efforts.
Table 11-6. Selected Genetic Conditions That Occur at an Increased Frequency in Specific Ethnic Subgroups of the General Population
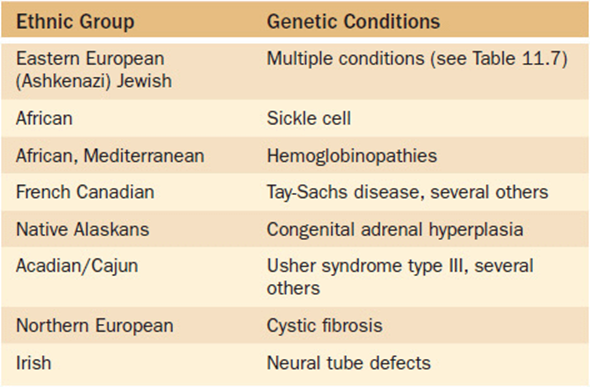
Table 11-7. Conditions With a High Carrier Frequency Rate in Eastern European (Ashkenazi) Jews
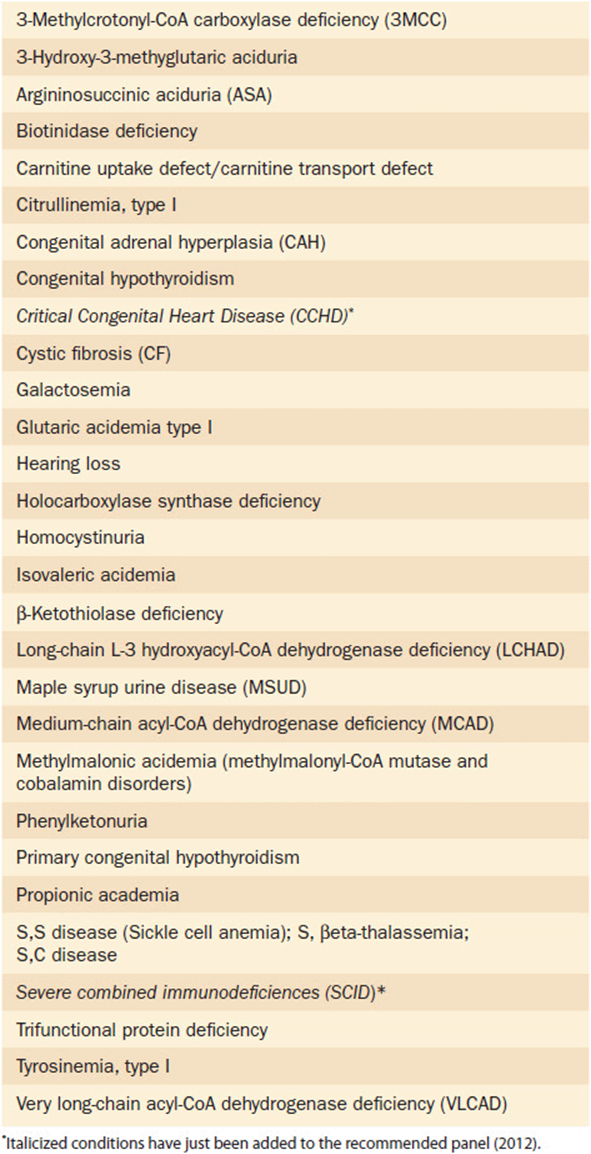
The broadest approach to genetic screening of course would be that of general population screening. This type of screening involves testing entire unselected populations for specific conditions that might be present in any individual person. In deciding which conditions are right for whole population screening, all of the basic principles of population screening discussed in the first section of this chapter should be carefully considered. The prototype for population screening is the practice of newborn screening in the United States and many other developed countries. The premise of newborn screening is to identify infants with specific disorders that, if detected, can be treated early with the resulting prevention of death or disability. Newborn screening began in the United States in the 1970s. Since that time it has evolved and expanded into one of the most successful efforts in all of public health endeavors. From the early beginnings of the program where states tested for a handful of disorders, the majority of states now screen for most of the 29 conditions suggested by the American College of Medical Genetics and Genomics Recommended Core Screening Panel (Table 11-8). As technology advances and a better understanding of other conditions evolves, this core panel should continue to expand. In fact, quite recently, severe combined immune deficiency (SCID) and critical cyanotic congenital heart disease (CCHD) have been added to the recommended panel. Several other conditions are currently under consideration and likely will be added to the recommended panel in the near future.
Table 11-8. Recommended Uniform Newborn Screening Panel
As would be easily predicted, genetic screening is wrought with controversy. While the proponents of screening point to the great success of preventing disease and disabilities, many thoughtful individuals have raised several real concerns that warrant strong consideration in the implementation of such programs. Some of the more pressing issues in genetic screening include:
• Mandated screening—for almost all states in the United States, newborn screening is legislatively mandated. The thought behind mandated screening is taking the best interest of the infant as a priority at a time when they cannot advocate for themselves. However, most states do have an “opt out” option for parental declaration of conflicting religious or moral objections.
• Right not to know—tied to the issue of mandated screening is the basic principle of personal liberties. What if I don’t want to know such results?
• Confidentiality—who has access to this information, and can it be shared without my permission?
• Genetic discrimination—similar to the discussions on genetic testing, the issue of confidentiality is paramount in screening. Since this information can be part of a legislated mandate, is the law putting me at risk of having my genetic information used against me? Of course, all of these issues are interrelated, as confidentiality also comes into play here.
• Use/disposal of specimens—many researchers recognize the potential wealth of information that could be available from population screening efforts. They are of the opinion that such specimens should be made available for research “for the better good of all.” However, those already concerned over the mandated procurement of specimens see further use and distribution of the samples as proceeding down that very “slippery slope” of loss of personal freedoms.
Obviously the short musings above do little justice to the incredibly complex and deeply emotional issues discussed. Ethical and legal discussions of such topics could fill libraries. For now, we just mention these so the reader is aware of some of the major talking points in this arena.
Part 3: Clinical Correlation
Kabuki syndrome (also known as Niikawa-Kuroki syndrome) was described by two Japanese physicians in 1981. The disorder received its name from a characteristic set of facial features that include long palpebral fissures, a broad and depressed nasal tip, large prominent earlobes and eversion of the lower eyelids (Figure 11-17). The appearance was said to be reminiscent of the makeup of the actors of Kabuki, a traditional Japanese theatrical form. Kabuki syndrome was originally known as Kabuki makeup syndrome, but the term “makeup” has been dropped as it was considered offensive by some families.

Figure 11-17. Young girl with Kabuki syndrome. Characteristic facial appearance that has been likened to the masks worn by Japanese Kabuki performers. This patient has a known MLL2 gene mutation.
Besides the characteristic facial changes, patients with Kabuki syndrome may have a variety of other signs and symptoms including cognitive deficits, postnatal slow growth, oro-facial clefting, congenital heart malformations, scoliosis and other skeletal changes, shortened fifth fingers, and persistence of the fetal digital pad prominences.
Since its original description, the etiology of Kabuki syndrome was unknown. Most cases were typically isolated (nonfamilial). A few familial cases were described suggesting a genetic etiology. Standard genetic testing like chromosome studies and microarray studies failed to identify a specific etiology. For quite a long period of time, then, the diagnosis was made solely on clinical parameters without any confirmatory testing available. Often this was adequate, but given the highly variable nature of this condition, many cases presented a significant diagnostic dilemma.
In 2010 a research group used the technique of exome sequencing, as described earlier, in a small cohort of patients with Kabuki syndrome. Using this powerful technique, they were able to identify a gene, the MLL2 gene, in chromosome region 12q12 to 12q14 as the cause of Kabuki syndrome in about three-fourths of the patients tested. Besides identifying this gene as being a cause of Kabuki syndrome, the testing showed that all cases were due to a heterozygous mutation, establishing this as an autosomal dominant condition. Subsequent studies have now confirmed the suspected genetic heterogeneity of this condition. Several patients with Kabuki syndrome who did not have MLL2 mutations were subsequently shown to have mutations in the KDM6A gene on chromosome Xp11.3 by a combination of chromosome, microarray, and sequencing techniques.
 Board-Format Practice Questions
1. Condition A is appropriate for population screening. Condition B is not. What possible reasons could explain this?
A. Condition A is a much rarer disorder than condition B.
B. Condition B is easy to screen; A is not.
C. Condition B is a serious condition; Condition A is not very clinically problematic.
D. There is no effective treatment for condition B; there is for A.
E. The screening tests for conditions A and B are both very expensive.
2. Genetic screening:
A. can identify at risk individuals.
B. is highly cost ineffective.
C. is politically incorrect to target specific ethnic groups in screening.
D. is unlikely to affect general medical practices.
E. is usually limited to DNA testing.
3. Performing which of the following would be considered genetic screening rather than genetic testing?
A. Selected biochemical studies on a newborn for a suspected metabolic disorder.
B. Serum markers in pregnant women to identify fetuses with chromosome disorders.
C. DNA tests on an individual for an adult onset genetic disorder.
D. Neurologic examinations on people with tremors.
E. A sweat test on a child with pneumonia to see if he/she has cystic fibrosis.
4. What is the difference between genetic testing and genetic screening?
A. The types of methodology used in each.
B. The costs of doing one or the other.
C. The reason for doing one or the other.
D. The laboratories that do one or the other.
E. The age of the patient.
5. About how many conditions are infants tested for by newborn screening in most states in the United States?
A. 5
B. 10
C. 30
D. 75
E. 150