
As you’ve read in earlier chapters, when we factor in the natural resources required in their production, some foods are easier on the environment than others, and some stand out as exceptionally resource-intensive to produce.
As you’ll read below, the Carbon Trust in the United Kingdom has introduced carbon labels to help British consumers understand the environmental implications of their food selections. The labels inform them as to how much carbon they will be responsible for “emitting” if they choose to buy certain foods.
That information’s important, but it’s only half of the equation.
Since micronutrients are the true measure of a food’s value, in this chapter I look at ways to gain the most micronutrients while expending the fewest natural resources. I’ve put together a system that takes both environmental strain and micronutrient yield into consideration; I call it the “nutrient-to-resources ratio,” and will explain it in detail later in the chapter. Foods with the highest nutrient-to-resources ratio are therefore the ones I suggest become the base of our diet, not only for peak health but also to put the least amount of strain on our natural resources.
I also compare the monetary cost of different foods. While it’s undoubtedly less expensive to gain calories from highly processed food (and food-like substances) than from natural whole food, does the argument that “it’s too expensive to eat healthy” hold up when we assess the cost of nutrition (micronutrients) as opposed to calories? How much highly refined food would we have to consume to match the nutrition we could get from a small amount of food in its natural state, and what would the cost difference be?
THE U.K.’S LOW CARBON DIET
In March 2007 the British government put forward a draft bill called the Climate Chage Bill, which stated that the countries of the United Kingdom would be required to reduce their carbon emissions by 80 percent (based on 1990 standards) by the year 2050.1
A bold move and, as you might expect, a heavily criticized one by some industries. But despite the expected opposition, the bill was passed in November 2008, becoming law and fueling hopes that Britain would evolve into a low-carbon economy. The United Kingdom was now the only country in the world to have imposed such a law upon itself. But whether its ambitions will be fulfilled ultimately rests upon the actions of its people. Britons have responded to the challenge and, according to polls conducted, are actively seeking ways to reduce their carbon output. Through U.N. reports, most notably Livestock’s Long Shadow, the British population has responded to the message that the most significant difference an individual can make is by way of informed food choices.
With the aid of the labels, each person can now establish his or her individual “carbon budget,” which presumably will make it easier for that individual to stay on a low-carbon diet.
Industry’s response to consumer concern was swift. Playing to consumers’ interest (that could perhaps ultimately become a market demand), a nonprofit company called the Carbon Trust sprang up. Targeting companies wanting to establish a “carbon footprint” for their products, the Carbon Trust offered a CO2-assessment service and a label to indicate corporate environmental stewardship. Measuring the carbon dioxide emitted during the life cycle (farming, manufacturing, packaging, distribution, and disposal) of a given product, the Carbon Trust offered suggestions as to how carbon dioxide emissions could be reduced, and then would grant a carbon footprint label based on the current carbon dioxide production during the life cycle of the product. The company would make the label part of its packaging. Total “cradle to grave” emissions, measured in grams of CO2e (carbon dioxide equivalent) emitted as a result of the product and packaging life cycle, were put in plain view.2
Further, to meet the Climate Change Bill’s target of an 80 percent CO2-emission reduction by 2050, each individual, says the Carbon Trust, must produce no more (on average) than 8.3 tons of CO2e per year—which equates to 50 pounds per day. Of that 50 pounds, it’s suggested that each person keep the emissions total from his or her food down to no more than 6.5 pounds of CO2e per day. But wait—what? Clearly, these are abstract numbers, and without a context they have no value. However, thanks to the Carbon Trust, these otherwise unrelatable numbers are put into perspective and given relevance for the average person. With the aid of the labels, each person can now establish his or her individual “carbon budget,” which presumably will make it easier for that individual to stay on a low-carbon diet. For example, Tesco, a large grocery store chain in the United Kingdom, enlisted the services of the Carbon Trust to help give its customers a sense of the CO2-equivalent emissions they might release into the atmosphere should they use particular food products. Its house brand of orange juice, for example, displays a label stating that the production of a one-cup serving of the juice will be directly responsible for releasing 12.5 ounces of carbon dioxide emissions throughout its life cycle.3 The idea is that with the labeling, those British citizens mindful of their carbon diet will be able to determine if they want to “spend” their limited carbon points to indulge in a glass of orange juice. (By the way, and interesting to note, since carbon labeling is not in itself law in the United Kingdom, only manufacturers of plant-based foods are taking part. That isn’t surprising, since products containing meat and dairy would score horribly and presumably scare off those aspiring to stay carbon-lean. The carbon labeling would lift the veil of inefficiency and sales of those products with higher carbon footprints would, presumably, fall.)
I unequivocally commend the proactive stance the U.K. government has taken. However, the assessment services and carbon label of the Carbon Trust, though a step in the right direction, speaks to emissions with no reference to land, water, or fuel consumption. Its main shortcoming is that the emissions score is in no way tied to the nutritional component of the food on which it’s affixed. What health-boosting nutrients do we get for our carbon expenditure? How do we decide if we want to “spend” our carbon on food when what we gain in return is not revealed?
To produce our food, we’ve clearly gone on a resource-spending binge. And, in the haze of our indulgence, what we seek in return has become unclear.
Since the inefficiency of translating natural resources into food has become strikingly apparent, the goal of conscientious food scientists has become to reap more calories from the land while expending fewer resources in doing so. And while I appreciate their effort to maximize return on natural resources’ expenditure in food production, I don’t feel the calorie is the best point of reference. A calorie is, indeed, a measure of food energy, so at first glance it may seem logical, when converting a precious unit of fossil fuel energy into food energy, to go for the highest possible yield of calories. But as I mentioned in Chapter 1, it’s not a lack of calories that makes us sick. In fact, it’s quite the opposite. Though the food-producing community may be conscientiously trying to reap more calories from the land for ostensibly environmental reasons, I believe that the health community has valuable insight to share regarding what, specifically, we ought to strive to pull—nutritionally speaking—from the land. And that is nutrient density. As I described in Chapter 1, nutrient density is expressed by a ratio of micronutrients delivered to calories consumed, and the higher the micronutrients and the lower the calories, the better. Nutrient density is a simple and effective way to rate true nutritional value. The goal, for the sake of North Americans’ health, should be to draw more micronutrients from our land, not more calories. This rebalance would play a major role in preventing disease and obesity. The odd paradox of modern food production that enables us to be both overfed and undernourished would be immediately eradicated.
WHOLE FOODS MARKET: “HEALTH STARTS HERE” PROGRAM
In the spring of 2007, I had the opportunity to spend a long weekend at John Mackey’s ranch. Just outside of Austin, Texas, about 40 like-minded people from the natural food industry converged on the Whole Foods Market CEO and visionary’s 780-acre ranch. At this event, billed as sports weekend, it didn’t take long to gather that Mackey wasn’t a typical CEO. Sharing my view of food, John made it clear that he, too, strongly believed that we could lower our rate of disease and health problems in North America simply by making informed food choices.
And because of that simple preventative medicine philosophy, Whole Foods Market has taken the lead in North America by creating a program called “Health Starts Here.”4 As one of the program’s proactive measures, nutrient density scores for almost all of its produce were displayed. Initiated by John and developed by Dr. Joel Fuhrman, the nutrient-density scores have dramatically increased sales in the highest-ranking foods. Health-conscious shoppers just needed to know which foods to buy more of, and Whole Foods Market was happy to tell them. Greater sales for Whole Foods Market and better health for the people who shop there: it was a win-win situation.
As you know, nutrient-density scores reflect micronutrient level in relation to calories, which is helpful when shopping for healthy choices. But those digits in no way tie in the environmental expenditure or reflect what resources were required to yield those micronutrients in the food.
The goal is to get as high a level of health-boosting micronutrients from food, while expending the smallest amount of each natural resource to do so.
So while the British are drawing attention to and quantifying a food’s carbon dioxide emissions, and while Whole Foods Market is calculating and displaying its nutrient density, neither system relates one value to the other.
Having had the opportunity to tour and work with both environmental and health experts, I feel as though the members of both groups have excellent perspectives—on their own set of values. Many in the nutrition industry are unfamiliar with the exceptional amount of resources it takes to create sustenance. And the environmental community is unacquainted with the value of nutrient density and therefore with what our resources ought to be providing in exchange for their consumption. And it’s certainly not calories.
But in merging the two perspectives, we have the complete picture.
For this reason, I feel it’s in our best collective interest to pursue a simple goal: get as high a level of health-boosting micronutrients from food, while expending the smallest amount of each natural resource to do so. That’s it.
THE NUTRIENT-TO-RESOURCE RATIO: WHAT IT IS AND WHY IT MATTERS
In an effort to achieve this melding of perspectives, I’ve put together what I call the “nutrient-to-resource ratio.” It takes into consideration both micronutrient gain and natural resource expenditure in the food production process.
When applied, the nutrient-to-resource ratio reveals how misguided our resource expenditure is in our failed attempt to nourish the country.
In Chapter 2, I showed the significant divide between the resources it takes to acquire food from animals and the amount it takes to acquire food from plants. That comparison was based on the conventional calorie-to-calorie or pound-to-pound measure, neither of which addresses the true nutritional makeup of the foods being compared. When we take micronutrients into account as well, that significant divide becomes almost hard to comprehend. Clearly, plant-based whole foods require—by far—the least amount of each resource to produce health-boosting micronutrients.
I believe it should become standard practice to include a food’s nutrient-to-resource ratio on all nutrition labels.
At this time, the information we’d need to calculate the ratio of nutrition from different foods to their draw on land, water, and fossil fuel during their production is not publicly available. I’m working to obtain these numbers so that a comprehensive evaluation system can be developed. Considering the health and environmental benefits of this information, I believe it should become standard practice to include a food’s nutrient-to-resource ratio on all nutrition labels. The ratio would give consumers a broader and more comprehensive scope as to what products are, in fact, part of the solution.
However, emission (CO2e) numbers are available for most foods. With that information, I calculated the nutrient-to-emission ratio for a number of foods, using CO2e emissions as a measure of exchange for micronutrients.
The first step in calculating the ratio is to establish the amount of CO2e produced to yield a single calorie of a given food. I then divided the nutrient density of the food by the emissions per calorie, and the result is the nutrient-to-emission ratio. You can find the formula for the calculation of emissions per calorie in “Calculating the Numbers” on pages 310–311, along with the sources of nutrition data I used to determine the nutrient density.
Here is a sample of nutrient-to-emission ratios I’ve calculated. Keep in mind that the higher the number, the greater the amount of micronutrients is delivered in relation to the amount of CO2e released.
|
Plant-Based Food |
Nutrient-to-Emissions Ratio |
|
Almonds |
1266 |
|
Steamed vegetables (combination of carrots, broccoli, asparagus) |
272 |
|
Lentils |
238 |
|
Animal |
Nutrient-to-Emissions Ratio |
|
Wild fresh local coho salmon |
61 |
|
Baked chicken breast |
11.6 |
|
Poached eggs |
6.7 |
|
Farmed fresh local salmon |
6.6 |
|
Domestic cheddar cheese |
4 |
|
Beef tenderloin steak |
1.01 |
As for the other resources, limited information is available with which to calculate the nutrient-to-resource ratios, so by necessity my assessment is limited too. However, I have worked out the ratios for a few foods. Full calculations for all the numbers in the next sections are given in “Calculating the Numbers” on page 310. There, I’ve presented the information in snapshot form to give you a quick sense of the draws on each resource that various plant and animal food sources demand. For each resource, I look at foods in pairs to contrast the draw each food makes on the particular resource. Comparing foods illustrates the substantial impact our food choices can have on the environment.
NUTRIENT-TO-ARABLE-LAND RATIO
Wheat, Corn, and Soybeans Versus Beef
As you will see from the calculations in “Calculating the Numbers” on page 310, significantly more arable land is needed to harvest an equivalent amount of micronutrients from beef as from wheat, corn, and soybeans:

These foods are common feed crops for animals. If we were to use these crops as food for the human population instead, we would gain 23.4 times the amount of micronutrients from the same amount of land.
Hemp Seed Versus Beef
However, if we were to plant hemp as food for humans in place of wheat, corn, and soybeans to feed beef cattle, we would gain 51.9 times the amount of micronutrients on an equal amount of land, compared to what we would obtain from beef.
To explain how I arrive at this figure, by weight, 5.33 times as much hemp seed can be produced as beef raised on the same amount of land (880 pounds of hemp seed per acre5 compared with 165 pounds of beef6). And since beef has a nutrient density of 20 and hemp seed registers at 65 (3.25 times more), for every calorie you get from hemp seed, you’d have to eat 3.25 calories from beef to match the micronutrient level.
Since pound for pound, hemp seed contains about three times more calories than beef, to gain the equivalent in micronutrients from beef as from hemp seed would require 51.9 times more land.

To produce enough beef to match the per-calorie micronutrient level of hemp seed, 51.9 times more arable land would be needed.
Kale Versus Beef
Now, what if instead of growing wheat, corn, or soybeans we grew kale? I realize that comparing kale—among the most efficient and nutrient-dense crops—to beef—one of the worst in both categories—provides something of an extreme case, but the difference is impressive.
By weight, 232 times more kale than cattle can be produced on the same amount of land (38,400 pounds of kale per acre7 compared with 165 pounds of beef). And since beef has a nutrient density of 20 and kale registers at 1000, which is 50 times greater, for every calorie you get from kale, you’d have to eat 50 from beef to match the micronutrient level.
Since beef has about four times the amount of calories per pound as kale, to gain the equivalent in micronutrients from beef as from kale would require 2900 times more arable land.

To gain an equal amount of micronutrients from beef as from kale, 2900 times more arable land would be needed,.
NUTRIENT-TO-WATER RATIO
Sweet Potatoes Versus Beef
As mentioned earlier, to produce a pound of beef, a minimum of 2500 gallons of water is required. In contrast, only 60 gallons of water is needed to produce a pound of sweet potatoes, a difference of a little over 41 times. Since beef has a calorie density of 2990 calories per kilogram and sweet potatoes register at 900 calories per kilogram—a difference of 3.3—we can determine that each calorie of beef requires just over 12 times more water to produce than a calorie from sweet potatoes. And since sweet potatoes have a nutrient density of 83, while beef registers at 20—a difference of 4.15—we can determine that a little over 52 times more water is required to gain an equal amount of micronutrients from beef as can be acquired by an equal number of calories from sweet potatoes.

It takes 52.7 times more water to produce an equal amount of micronutrients from beef than from sweet potatoes.
NUTRIENT-TO-FOSSIL-FUEL COMPARISON
Plant Protein Versus Animal Protein
As noted in Chapter 2, the process of acquiring protein from animal sources rather than plant sources uses a great deal more fossil fuel. When we compare micronutrients, that divide becomes even greater. For example, lentils have a nutrient density of 100, whereas the average nutrient density of the animal products listed earlier in this chapter is 25.3. On average, you’d have to eat 3.95 calories from these animal products to obtain the same amount of micronutrients delivered in 1 calorie of lentils. And as mentioned earlier, on average, obtaining protein from animal products requires that 25.4 calories from fossil fuel energy be spent to obtain 1 calorie of protein. And since only 2.2 calories of energy needs to be spent to obtain 1 calorie of protein from lentils, choosing the plant protein equates to an energy savings of 11.5 times (25.4 ÷ 2.2 = 11.5). Multiplying the energy factor by the calorie factor (11.5 × 3.95) tells us that it takes 45.4 times more energy to obtain the same amount of micronutrients from the average animal product as from lentils.

Assuming, for comparison, that the protein amount is equal when factoring in micronutrient levels, 45.4 times more fuel would need to be burned to get an equal amount of micronutrients from animal products as from plants.
Even chicken—the most energy-efficient meat to produce, and a source that is relatively nutrient dense—fares poorly when compared with basic brown rice, which has an average nutrient density, since rice yields more micronutrients while requiring less fossil fuel to produce.

Since rice has a nutrient density of 41 and chicken has a nutrient density of 27, you’d have to eat 1.5 calories of chicken to obtain the same amount of micronutrients as found in 1 calorie of rice. Chicken requires 1.8 times more energy to produce than rice. If you multiply this energy factor (1.8) by the calorie factor (1.5), you’ll see that 2.7 times more energy is needed to yield an equal amount of micronutrients.
Since the nutrient density of kale is 10 times that of lentils, 454 times as much fuel would need to be burned to obtain equivalent micronutrients from animal products as from kale.

Since the nutrient density of kale is 10 times that of lentils, 454 times more fuel would need to be burned to obtain equivalent micronutrients from animal products as from kale.
Cutting out the intermediary and going directly to the source uses significantly less fossil fuel and is therefore notably more efficient.
NUTRIENT-TO-EMISSION RATIO
In the following examples I use calories as the method of comparison, as opposed to weight or volume. Comparing the amount of emissions required to produce an equal number of calories from a variety of sources gives, I believe, the fairest comparisons. (However, when the ratio is calculated by using weight instead, the discrepancies are even greater. I’ve listed them below each example.) The complete calculations are in “Calculating the Numbers” on page 310.
Lentils Versus Chicken
Producing meat in the form of a chicken creates the fewest emissions as far as animal agriculture goes. Yet calorie for calorie, chicken emits 5.57 times more CO2e in its production than lentils. And since lentils are 3.7 times more nutrient dense than chicken (lentils have a nutrient density of 100, and chicken has a nutrient density of 27), 20.6 times more greenhouse gases (5.57 × 3.7) will be released into the atmosphere to obtain the same amount of micronutrients from chicken as from lentils.

Acquiring an equal amount of micronutrients from chicken as from lentils would require 20.6 times more CO2e to be released into the atmosphere.
When comparing weight instead of calories, pound for pound, the divide would actually be slightly larger, registering at 28.8.
Steamed Vegetables Versus Baked Salmon
Steamed vegetables have a nutrient density average of 304, and salmon has a nutrient density of 39, which means that you’d need to produce 7.8 times more salmon to yield the same nutrient levels of steamed vegetables. Therefore, to obtain the equivalent amount of micronutrients from salmon as from steamed vegetables would mean 41.44 times more greenhouse gases being released into the atmosphere.

41.44 times more CO2e would be released into the atmosphere to gain the equivalent micronutrient content from coho salmon as from vegetables.
When comparing an equal weight of vegetables to salmon—pound for pound as opposed to calorie to calorie—an even greater divide is revealed. There would be 113.55 times more carbon dioxide released into the atmosphere to gain the equivalent micronutrient content from a pound of coho salmon as from a pound of vegetables.
Nuts Versus Domestic Cheese
Since raw nuts (almonds, cashews, walnuts, pistachios) have an average nutrient density of 36.75, and cheese has a nutrient density of 10, for every calorie obtained from nuts, 3.68 must be obtained from cheese to match the micronutrient content. There would be 2.49 grams of CO2e released into the atmosphere in the production of 1 calorie from cheese, compared to only 0.03 grams to create a calorie from nuts.

304.73 times more CO2e would be released into the atmosphere to gain the equivalent micronutrient content from “American cheese” as from raw nuts.
Since pound for pound nuts have more calories than cheese, cheese production would emit only 209 times as much carbon dioxide as nut production if the foods were compared on the basis of weight.
Kidney Beans Versus Beef Tenderloin
Just for fun, here’s an extreme example: standard factory-farmed beef contrasted with beans.
Kidney beans emit 116 times (CO2e per calorie of beef tenderloin: 19.72 ÷ 0.17 CO2e per calorie of kidney beans) less CO2e than the production of beef tenderloin. Since kidney beans are 5 times more nutrient dense than beef, 580 times (116 × 5) more greenhouse gasses will be released into the atmosphere to gain an equal amount of micronutrients from beef tenderloin compared to kidney beans.

To obtain the same amount of micronutrients from beef as from beans, 580 times more greenhouse gases would need to be released into the atmosphere.
When comparing equal weight of beans to steak rather than calories, the divide is even greater: 1560 times more carbon dioxide would be released into the atmosphere through the production of beef tenderloin than through the production of beans to produce an equal amount of micronutrients.
THE LOW COST OF HIGH NUTRITION
What about cost? We know that food requiring fewer resources to produce comes at a substantially lower environmental cost. And we know that those same nutrient-rich plant-based whole foods greatly reduce the risk of disease, which will likely translate into a cost savings at both an individual and a societal level. We also know that basing our diet on nutrient-dense whole foods has been shown to reduce sick days per year and enhance mental clarity; hence, a boost in productivity may result, which some may choose to put a dollar value on.
It’s certainly true that more calories and a greater mass of food (or food-like substances) can be had per dollar from highly processed refined sources, but does nutrition really cost more?
But what about the upfront monetary cost of healthier food—is it really more expensive? Yes. And no. It’s certainly true that more calories and a greater mass of food (or food-like substances) can be had per dollar from highly processed refined sources, but does nutrition really cost more? I wondered, since micronutrients are the true measure of a food’s worth, what the cheapest way to obtain them might be. Through conventional “standard” foods with lower price stickers? Or by way of plant-based whole foods priced a little higher? Bear in mind that the following examples are based on the retail (government-subsidized) prices for the meat option
The following sections describe what I found out.
Black Beans Versus Eggs

It costs 5.24 times more to gain nutrition from eggs as it does from black beans.
Eggs cost about $3.99 a dozen (about $2.99 per pound), and based on a caloric density of 1430 calories per kilogram, we can determine that each 100 calories costs 46 cents. Since eggs have a nutrient density of 27, their nutrient-to-cost ratio is 58.7 (27 ÷ $0.46). In contrast, black beans cost about $1.59 per pound, and based on a caloric density of 1320 calories per kilogram, each 100 calories from black beans costs 27 cents. Factoring in a nutrient density of 83, black beans have a nutrient-to-cost ratio of 307.41, 5.24 times greater than eggs. Therefore, you would have to eat six eggs, at a cost of $2, to match the micronutrient content you would acquire from 4 ounces of black beans, at an expenditure of 40 cents, a cost difference of over 5 times. ($1.59 [price per pound] ÷ 4 [price per 4 ounces] 0.40 × 5.24 = $2 worth of eggs) (40 cents × 5.24 = $2 [6 eggs])
Lentils Versus Chicken

It costs 6 times as much to gain nutrition from chicken breast as it does from lentils.
Chicken costs about $4.99 per pound, so based on a caloric density of 1650 calories per kilogram, each 100 calories costs 67 cents. Since chicken has a nutrient density of 27, its nutrient-to-cost ratio is 40.30 (27 ÷ $0.67). In contrast, lentils cost about $1.99 per pound, and based on a caloric density of 1060 calories per kilogram, each 100 calories costs 41 cents. Factoring in a nutrient density of 100, lentils have a nutrient-to-cost ratio of 243.9, six times greater than that of chicken. Therefore, you would have to eat 9.5 ounces of chicken, at a cost of $3, to match the micronutrient content you would acquire from 4 ounces of lentils, at a cost of 50 cents, a cost difference of 6 times. ($1.99 [price per pound] ÷ 4 [price per 4 ounces] 0.50 × 6 = $3 worth of chicken) (50 cents × 6 = $3 [9.5 oz of chicken])
Chicken is 2.5 times more expensive by weight: 2.5 ÷ 1.55 = 1.6. Therefore, calorie for calorie, chicken is 1.6 times more expensive than lentils. Lentils are 3.7 times more nutrient dense than chicken: 3.7 × 1.62 = 6.
Therefore, you would have to spend 6 times more to gain equal nutrition from chicken as from lentils.
Flax Versus Coho Salmon
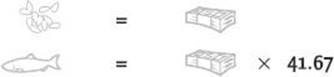
It costs 41.67 times more to gain nutrition from salmon as it does from flax.
Salmon costs about $15.99 per pound, and based on a caloric density of 1900 calories per kilogram, each 100 calories from salmon costs $1.85. Since salmon has a nutrient density of 39, its nutrient-to-cost ratio is 21.08 (39 ÷ $1.85). Flaxseed costs about $1.79 per pound, and based on a caloric density of 5340 calories per kilogram, each 100 calories costs $0.074. Factoring in a nutrient density of 65, flaxseed has a nutrient-to-cost ratio of 878.38, 41.67 times greater than that of salmon. Therefore, you would have to eat 1.17 pounds of salmon, at a cost of $18.78, to match the micronutrient content you would acquire from 4 ounces of flaxseed, at a cost of 45 cents, a cost difference of over 41 times. ($1.79 [price per pound] ÷ 4 [price per 4 ounces] 0.45 × 41.67 = $18.75 worth of salmon) (45 cents × 41.67 = $18.75 [1.17 pounds of salmon])
WHY DOES A HAMBURGER COST LESS THAN AN APPLE?
Have you ever wondered how it is that meat and other highly processed food—all of which consumes an inordinate amount of land, water, and oil to produce—costs relatively little in dollars? How is it that a hamburger at a fast food restaurant can cost under $2 when a locally grown organic apple that uses a fraction of the energy to produce it costs the same or more? The short answer: government subsidies. In the United States, these happen through legislation known as the Farm Bill—the government’s chief food policy tool. While it was introduced with the best of intentions, the Farm Bill has veered off course and no longer benefits the people as a whole. And certainly not the planet.
The original aims of the bill were achieving food security and helping struggling farmers make enough money to stay in business. However, the subsidies were misdirected. They began to flow mostly to the meat and dairy industry. Even with strong sales, the production cost of meat and dairy was simply too high (because of its substantial resource cost, in turn because of inefficiency) to enable farmers to make a profit. Had the government not stepped in and bailed out this exceptionally inefficient industry with monetary subsidies, the cost of meat and dairy would be prohibitive to almost everyone. Instead, subsidies turned these products into cheap commodities, causing consumption to skyrocket—and with it, pollution and disease. To rub salt in the wound, we’re paying for it. Government money comes from the taxpayers. So, even those of us who don’t support these inefficient industries by patronizing them prop them up by way of the current tax system. And now, to reopen the wound and dump more salt in, we also highly subsidize our reactive medical systems, which pours money into treating symptoms caused by poor-quality diets made possible, and encouraged, by subsidies. It truly is a vicious cycle.
"Pay now for healthier food, or pay later to treat the symptoms of disease as a result of poor nutrition.”
It’s estimated that the health costs from poor diet are $250 billion per year in the United States alone, and the U.S. National Institutes of Health (NIH) has predicted that obesity will lower Americans’ life expectancy by up to five years over the next few decades.
In 2006, I had an opportunity to speak to the U.S. Congress about exactly this issue: the Farm Bill. I’ve learned that when speaking to such governmental groups, it’s important to focus on one thing: money. So I did. My suggestions were along the line of preventative medicine. I presented information suggesting that if subsidies were to be lifted, people simply would not be able to afford resource-gobbling food; they would have to eat simple plant-based foods. The most nutrient-dense food would then be the cheapest. Its lower cost would, of course, give people an economic incentive to eat better food. And, as a direct result, the disease risk factor of poor nutrition would be much reduced and the overworked health-care system would be much relieved of its strain. While nothing of significance developed as a result of my presentation, the nodding heads in the audience indicated that the simple logic of “Pay now for healthier food, or pay later to treat the symptoms of disease as a result of poor nutrition” seemed to strike a chord.
Considering the immense resource draw of meat production, it seems reasonable to say that if meat were sold at a fair market value, consumption of it would plunge. People simply wouldn’t be able to afford it. Estimates on the fair market price for a typical fast-food burger, costed without subsidies, range from $35 all the way up to $200. The $35 calculation is based on the fossil fuel cost to produce it, while the $200 figure includes the land and water costs. In addition, the $200 burger price factors in the delivery of the food to the feedlots, and the cleanup of the water systems polluted by the cattle’s manure. But, as it stands, with taxpayer-funded subsidies, this same hamburger at a fast-food restaurant will go for about $2. Sometimes as low as $1—if you select the “value menu” and agree to buy a carton of fries and a soft drink.
THE GREAT ENVIRONMENTAL DIVIDE: MEAL PLAN COMPARISONS
Following are three sample one-day meal plans to further illustrate the environmental impacts of our food choices. In each I’ve calculated and compared the amount of CO2-equivalent emissions each meal is responsible for releasing during its production.
The first meal plan reflects the Standard American Diet, subsistence in the form of processed food-like substances, which relies heavily on red meat and dairy, with very little food in its natural state.
Second, I look at the “healthy” American diet. The go-to diet for many Americans once they’ve begun to experience health decline from years of eating the Standard American Diet, the “healthy” American diet is only marginally less processed and far from a long-term health solution. And, as I found, the amounts of CO2-equivalent emissions created by its production are enough to be of major environmental concern.
The third meal plan is devised following the nutritional philosophy of this book: it uses plant-based whole foods with a high nutrient-to-resource ratio.
The numbers next to each meal are the grams of CO2-equivalent emissions (here, CO2e for short) released into the atmosphere in the production of the food composing each meal.
STANDARD AMERICAN DIET
Breakfast: Omelet with meat and cheese; cereal and milk; 12 oz coffee with cream and sugar. CO2e: 3101 g
Lunch: Cheeseburger and fries; 12 oz soft drink. CO2e: 3116 g
Dinner: Beef stir-fry; 12 oz beer; milk chocolate bar for dessert. CO2e: 3387 g
TOTAL CO2e: 9604 g
“HEALTHY” AMERICAN DIET
Breakfast: Buttermilk pancakes; scrambled eggs with cheese; latte. CO2e: 2661 g
Lunch: Baked farmed salmon; 5 oz wine. CO2e: 1396 g
Dinner: Chicken Caesar salad; baked potato with sour cream; 12 oz water. CO2e: 1317 g
TOTAL CO2e: 5374 g
WHOLE FOODS TO THRIVE SUGGESTION
Breakfast: Nutrient-dense plant-based smoothie (containing hemp protein, pea protein, rice protein, and flaxseeds) blended with banana and blueberries. CO2e: 130 g
Snack: Seasonal fruit and nuts. CO2e: 104 g
Lunch: Vegetable stir-fry and lentils. CO2e: 361 g
Snack: Oven-roasted potatoes. CO2e: 84 g
Dinner: Beans and rice with grilled vegetables and green salad. CO2e: 308 g
Snack: Raw vegetables and hummus. CO2e: 212 g
TOTAL CO2e: 1199 g
So what do these numbers actually mean? That’s what I wondered. To make them relatable, I’ve compared the CO2-equivalent emissions released in food production with the CO2 emissions created from driving. What I found was striking.
The chart on the next page shows the grams of CO2-equivalent emissions that each diet would produce over various periods: a day, a week, a month, a year. I then compare these CO2 levels with what’s produced by different driving distances.
For a midsize car that averages between 26 and 28 miles per gallon, about half a pound (227 g) of carbon dioxide is released into the atmosphere to travel one mile.8 Knowing that, we can directly compare driving with eating and its impact on the environment.
However, because the numbers for the consumption of arable land, water, and fossil fuel are not yet available for all food products, in the examples I use only CO2-equivalent emissions to compare food’s impact on the environment. Needless to say, the environmental toll is far greater when all factors are considered.
|
CO2-equivalent emissions |
||
|
Emissions from diet |
Emissions from driving |
|
|
STANDARD AMERICAN DIET |
||
|
Day : 9604 grams |
= |
42.4 miles |
|
Week : 67,240 grams |
= |
296 miles |
|
Month : 291,961 grams |
= |
1,289 miles |
|
year : 3,505,460 grams |
= |
15,476 miles |
|
“HEALTHY” AMERICAN DIET |
||
|
Day : 5374 grams |
= |
23.7 miles |
|
Week : 37,618 grams |
= |
166 miles |
|
Month : 163,397 grams |
= |
720 miles |
|
year : 1,961,510 grams |
= |
8,650 miles |
|
WHOLE FOODS TO THRIVE SUGGESTION |
||
|
Day : 1199 grams |
= |
5.28 miles |
|
Week : 8393 grams |
= |
37 miles |
|
Month : 36,469 grams |
= |
160.65 miles |
|
year : 437,635 grams |
= |
1928 miles |
Sources of data: www.falconsolution.com/co2-emission/
227 g (1/2 lb) CO2 to travel 1 mile in midsize car
Driving distances are for a midsize car that averages between 28 and 30 miles per gallon.
The contrasts among the diets are dramatic, to say the least. But headlining just about every “what you can do to save the planet” list is the suggestion that we abstain from driving, or at least greatly reduce the amount we do. “Ride your bike, take transit, or—if you must—carpool.” To many, driving has become a sign of environmental disregard. And while I agree that using alternative means of transportation and depending less on the automobile makes sense, are cars really deserving of so much attention?
Clearly, with automobile transportation we have a hands-on relationship. We regularly need to fill our vehicles with gasoline. This gives us an idea as to how much fuel we directly consume. Besides, filling up costs money, which for the average person reinforces the value of fossil fuel. That’s good. Most of us appreciate the value of gas because of its high and ever-increasing cost and have a sense of the environmental damage its combustion is causing. We see the emissions spewing from tailpipes as we drive around. And sitting in rush-hour traffic, if we roll down the window, we experience directly how CO2 emissions are adversely affecting air quality. Over cities such as Los Angeles, we can see a thick layer of smog engulfing the buildings as a direct result of tailpipe exhaust. And as such, we have a close, tangible, and therefore relatable relationship with our vehicle and its fossil fuel–burning, emission-creating ways.
Making wise food choices can have a more significant impact on environmental preservation than eliminating driving altogether.
In contrast, we don’t see the fuel needed in the production of food, and the emissions it releases are not apparent to the average person. But it’s real nonetheless. And, as I mentioned earlier when I cited the 2006 U.N. report, the level of these emissions is considerably higher than that released by the automobile.
Toward the bottom of “planet-saving” suggestions, eating locally may sometimes be mentioned. And maybe switching to more plant-based options will round out the list. Maybe. But is the weighting of these suggestions reflective of the biggest environmental offenders?
We all have to eat, and making wise food choices can have a more significant impact on environmental preservation than eliminating driving altogether.
|
Difference in emissions created (equivalent to miles driven) from eating a Standard American Diet compared with Whole Foods to Thrive suggestions |
|
|
Day |
37.12 miles |
|
Week |
259.84 miles |
|
Month |
1129 miles |
|
Year |
13,549 miles |
In just one day, anyone who switched from the Standard American Diet to Whole Foods to Thrive would conserve the equivalent in emissions of the grams released in driving a little over 37 miles. Just one week of eating the Thrive way rather than the Standard diet would conserve as much CO2e as is released driving 250 miles, the equivalent of traveling by car from Boston to New York City.
Spanning a year, the CO2e savings would equal the grams emitted in driving from Los Angeles to New York City four-and-a-half times.
Since the average distance driven by each American is 12,500 miles per year,9 switching from a Standard American Diet to a Whole Foods to Thrive way of eating would prevent more CO2-equivalent emissions from entering the atmosphere than would abstaining from driving altogether.
Therefore, an average American can do more to mitigate climate change by changing what he or she eats than by completely cutting out driving.
And as for the “healthy” American diet?
Aware of the immense amount of methane and nitrous oxide that raising ruminants, such as cows and sheep, produces, some looking to reduce their carbon footprint are turning to meat from other animals. As you can see from the “healthy” American meal plan, it contains no meat from ruminants, yet its production still releases 338 percent more CO2e than the suggested plant-based Whole Foods to Thrive meal plan. The environmental culprits in the “healthy” American meal plan? Fish, chicken, and dairy. While emitting less total CO2e than the Standard American Diet, the “healthy” diet’s switch to “white” meat is clearly not the best solution for environmental sustainability. And as mentioned in Chapter 1, such a diet’s micronutrient level is considerably lower than we can obtain directly from plants.