Douglas C. Tkachuk MD, FRCPC
Jan V. Hirschmann MD
Examination of the Peripheral Blood
Slide Preparation and Staining
Preparations for examining peripheral blood can employ either cover slips or slides. With the former, a drop of blood is placed on a cover slip and a second one is set over the first. Sliding the two apart creates smears on both, which can then be stained and mounted on slides. For preparations using slides, a drop of blood is put near the end of one slide, and a second slide (the spreader) is placed at a 30- to 45-degree angle medial to the blood. The spreader is pulled back into the blood, allowing it to extend along the slide's edge. The spreader is then rapidly pushed forward to produce the smear. Machines also can prepare blood films, either using a similar spreading procedure or by spinning a slide with a drop of blood on it, using centrifugal force to spread the blood across the glass.
The dyes used for blood smears contain a mixture of eosin and methylene blue that Romanowsky, a Russian protozoologist, first employed in 1890 to see malaria parasites. Subsequent modifications are May-Grünwald-Giemsa and Wright stains, the former commonly used in Europe, the latter in North America. Both contain eosin and methylene azures, which are derivatives of methylene blue. Eosin is acidic and gives a red to orange color to the alkaline components of cells, such as hemoglobin and the granules of eosinophils, which contain an alkaline spermine derivative. The alkaline methylene azures give a blue to bluish-purple color to the acidic cellular elements, including the nucleic acids (DNA, RNA), nucleoproteins, and the granules of basophils, which contain the acid heparin.
Slide Examination
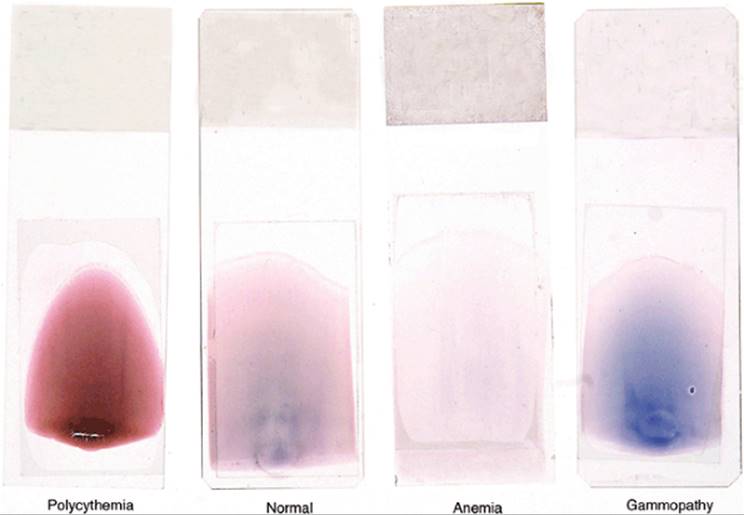
Properly stained slides are usually pink. Bluish discoloration can arise from too thick a smear, an overly lengthy staining time, or excessively alkaline buffer in the dyes. The slide also may be blue because the blood contains excessive amounts of plasma proteins in such diseases as multiple myeloma.
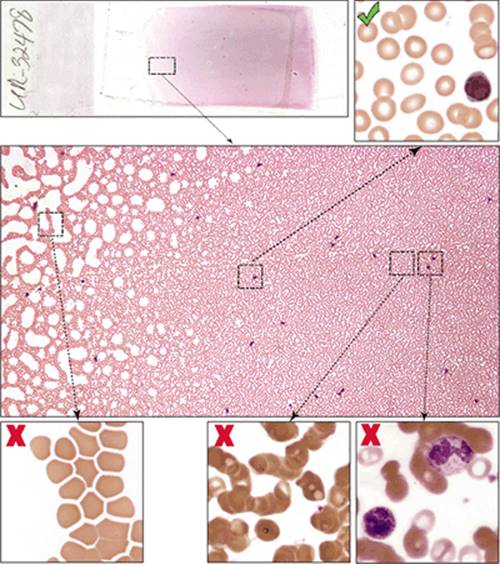
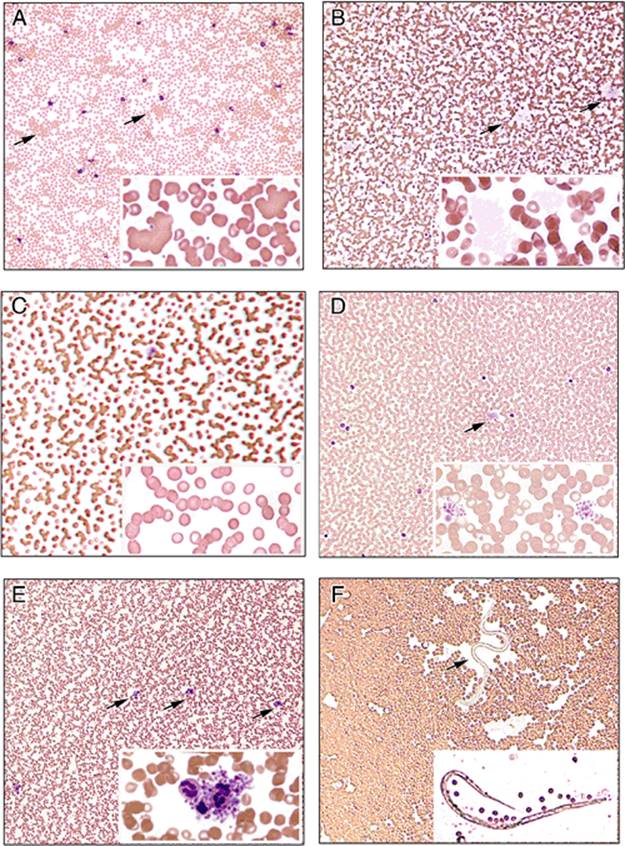
Microscopic examination should begin at low power (×10 or ×20 objective) to determine the adequacy of staining; to detect abnormalities in cell number, type, or aggregation; and to find the optimal area to examine platelets, red cells, granulocytes, and lymphoid cells. For red cells, the best location occurs where the erythrocytes are in a single layer, close to one another, but not overlapping. White cells often are seen best in the thicker portions of the slide. A view at higher power (×40 to ×50 objective) allows an assessment of cell size and number and a closer examination of the individual elements. Oil immersion lenses (×50 and ×100) provide greater magnification to see finer objects, such as cytoplasmic granules, cellular inclusions, and chromatin patterns in the nucleus.
Examination of the Bone Marrow Aspirate Smear and the Clot Section
Slide Preparation and Staining
The technique used to prepare slides from bone marrow aspirates is similar to that used for making blood films and should result in well-separated spicules of marrow at one end of the slide (see Fig. 8.15). Care should be taken to ensure that bone marrow spicules are present in the drop of marrow fluid applied to the slide. Another method, the “pull” technique, is used to prepare crush (or squash) preparations that result in marrow spicules being concentrated in the central area of the slide. This facilitates accurate differential marrow cell counts and the appreciation of megakaryocyte numbers. After spreading, the aspirate smears are allowed to air dry; this is followed by fixation in methanol and then staining, either manually or automatically using a dipping-style slide stainer, with May-Grünwald-Giemsa or Wright stains.
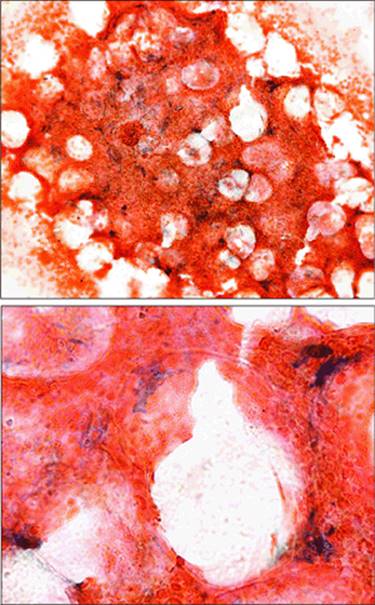
The three most common histochemical stains used to evaluate aspirates in the hematology lab are Prussian blue (Perl) for iron stores and the myeloperoxidase (MPO) and nonspecific esterases (αnaphthyl butyrate or acetate) to evaluate the myeloid and monocytic lineages, respectively. Occasionally, other histochemical stains can be performed on aspirates including Sudan black as an alternative to MPO, toluidine blue to accentuate the metachromatic staining properties of granules in mast cells and basophils, and periodic acid-Schiff (PAS) to assess immature erythroid and T-cell precursors. On occasion, particularly when neither flow cytometry nor biopsy sections are available, selective immunohistochemistry or immunofluorescence panels can be performed on aspirate smears. Immunostains performed on aspirate smears, particularly for cell surface markers, often are difficult to interpret due to excessive nonspecific background staining. In addition, interphase fluorescent insitu hybridization (FISH) for diagnostic chromosomal abnormalities, polymerase chain reaction (PCR) for assaying clonal B- and T-cell populations, and reverse transcriptase PCR (RTPCR) for detecting oncogenic fusion transcripts can be performed on aspi-rate smears for both diagnostic and minimal residual disease detection.
Slide Examination
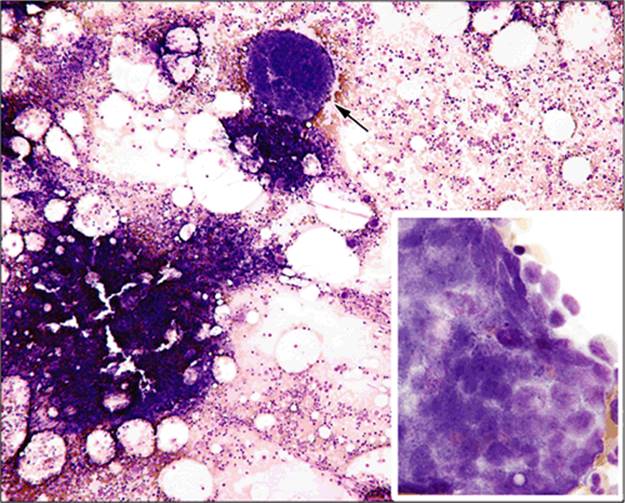
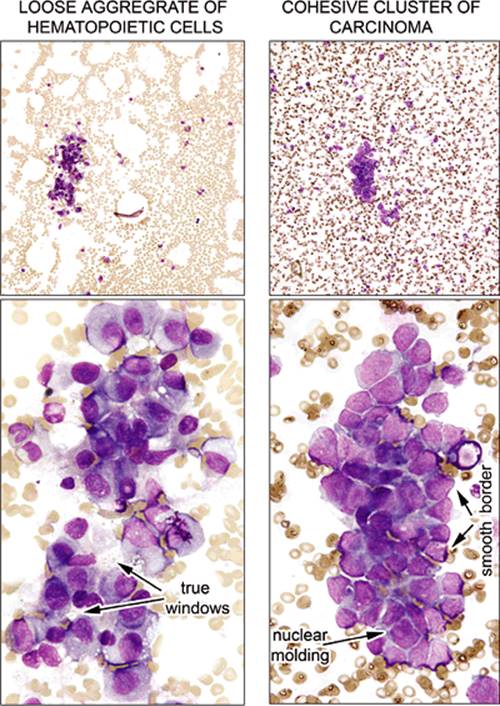
Aspirate smears are first evaluated at low magnification using a 5× or 10× objective lens to ensure the sample contains spicules and is representative of the marrow cavity. Examination should be directed to areas near spicules containing intact marrow cells devoid of cytoplasmic stripping and excessive air-drying artifact (see Fig. 8.16). Abnormal cellular aggregates (e.g., clumps of metastatic cancer cells), and numbers of megakaryocytes are also best appreciated at low power (see Fig. 8.17). In normal aspirates, segmented granulocytes should be the predominant cell type seen at medium power (×20 to ×40) and an attempt to approximate the relative ratio of myeloid to erythroid cells (the M:E ratio) should be assessed at this magnification. Abnormal granulocytic and mononuclear patterns are best appreciated during low- to medium-power examinations of aspirates (see Figs. 8.21 and 8.22). At higher magnifications, using either high dry (60×) or oil immersion (100×) objective lenses, each of the major three hematopoietic lineages (megakaryocytes, myeloid, and erythroid) should be examined cytologically. Plasma cells, lymphocytes, and abnormal cells, including blasts, other immature precursors, and non-hematolymphoid cells, should be enumerated.
Clotted bone marrow left over from aspirate smears can be fixed in formalin with or without mercury chloride (B5) and further processed (embedded in paraffin and stained with hematoxylin and eosin [H&E]) on an automated tissue processor. These “clot sections” can be valuable complements to aspirate smears from which cellularity and the relative cytologic composition of the bone marrow cavity can be readily evaluated (see Figs. 8.46 and 8.47). If necessary, immunohistochemical studies also can be performed on clot sections. In certain situations, such as the frequent marrow sampling required as part of treatment-monitoring protocols in certain hematologic diseases (e.g., acute leukemia and chronic myelogenous leukemia [CML]), clot sections suffice as alternatives to biopsies.
Examination of the Bone Marrow Biopsy and the Touch Prep
Slide Preparation and Staining
Apart from a decalcification step, bone marrow core biopsies are prepared as are most other surgical biopsy specimens, using an automated tissue processor. The latter includes formalin fixation, paraffin embedding, and cutting 3- to 5-micron sections for H&E staining on glass slides. Special stains routinely used for interpreting the biopsy are Gomori's silver stain for reticulin, trichrome stain for collagen, and various immunohistochemical panels used to determine lineage-specific antigen expression on cells.
Slide Examination
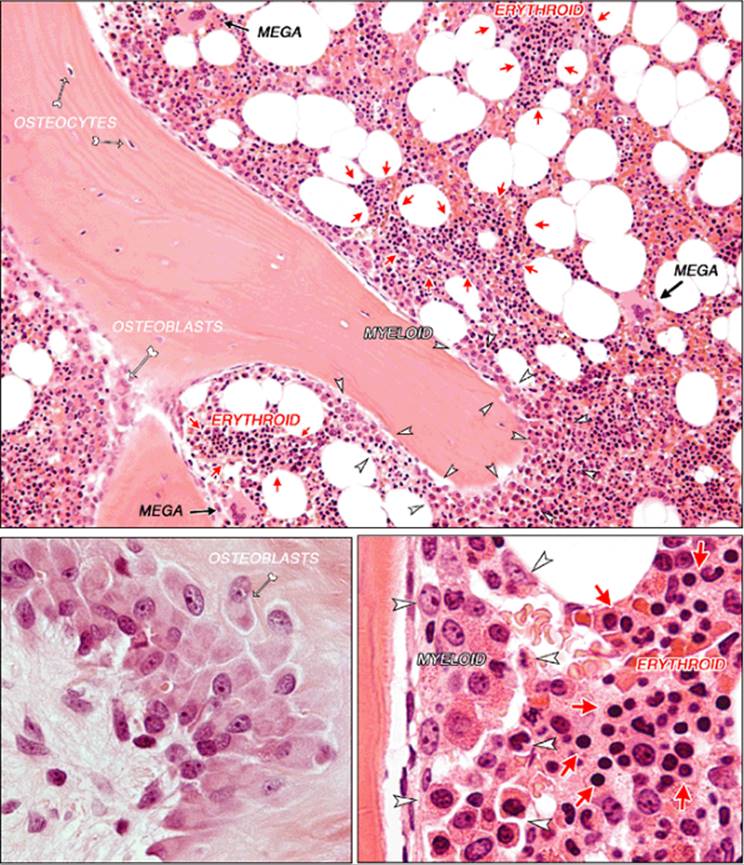
A systematic approach should be employed in the morphologic interpretation of all hematopoietic tissues, and the core biopsy is no exception. At low power, the length of biopsy specimen should be recorded, and any distortion of overall cellular architecture (e.g., metastases, necrosis, fibrosis, granulomas, lymphoid nodules) or abnormalities in the bony trabeculae noted. At medium magnification, the relative ratio of myeloid to erythroid cells is best appreciated, as well as megakaryocyte numbers. Myeloid maturation is assessed at high power by comparing the relative number of cells with round nuclei (blasts, promyelocytes, and myelocytes) to those with segmented nuclei (metamyelocytes, bands, and neutrophils). Maturation in the erythroid line is estimated by comparing the proportion of larger erythroid cells with open chromatin and distinctly round, smooth nuclear contours (immature precursors) to the smaller forms with closed nuclei (mature precursors). Small mature lymphocytes are slightly larger than mature erythroids, have closed chromatin patterns, and typically display slightly irregular nuclear contours.
Bone marrow touch preps (imprints) should be made routinely from core biopsy specimens. Using forceps, the fresh core biopsy is gently pressed three or four times against a glass slide, allowed to air dry, and then fixed and stained similarly to blood and aspirate smears. Touch preps are sometimes useful as a “quick look” alternative to the biopsy that can, especially if aspirates do not contain mar-row (dry tap), give clues to the identity of the prominent cell type in marrow specimens (see Figs. 8.48 and 8.49).
|
Table 8.1 Hematology reference values in normal adults |
|||||||||||||||||||||||||||||||||||||||||||||||||||||||||||||||||||||
|
|||||||||||||||||||||||||||||||||||||||||||||||||||||||||||||||||||||
|
Table 8.2 Red blood cell values at various ages:Mean and lower limit of normal (-2 SD) |
|||||||||||||||||||||||||||||||||||||||||||||||||||||||||||||||||||||||||||||||||||||||||||||||||||||||||||||||||||||||||||||||||||||||||||||||||||||||||||||||||||||||||||||||||||||||||||||||||||||||||||||||||||||||||||||||||||||||||||||||||||||||
|
|||||||||||||||||||||||||||||||||||||||||||||||||||||||||||||||||||||||||||||||||||||||||||||||||||||||||||||||||||||||||||||||||||||||||||||||||||||||||||||||||||||||||||||||||||||||||||||||||||||||||||||||||||||||||||||||||||||||||||||||||||||||
|
Table 8.3 Differential counts from bone marrow aspirates from 12 healthy men |
||||||||||||||||||||||||||||||||||||||||||||||||||||||||||||||||||||||||||||||||||||||||||||||||||||||||
|
||||||||||||||||||||||||||||||||||||||||||||||||||||||||||||||||||||||||||||||||||||||||||||||||||||||||
|
|
|
Figure 8.1. Macroscopic appearance of blood films. The color of blood smears can reflect severe underlying abnormalities in hematocrit and the presence of abnormal circulating immunoglobins. The smear on the left, from a patient with polycythemia vera and a hemoglobin of 20 g/dL, appears noticeably darker than the normal (hemoglobin 14 g/dL) and pale anemic sample (hemoglobin 7). The blood film on the right, from a case of myeloma, is blue because circulating monoclonal immunoglobins take up the basophilic stains used in blood smears. |
|
|
|
Figure 8.2. Microscopic approach to blood films. Selecting the correct area to examine is essential in properly assessing blood films. Regions where red blood cells are well-spaced and almost touch each other are optimal for examining erythrocytes (right upper panel). Erythrocytes, when examined too closely to the edge of the slide, appear misshapen and falsely hyperchromic (left lower panel), whereas those too distant often appear shrunken and aggregated (right lower panels). |
|
|
|
Figure 8.3. Examining blood films at low magnification. Abnormal aggregates, precipitated proteins, and parasites are best seen by examining large areas of the smear at low-power magnification. Shown here are RBC aggregation from cold agglutinins (A), precipitates of cryoglobulins (B), rouleaux formation from serum monoclonal gammopathy (C), platelet aggregation (D), platelet and leukocyte aggregates (E), and infection of the blood with microfilaria (F). |
|
|
|
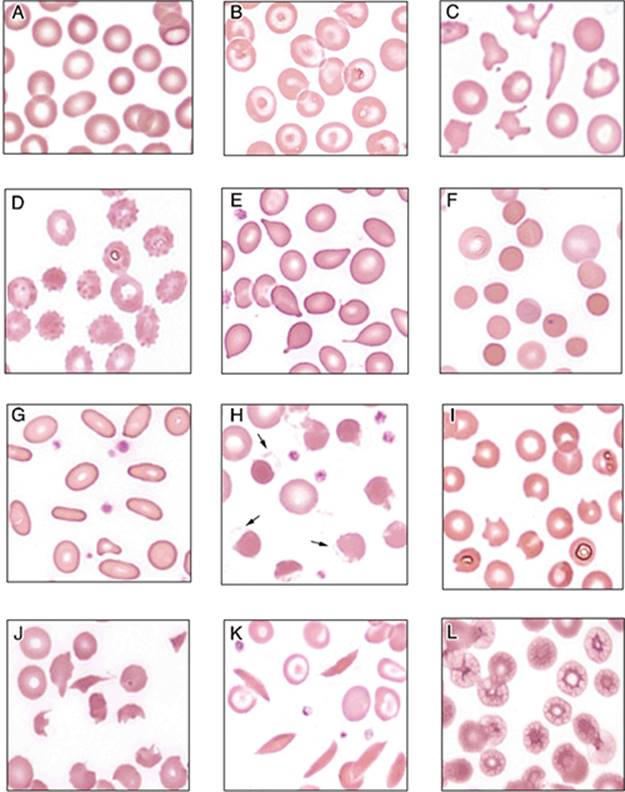
Figure 8.4. Red blood cell morphology: Abnormally shaped forms (poikilocytes). Normal red blood cells (A) and various abnormal forms are shown, including: targets (B), spur cells (acanthocytes) (C), burr cells (echinocytes) (D), teardrops (dacrocytes) (E), spherocytes (F), ovalocytes (G), blister cells (arrows, H), bite cells (I), schistocytes (J), sickle cells (K), and erythrocytes displaying dehydration artifact (L). |
|
|
|
Figure 8.5. Red blood cell morphology: Abnormal inclusions. Howell-Jolly bodies (A), nucleated red blood cell precursors (B), Pappenheimer bodies (C), trophozoites of Plasmodium vivax (D), coarse basophilic stippling in a case of lead poisoning (E), and crystal violet supravital stain demonstrating Heinz-body inclusions in a patient who has undergone a splenectomy (F). |
|
|
|
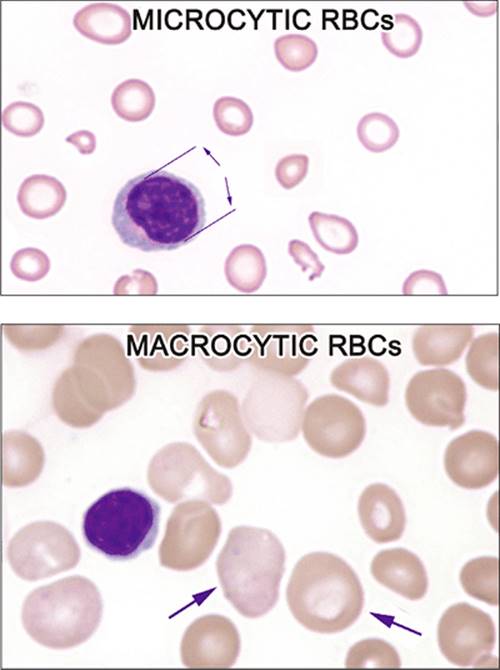
Figure 8.6. Red blood cell morphology: Size. Red blood cell size is best measured by automated hematology analyzers, but severe size differences can be estimated by comparing the diameters of red cells to those of lymphocyte nuclei. Normal erythrocytes are approximately the same size as the nuclei of small lymphocytes. The top panel shows numerous microcytic red cells that are significantly smaller than the diameter of the lymphocyte nuclei. The bottom panel demonstrates two macrocytic red cells, the one on the left a polychromatophilic RBC (arrows). |
|
|
|
Figure 8.7. Lymphocyte and large granular lymphocyte (LGL) morphology. Normal small circulating lymphocytes are usually 10 to 15 microns in size (slightly bigger than normal red blood cells) and typically have high nuclear:cytoplasmic (N:C) ratios, with scant amounts of slightly basophilic staining cytoplasm. Lymphocyte nuclei are usually smoothly contoured with a mature (or “closed”) chromatin pattern and absent nucleoli. The appearance of large granular lymphocytes (LGLs) is some-what more variable, but they generally have moderate N:C ratios and neutral-staining cytoplasm that often contains purplish granules. The chromatin of LGLs is often slightly more “open” than that of small lymphocytes. |
|
|
|
Figure 8.8. Morphology of the small neoplastic lymphoid disorders: Chronic lymphocytic leukemia (CLL) and acute lymphoid leukemia (ALL). Two common neoplastic conditions featuring small, neoplastic lymphoid cells are CLL and ALL (middle and bottom panels, respectively). The designation “ALL” includes both precursor B- and T-lymphoblastic leukemia. CLL cells are variable in appearance and typically look very much like slightly larger versions of normal small lymphocytes. CLL cells can display clumped or “soccer ball” chromatin. The L1 type of lymphoblast shown here usually has a high nuclear:cytoplasmic (N:C) ratio with an immature or “open” chromatin. |
|
|
|
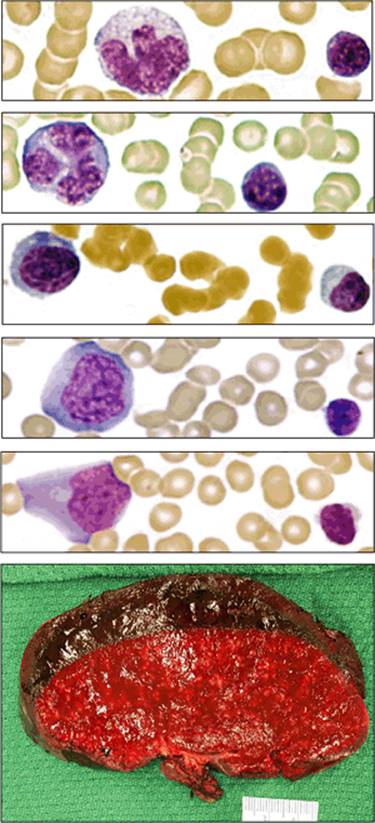
Figure 8.9. “Atypical” lymphocyte morphology, infectious mononucleosis. When referring to circulating lymphocytes, “atypical” is a confusing term that generally denotes benignity, despite the pleomorphic appearance of the cells. Characteristic features include large size, abundant basophilic cytoplasm that is often vacuolated, nucleoli, diffuse or partially condensed chromatin, and large, often irregularly shaped nuclei. The top five panels are from different cases of infectious mononucleosis showing the variable appearance of the atypical lymphocytes seen with this particular disease. For comparison, normal lymphocytes are shown on the right side of each panel. |
|
|
|
Figure 8.10. Small and large neoplastic lymphoid disorders. Peripheral blood smears from various lymphoproliferative disorders that feature primarily small and large cells are shown in the top and bottom panel sets, respectively: CLL, chronic lymphocytic leukemia/lymphoma; HCL, hairy cell leukemia; SMZL, splenic marginal zone lymphoma; NK, NK leukemia; FL, peripheralized follicular lymphoma; PCL, plasma cell leukemia; ALL(L1), acute lymphoblastic leukemia with L1 type blasts; ALL(L2), acute lymphoblastic leukemia with L2 type blasts; BL, Burkitt lymphoma/leukemia with L3 type blasts; PLL, prolymphocytic leukemia; LBCL, peripheralized large B-cell lymphoma; and ATLL, adult T-cell lymphoma/leukemia. |
|
|
|
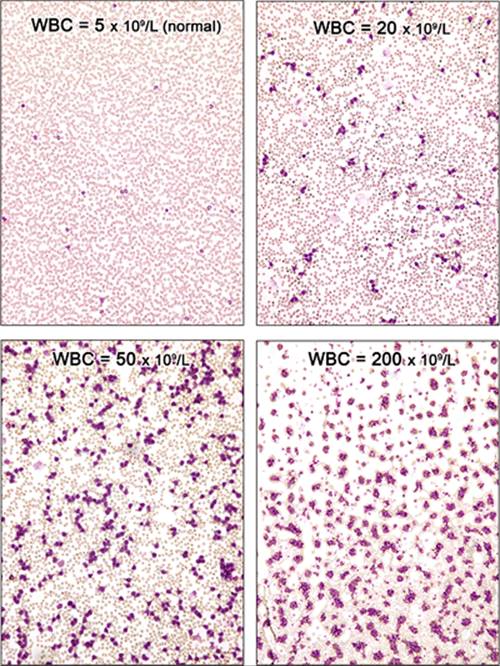
Figure 8.11. Leukocyte morphology: Low-power morphology. Leukocytes are best counted by automated hematology analyzers, but an approximate estimate of white cell numbers (the “leukocrit”) can be done during examination at low magnification by comparing the ratio of white cells to erythrocytes (normal is approximately 1 to 500). |
|
|
|
Figure 8.12. Granulocyte morphology: Cytoplasmic features. A: Band showing “toxic changes,” including increased cytoplasmic granulation and numerous bluish Döhle bodies. B: Circulating band ingesting a budding-yeast (Candida albicans). C: Monocyte showing “toxic changes,” including cytoplasmic granulation and vacuolization. D: May-Hegglin anomaly with large Döhle-like inclusions and giant platelets. E: Neutrophil ingesting bacteria in a case of sepsis from Clostridium perfringens. (Courtesy Dr. I. Quirt.) F: A dysplastic hypogranular neutrophil lacking cytoplasmic granulation (arrow) and a normal neutrophil. |
|
|
|
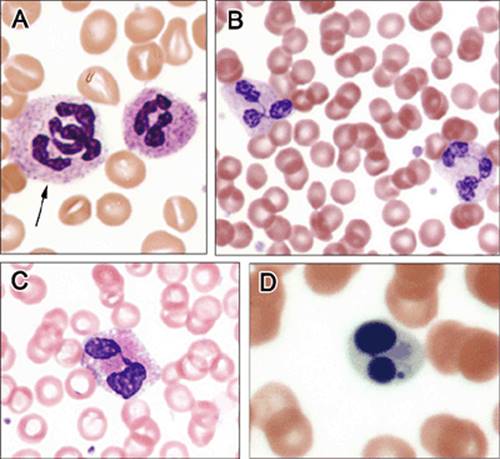
Figure 8.13. Granulocyte morphology: Nuclear features. A: Giant hypersegmented neutrophil (arrow) from a case of vitamin B12 deficiency. B: Hypersegmented neutrophils from antifolate chemotherapy. C: Dysplastic neutrophil (pseudopelgeroid cell) in case of myelodysplastic syndrome. This neutrophil, which has two lobes connected by a thin filament, resembles the neutrophils in the hereditary abnormality called Pelger-Huet anomaly. D: Degenerating neutrophil. |
|
|
|
Figure 8.14. Platelet abnormalities. A through C, Thrombocythemia and thrombocytopenia. A: Increased numbers of platelets in a case of essential thrombocythemia with a platelet count of 500 109/L (normal range is between 150 and 400 109/L). Platelet numbers are best measured using automated hematology analyzers, but estimates can be made microscopically by assuming that 7 to 20 platelets per oil immersion field represent a normal platelet count. B and C: Platelet satellitism and aggregation, respectively, from EDTA exposure in blood collection tubes. This phenomenon often leads to falsely low measurements of platelet numbers by automated hematology analyzers and can be avoided by using heparin or citrate as anticoagulants in collection tubes. D through I: Abnormal platelet morphology. D: Giant platelets in primary myelofibrosis, cellular phase. E: Bizarre platelets in essential thrombocythemia. F: Giant platelets and a megakaryoblast in acute megakaryoblastic leukemia. G: Stripped megakaryocytic nucleus. H: Bernard-Soulier syndrome. This congenital bleeding disorder is characterized by thrombocytopenia and large platelets. (Courtesy Dr. M. Abdelhaleem.) I: May-Hegglin anomaly. Large Döhle-like inclusions (arrow) and giant platelets are illustrated here (see also Fig. 8.12). |
|
|
|
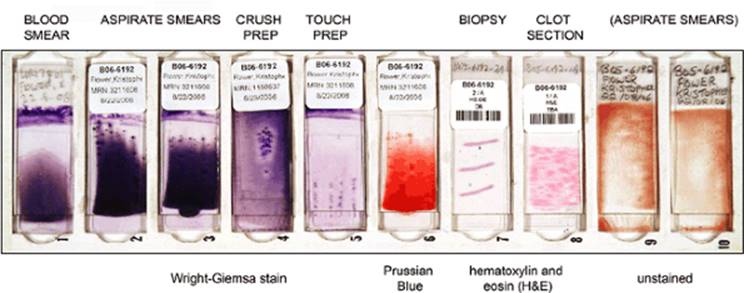
Figure 8.15. Bone marrow staining and special studies. Bone marrow samples are routinely sent for Wright-Giemsa staining of the aspirate smears and touch preparations (“touch preps”); hematoxylin and eosin (H&E) staining is used for the clot and biopsy specimens. Depending on the indication for the marrow sampling, specimens also can be sent for flow cytometry, fluorescence-in situ-hybridization (FISH), molecular assays, and cytogenetic testing. Additionally, Prussian blue staining for iron studies, reticulin stains, immunohistochemistry, various histochemical stains (e.g., esterase, myeloperoxidase), special stains for fungi and acid-fast bacilli, and bacterial cultures can be ordered as appropriate for each particular patient. This figure shows a typical tray of slides for interpretation of a bone marrow sample (from left to right): Peripheral blood film, two marrow aspirate smears (“push” technique), a crush preparation of marrow aspirate smear (“pull” technique), touch or imprint preparation, marrow aspirate smear stained for iron, core biopsy, clot section, and two unstained aspirate smears. |
P.295
|
|
|
Figure 8.16. Microscopic approach to aspirate smears. A through C: Selecting the correct area to examine is essential in assessing marrow smears properly. The best regions are near particles (arrows) containing well-preserved clusters of cells that represent the actual cellular content of the marrow cavity. Areas of the aspirate where marrow cells are well-spaced and almost touch each other are optimal (right side of lower panel). One should avoid trying to evaluate areas where the cells are stripped of cytoplasm and/or display excessive air-dry artifact (left side of lower panel). |
|
|
|
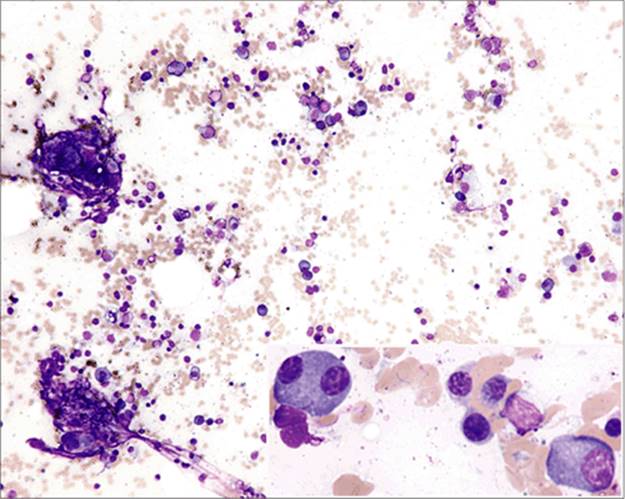
Figure 8.17. Assessing megakaryocytes in the aspirate smear. Megakaryocytes are relatively rare in normal bone marrow specimens, representing approximately 1% of all nucleated cells. To assess megakaryocytes adequately, careful examination at low magnification is necessary. Megakaryocytes are the largest cells in the marrow (at least twice as large as a promyelocyte) and typically have polyploid nuclei. |
|
|
|
Figure 8.18. Morphology of the megakaryocyte. A through D: Variations of normal megakaryocytes. A normal megakaryocyte with multiple contiguous nuclear lobes (A), a “mature” megakaryocyte from a case of essential thrombocythemia with prominent nuclear lobulations (B), an example of emperipolesis (the presence of an intact cell within a megakaryocyte) (C), and a stripped megakaryocyte nucleus (arrow, D). E through G: Dysplastic megakaryocytes. A megakaryoblast (E), a micromegakaryocyte with a unilobular nucleus (F), and a megakaryocyte with separated nuclear lobulations (G). |
|
|
|
Figure 8.19. Histiocytes in the aspirate smears. A: An occasional histiocyte with tingible (stained) bodies is not an unusual finding in the aspirate smear. Often the engulfed material can be shown with appropriate stains to represent siderotic granules in patients with excess iron stores. B and C: Infectious-related histiocytosis. Granulomatous inflammation with clusters of histiocytes admixed with lymphocytes in a case of tuberculosis (B), amastigotes in a marrow histiocyte from a case of visceral leishmaniasis (C), and a fatal case of Epstein-Barr virus–associated hemophagocytic syndrome (D). E and F: Marrow histiocytosis associated with hematopoietic malignancies. Sea-blue histiocytes of chronic myelogenous leukemia (E) and hemophagocytosis (arrow) associated with a case of T-cell lymphoproliferative disorder involving the bone marrow (F). |
|
|
|
Figure 8.20. Bone cells in aspirate smears. A and B: Clusters of osteoblasts with the characteristic extruding or “pouting” nuclei (arrows). C: Plasma cells, shown here for comparison, are smaller than osteoblasts and do not have extruding nuclei. D and E: Osteoclasts with numerous well-separated and uniformly sized nuclei resembling “pennies on a plate.” (Courtesy Dr. J. Lazarchick.) F: Megakaryocytes, one shown here for comparison, have variably sized nuclei with contiguous lobulations. |
|
|
|
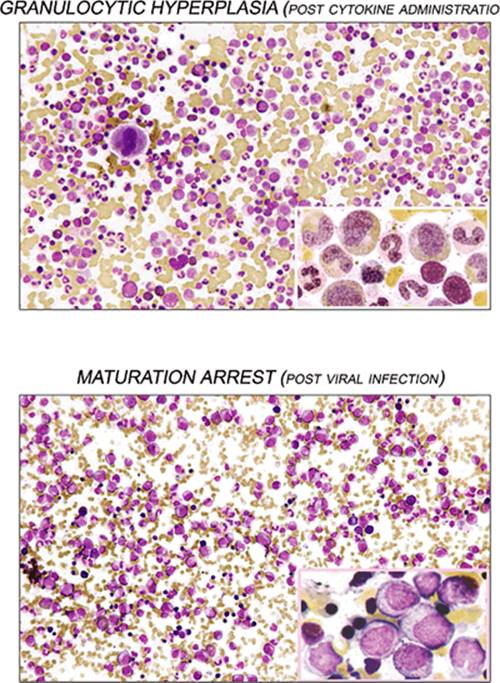
Figure 8.21. “Granulocytic pattern” in aspirate smear. Diverse etiologies may give similar morphologic findings, and clinical correlation often is necessary to elucidate the proper pathologic diagnosis. Both aspirates show predominant numbers of immature granulocytic precursors. |
|
|
|
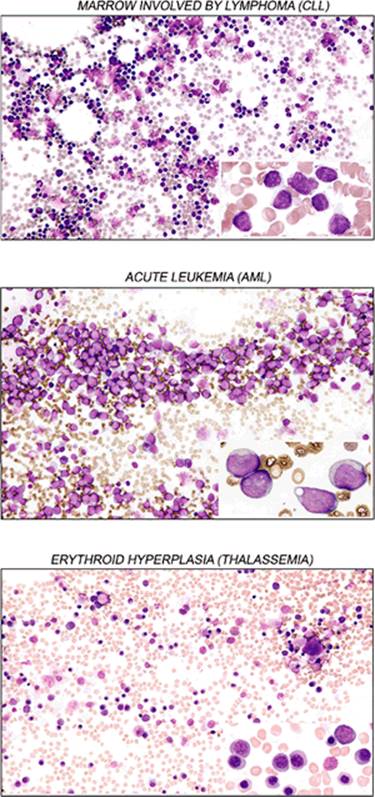
Figure 8.22. “Mononuclear pattern” in aspirate smear. The most common cells in the marrow are segmented granulocytic precursors and, at low-power magnification, these should predominate. The top two panels demonstrate a mononuclear pattern composed mostly of a monotonous cell population (mature lymphoid and primitive hematopoietic, upper and middle panels, respectively) that is best appreciated at low magnification. The lower panel consists mainly of a heterogeneous population of mononuclear cells, in this particular case, of mature erythroid origin. |
|
|
|
Figure 8.23. Aplastic aspirate. When viewing supposedly aplastic aspirate smears it is important to evaluate whether the sample is representative. The presence of marrow particles and some evidence of hematopoiesis ensure the aspirates are from the marrow cavity and not merely peripheral blood. Plasma cells and lymphocytes often appear disproportionately increased in aplastic smears from diverse etiologies, and the examiner should be cautious in diagnosing myeloma or lymphoproliferative disorders in this setting. |
|
|
|
Figure 8.24. Morphology of granulocytic precursors in marrow. In this composite figure, the spectrum of immature to mature myeloid precursors is designated by a series of lengthening arrows. |
|
|
|
Figure 8.25. Morphology of erythroid precursors in marrow. In this composite figure, the spectrum of immature to mature erythroid precursors is designated by a series of lengthening arrows. |
|
|
|
Figure 8.26. Mast cells. Normally, mast cells constitute less than 1% of all the nucleated marrow cells. They often are enmeshed in the stroma of marrow particles, making them difficult to appreciate in standard aspirate preparations. The top panel is a smear stained with toluidine blue that shows normal numbers of mast cells in this rather large marrow particle. They display metachromatic staining, in which the color of the cell components is different from that of the dye used. The bottom panel, from a case of systemic mastocytosis, illustrates a Wright-Giemsa–stained aspirate demonstrating numerous heavily granulated mast cells. |
|
|
|
Figure 8.27. Prussian blue iron stains. Staining the bone marrow for iron is the gold standard for assessing body iron stores. Individual histiocytes scattered throughout the aspirate smear show the normal pattern of fine granular blue staining for iron (see also Fig. 1.9). |
|
|
|
Figure 8.28. Metastatic breast carcinoma. This aspirate smear shows a large, thick cohesive cluster of malignant cells with smooth borders. Examination at higher power reveals poorly preserved, large collections of highly atypical cells. This cluster was the only evidence of metastatic malignancy in all six aspirate smears evaluated in this particular case. |
|
|
|
Figure 8.29. Hematopoietic verses nonhematopoietic cells in aspirate smear. Tight clusters of degenerating large cells in aspirate smears strongly suggest marrow involvement by extrinsic neoplasms that are neither lymphoid nor hematopoietic in origin. Morphologic differences between collections of hematopoietic cells and cohesive clumps of nonhematopoietic cancer cells are illustrated here, with examples of acute monocytic leukemia and metastatic small cell carcinoma of the lung (left and right panels, respectively). |
|
|
|
Figure 8.30. Anatomy of the bone marrow. This composite figure shows the relationships between the skeletal anatomy of the bone marrow biopsy site and the microscopic features of biopsy interpretation. |
|
|
|
Figure 8.31. Microanatomy of the bone marrow biopsy. The three major hematopoietic lineages of the marrow—megakaryocytic (MEGA, black arrows), myeloid (white arrows), and erythroid (red arrows)—all tend to cluster together and are recognizable in biopsy specimens. The myeloid series tend to collect near bony trabeculae and perivascular spaces. |
|
|
|
Figure 8.32. Megakaryocytes. Increases in megakaryocyte can be best appreciated using low and medium magnification of the core biopsy. Architectural distortion (swirling and lining up of individual marrow cells) consistent with significant marrow fibrosis is present in the bottom panels. |
|
|
|
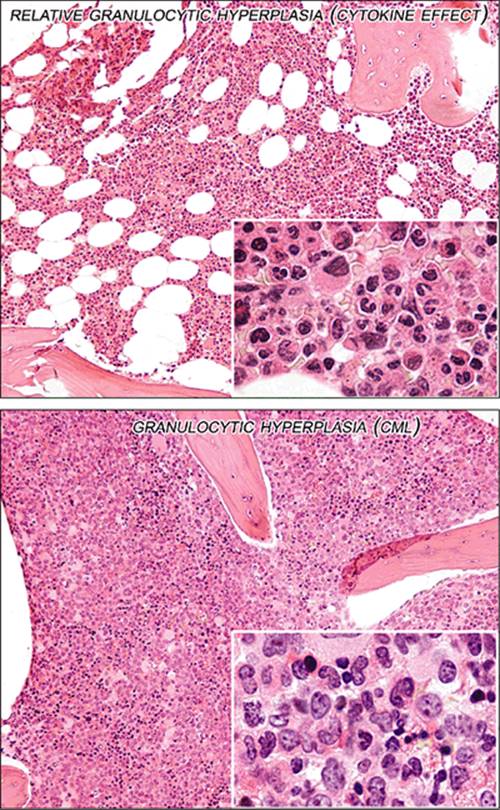
Figure 8.33. “Granulocytic pattern” in biopsy. Relative and absolute increases in granulocytic precursors are readily seen in the top and lower figures, respectively. |
|
|
|
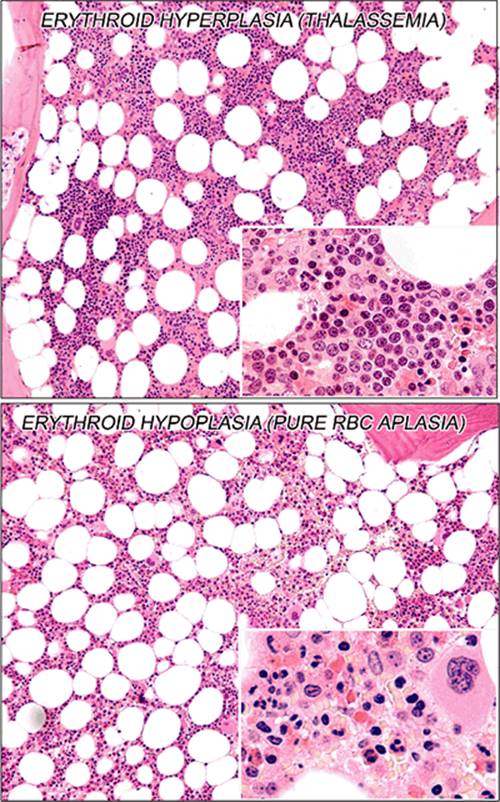
Figure 8.34. Erythropoiesis in biopsy. An absolute increase in erythroid precursors that results in a “mononuclear pattern” is shown in the top panel. The bottom panel shows a severe decrease in ery-throid precursors giving the biopsy a “granulocytic” appearance. Increased and decreased erythropoiesis is apparent in these two biopsy specimens. |
|
|
|
Figure 8.35. Hyperplastic patterns in biopsy. Two hyperplastic marrow specimens are illustrated here. One contains a heterogeneous mixture of mature hematopoietic precursors typical of the myeloproliferative syndromes (top panel). The bottom panel shows the expansion of a homogenous population of immature hematopoietic cells characteristic of acute leukemia. |
|
|
|
Figure 8.36. Hypoplastic patterns in biopsy. This biopsy from a case of aplastic anemia shows pro-found hypocellularity and virtually no evidence of hematopoiesis. The differential diagnosis of a bone marrow biopsy almost devoid of hematopoiesis includes congenital and idiopathic causes of aplastic anemia, hypocellular myelodysplastic syndromes, and paroxysmal nocturnal hemoglobinuria. Plasma cells and mast cells often appear disproportionally increased in hypoplastic specimens. |
|
|
|
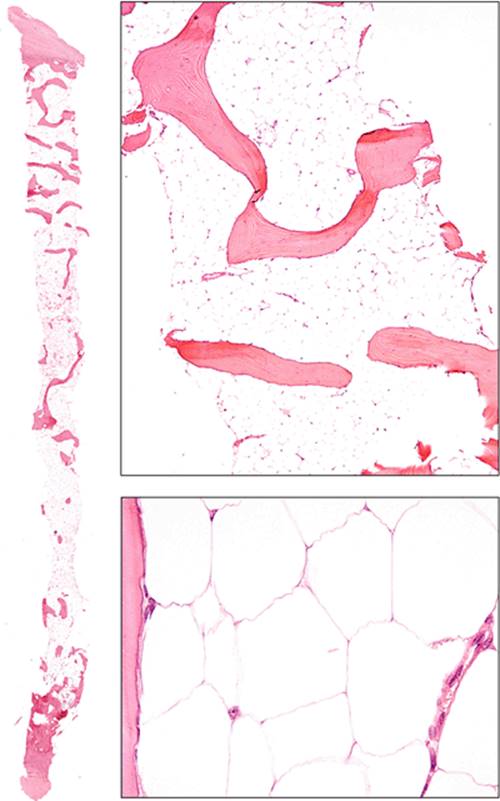
Figure 8.37. Serous atrophy. In this condition, an amorphous gelatinous ground substance replaces fat and hematopoietic cells. Causes include chronic systemic dysfunctions, such as HIV and malnutrition. |
|
|
|
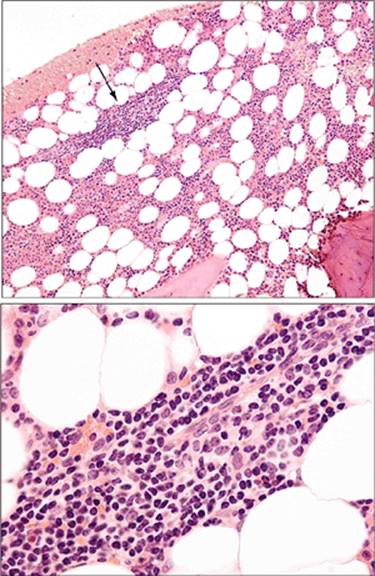
Figure 8.38. Lymphoid aggregates of the bone marrow. Benign lymphoid nodules of the bone marrow increase with age and are more frequent in women and patients with autoimmune diseases. Benign nodules usually consist mostly of small mature lymphocytes with smooth nuclear contours that are well-demarcated, small in size, and few in number. Other benign features include perivascular location and lack of significant CD10+ cells. This is an example of a small perivascular lymphoid nodule (arrow). |
|
|
|
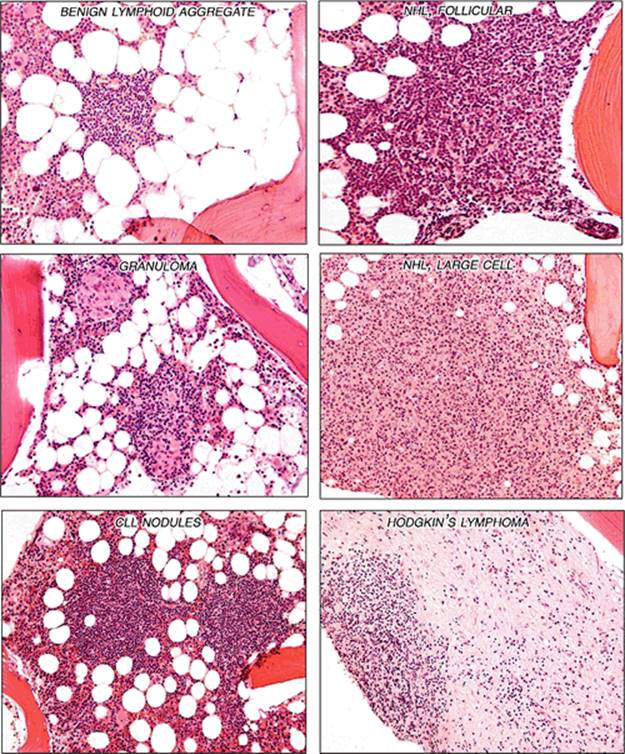
Figure 8.39. Benign and malignant lymphoid nodules. These biopsies show a benign lymphoid nodule, two incidental granulomas, nodular involvement of the marrow by chronic lymphocytic leukemia (CLL), follicular lymphoma, diffuse large B-cell lymphoma, and Hodgkin lymphoma. |
|
|
|
Figure 8.40. Bone marrow granulomas. This biopsy shows two discrete noncaseating granulomas from a patient with sarcoidosis. Other causes of bone marrow granulomas include lymphoid and nonlymphoid malignancies, infectious diseases, drugs, foreign bodies, and connective tissue diseases. |
|
|
|
Figure 8.41. Bone marrow fibrosis. Two cases of severe marrow fibrosis are shown here. The top panels are from a case of primary myelofibrosis with spindle-shaped fibroblasts and collagen replacing the entire marrow cavity. Reticulin stains on the right side show an increase in thickened fibers that encircle individual marrow cells. The bottom panel is a case of secondary marrow fibrosis from metastatic breast carcinoma. Note the malignant cells lining up in rows (“Indian filing”) and the swirling patterns between the strands of collagenous fibrosis. |
|
|
|
Figure 8.42. Bony trabeculae patterns in biopsy. Aside from the thickened area immediately subjacent to the cortex, normal bone marrow biopsies (shown here on the left) consist of numerous, thin, bony trabeculae. Various conditions that cause increased bone resorption and formation are associated with irregular and thickened bony trabeculae and include primary and secondary bone disease (renal disease), primary and metastatic bone tumors, non-neoplastic disorders of bone, fracture (and previous biopsy) site repair, infections, circulatory disorders, osteoporosis, osteomalacia, and metabolic disorders (e.g., hyperparathyroidism). The normal biopsy shown here illustrates the thickened paracortical bone that is exaggerated in the tangentially cut specimen. The middle biopsy beneath the irregular pattern label is from a patient with chronic renal disease and secondary hyperparathyroidism; the biopsies on the right are all cases of primary myelofibrosis. |
|
|
|
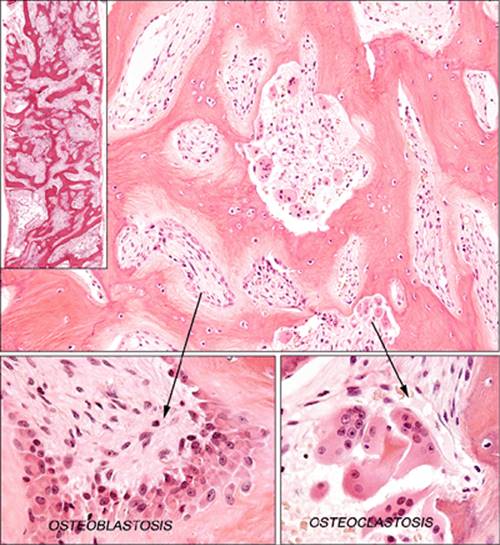
Figure 8.43. Renal osteodystrophy. This biopsy shows thickened and thinned, irregular bony trabeculae with osteoclastosis, osteoblastosis, and evidence of abnormally increased bone turnover. |
|
|
|
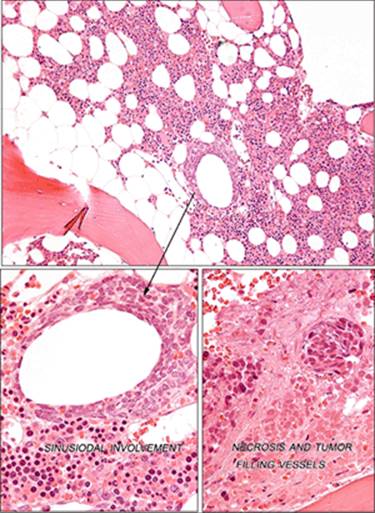
Figure 8.44. Metastatic adenocarcinoma. Malignant gland-forming cells replace the marrow in this case of metastatic prostate adenocarcinoma. Immunostains for prostate-specific antigen (PSA) were positive. Metastatic carcinoma in bone marrow typically forms cohesive rests of cells distributed in a sinusoidal pattern of involvement that may be associated with necrosis. |
|
|
|
Figure 8.45. Bone marrow necrosis. Vessels and sinuses are involved by necrotic tumor metastases in this case of metastatic breast carcinoma. |
|
|
|
Figure 8.46 Clot section. The clot section, much like the biopsy, allows one to assess cellularity, composition, and to some degree, architectural features of the bone marrow. Additionally, immunohistochemical stains can be used on clot sections to further elucidate the lineage of cells. This clot section shows the typical findings in a middle aged adult with a marrow:fat ratio of approximately 1:1 that shows mixed trilineage hematopoiesis. |
|
|
|
Figure 8.47. Estimating cellularity and cellular composition from the clot section. The top panel shows a clot section with granulocytic hyperplasia, and the bottom is a hypoplastic specimen. Clot sections can be valuable alternatives to biopsies. Compared with biopsies, clot sections are less invasive, require little time and few resources to prepare, and often are more amenable to antigen retrieval techniques for immunohistochemistry because decalcification is not required. |
|
|
|
Figure 8.48 Touch preparations (touch or imprint preps). Touch preps offer a “quick look” into what the biopsy will show and sometime give better cytologic detail than the biopsy specimen. On occasion, excessive air-drying artifact and cytoplasmic stripping in touch preps can make cells appear more primitive than they actually are. |
|
|
|
Figure 8.49. Touch preps: A representative cytologic composition of the marrow. The top panel is a touch prep showing a normal mixture of erythroids and maturing myeloid precursors. The bottom panel shows a marrow composed exclusively of a monotonous population of primitive cells in a case of acute myeloid leukemia. |