Kevin Thomas, MD, David J.Wilber, MD, Jeffrey R. Winterfield, MD
CASE PRESENTATION
An 83-year-old woman with a history of coronary artery disease, ischemic cardiomyopathy, atrial fibrillation, diabetes mellitus, and hypertension presented to clinic for evaluation of recurrent ventricular tachycardia (VT). The patient has a biventricular pacing defibrillator (ICD), initially placed for primary prevention 6 years earlier, and there were no detected ventricular arrhythmias until approximately 6 months prior to presenting when she had a first episode of sustained VT, postoperatively after hip surgery. She has since had multiple episodes of VT requiring ICD therapies (both antitachycardia pacing as well as shock) despite treatment with dual antiarrhythmic medications (sotalol and mexiletine). Her past surgical history includes two coronary artery bypass surgeries as well as a bioprosthetic mitral valve replacement. Her echocardiogram revealed an ejection fraction of 20% with basal inferior aneurysm and akinetic inferior and inferolateral walls.
The patient was admitted to the hospital for antiarrhythmic drug washout in preparation for VT ablation. On the evening prior to the scheduled procedure, she had a spontaneous episode of her clinical VT, which was of right bundle morphology with a superior axis and positive concordance across the precordium at a cycle length of 370 ms, which was successfully terminated with internal defibrillation from her ICD.
The following day the patient was brought to the electrophysiology lab. Programmed stimulation was performed to assess electrophysiologic properties of the ventricles and for arrhythmia induction.
Using the CARTO 3-dimensional electroanatomical mapping system (Biosense Webster, Diamond Bar, CA), mapping was performed in the left ventricle both in sinus rhythm and after induction of tachycardia.
BACKGROUND
The mechanism of VT in the presence of coronary artery disease and prior myocardial infarction is reentry within the scar and the border between infarcted and normal tissue (border zone). The surface QRS morphology of the VT is generated by the reentrant wavefront exiting the scar at a distinct site or sites along the border zone and can be used to localize the site of origin.1 Areas within the scar that are critical to the reentrant circuit are marked by channels of slow conduction that are protected by areas of functional or anatomic conduction block.2–4 Isolated and late potentials seen in areas of scar during sinus rhythm indicate the presence of surviving myocyte fiber bundles that are a necessary component of these critical isthmuses.5 Targets for ablation include these critical isthmuses within the scar as well as identified exit sites along the scar border. Identification of these targets rely upon the ability to accurately map (1) areas of scar, dense scar, and border zone, (2) sites within the scar and scar border that have abnormal local electrical activity, and (3) the channels of slow conduction within scar that are participating in the reentrant circuit. This can be performed with a combination of substrate, entrainment, and pace-mapping.
Electroanatomical Mapping
Three-dimensional anatomical mapping has been utilized for over a decade to aid in mapping and ablation of a wide variety of arrhythmias, including VT.6–8 In addition to constructing accurate chamber anatomy and allowing the operator to view real-time catheter position and movement, the ability to display visual representations of myocardial substrate and arrhythmia propagation has revolutionized the way substrate, activation, and entrainment mapping are performed and interpreted. Newer features include the ability to automatically compare and evaluate paced morphologies to a stored template for more accurate pace-mapping.
The CARTO 3-D electroanatomical mapping system utilizes ultra-low intensity magnetic fields emitted from nine coils placed beneath the table. A sensor in the catheter tip senses the strength each of the magnetic fields, which decay as a function of distance from the emitting coil. Using this information, the position of the tip of catheter in space can be triangulated and then visually represented on a computer screen in real time. The ability to know the precise spatial location of the catheter(s) with the CARTO 3-D system has been shown to be associated with reductions in procedure time, fluoroscopy time, and radiofrequency energy delivery time when compared to non–3-dimensional mapping systems as well as other commercially available 3-dimensional mapping systems that utilize a current-based, rather than magnetic-based, localization system.9
DIAGNOSIS
In our patient, programmed stimulation resulted in two distinct hemodynamically stable monomorphic VT (Figure 1-1A and B).

FIGURE 1-1 Monomoprhic VTs induced with programmed stimulation. VT1 (A) and VT2 (B).
• VT1: Induced with triple extrastimuli from right ventricular catheter, had a right bundle, right superior morphology with abrupt loss precordial pattern between V2–V3 and a CL = 430 ms.
• VT2: Right bundle, right inferior with late (V6) precordial transition and a CL = 460 ms. Initially seen after pace termination of VT1 but later was able to be induced with double extrastimuli.
MANAGEMENT
Substrate Mapping
Substrate mapping was then performed during sinus rhythm (Figure 1-2) using a 2-mm tip mapping catheter (NOGA). Standard bipolar voltage criteria for identification of scar were used based on clinically accepted norms10: >1.5mV represented normal tissue, 0.5mV to 1.5mV represented scar border zone, and <0.5mV represented dense scar. However, recent in vivo imaging data suggest scar distribution identified by gadolinium delayed enhancement, while generally in agreement with clinical criteria, may be more variable.11

FIGURE 1-2 Substrate map of LV (PA projection) created using CARTO 3-D electroanatomical mapping system (Biosense Webster, Diamond Bar, CA) showing large inferior scar.
A total of 440 endocardial sites were sampled with a total LV chamber volume of 226 cc. A large, dense inferior wall scar representing 41.1% of the total myocardium was seen with a basal inferior wall aneurysm. Areas of late potentials were identified and tagged both at the scar border as well as in the scar itself (Figure 1-3).
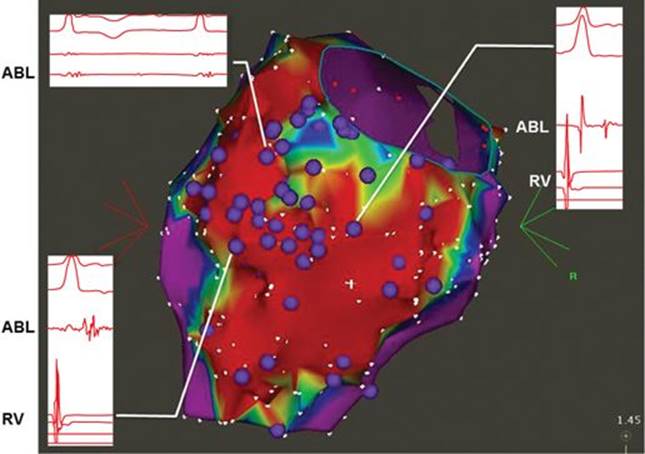
FIGURE 1-3 CARTO map showing tagged late potentials (purple). Inset: Intracardiac electrograms showing three distinct late potential appearances from three separate areas of the scar/scar border. Ablation catheter recording marked with ABL; RV catheter recording marked with RV.
Pace-Mapping
Pace-mapping using CARTO-3 Paso Module for automated comparison of paced morphology to stored template was then performed at previously identified sites of late potentials within the scar and along the scar border. Sites of excellent pace-maps (correlation >90%) were tagged (Figure 1-5A). Each of our encountered VT had excellent pace-map matches at various sites in and around the previously defined scar.
• VT1: Pace-mapped to a site of previously identified late potentials at the scar border zone on the lateral side of the midinferior wall (Figures 1-4A and 1-4B).

FIGURE 1-4A Sites of good pace-maps. Arrow: site of best pace-map match for VT1.

FIGURE 1-4B Intracardiac electrogram showing late potential at site near perfect pace-map match for VT1. (Right) PASO comparison of pace-map morphology at this site with stored VT1 template showing >98% match. Green: paced QRS. Yellow: stored VT1 template. Ablation catheter recording marked with ABL; RV catheter recording marked with RV.

FIGURE 1-5A (Left) CARTO map showing site of best pace-map match for VT2, located in dense scar. (Right) PASO comparison of pace-map morphology at this site with stored VT2 template showing >97% match. Note the long S-QRS interval from a site deep within scar. Green: paced QRS. Yellow: stored VT2 template.
• VT2: Pace-mapped to a site of late potentials along the scar border on the inferolateral free wall as well as to a site of late potentials within the dense scar (Figure 1-6A) where there was a long (109 ms) pacing stimulus to QRS duration.

FIGURE 1-6A Termination of VT1 during ablation at site that demonstrates late potential in sinus rhythm and near perfect pace-map. Entrainment from this site in VT appeared concealed with a short PPI-TCL.
Entrainment Mapping and Ablation
Entrainment mapping is used to characterize the reentrant circuit4,12 and identify a protected isthmus critical to the maintenance of the tachycardia that can be targeted for ablation.
Characteristics of entrainment at a particular site that are predictive of success of ablation include:
1. Concealed fusion: entrained QRS identical to tachycardia QRS
2. Postpacing interval minus tachycardia cycle length difference (PPI-TCL) ± 30 msec
3. When pacing from the site, the stimulus to QRS duration of >60 msec
4. Ratio of stimulus-to-QRS duration to TCL of <0.7
5. Stimulus-to-QRS to the local electrogram recorded from the catheter during VT-to-QRS difference ± 10 msec.5,13
Tachycardia was reinduced in our patient via programmed stimulation, and entrainment mapping was performed. Entrainment of VT1 near the previously identified site of best pace-map match was concealed with a short postpacing interval minus tachycardia cycle length difference (PPI-TCL). Radiofrequency ablation at this site terminated the tachycardia (Figures 1-6A and 1-6B).

FIGURE 1-6B CARTO map showing relationship of best pace-map site (orange) to site of termination during ablation (green).
Following ablation of VT1, programmed stimulation was again performed and resulted in induction of clinical VT2. Pace-mapping at sites with previously identified late potentials revealed a site in dense scar with an excellent match to the VT2 QRS morphology, and long S-QRS interval (Figure 1-5A). Of interest, a similar match was identified at a site on the lateral scar border, with a short S-QRS interval, indicating the exit of the circuit from scar to normal myocardium (Figure 1-5B). These findings are compatible with an anatomically fixed pathway. Entrainment from the site within dense scar was consistent with a critical isthmus site. Ablation at this site terminated the VT (Figures 1-7A and 1-7B).

FIGURE 1-5B (Right) CARTO map showing excellent pace-map match for VT2, located at the lateral scar border. (Left) PASO comparison of pace-map morphology at site (orange) on lateral scar border to stored VT2 template showing >93% match. Note the shorter S-QRS interval from a site on the scar border compared with the deeper scar site in Figure 1-6A. Green: paced QRS. Yellow: stored VT2 template.

FIGURE 1-7A Termination of VT2 with ablation from site of entrainment in dense scar.

FIGURE 1-7B CARTO map showing relationship of site of best pace-map match for VT2 (orange, arrow) within scar to site of termination (green) for VT2.
FOLLOW-UP
Further programmed stimulation failed to induce any sustained VT. Ablation was then performed at previously marked sites of good pace-maps as well as at sites of late potentials along the scar border (Figure 1-8). An approach to eliminate sites where local abnormal ventricular activity is present during sinus or paced rhythm has been shown to improve outcomes in substrate-based ablations when compared to the endpoint of noninducibility alone.14 Since the initial ablation, the patient has been free of VT for 3 months without the aid of antiarrhythmic drug therapy.

FIGURE 1-8 CARTO map showing full set of ablation lesions (red) as well as sites of termination during ablation (green).
CONCLUSION
Ventricular tachycardia as a result of prior myocardial infarction is associated with significant morbidity and can have profound effects on quality of life. Healed scar and the border zone between scar and normal tissue presents the necessary substrate for reentrant VT in this group of patients. Ablation targets include protected critical isthmuses of slow conduction within the scar as well as the exit sites near the scar border. Target sites can be identified by a variety of techniques, including identification and tagging of late and/or isolated potentials, entrainment mapping, and pace-mapping. Depending on the specific clinical presentation and tachycardia characteristics, a combination of these techniques, as illustrated by this case, may best facilitate optimal outcomes.
Three-dimensional electroanatomical mapping has become an essential tool in VT ablation because of its ability to (1) accurately construct chamber geometry, (2) delineate scar topography, (3) provide a spatial anatomic template on which relevant physiologic features of electrical activation during sinus rhythm and multiple tachycardias can displayed, analyzed, and compared, and (4) track the location of ablation lesions relative to critical anatomy and physiology previously identified. By providing real-time catheter position and navigation, these systems help minimize radiation exposure to both patient and operator. Newer advancements, including multi-electrode mapping and qualitative ablation lesion evaluation, promise to further enhance the mapping and ablation of a wide variety of cardiac arrhythmias, including VT.
In our case, the CARTO 3-dimensional electroanatomical mapping system aided us in accurately defining the location and extent of myocardial scar, identifying and tagging areas of abnormal electrical activity, and quantitatively comparing paced morphologies to our clinical VTs. Each of these features contributed to the performance of an efficient, safe, and ultimately successful ablation.
REFERENCES
1. Josephson ME, Callans DJ. Using the twelve-lead electrocardiogram to localize the site of origin of ventricular tachycardia. Heart Rhythm. 2005;2(4):443-446.
2. De Chillou C, Lacroix D, Klug D, et al. Isthmus characteristics of ventricular tachycardia after myocardial infarction. Circulation. 2002;105(6):726-731.
3. Brunckhorst CB, Stevenson WG, Soejima K, et al. Relationship of slow conduction detected by pace-mapping to ventricular tachycardia re-entry circuit sites after infarction. J Am Coll Cardiol. 2003;41:802-809.
4. Stevenson WG, Khan H, Sager P, et al. Identification of reentry circuit sites during catheter mapping and radiofrequency ablation of ventricular tachycardia late after myocardial infarction. Circulation. 1993;88:1647-1670.
5. Bogun F, Bahu M, Knight BP, et al. Comparison of effective and ineffective target sites that demonstrate concealed entrainment in patients with coronary artery disease undergoing radiofrequency ablation of ventricular tachycardia. Circulation. 1997;95:183-190.
6. Kottkamp H, Hindricks G, Breithardt G, Borggrefe M. Three-dimensional electromagnetic catheter technology: electroanatomical mapping of the right atrium and ablation of ectopic atrial tachycardia. J Cardiovasc Electrophysiol. 1997;8(12):1332-1337.
7. Nakagawa H, Jackman WM. Use of a three-dimensional, nonfluoroscopic mapping system for catheter ablation of typical atrial flutter. Pacing Clin Electrophysiol. 1998;21(6):1279-1286.
8. Stevenson, et al. Identification and ablation of macroreentrant ventricular tachycardia with the CARTO electroanatomical mapping system. Pacing Clin Electrophysiol. 1998;21(7):1448-1456.
9. Khaykin Y, Oosthuizen R, et al. CARTO-guided vs. NavX-guided pulmonary vein antrum isolation and pulmonary vein antrum isolation performed without 3-D mapping: effect of the 3-D mapping system on procedure duration and fluoroscopy time. J Interv Card Electrophysiol. 2011;30(3):233-240.
10. Wilber DJ. Post infarction ventricular tachycardia: substrate approaches. In: Wilber DJ, Packer DL, Stevenson WG, eds. Radiofrequency Catheter Ablation of Cardiac Arrhythmias: Basic Concepts and Clinical Applications. 3rd ed. Blackwell Oxford UK; 2008:326-341.
11. Wijnmaalen AP, et al. Head-to-head comparison of contrast-enhanced magnetic resonance imaging and electroanatomical voltage mapping to assess post-infarct scar characteristics in patients with ventricular tachycardias: real-time image integration and reversed registration. Eur Heart J. 2011;32:104-114.
12. Stevenson WG, Friedman PL, Sager PT, et al. Exploring postinfarction reentrant ventricular tachycardia with entrainment mapping. J Am Coll Cardiol. 1997;29:1180-1189.
13. El-Shalakany A, Hadjis T, Papageorgiou P, et al. Entrainment/mapping criteria for the prediction of termination of ventricular tachycardia by single radiofrequency lesion in patients with coronary artery disease. Circulation. 1999;99:2283-2289.
14. Jais P, Maury P, Khairy P, et al. Elimination of local abnormal ventricular activities: a new end point for substrate modification in patients with scar-related ventricular tachycardia. Circulation. 2012;125(18):2184-2196.