You sent away a saliva sample or cheek swab to one or more of the major testing companies (23andMe <www.23andme.com>, AncestryDNA <dna.ancestry.com>, and Family Tree DNA <www.familytreedna.com>) for an autosomal-DNA (atDNA) test, and you just received your results. What do you do now? What do these results mean, and how do you use them to advance your genealogical research?
Within just the past few years, several million people have taken atDNA tests at 23andMe, AncestryDNA, and Family Tree DNA. And with more people taking these tests and entering into companies’ databases, it’s easier than ever before to find genetic matches and search for common ancestors. In this chapter, we’ll review the fundamental concepts needed to understand atDNA test results and some of their functions, such as cousin matching. We’ll also review the atDNA tools offered by the testing companies, and how to use these tools to find common ancestors and answer genealogical questions.
What is Autosomal DNA?
Autosomal DNA refers to the twenty-two pairs of non-sex chromosomes found within the nucleus of every cell. The atDNA chromosomes, or autosomes, vary in length, and when they are visualized (such as in image A), they are numbered approximately in relation to their sizes, with autosome 1 being the largest and autosome 22 being the smallest.

Twenty-two sets of human chromosomes are considered atDNA. The twenty-third pair, the sex chromosomes, determine gender, among other traits.
atDNA Inheritance
atDNA, unlike mitochondrial DNA (mtDNA) and Y-chromosomal DNA (Y-DNA), is inherited equally from both parents. Accordingly, an individual gets one chromosome in each chromosome pair from Mom, and one chromosome in each chromosome pair from Dad (image B). Unfortunately, since the chromosomes are not labeled or marked in a way that easily identifies which parent they come from, the results of a single atDNA genetic genealogy test cannot identify the specific source of a piece of DNA.
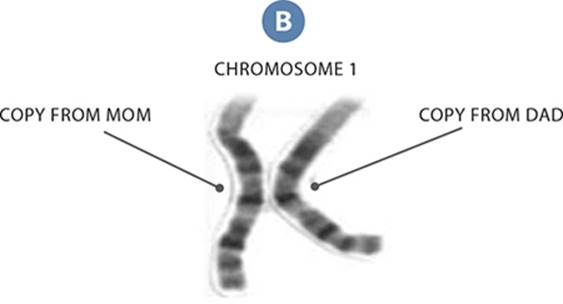
You receive one copy of each chromosome from each parent.
A child inherits his entire DNA from his parents, about 50 percent of his DNA from his mother and about 50 percent of his DNA from his father. However, the child is not inheriting all of his parents’ DNA; instead, he’s only inheriting half of his parents’ total DNA and leaving half of it behind. This occurs at every generation, meaning that as we go back in time, we inherit less DNA from ancestors at each generation.
In image C, Riley inherits only half of his parents’ DNA, 25 percent of his grandparents’ DNA, and just 12.5 percent of his great-grandparents’ DNA. Although not shown in the image, Riley will inherit just 6.25 percent of his great-great-grandparents’ DNA, and so on.
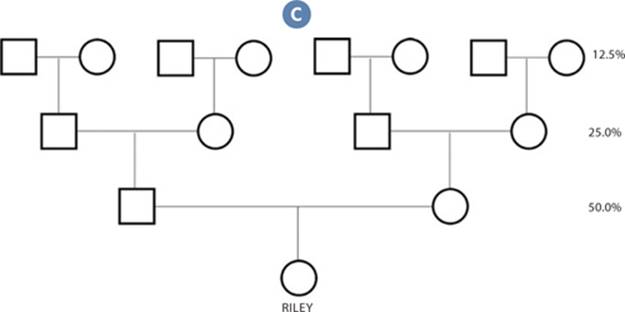
Less ancestral DNA is inherited at each generation, meaning that atDNA “disappears” over time.
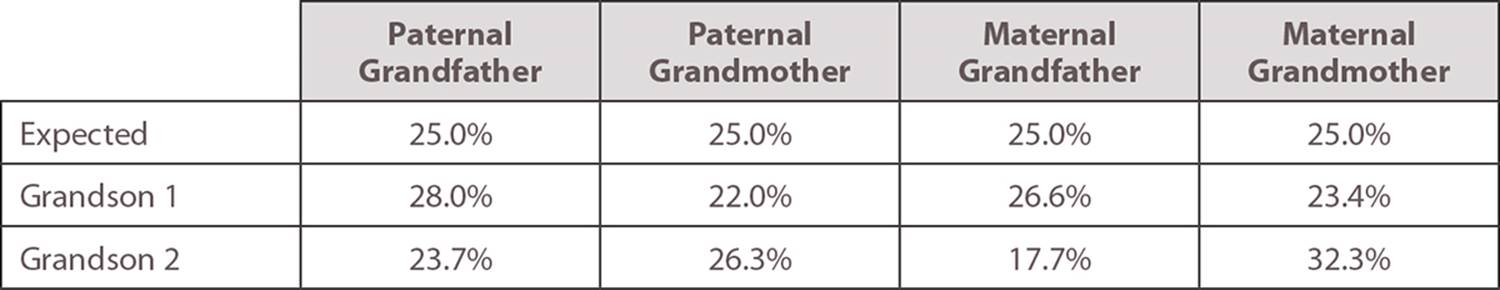
It should be noted that the percentages are averages across a population instead of absolutes for any given individual. Thus, while on average an individual will inherit 25 percent of his DNA from each grandparent, in practice the percentages will vary. For example, here is a graph of observed percentages of DNA received from four grandparents for two sibling grandchildren:
View text version of this table
Although each will average 25 percent, the range for Grandson 1 is 22.0 to 28.0, and the range for Grandson 2 is larger: 17.7 to 32.3.
Due to the inheritance pattern seen above, it is possible to determine how much DNA an individual is likely to share with close relatives. For example, if a grandchild and a grandparent both take an atDNA test, they should share on average about 25 percent of their DNA. Similarly, if an individual and his aunt both take an atDNA test, they should share on average about 25 percent of their DNA.
Image D shows how much DNA, in percentages, an individual is predicted to share with close relatives. The percentage for each relationship can be found in the red boxes. As with the other percentages above, this chart only represents the average percentage of DNA shared with relatives. The actual amount of DNA shared with a relative can vary quite a bit.

You can predict what percentage of DNA you’re likely to share with relatives based on atDNA inheritance patterns.
Recombination
One important factor to consider when taking atDNA tests and interpreting results is the process of recombination. Before a chromosome is passed down to the next generation, it undergoes recombination, in which a parental chromosome pair optionally exchanges pieces of DNA during meiosis, a natural, specialized process in which cells divide as eggs and sperm are created for reproduction.
Before we dig into recombination, it might be helpful to review meiosis as a whole and how and when recombination can occur. Meiosis occurs so that cells can divide their DNA amongst their daughter cells during gamete (i.e., sperm or egg) production, and the cell duplicates its chromosomes very early in meiosis. Normally, every cell has twenty-three pairs of chromosomes (twenty-two pairs of autosomes and one pair of sex chromosomes), for a total of forty-six chromosomes. However, in the first step of meiosis, the chromosomes are duplicated, resulting in a total of ninety-two chromosomes. Using image E as an example, the cell will duplicate its DNA so it has four copies of chromosome 1 (two copies of the chromosome from the person’s mother, and two copies of the chromosome from the person’s father). Similarly, the cell will have four copies of chromosome 2, and so on.
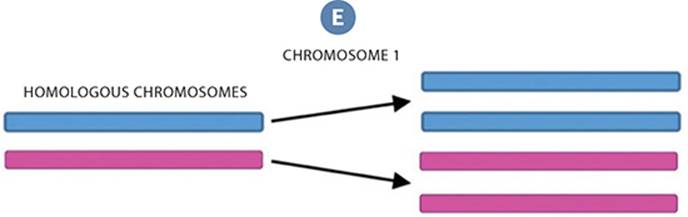
During meiosis, each pair of chromosomes (one copy from the mother and one from the father) duplicates itself, producing four total copies of each chromosome. In this image, DNA inherited from the father is in blue and DNA from the mother in pink.
As the now-duplicated chromosomes line up to be split into daughter cells, recombination can occur between any of the four copies of a chromosome (such as chromosome 1) as strands of chromosomes overlap. Should chromosomes’ genetic material cross over, some DNA may be exchanged between them, possibly resulting in a genetic variance. And once meiosis (and any recombination event/events) is complete, the daughter cells will randomly receive just one of the four chromosome copies, meaning three copies (two of them identical) will be left behind.
Note that recombination events may or may not be detectable, based (in part) on what chromosomes crossed over genetic information. If recombination occurs between the two paternal copies of the chromosome or between the two maternal copies of chromosome 1 (between sister chromatids—that is, between the two blue paternal chromosomes or between the two pink maternal chromosomes), there is no detectable change because they are identical copies. However, if recombination occurs between a paternal and a maternal chromosome (between nonsister chromatids—that is, between a blue paternal chromosome and a pink maternal chromosome), a detectable crossover occurs (image F).
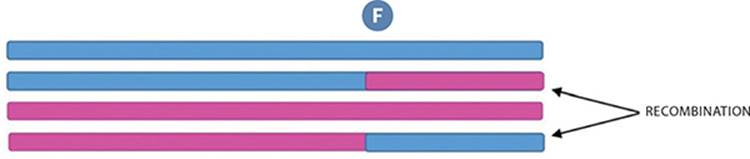
Recombination occurs when DNA from neighboring chromosomes cross over and exchange genetic information.
Recombination happens randomly, and each cell division can result in a different amount of recombination events (or no recombination events at all). It’s unusual for more than a handful of recombination events for a single chromosome to occur, however. Interestingly, females tend to have more recombination events over the entire set of twenty-two autosomes than males do.
The following example (image G) demonstrates the passage of atDNA from a paternal grandmother (Agatha) to her granddaughter (Courtney). This represents a single recombination event, when the father (Benny) created the sperm. (Note: Although Agatha’s DNA underwent recombination when she created the egg that would become her son Benny, that recombination would only be detected by comparing her DNA to her ancestors.) Image H compares Courtney’s first five chromosomes to Agatha’s first five chromosomes, with the DNA shared by both in green.

atDNA is transmitted from one generation to the next, regardless of each family member’s gender.

atDNA testing allows test-takers to compare their atDNA to that of an ancestor. Here, the DNA that Courtney shares with her grandmother, Agatha, on her first five chromosomes is in green.
Comparing the two women’s atDNA can tell us a lot about how atDNA is inherited and recombined across generations, as recombination must have occurred in regions where the women don’t share DNA. Chromosome 1, for example, suggests there were two recombination events at each place on the chromosome where the two women differ, indicated in image I. There may also have been a third recombination at the end of chromosome 1, as the women don’t share that region as well.
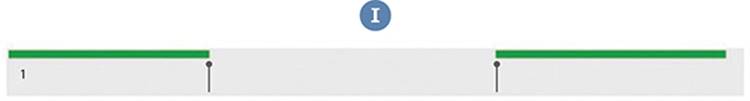
A break in the segments of DNA shared by Agatha and Courtney suggests that two recombination events occurred at the sites indicated above, leading to differences in DNA between the two relatives.
So how do we explain the differences between them, and where did the recombination events occur? Before the father passed down a copy of chromosome 1 to his daughter, his maternal and paternal copies of chromosome 1 crossed over at least two different locations. And when Benny’s DNA was split up into his daughter cells, the copy with genetic material matching his mother’s at the locations in green was passed on to the cell that became Courtney. (Note: The other copy of the chromosome would look just the opposite when compared to Agatha’s DNA—with the shared green segment in the middle. However, Courtney didn’t inherit this copy of the chromosome.)
The shared DNA also helps researchers determine which part of the chromosome was inherited from other ancestors. Specifically, since the segment in the middle of chromosome 1 doesn’t match Agatha’s, it must match Courtney’s paternal grandfather (i.e., Benny’s father); Benny’s DNA, like Courtney’s, can only come from two of his ancestors: his mother, Agatha (Courtney’s paternal grandmother), or his father (Courtney’s paternal grandfather).
Let’s look at some more chromosomes and see what we can assume from them. On chromosomes 2 and 5, there was no recombination between nonsister chromosomes, and Courtney inherited Agatha’s entire copy of chromosome 2, but none of Agatha’s chromosome 5. By process of elimination, Courtney must have instead inherited her paternal grandfather’s entire copy of chromosome 5. On chromosome 6, we know there was a single recombination event about halfway down the chromosome, as Agatha and Courtney don’t share a significant portion of chromosome 6’s DNA (image J).
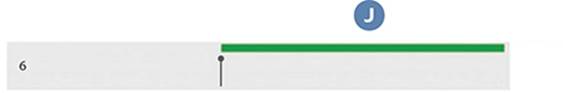
The shared DNA chromosome 6 between Agatha and Courtney suggests just one recombination event occurred, at the site indicated.
Importantly, Agatha’s DNA that wasn’t passed on due to recombination is now lost to Courtney and all future generations (unless it comes back in from other lines/through Benny’s siblings). For example, none of Courtney’s descendants will inherit DNA from Agatha’s chromosome 5. Thus, all the genes, ethnicity markers, and other information contained on the Agatha’s copy of chromosome 5 are lost in this particular line of the family (although, again, it may be recovered by testing other relatives/other of Agatha’s descendants).
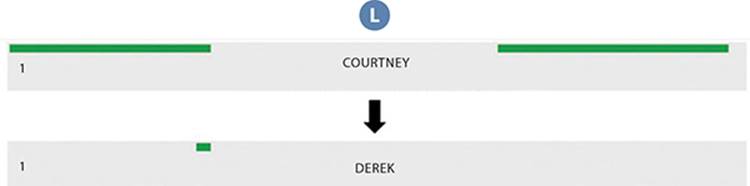
Note that, because the recombination of DNA can occur at every generation, the amount of DNA between an ancestor and her descendants often shrinks from one generation to the next. For example, Agatha’s chromosome 1 DNA that was passed on to Courtney will potentially be further “broken down” into smaller pieces when Courtney passes it on to her children. Courtney’s chromosome 1 DNA could recombine when producing the cells that become her son, Derek. In image K, in which the chromosome 1 DNA shared with Agatha by Courtney (top) and Derek (bottom) is indicated in green, the large segment of Agatha’s DNA at the left end of chromosome 1 was not passed on to her great-grandson, and the large segment at the right end of chromosome 1 experienced two recombination events that resulted in further loss. Alternatively, recombination could result in only a very small piece of Agatha’s chromosome 1 being passed to the next generation, as it does in image L.
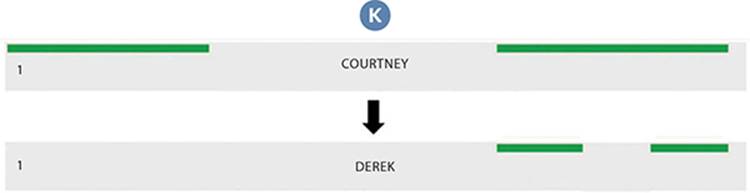
Courtney could have passed Agatha’s atDNA (indicated in green) down to her son, Derek, in a number of ways, including the above.
Courtney may have only passed down a small amount of Agatha’s atDNA to Derek.
As stated earlier in this section, DNA that isn’t passed down from one generation to the next can’t be passed down to future generations. As a result, Derek and Agatha could never share the portions of chromosome 1 pictured in image M, as Courtney never inherited that segment of DNA from her father, and so could never pass it down to Derek. The only exception to this rule would be if Derek somehow inherited that segment of Agatha’s chromosome 1 DNA from his father, which would likely mean that Derek’s father is also somehow related to Agatha since he shares some of her DNA.
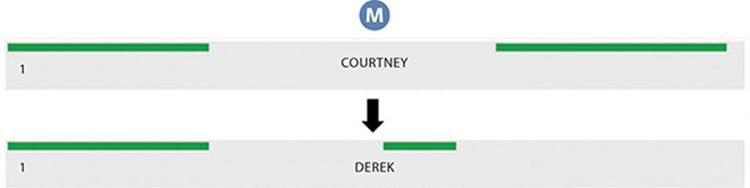
While atDNA can be passed down in a number of ways, the above is not one of them. Courtney cannot pass down atDNA from Agatha that she herself doesn’t have. The only way for this to occur is if Derek’s father is also somehow related to Agatha.
Now, let’s pan away to a real-life example: a grandchild’s DNA is compared to all four of his grandparents, with the source of every piece of DNA (for the first ten chromosomes) identified (image N). The graph, which was made using Kitty Cooper’s Chromosome Mapper <www.kittymunson.com/dna/ChromosomeMapper.php>, shows how each section of the grandchild’s DNA compares to each of his grandparents: Maternal grandparents are in red and orange, and paternal grandparents are in dark and light blue. Recombination events took place wherever colors change. Along each paternal chromosome (dark and light blue), for example, the grandchild matches either the paternal grandmother (dark blue) or the paternal grandfather (light blue). According to this graph, there were between zero and four recombination events per paternal or maternal chromosome. On chromosome 7, for example, the grandchild received an entire copy of the paternal grandmother’s chromosome, meaning that he shares no DNA with his paternal grandfather on that particular chromosome.

Tools like Kitty Cooper’s Chromosome Mapper can illustrate how an individual inherits atDNA from ancestors, such as the above, which indicates which sections of atDNA a grandchild received from each of his grandparents.
Two Family Trees
As stated in chapter 1, genealogists must actually consider two, distinct family trees when conducting genetic research. The first, the genealogical family tree, contains every parent, grandparent, and great-grandparent back through history. This is the tree that genealogists spend their time researching, often using paper records such as birth and death certificates, census records, and newspapers to fill in ancestors and information about them. The second family tree is the genetic family tree, a subset of the genealogical family tree that contains only those ancestors who contributed to the test-taker’s DNA. Not every person in the genealogical family tree contributed a segment of their DNA sequence to the test-taker’s genome. In fact, the genetic tree is only guaranteed to contain both biological parents, each of the four biological grandparents, and each of the eight biological great-grandparents, but with each generation it is much less likely that every person in that generation contributed a piece of their DNA to the test-taker’s DNA.
The difference between the two trees results in facts important to consider when tracing atDNA inheritance, including:
· Siblings have different genetic family trees. Other than identical twins, full siblings share only about 50 percent of their DNA (and half-siblings share about 25 percent of their DNA in common). As a result, the siblings have many genetic ancestors in common, but there are many distant ancestors represented in one sibling’s DNA that are not represented in the other sibling’s DNA. While full siblings have the same genealogical family tree, they have differing genetic family trees.
· Genealogical cousins are not always genetically related. First cousins share a strong genealogical and genetic link. They both are descended from shared grandparents, and both inherit some of the same DNA from those shared grandparents. However, it is much less likely that fifth cousins share DNA in common, since one or both of them may not have inherited DNA from the shared ancestor. Indeed, there is roughly only a 10- to 30-percent probability that fifth cousins will share a common DNA segment from their shared ancestor(s).
· Ethnicity is nearly impossible to predict. One of the most popular uses of atDNA testing is to estimate an individual’s ethnic heritage (also called “ethnicity” or “biogeographical estimate”). Chapter 9 is devoted to this use. However, since an individual does not possess all the DNA of his ancestors, he does not necessarily represent the entire ethnicity of his ancestors.
How the Test Works
The atDNA tests currently offered by 23andMe, AncestryDNA, and Family Tree DNA are SNP tests, meaning that they sample hundreds of thousands of SNPs—the variable nucleotides A, T, C, and G—located throughout the twenty-two autosomal chromosomes. Although sequencing all of an individual’s DNA (called whole-genome sequencing) will soon be as affordable as SNP testing, the higher price has prevented it from being offered commercially by these companies. In the future, genetic genealogists are likely to purchase whole-genome sequencing instead of SNP testing.
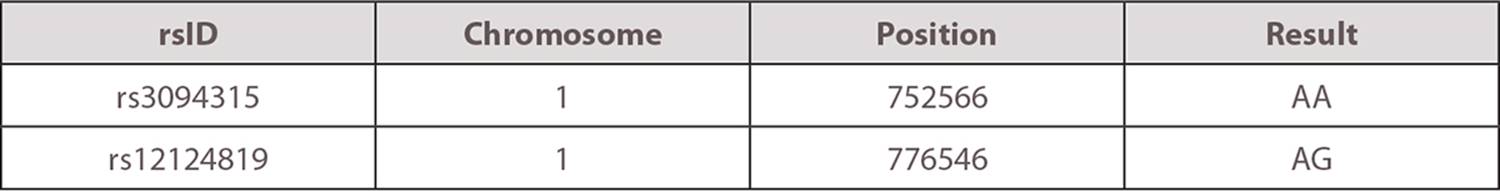
When the testing company receives the saliva sample from the test-taker, it extracts the DNA and makes many copies. The company then uses the test-taker’s amplified DNA to test for the nucleotide value at each of seven hundred thousand or more locations within the test-taker’s DNA. The results of the test will most often look like this:
View text version of this table
Each line of the table represents an SNP somewhere in the test-taker’s genome. “rsID” stands for Reference SNP cluster ID, and is a general reference for an SNP. The “chromosome” and “position” columns reveal where within the genome the result is found. The “result” column is the value of the maternal and paternal chromosomes at that location. Without more information, however, it’s not possible to determine which result is the paternal chromosome and which result is the maternal chromosome.
As we’ll see throughout this chapter, the results of an atDNA test can have several important uses. For example, the results are most often used for finding genetic relatives, people who share a segment of DNA with the test-taker.
Using atDNA: Finding Genetic Cousins
In addition to using DNA to break down genealogical brick walls, researchers often use DNA to find cousin matches amongst other test-takers. And while many testing companies do the heavy lifting for you, you’ll still have to consider a number of factors when attempting to find and confirm genetic cousins. In this section, we’ll discuss some of the factors that influence whether or not two people are genetic cousins and help you analyze DNA cousin results each testing company provides.
Minimum Segment Length
Each of the testing companies has selected a minimum segment length threshold that must be met before two people in the testing database will be flagged as sharing DNA in common, and this threshold can be key to understanding your results. If the threshold is set too low, some of the individuals identified by the company will be false positives, meaning that the two test-takers are either not actually related or have a shared common ancestor who lived thousands of years ago. If the threshold is set too high, there can be false negatives, meaning that the test-takers share enough DNA segments to be true genetic relatives but are being arbitrarily excluded from the test-taker’s list of people sharing their DNA.
Ideally, the testing company would like to identify only those individuals who share a common ancestor within the past three to four hundred years (what may be called “a genealogically relevant time frame”) while excluding individuals who share a common ancestor more than five hundred years ago. While the minimum segment threshold helps this goal, it is not perfect.
23ANDME
At 23andMe, two individuals are identified as a genetic match if they share at least one segment of at least 7 centimorgans (cMs) and seven hundred single nucleotide polymorphisms (SNPs). Additional segments beyond the initial 7-cM segment are identified as being shared by the two individuals if those segments share at least 5 cMs and seven hundred SNPs. Thus, if the results of two people at 23andMe only show that they share a single segment of 6.5 cMs and 750 SNPs, they will not be identified as a genetic match, since there is no segment of at least 7 cMs shared by the two individuals.
For the X chromosome at 23andMe, there are different thresholds depending on the sex of the two test-takers:
· Male versus male: 1 cM and two hundred SNPs
· Female versus male: 6 cM and six hundred SNPs
· Female versus female: 6 cM and twelve hundred SNPs
Notably, 23andMe has a set cap of approximately two thousand genetic cousins for each test-taker. The two-thousand cap means that for many test-takers, valid matches are excluded from the list of genetic cousins. According to one estimate by the International Society of Genetic Genealogy (ISOGG) <www.isogg.org/wiki/Identical_by_descent>, the two-thousand cap excludes new matches below approximately 17 cM shared for most individuals with Colonial American ancestry.
ANCESTRYDNA
At AncestryDNA, two individuals are identified as a genetic match if they share at least one segment of at least 5 cMs. This is a relatively low threshold, and this threshold increases the probability that individuals identified as distant matches at AncestryDNA are actually false positives (which, again, would indicate they are related well beyond a genealogically relevant time frame).
FAMILY TREE DNA
At Family Tree DNA, two individuals are identified as a genetic match if they share at least one segment of at least 5.5 cMs, according to the company’s website <www.familytreedna.com/learn/autosomal-ancestry/universal-dna-matching/genetic-sharing-considered-match>. Other evidence suggests the threshold might be approximately 7.7 cMs and at least five hundred SNPs for the first segment, and a total of at least 20 cMs shared in common (including all the shorter matching segments between 1 cM and 7 cMs).
For the X-chromosomal (X-DNA) test at Family Tree DNA, the criteria is twofold: The individuals must already meet the atDNA threshold, and they must share a segment of at least 1 cM and five hundred SNPs. The requirement for a shared atDNA segment prior to X-DNA comparison means there are false negatives; individuals who share X-DNA but don’t share atDNA will not be identified as genetic cousins. Further, the very low threshold of 1 cM and five hundred SNPs for X-DNA matching means that test-takers will have false positives—individuals who are identified as sharing X-DNA within a genealogically relevant time frame, but likely do not.
Although these matching thresholds are in place to maximize the likelihood that individuals identified as sharing a segment of DNA are in fact recent genetic cousins, it is important to keep in mind that every “match list” will have individuals who are false positives. Accordingly, it is often a best strategy to focus on those individuals who share the most DNA. The longer a shared segment is, and the more segments two people share in common, the greater the likelihood that the two individuals share a recent common ancestor.
SHARING DNA WITH SIBLINGS
You might think that DNA comparisons between siblings would be straightforward, but (like with many topics in genetic genealogy) the answer is more complicated.
How much DNA is shared by siblings raises an important distinction in genetic genealogy. Individuals who share DNA can be either half-identical or fully identical. A half-identical region (HIR) is a portion of the genome where two people share a segment of DNA on just one of their two chromosomes. Remember, everyone has two copies of each chromosome, and it is possible to share DNA with someone else on one of those copies, or in rarer cases (such as siblings) on both of those copies. Accordingly, a fully identical region (FIR) is a region where two people share segments of DNA on both copies of their two chromosomes. The image demonstrates HIR versus FIR shared segments for an individual, where the blue segment(s) is the DNA shared by that test-taker with another test-taker
Half of the DNA shared by siblings is from HIRs (1700 cM), while half of the DNA shared by siblings is from FIRs (850 cM, for a total of 1,700 cM). The HIRs plus the FIRs equals 3,400 cMs. However, 23andMe and Family Tree DNA only report half of the DNA at FIRs. Accordingly, these companies will only report about 75 percent of the actual amount of DNA shared by siblings (or, in other words, just 75 percent of 50 percent, or 75 percent of 3,400 cMs).
In summary, siblings are half-identical on 50 percent of their DNA (1,700cM) and fully identical on a further 25 percent/850cM.

Likelihood of Sharing DNA
As discussed earlier, only a small percentage of genealogical cousins actually share DNA. After seven to nine generations, DNA is not inherited by all descendants of an ancestral couple. Further, the samepieces of DNA are not inherited by all descendants of an ancestral couple, even at the first generation. In other words, a great-great-great-grandson may have inherited the only piece of DNA from his great-great-great-grandfather on chromosome 8, while the only piece of DNA a great-great-great-granddaughter inherited from that same great-great-great-grandfather is on chromosome 3. Although these two individuals are fourth cousins and both have DNA from their shared ancestors, they do not share any segments of DNA in common. To use terminology from chapter 1 and an earlier section of this chapter: They are genealogical cousins, but not genetic cousins.
What is the likelihood that genealogical cousins will share DNA? For close cousins, the likelihood is very high, but it decreases rapidly. All three companies have provided their estimate or calculation of these probabilities:

View text version of this table
According to these estimates, it is almost guaranteed that relatives at a second-cousin level and closer will share detectable amounts of DNA. Indeed, I’ve never heard of a confirmed case in which second cousins did not share DNA. This means that if second cousins take an atDNA test and they don’t share DNA, there was almost certainly a misattributed parentage event. For more information, see my article “Are There Any Absolutes in Genetic Genealogy?” <www.thegeneticgenealogist.com/2015/04/13/are-there-any-absolutes-in-genetic-genealogy>.
THE SHARED CM PROJECT
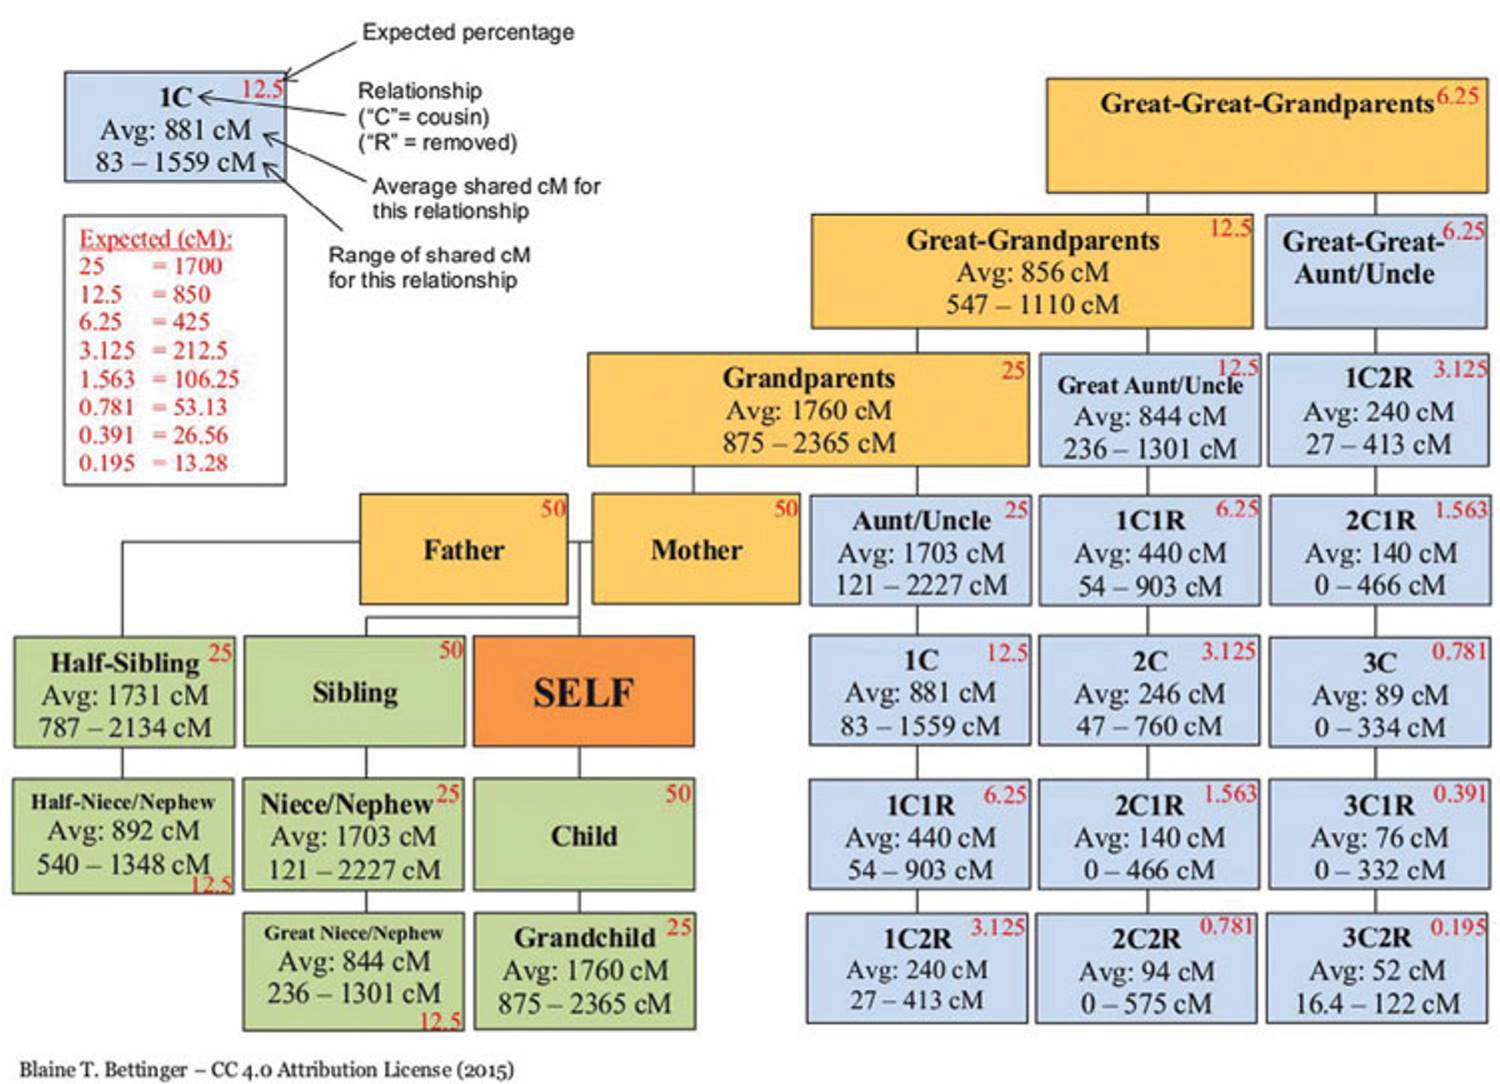
The Shared cM Project <www.thegeneticgenealogist.com/2015/05/29/the-shared-cm-project> is a data collaboration project I started in 2015 to collect shared DNA data for known genealogical relationships to the third-cousin level. Although tables available at the time (and reproduced in this chapter) show how much shared DNA can be expected for these relationships, there was no good source of information about how much shared DNA is actually observedfor these relationships. Accordingly, the project requested that genealogists submit data about their genealogical relationship, including how much DNA they shared with a cousin in total, and the largest segment they shared with the cousin. More than six thousand relationships were submitted, and the information was collated into tables and the following image. For each relationship, the following information is provided based on the data submitted for the relationship: (i) the average amount of DNA shared; (ii) the lowest amount shared; and (iii) the highest amount shared.
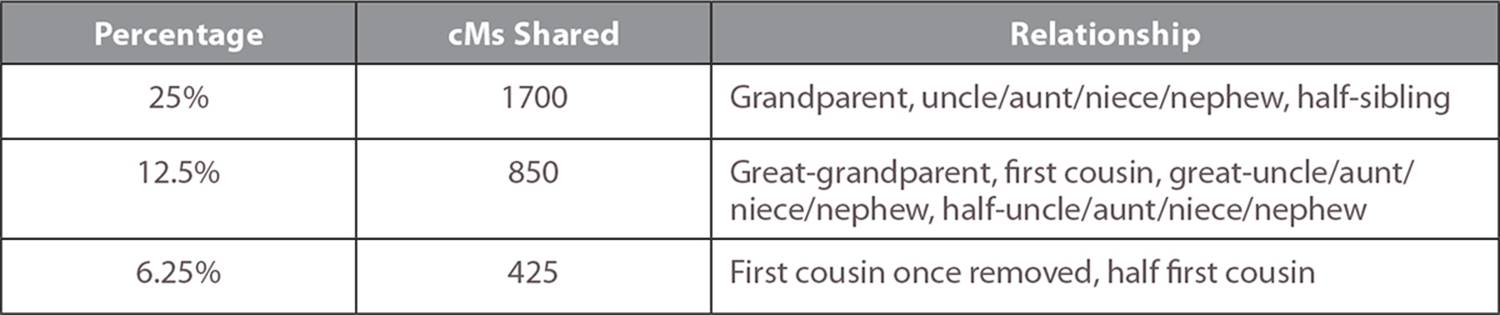
For example, those with a 1C1R (first cousins once removed) relationship are predicted to share 6.25 percent, or 425 cM, of their DNA. According to the data submitted to the Shared cM Project (which according to the table consisted of 606 different 1C1R relationships), first cousins once removed share an average of 440 cMs, with the lowest reported amount being 54 cMs and the highest reported amount being 903 cMs.
Amount of Shared DNA
The amount of DNA shared by two people can also help determine the genealogical relationship between those two people, although it is not a perfect predictor. For example, if two test-takers share 1,500 cM of DNA in common, their relationship is likely a grandparent/grandchild, aunt/uncle or niece/nephew, or half-sibling relationship. However, if two test-takers share 75 cM of DNA in common, it will not be clear whether the match is a third cousin, second cousin once removed, or a more complicated relationship (e.g., double cousin). Relationship prediction typically works best when the relationship is a third cousin or closer.
The following chart, adapted from the ISOGG wiki page “Autosomal DNA Statistics,” <www.isogg.org/wiki/Autosomal_DNA_statistics>, provides the expected amount of DNA shared between people having the identified relationship:
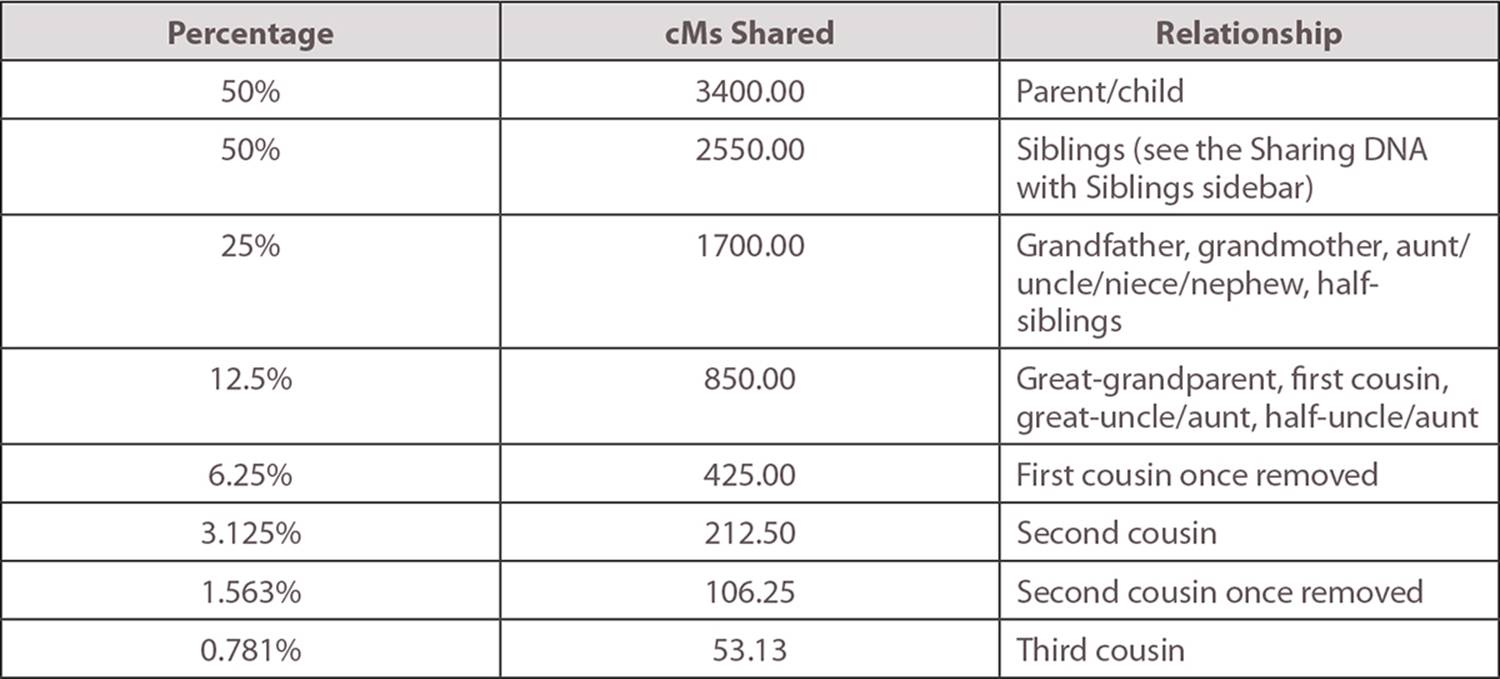
View text version of this table
It’s important to remember that without other information, it is impossible to tell whether two people share DNA because of a genealogical relationship in one line, two lines, or multiple lines. In the following example, two people share three segments of DNA totaling 58.2 cMs, and the testing company predicts them to be third cousins.
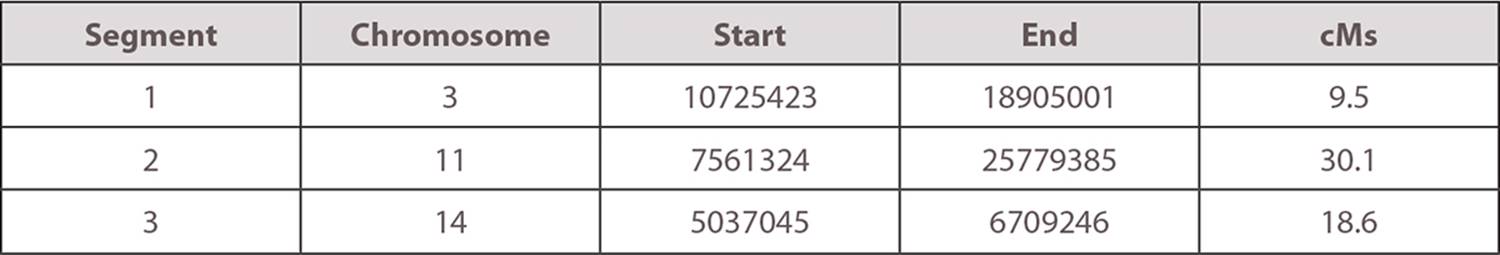
View text version of this table
However, one test-taker has tested both parents and sees that Segment 2 in the table is shared with the test-taker’s mother, while Segments 1 and 3 are shared with the test-taker’s father. Thus, the test-taker is likely related to the other individual a bit more distantly, but through multiple different lines. However, if the test-taker hadn’t also tested his parents, it would be much more challenging to determine the exact nature of this relationship, and it would have been easy to assume that the individual was actually a more recent, third cousin.
Chromosome Browsers
Family Tree DNA and 23andMe are the only testing companies that offer a chromosome browser, a tool that allows test-takers to see exactly what segments of DNA they are identified as sharing with another person. Chromosome browsers can provide more detail than can information about shared cMs and SNPs. However, each company’s chromosome browser looks different and can be used in slightly different ways.
FAMILY TREE DNA
At Family Tree DNA, a test-taker can use the chromosome browser tool to look at shared segments with any individual with whom she is predicted to share DNA (and thus are shown in the “Family Finder—Matches” list).
Image O shows the first five chromosomes in the chromosome browser at Family Tree DNA, with the DNA shared by a set of first cousins. The dark blue shapes represent each chromosome, and the full image includes all chromosomes from 1 to 22. Each of the orange blocks represents a shared segment of DNA. Note that the segments are not perfectly to scale in the chromosome browser, so evaluating the size of segments based on visual appearance alone can be misleading. In addition to showing shared segments on chromosome 1 to 22, Family Tree DNA also shows shared segments on the X chromosome.
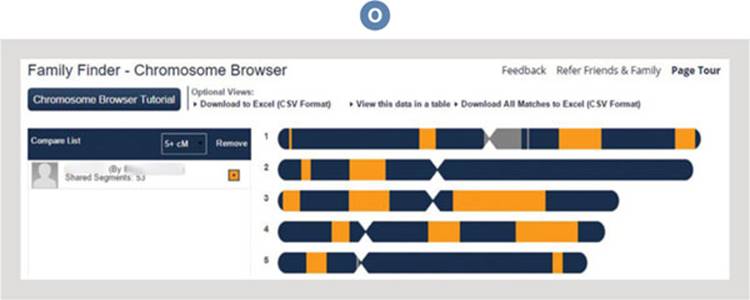
Family Tree DNA provides users with a chromosome browser to allow you to see your DNA in more detail, breaking down your shared DNA by chromosome.
When the test-taker hovers the mouse or pointer over a segment, he’ll see a pop-up box that shows the chromosome number, the start location (e.g., position 53,624,479), the stop location (e.g., position 96,298,324 in the image), and the total size of that segment.
All of the information about shared DNA, including the chromosome number and start and stop locations for each segment, can be downloaded to a spreadsheet. And downloading the info into a spreadsheet will reveal the same information for all of the shared segments. The following example provides a selection of just some of the segments shown in the first Family Tree DNA cousin comparison:

View text version of this table
23ANDME
At 23andMe, a test-taker can use the chromosome browser tool to look at shared segments with any individual with whom he is “sharing genomes,” meaning that the two individuals have agreed to share their profiles with each other. In 2016, 23andMe switched to an entirely new user experience with a revamped user interface, new graphics, and revised tools. The chromosome browser for the new site is located at <you.23andme.com/tools/relatives/dna>. There, the user can select two people and compare their genomes.
Image P is the first ten chromosomes on the 23andMe chromosome browser, showing the two individuals share a total of two segments. The hatched gray bars, which are difficult to see, represent each chromosome. Each of the purple blocks represents a shared segment of DNA. As with Family Tree DNA’s chromosome browser, the segments shown in the 23andMe browser are not perfectly to scale in the chromosome browser, so evaluating the size of segments based on visual appearance alone can be misleading. In addition to showing shared segments on chromosome 1 to 22, 23andMe also shows shared segments on the X chromosome.
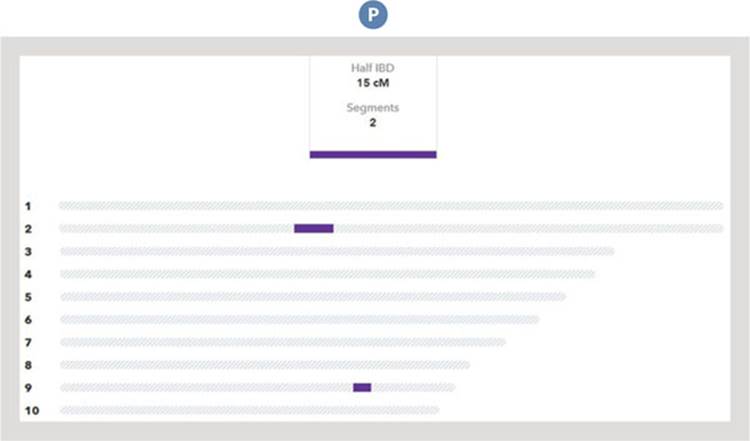
23andMe’s chromosome browser also allows for a more detailed comparison between your and your ancestor’s DNA.
If the test-taker clicks on a segment on the chromosome browser, he’ll see a pop-up box that shows the chromosome number, the approximate start and stop locations, the total size of that segment, and the number of SNPs tested in the segment. All of the information about shared DNA, including the chromosome number and start and stop location for each segment, can be viewed in a table or downloaded to a spreadsheet.
Analyzing Genetic Cousins Identified by the Testing Company
Each of the three major testing companies, 23andMe, AncestryDNA, and Family Tree DNA, compare the test-taker’s DNA to the DNA of every other test-taker in the company’s own database. If the two sets of DNA have a segment with the same sequence, and if the length of that segment satisfies the thresholds previously discussed, then the individuals will be identified as genetic cousins or “matches.”
Note that while all three companies and all third-party tools use the word “match” to refer to two or more people who are identified as sharing a segment of DNA, the word “match” does not necessarily mean that two people share a recent common ancestor; for example, the two or more people may share that segment by chance or due to a sequencing or interpretation error.
In this section, I’ll discuss how to carefully evaluate each company’s “matches.”
23ANDME
The match list at 23andMe is called DNA Relatives and shows the test-taker’s closest genetic relatives listed in order, starting with the individual who shares the most DNA with the test-taker (Image Q).
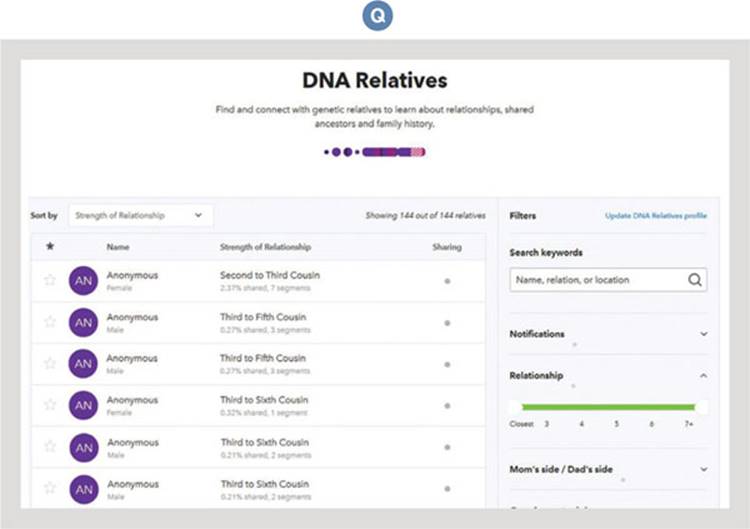
The names of and details about suggested genetic cousins at 23andMe are behind a privacy barrier. In order to see your match’s information, that match will need to approve a request to share his ancestry report.
Unlike AncestryDNA and Family Tree DNA, 23andMe has a default privacy barrier between people in the DNA Relatives list. Because of this privacy barrier, people identified as genetic cousins are not automatically revealed to the test-taker. Instead, the test-taker will only see the identified persons’ sex, predicted relationship, mtDNA haplogroup, and the Y-DNA haplogroup (for males). In the profile for anonymous matches, the test-taker will find a Request to Share button that allows users to share ancestry reports only if the anonymous match checks for and accepts sharing requests.
The test-taker can also send a message to anonymous matches by clicking on the match and using the message box in the far right column of the profile. Another way to connect with the genetic cousin is sending a personalized communication, such as an online family tree where the match can go for more information.
Given the size of the 23andMe database, most people with European ancestry will have a significant number of genetic matches—most from colonial locations like the United States, Canada, Australia, and New Zealand. Recently, more and more people are also testing from Ireland and the United Kingdom. However, people with mostly Asian and African ancestry may have fewer genetic relatives, since those areas of the world have not experienced widespread genetic testing.
ANCESTRYDNA
The “match list” at AncestryDNA is called DNA Matches and does not have a specific cap. Genetic relatives are listed in order starting with the individual who shares the most DNA with the test-taker. In the example in image R, the test-taker’s closest match is a first cousin.
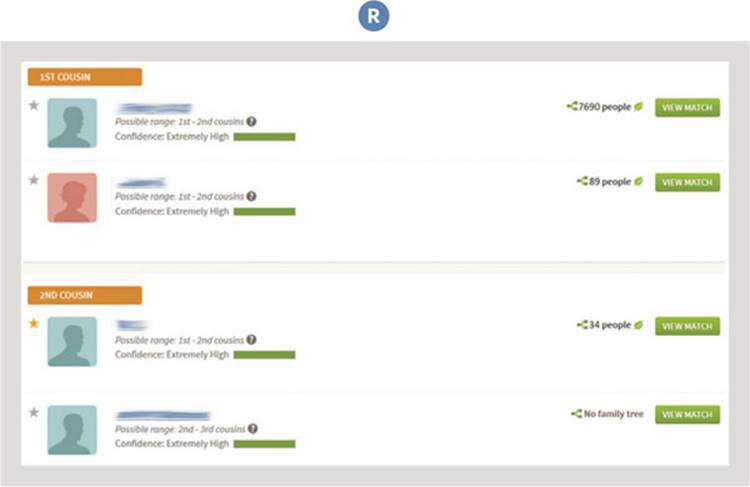
Ancestry DNA’s suggested matches page links directly to individuals’ family trees, allowing you to compare and evaluate a potential match’s family history to determine if you are, in fact, related. Names of matches have been blurred for privacy.
You’ll see relevant information for each match including username, relationship range, last login, and information about whether the individual has a family tree linked to his account. Clicking on a username will show the user’s profile. If the user has a family tree associated with his DNA test, his genetic relatives will be able to review the family tree to look for surnames and/or places in common.
If the test-taker has a public family tree associated with the DNA test results, AncestryDNA will compare that tree to the tree of genetic matches to try to find common ancestors. If a potential common ancestor who is similar enough is identified in the two trees, the genetic relative will have a “shaky leaf hint.” Shaky leaf hints are rare, and are generally more successful with larger and more complete family trees. Shared hints should be reviewed as hints, not as proof or evidence of a relationship. The fact that two people share DNA and share a common ancestor does not necessarily mean the shared DNA must have come from that shared ancestor!
Like 23andMe, test-takers with European ancestry will have a significant number of genetic matches identified in the list. However, AncestryDNA is actively advertising in and targeting countries such as Canada, Australia, and the United Kingdom (with more nations to come), and thus an increasing number of people in the database will be from other regions of the world.
FAMILY TREE DNA
The “match list” at Family Tree DNA is called Family Finder – Matches, and, like AncestryDNA, does not have a specific cap. Genetic relatives are listed in order starting with the individual who shares the most DNA with the test-taker. In image S, the test-taker’s closest matches are her two grandchildren.
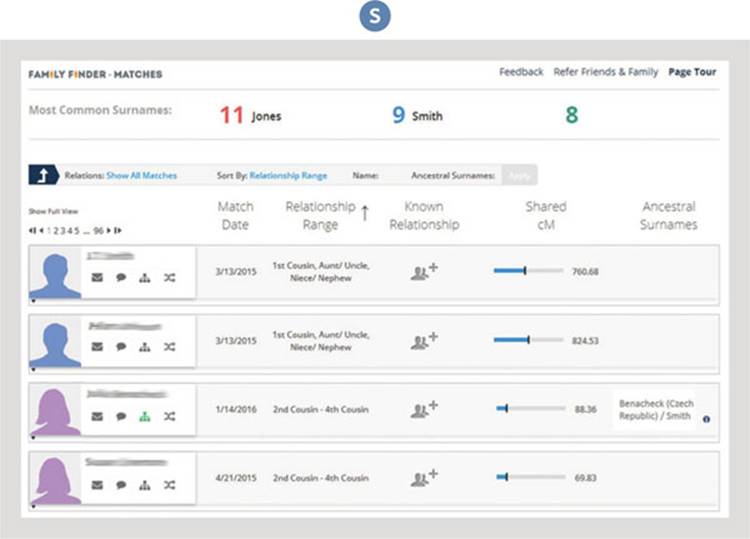
Family Tree DNA’s Family Finder—Matches allows you to view genetic matches with the users you share the most DNA with on the top. Names of matches have been blurred for privacy.
Family Tree DNA provides a wealth of information about each genetic relative, especially if the genetic relative has added certain facts and/or a family tree to the member profile. In image T, the genetic relative is predicted to be a second to fourth cousin and the two share a total of 48.80 cMs, of which the longest segment is 30.76. The user has some surnames in his profile (which will be bolded if any match the surnames listed in the other test-taker’s profile) that can quickly be reviewed by hovering over them. Further, this user has taken a Y-DNA test and his Y-DNA haplogroup is R-M269 (his terminal SNP).
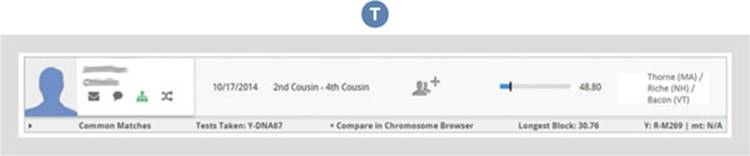
Family Tree DNA provides specific information about matches, including how many shared cMs of DNA, the individual’s surnames in his profile (which are bolded if they match yours), and (for male users) a Y-DNA haplogroup. This match’s name has been blurred for privacy.
Clicking on the username of a genetic relative in the match list will result in a pop-up that provides even more information (if the user has populated these fields), including Y-DNA and mtDNA haplogroup, most distant known paternal and maternal ancestors, and (most importantly for communication and collaboration) an e-mail address so you can contact the match.
Family Tree DNA’s database largely comprises test-takers from the United States, Canada, the United Kingdom, and Australia, although (like the other two companies) it includes test-takers from all over the world.
Using atDNA: ‘In Common With’ Tools
One of the most important tools at AncestryDNA and Family Tree DNA is the In Common With (ICW) tool. ICW tools allow a test-taker to see which of his identified genetic relatives are shared in common with a person in the match list.
AncestryDNA: Shared Matches
AncestryDNA’s ICW tool is called Shared Matches and is accessible via the Shared Matches button in a genetic relative’s profile (image U).
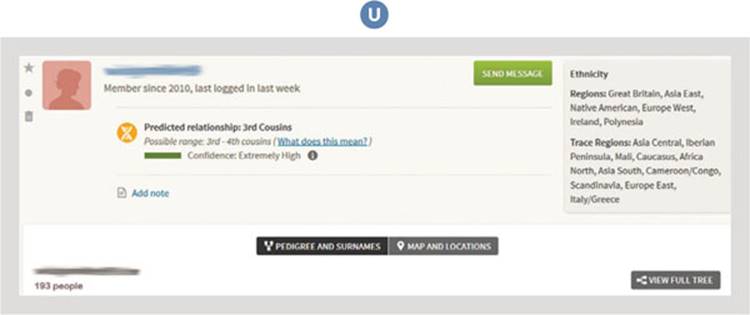
Ancestry.com’s Shared Matches tool allows you to view other users who have DNA matches in common with you, plus gives a predicted relationship with a confidence interval. This user’s name has been blurred for privacy.
There is an important limitation of Shared Matches: It will only work for fourth cousins or closer. In other words, for a Shared Match to show up, that Shared Match must be a fourth cousin or closer to boththe test-taker and the genetic relative with whom the test-taker is checking for shared matches.
Let’s use an example. Assume the test-taker, Blake, has a great-aunt named Amy who has tested at AncestryDNA. Blake sees Amy in his match list, so he clicks on the View Match button to see Amy’s profile. There, he clicks on the Shared Matches button to see the DNA matches he shares with Amy. He obtains a list that includes a third identified genetic relative named Chris. In order for Chris to appear in that list, he must satisfy two criteria: Chris must be a fourth cousin or closer to Blake and must be a fourth cousin or closer to Amy. If Chris is a distant cousin to Amy, he won’t appear in the Shared Matches list even ifhe is a match shared in common with Amy and Blake.
In image V, which works off the same example, Blake and Amy both have an array of matches. Some of those matches are shared in common, as shown in the region highlighted in gray. Of those, only Chris and David are fourth cousins or closer to both Blake and Amy, so only Chris and David will show up in the Shared Matches list. While (based on other genealogical evidence) Blake and Amy also share Gil, Hu, and Jill in common, they are all more distant matches and won’t show up in the Shared Matches list. Further, close matches like Franny and Egbert won’t show up because they aren’t shared by both Blake and Amy. Obviously, genealogists can only very rarely use the absence of a match from an ICW group as evidence.
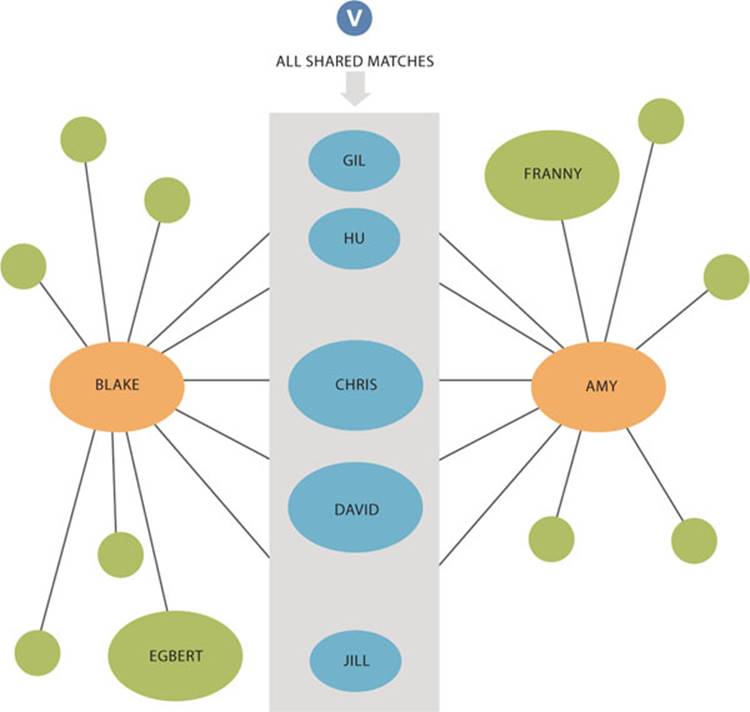
Navigating a network of shared matches can be complicated. Creating a diagram like this one can help you sort out which ancestors you and another test-taker at AncestryDNA do (and do not) have in common.
Family Tree DNA: The ICW and Matrix Tools
Family Tree DNA offers two ICW tools. The first is the Common Matches tool, which is accessible by clicking the double arrow below an identified genetic match’s username. This will provide a list of all individuals in the genetic matches list who are identified as sharing DNA with both the test-taker and the individual for which the double arrow was clicked. Unlike AncestryDNA, there is no restriction on the prediction of the genetic relationship, so all matches in common with the two compared individuals will be identified on this list. For example, if a mother and daughter have tested and the child does an ICW comparison with her mother, a very large percentage of the daughter’s entire match list can be shared with the mother.
The second ICW tool at Family Tree DNA is called the Matrix tool (image W). The Matrix tool is accessible by clicking Matrix in the Family Tree DNA Dashboard. The Matrix tool allows a test-taker to select up to ten of her identified genetic relatives and compare their atDNA sharing status in a grid or matrix.
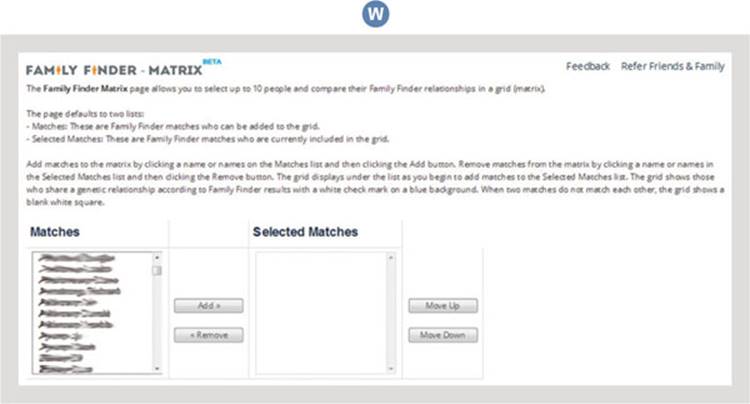
The Family Tree DNA Matrix allows users to select matches and compare their shared DNA in a grid or table. Names of matches have been blurred for privacy.
In the following example (image X), eight people have been added to the Matrix tool by John, the test-taker. The way in which individuals are grouped in the tool reveals three distinct patterns. First, Art, Bob, and Cary appear in a cluster, meaning that the test-taker John is identified as a genetic match with Art, Bob, and Cary, all of whom are identified as genetic matches with each other. In addition, you can see a second, Dick-Edgar-Fanny-Guy group. And third, Hilda and Ida share DNA in common with John, Art, Bob, Cary, Dick, Edgar, Fanny, and Guy. In this particular example, Hilda and Ida are children of John, so it isn’t surprising to see them matching everyone in this list.
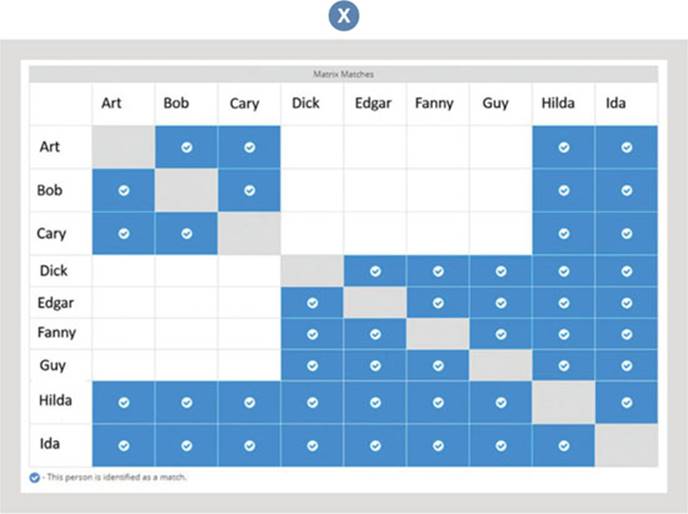
Test-takers can get a lot from Family Tree DNA’s Matrix data, such as this one in which matches who match the both test-taker and each other are indicated in blue. Note how some individuals “cluster” together, suggesting these individuals are related to each other and not necessarily to other matches.
Note this does not mean that all of the individuals in a matrix share a common ancestor with all the other members, as there are scenarios in which a test-taker will share common ancestors with some individuals but not others. For example, if John and Art share a common ancestor while John and Bob and Cary share a different common ancestor, Art could happen to share yet another ancestor who isn’t related to John with Bob and Cary.
Limitations of ICW Tools
People do not necessarily share a common ancestor just because the ancestor appears in an ICW tool. In the following example (image Y), test-taker George runs an ICW analysis at AncestryDNA and/or Family Tree DNA for an identified genetic match. George discovers that he and Thomas share a third identified match in common: Judy. George is excited and concludes that all three of them share the samecommon ancestor. However, George has jumped to an inaccurate conclusion.
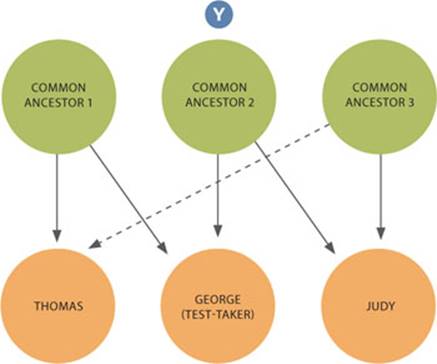
Shared matches can be deceiving. Three individuals can be considered shared matches, but not all three necessarily share the same common ancestor, as in this example.
In fact, George and Thomas share Common Ancestor 1, while George and Judy share Common Ancestor 2. But what George can’t determine from the ICW tools alone, is whether Thomas and Judy share Common Ancestor 1, Common Ancestor 2, or—as is the case here— an entirely different Common Ancestor 3. Note that George does not share Common Ancestor 3 with Judy or Thomas. Additional information will be needed to confirm George’s hypothesis. For example, if all three of the test-takers share the same segment of DNA in common, this might be stronger evidence for George’s conclusion. Alternatively, George can compare the family trees of the three individuals where he might learn of the situation described above.
Other Uses for atDNA Testing
Genealogists use the results of atDNA testing for two main purposes: cousin matching (which we’ve already discussed in depth) and ethnicity analysis. Ethnicity estimates provided by testing companies attempt to break down the test-taker’s DNA into continental or regional sources. Although these estimates are notoriously poor, they can have genealogical applications, particularly if the research question involves a recent ancestor with a distinct ethnicity. For example, finding numerous segments of DNA which the testing company identifies as “African” can support a hypothesis for a recent ancestor with African ancestry. We’ll discuss ethnicity estimates in more detail in chapter 9.
In addition to cousin matching and ethnicity analysis, the results of atDNA testing can have other uses. For example, genealogists use cousin matching and family trees to “map” or assign segments of their DNA to ancestors. If test-takers Aaron and Brenda know that they share a segment on chromosome 7 in common, and trace that segment to their great-grandfather, Marshall, they can reasonably assume that segment on chromosome 7 came from their great-grandfather. Thus, when future genetic matches share that segment with them, they know to review their great-grandfather’s line in order to find a common ancestor.
Genealogists are beginning to recreate portions of the genomes of ancestors using atDNA. To do this, they test multiple descendants of an ancestor, who are unlikely to have ancestry through lines other than that ancestor. The segments of DNA those descendants share in common, therefore, are predicted to have come from the shared ancestor and can be pieced together to recreate portions of the ancestor’s genome. As more descendants are tested, more pieces of the ancestor’s DNA can be identified.
Some genealogists are also using atDNA test results to learn about their health and propensity for certain illnesses or conditions. Although the connection between DNA and health is still poorly understood—and what is understood suggests that DNA plays a smaller role in most health conditions than was once predicted—it is possible to analyze a test-taker’s DNA for health purposes. 23andMe, for example, provides health information to test-takers as part of its atDNA test. In addition, there are third-party tools that analyze the test-taker’s raw DNA data and provide a report of propensities for certain health conditions.
These are just a few of the powerful uses of atDNA, and there will be more as additional people take atDNA tests and as new tools are developed by testing companies and independent programmers.
CORE CONCEPTS: AUTOSOMAL-DNA (ATDNA) TESTING
Autosomal DNA (atDNA) refers to the twenty-two pairs of chromosomes, called autosomes, in the nucleus of the cell.
A child inherits 50 percent of atDNA from the father and 50 percent of atDNA from the mother.
atDNA testing is done by analyzing hundreds of thousands of SNPs throughout the twenty-two pairs of chromosomes.
atDNA test results are used to fish for genetic cousins by approximating how many generations have passed since two matches shared a common ancestor. The closer the relationship, the better the estimate.
Not all genealogical cousins will share atDNA. Cousins and relatives at the second-cousin or closer level are always expected to share DNA. Beyond a second-cousin relationship, the likelihood of sharing DNA with a cousin decreases rapidly.
Each of the atDNA testing companies—23andMe, AncestryDNA, and Family Tree DNA—uses atDNA test results to estimate ethnicity and find genetic cousins. Each of the companies offers tools to analyze the results of testing and connect with genetic cousins.
atDNA test results can be very useful for examining specific genealogical questions, such as whether two people share a recent common ancestor.
DNA in Action
What Is the Relationship?
Genealogist Allen, age twenty-five, has tested his atDNA at all three testing companies. He periodically logs into his accounts to check for new matches, and when he logs into Family Tree DNA, he discovers a new close match with the username “NYgreen3.” This match shares 1025 cMs with Allen, and is predicted to be a “1st cousin, half-sibling, grandparent/grandchild, aunt/uncle, or niece/nephew.” Allen doesn’t recognize the username or the e-mail address associated with the account, and no other information is provided. The shared matches feature reveals that NYgreen3 matches Allen’s maternal relatives, particularly those on his maternal grandmother’s line.
To figure out how NYgreen3 might be related to him, Allen turns to the Autosomal DNA Statistics page of the ISOGG wiki <www.isogg.org/wiki/Autosomal_DNA_statistics>, which provides a table of the expected amount of DNA shared between people having certain genealogical relationships. The relevant rows of the table are provided below:
View text version of this table
According to this table and the 1025 cMs shared by the genetic matches, NYgreen3 is closest to the 12.5 percent of sharing and thus is predicted to be a great-grandparent, first cousin, great aunt/uncle/niece/nephew, or half-aunt/uncle/niece/nephew. Without more information, however, Allen is unable to determine the exact relationship.
Allen contacts the individual and learns that NYgreen3 is male, seventy-five years old, and adopted. The fifty-year difference between Allen and NYgreen3 (whose real name is Joseph) suggests that he is not a first cousin or a half-uncle/nephew. He is also unlikely to be Allen’s great-grandfather, as he was in a different country when Allen’s maternal grandparents were conceived. This suggests, therefore, that NYgreen3 (Joseph) is potentially Allen’s great-uncle, his maternal grandmother’s brother. Indeed, additional research shows that Joseph was raised near the town were Allen’s grandmother was born, shedding light on both Allen’s and Joseph’s family trees and potentially fostering a new meaningful family connection.
DNA in Action
Was She Native American?
Like many other families in the United States, particularly those with colonial ancestry, the Cornwall family has a long-standing oral tradition of a Native American ancestor. Andrea Cornwall is interested in genealogy and asks her paternal grandfather Caleb Cornwall about this ancestor. He tells her that according to family tradition, the Native American ancestor saved his grandfather Cornwall from death and then married him, and together they had two children.
Andrea would like to confirm—or reject—this story using DNA testing. She does a little research and learns that her great-great-grandmother, the Native American according to family legend, was named Abigail and died young during childbirth while giving birth to Caleb’s father.
Unfortunately, because this ancestor is neither a direct Y-DNA or mtDNA ancestor, Andrea can only do an atDNA test of her grandfather Caleb, her mother Susan (Caleb’s daughter), or herself. Since Caleb will have more of his grandmother’s atDNA, Andrea asks him to take an at DNA test. If Abigail was indeed a Native American as family legend reports, then Caleb’s DNA should report a significant percentage of Native American DNA (as much as 25 percent, potentially, since about 25 percent of his DNA will have come from Abigail).
When the test results come back from the testing company, Caleb receives the following ethnicity estimate together with his match list:
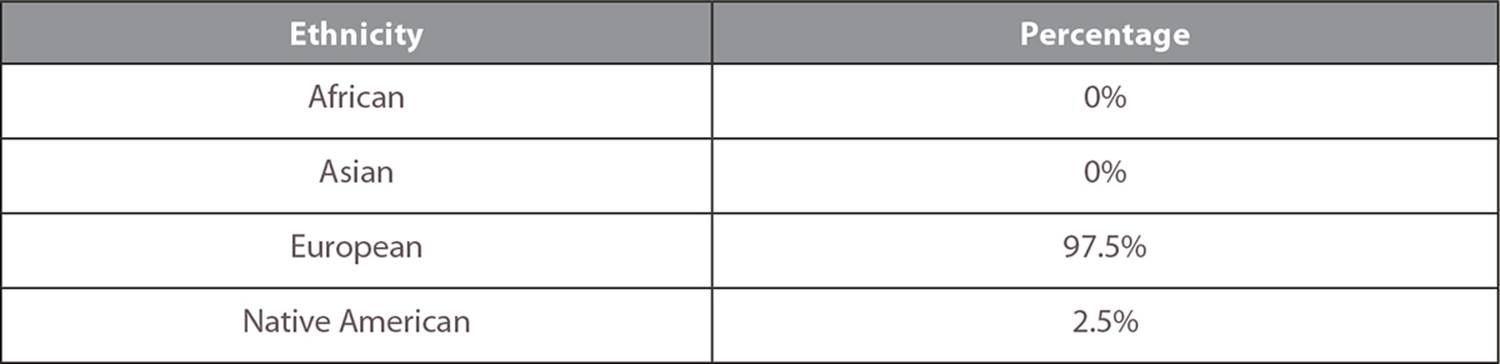
View text version of this table
Based on the results, it is unlikely that Andrea was Native American herself, since Caleb’s percentage of Native American ancestry is very low. She may have had Native American ancestors, but additional testing will be necessary to examine this possibility.