STANDARD APPROACH TO THE ECG
Normally, standardization is 1.0 mV per 10 mm, and paper speed is 25 mm/s (each horizontal small box = 0.04 s).
Heart Rate
Beats/min = 300 divided by the number of large boxes (each 5 mm apart) between consecutive QRS complexes. For faster heart rates, divide 1500 by number of small boxes (1 mm apart) between each QRS.
Rhythm
Sinus rhythm is present if every P wave is followed by a QRS, PR interval >0.12 s, every QRS is preceded by a P wave, and the P wave is upright in leads I, II, and III. Arrhythmias are discussed in Chaps. 131 and 132.
Mean Axis
If QRS is primarily positive in limb leads I and II, then axis is normal. Otherwise, find limb lead in which QRS is most isoelectric (R = S). The mean axis is perpendicular to that lead (Fig. 120-1). If the QRS complex is positive in that perpendicular lead, then mean axis is in the direction of that lead; if negative, then mean axis points directly away from that lead.

FIGURE 120-1 Electrocardiographic lead systems: The hexaxial frontal plane reference system to estimate electrical axis. Determine leads in which QRS deflections are maximum and minimum. For example, a maximum positive QRS in I which is isoelectric in aVF is oriented to 0°. Normal axis ranges from -30° to +90°. An axis > +90° is right-axis deviation and <30° is left-axis deviation.
Left-axis deviation (more negative than -30°) occurs in diffuse left ventricular disease, inferior MI; also in left anterior hemiblock (small R, deep S in leads II, III, and aVF).
Right-axis deviation (>90°) occurs in right ventricular hypertrophy (R > S in V1 and left posterior hemiblock (small Q and tall R in leads II, III, and aVF). Mild right-axis deviation is seen in thin, healthy individuals (up to 110°).
INTERVALS (NORMAL VALUES IN PARENTHESES)
PR (0.12–0.20 s)
• Short: (1) preexcitation syndrome (look for slurred QRS upstroke due to “delta” wave), (2) nodal rhythm (inverted P in aVF).
• Long: first-degree AV block (Chap. 131).
QRS (0.06–0.10 s)
Widened: (1) ventricular premature beats, (2) bundle branch blocks: right (RsR’ in V1, deep S in V6) and left [RR’ in V6 (Fig. 120-2)], (3) toxic levels of certain drugs (e.g., flecainide, propafenone, quinidine), (4) severe hypokalemia.
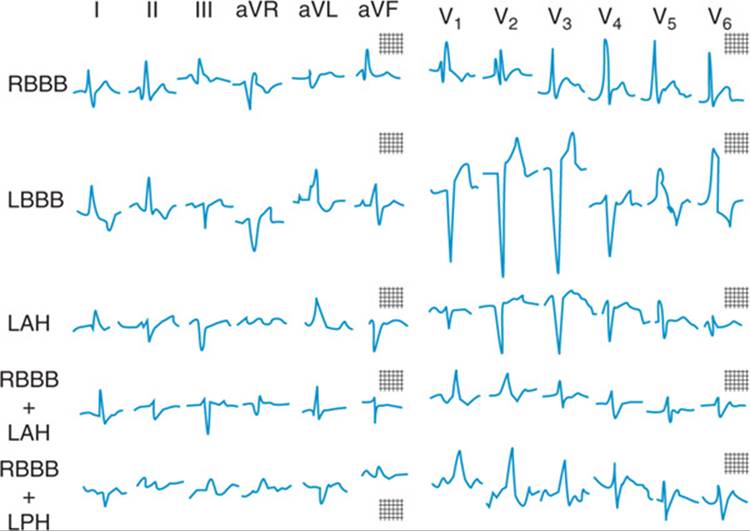
FIGURE 120-2 Intraventricular conduction abnormalities. Illustrated are right bundle branch block (RBBB); left bundle branch block (LBBB); left anterior hemiblock (LAH); right bundle branch block with left anterior hemiblock (RBBB + LAH); and right bundle branch block with left posterior hemiblock (RBBB + LPH).
QT (<50% of RR interval; corrected QT <0.44 s)
Prolonged: congenital, hypokalemia, hypocalcemia, drugs (e.g., class IA and class III antiarrhythmics, tricyclics).
HYPERTROPHY
• Right atrium: P wave >2.5 mm in lead II.
• Left atrium: P biphasic (positive, then negative) in V1, with terminal negative force wider than 0.04 s.
• Right ventricle: R > S in V1 and R in ![]() mm; deep S in V6; right-axis deviation.
mm; deep S in V6; right-axis deviation.
• Left ventricle: S in V1 plus R in V5 or ![]() mm or R in aVL >11 mm.
mm or R in aVL >11 mm.
Infarction (Figs. 120-3 and 120-4)
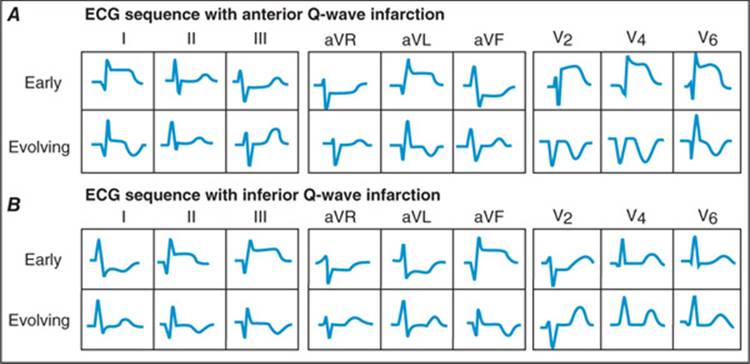
FIGURE 120-3 Sequence of depolarization and repolarization changes with A. acute anterior and B. acute inferior wall Q-wave infarctions. With anterior infarcts, ST elevation in leads I, aVL, and the precordial leads may be accompanied by reciprocal ST depressions in leads II, III, and aVF. Conversely, acute inferior (or posterior) infarcts may be associated with reciprocal ST depressions in leads V1 to V3. (After AL Goldberger: Clinical Electrocardiography: A Simplified Approach, 7th ed. St. Louis, Mosby/Elsevier, 2006.)
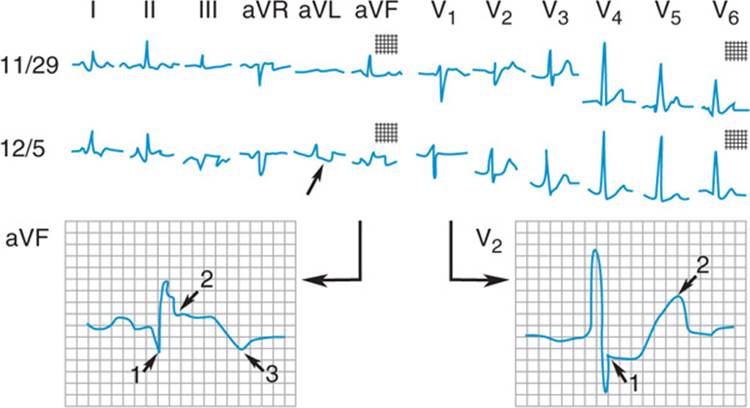
FIGURE 120-4 Acute inferior wall myocardial infarction. The ECG of 11/29 shows minor nonspecific ST-segment and T-wave changes. On 12/5 an acute myocardial infarction occurred. There are pathologic Q waves 1, ST-segment elevation 2, and terminal T-wave inversion 3 in leads II, III, and aVF indicating the location of the infarct on the inferior wall. Reciprocal changes in aVL (small arrow). Increasing R-wave voltage with ST depression and increased voltage of the T wave in V2 are characteristic of true posterior wall extension of the inferior infarction. (Reproduced from R.J. Myerburg: HPIM-12.
Following acute ST-segment elevation MI without successful reperfusion: Pathologic Q waves (>0.04 s and >25% of total QRS height) in leads shown in Table 120-1; acute non-ST-segment elevation MIshows ST-T changes in these leads without Q-wave development. A number of conditions (other than acute MI) can cause Q waves (Table 120-2).
TABLE 120-1 LEADS WITH ABNORMAL Q WAVES IN MI
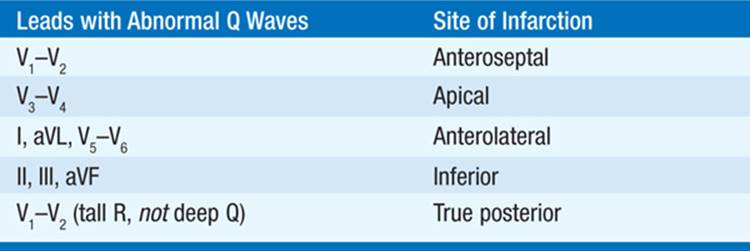
TABLE 120-2 DIFFERENTIAL DIAGNOSIS OF Q WAVES (WITH SELECTED EXAMPLES)

ST-T WAVES
• ST elevation: Acute MI, coronary spasm, pericarditis (concave upward) (see Fig. 125-1 and Table 125-2), LV aneurysm, Brugada pattern (RBBB with ST elevation in V1 – V2).
• ST depression: Digitalis effect, strain (due to ventricular hypertrophy), ischemia, or nontransmural MI.
• Tall peaked T: Hyperkalemia; acute MI (“hyperacute T”).
• Inverted T: Non-Q-wave MI, ventricular “strain” pattern, drug effect (e.g., digitalis), hypokalemia, hypocalcemia, increased intracranial pressure (e.g., subarachnoid bleed).

For a more detailed discussion, see Goldberger AL: Electrocardiography, Chap. 228, p. 1831 in HPIM-18.