
James A. Purdy
Modern anatomic imaging technologies, such as x-ray computed tomography (CT) and magnetic resonance imaging (MRI), provide a fully three-dimensional model of the cancer patient’s anatomy, which is often complemented with functional imaging, such as positron emission tomography (PET) or magnetic resonance spectroscopy. Such advanced imaging allows the radiation oncologist to more accurately identify tumor volumes and their relationship with other critical normal organs. Powerful x-ray CT-simulation and three-dimensional treatment-planning systems (3DTPS) have been commercially available since the early 1990s, and three-dimensional conformal radiation therapy (3DCRT) is now firmly in place as the standard of practice.1–3 In addition, advances in radiation treatment-delivery technology continue, and medical linear accelerators now come equipped with sophisticated computer-controlled multileaf collimator systems (MLCs) and integrated volumetric imaging systems that provide beam aperture and/or beam-intensity modulation capabilities that allow precise shaping and positioning of the patient’s dose distributions.3,4
FIGURE 9.1. Three-dimensional conformal radiation therapy (3DCRT), considered a “forward planning” CRT approach that uses an increased number of radiation beams that are shaped to conform to the target volume. To improve the conformality of the dose distribution, beam modifiers (e.g., wedges, partial transmission blocks, and/or compensating filters) are sometimes used. Shown is a prostate seven-field coplanar beam arrangement.
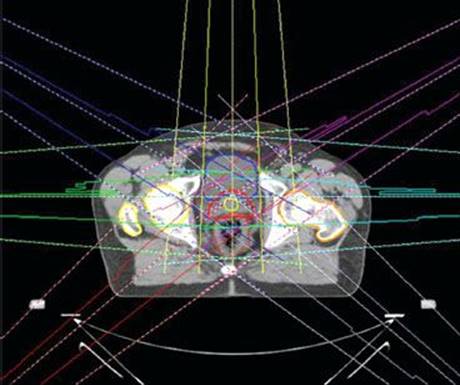
FIGURE 9.2. Intensity-modulated radiation therapy (IMRT) is considered an “inverse planning” conformal radiation therapy approach that can achieve even greater conformity than three-dimensional conformal radiation therapy by optimally modulating the individual beamlets that make up the radiation beams. IMRT dose distributions can be created to conform much more closely to the target volume, particularly for those volumes having complex/concave shapes, and also shaped to avoid critical normal tissues in the irradiated volume.

Conformal treatment plans generally use an increased number of radiation beams that are shaped to conform to the target volume. To improve the conformality of the dose distribution, conventional beam modifiers (e.g., wedges, partial transmission blocks, and/or compensating filters) are sometimes used. This “forward planning” approach used for 3DCRT (Fig. 9.1) is rapidly giving way to an “inverse planning” approach referred to as intensity-modulated radiation therapy (IMRT) (Fig. 9.2), which can achieve even greater conformity by optimally modulating the individual beamlets that make up the radiation beams.5,6 IMRT dose distributions can be created to conform much more closely to the target volume, particularly for those volumes having complex/concave shapes, and also shaped to avoid critical normal tissues in the irradiated volume. This increased conformality results in IMRT treatments being much more sensitive to geometric uncertainties than the two-dimensional or forward-planned 3DCRT approaches and has spurred the development of treatment machines integrated with advanced volumetric imaging capabilities,2,3,7,8 which is again pushing the frontiers in conformal radiation therapy (CRT) practice from IMRT to what is now referred to as image-guided IMRT, or simply image-guided radiation therapy (IGRT).2–4 Of course, the concept of image guidance is not revolutionary and really should be viewed as an evolutionary component in the development of CRT. In the past, many systems and/or processes have been developed to help better localize the patient for treatment (and hence conform the dose), including dedicated x-ray simulators, megavoltage radiographic port films, electronic portal imaging devices, implanted radiopaque markers, ultrasound imaging systems, and optical surface-tracking systems.9,10 Even the early isocentric cobalt-60 teletherapy machines in the 1960s came equipped with a kilovolt x-ray tube attached to the beam stop.
This chapter will review the critical components that make up the CRT planning and delivery process, focusing mainly on the forward-planned 3DCRT process. However, it should be understood that most of concepts and tasks discussed apply equally well to IMRT and IGRT, particularly with regard to target volume definition, plan evaluation, and many aspects of clinical quality assurance (QA). In addition, the reader should understand that the use of the terms two-dimensional (2D), three-dimensional (3D), and even four-dimensional (4D)11 as descriptors for the CRT planning and delivery process refers to a process and tools used and not merely to beam arrangements. For example, 3D treatment planning certainly does not require the use of “noncoplanar” beams—a common misconception—but does require the ability to plan and visualize volumetric dose distributions for such beam arrangements. Even today, newer tools are being developed that allow 4D, image-based CRT planning, that is, target volume segmentation and dose calculation in the presence of moving organs and target volumes. Thus, the reader will be able to appreciate the CRT approach much more fully if it is viewed as a constantly evolving planning and treatment delivery workflow process using ever-advancing computer software and technology.
 HISTORICAL DEVELOPMENT OF CONFORMAL RADIATION THERAPY AND 3D TREATMENT-PLANNING SYSTEMS
Conformational treatment methods were pioneered in the 1950s and 1960s by several groups, including Takahashi in Japan,12 Proimos13 and Trump, Wright, et al. in the United States,14 and Green et al. in Great Britain.15 Work continued into the 1970s, when several groups actually implemented computer-controlled radiation therapy, including a project of the Joint Center for Radiation Therapy in Boston led by Bjarngard and Kijewski16 and the Tracking Cobalt Project led by Davy et al.17 at the Royal Free Hospital in London.
Sterling et al.18,19 are credited with the first 3D approach to treatment planning (dose calculation and display). They demonstrated a technique by which a computer-generated film loop gave the illusion of a 3D view of the patient’s relevant anatomic features and the calculated isodose distribution (2D color washes) throughout a treatment volume. However, this effort did not result in a practical 3DTPS and was viewed as simply a demonstration project. The Rhode Island Hospital/Brown University group made the first real step in implementing a clinically usable 3DTPS based on a new type of display, called beam’s-eye view (BEV), which simulated the treatment planner’s viewing point from the perspective of the radiation source looking out along the axis of the radiation beam, similar to that obtained when viewing a simulation radiograph.20,21
The advent of CT spurred further development of 3D planning systems. In 1983, Goitein and coworkers reported on their system,22,23 which took advantage of CT and increased minicomputer capabilities. The system produced high-quality color BEV displays and could display radiographic images computed from the digital CT data; such computed radiographs are now called digitally reconstructed radiographs (DRRs). By the latter half of the 1980s, several other academic groups had developed 3D planning systems having powerful new features.24–27
In the 1990s, the commercial availability of 3DTPSs led to widespread adoption of 3D planning and CRT as the standard of practice. One of the keys to this development was a series of research contracts funded by the National Cancer Institute (NCI) in the 1980s and 1990s to evaluate the potential of 3D planning and to make recommendations to the NCI for future research in this area.28 Each of the research contracts funded a collaborative working group (CWG). The participating institutions in each CWG are shown in Table 9.1. Their charge was to evaluate various aspects of this new planning process and develop new software tools needed. The CWGs were composed of physicists, clinicians, and computer scientists. Many important developments and/or refinements in 3D planning came from these NCI research CWGs, particularly planning-evaluation software tools such as dose–volume histograms(DVHs),29,30 electronic view-box,31 and biologic effect models such as tumor control probability (TCP) and normal tissue complication probability (NTCP) models.32 Even IMRT has benefited from the CWG approach, as a consensus statement was developed in 2001 that helped clarify many issues and pointed to important research areas regarding that form of CRT.33
TABLE 9.1 NATIONAL CANCER INSTITUTE RESEARCH CONTRACTS IN SUPPORT OF THREE-DIMENSIONAL RADIATION THERAPY TREATMENT PLANNING

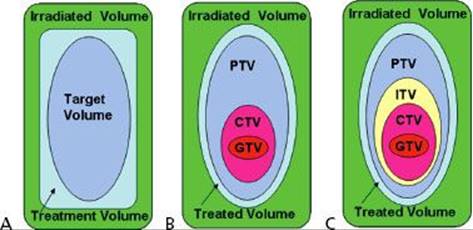
FIGURE 9.3. A: Schematic illustration of the boundaries of the volumes defined by International Commission on Radiation Units and Measures (ICRU) Report 29: target volume, treatment volume, and irradiated volume. B: Boundaries of the volumes defined by ICRU Report 50: gross tumor volume (GTV), clinical target volume (CTV), planning target volume (PTV), treated volume, and irradiated volume. C: Boundaries of the volumes defined by ICRU Report 62: GTV, CTV, internal target volume (ITV), PTV, treated volume, and irradiated volume.
VOLUME SPECIFICATION FOR CONFORMAL RADIATION THERAPY
The International Commission on Radiation Units and Measurements (ICRU) first addressed the issue of consistent volume and dose specification in radiation therapy with the publication of ICRU Report 29 in 1978.34 That report defined the target volume as the volume containing those tissues that are to be irradiated to a specified absorbed dose according to a specified time–dose pattern (Fig. 9.3A). It is interesting to note that this report (even though published in the 2D era) attempted to address spatial uncertainties by pointing out that the size and shape of a target volume may change during the course of a treatment and that one should take into account the following parameters when describing the target volume:
1. Expected movements (e.g., caused by breathing) of those tissues that contain the target volume relative to anatomic reference points (e.g., skin markings, suprasternal notch).
2. Expected variation in shape and size of the target volume during a course of treatment (e.g., urinary bladder, stomach).
3. Inaccuracies or variations in treatment setup during the course of treatment.
However, the report did not address the issues of coordinate systems (e.g., patient vs. treatment machine), and no attempt was made to define and explicitly separate the margins for the different types of uncertainties.
In addition to the target volume, ICRU Report 29 defined two other volumes: (a) the treatment volume and (b) the irradiated volume. These volumes were not based on anatomy, but instead were based on the dose distribution. The treatment volume was defined as the volume enclosed by the isodose surface representing the minimal target dose, and the irradiated volume was defined as the volume that receives a dose considered significant in relation to normal tissue tolerance (e.g., 50% isodose surface).
Report 29 defined organs at risk (OAR) as especially radiosensitive organs in or near the target volume whose presence influences treatment planning and/or prescribed dose. The report also recognized the importance of tissues outside the target area that received a dose higher than 100% of the specified target dose. This was defined as a hot spot and was considered clinically meaningful only if the corresponding isodose curve enclosed an area of at least 2 cm2 in a section.
In retrospect, ICRU Report 29 recommendations were well suited for the technology of the 1970s and 1980s, that is, using a conventional simulator to generate a planning radiograph for designing beam portals based on bony and soft tissue landmarks for standardized beam arrangement techniques applied to whole classes of comparable patients. Several generations of radiation oncologists were trained using this nomenclature and method, and the ICRU recommendation for reporting dose and volumes helped advance radiation oncology.
In 1993, the ICRU updated its recommendations for specifying dose/volume in Report 50, which were well suited for conformal therapy.35 The target volume definition was separated into three distinct volumes: (a) visible tumor, that is, gross tumor volume (GTV), (b) a volume to account for uncertainties in microscopic tumor spread, that is, clinical target volume (CTV), and (c) a volume to account for geometric and other uncertainties, that is, planning target volume (PTV), as illustrated in Figure 9.3B.
The GTV and CTV are anatomic-clinical concepts that should be defined before a choice of treatment modality and technique is made. Labels or subscripts with the GTV nomenclature can be used to distinguish between primary disease and other areas of macroscopic tumor involvement such as involved lymph nodes that are visible on imaging studies (e.g., GTVprimary and GTVnodal, or GTV-T and GTV-N). Similarly, the GTV together with this surrounding volume of local subclinical involvement that defines the CTV can be denoted as CTV-T. Note that even if the GTV has been removed by radical surgery, the volume can be designated as CTV-T. In specifying the CTV, the physician must consider not only microextensions of the disease near the GTV, but also the natural avenues of spread for the particular disease and site, including lymph node, perivascular, and perineural extensions. These may be designated CTV-N (and, if necessary, CTV-N1, CTV-N2, etc.).
The PTV is defined by specifying the margins that must be added around the CTV to manage the effects of organ, tumor and patient movements, inaccuracies in beam and patient setup, and any other uncertainties. The PTV is a static, geometric concept used for treatment planning and for specification of dose. Its size and shape depend primarily on that of the GTV/CTV and the effects caused by internal motions of organs and the tumor, technical aspects of treatment technique (e.g., patient fixation). The PTV can be considered a 3D envelope in which the tumor and any microscopic extensions reside and move. Once the PTV is defined, appropriate beam sizes to account for penumbra and beam arrangements must be selected to ensure the desired dose coverage of the PTV. Note that multiple PTVs may be defined for a patient’s radiation therapy treatment. For example, it is common practice to plan a higher dose to the PTV enclosing the GTV and a lower dose to the PTV containing the CTV. Such planning volumes are typically subscripted using the dose level prescribed; for example, PTVs for 66 Gy and 54 Gy can be represented as PTV66and PTV54, respectively.
ICRU Report 50 essentially retained the definition of the two dose volumes defined in ICRU Report 29, changing the treatment volume name to treated volume and refining the definition as the volume enclosed by an isodose surface, selected and specified by the radiation oncologist as being appropriate to achieve the purpose of treatment (e.g., tumor eradication, palliation), and the irradiated volume as that tissue volume that receives a dose that is considered significant in relation to normal tissue tolerance.
Report 50 refined the definition of organs at risk as normal tissues whose radiation sensitivity may significantly influence treatment planning and/or prescribed dose. The report did state that any possible movement of the organ at risk during treatment, as well as uncertainties in the setup during the whole treatment course, must be considered, but did not provide a method to do so.
The hot spot definition was modified to be a volume outside the PTV that received a dose larger than 100% of the specified PTV dose. This was considered clinically meaningful only if the minimum diameter exceeded 15 mm (note: previously it had been 2 cm2). However, if the hot spot occurs in a small organ, such as the optic nerve, a dimension smaller than the recommended 15 mm should be considered.
As previously stated, Report 50 was well suited to conformal therapy, and it stimulated broad interest in the radiation oncology community. However, irradiation techniques continued to evolve (e.g., IMRT), and advances in imaging procedures (e.g., PET, MRI) provided even more information on functionality, the location, shape, and limits of tumor/target volumes, and organs at risk. In response to these developments, the ICRU in 1999 published Report 62,36 which expanded on some of the definitions and concepts of Report 50 and took into account the consequences of the technical and clinical progress referred to previously. However, it should be clearly understood that Report 62 was intended to complement the recommendations contained in Report 50 and not to replace it.
ICRU Report 62 refined the definition of PTV by introducing the concept of an internal margin to take into account variations in size, shape, and position of the CTV in reference to the patient’s coordinate system using anatomic reference points, as well as the concept of a setup margin to take into account all uncertainties in patient–beam positioning in reference to the treatment machine coordinate system. Identification of these two types of margins is needed, as they compensate for different types of uncertainties and refer to different coordinate systems. Internal margin uncertainties are due to physiologic variations (e.g., filling of rectum, movements due to respiration) and are difficult or almost impossible to control from a practical viewpoint. Setup margin uncertainties are related largely to technical factors that can be dealt with by more accurate setup and immobilization of the patient and improved mechanical stability of the machine. However, exactly how these margins should be combined is still not clear. This point will be discussed further in a later section, but for now it is necessary to understand that the selection of an overall margin and delineation of the border of the PTV typically involves a compromise that requires the experience and the judgment of the radiation oncologist and the treatment-planning team.
ICRU Report 62 defines the volume formed by the CTV and the internal margin as the internal target volume (ITV) (Fig. 9.3C). The ITV represents the movements of the CTV referenced to the patient coordinate system and is specified in relation to internal and external reference points, which preferably should be rigidly related to each other through bony structures. In cases not involving significant internal organ motion, the radiation oncologist can simply ignore having to explicitly define the ITV and use only the GTV, CTV, and PTV concepts. However, in cases involving significant motion, such as often is the case with lung cancer, the ITV concept has proven useful and should be used.37
TABLE 9.2 SUMMARY OF THE INTERNATIONAL COMMISSION ON RADIATION UNITS AND MEASUREMENTS (ICRU) NOMENCLATURE FOR VOLUMES (1970S TO PRESENT)

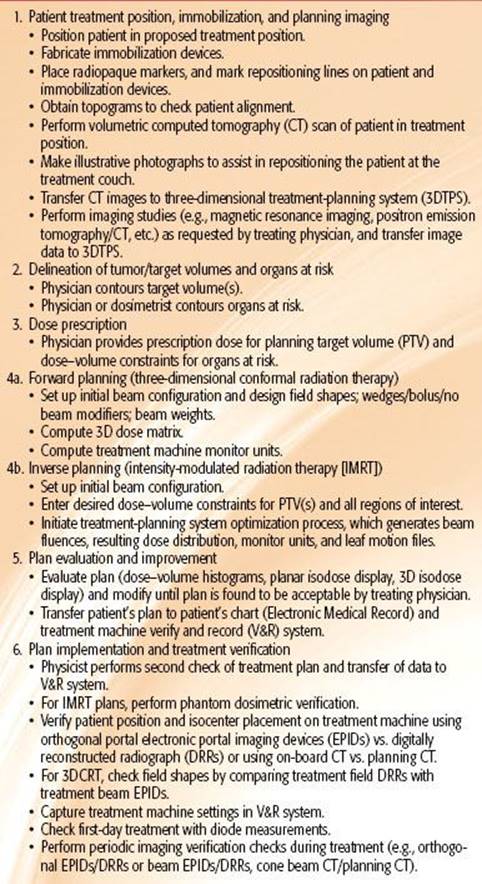
TABLE 9.3 CONFORMAL RADIATION THERAPY PROCESS
ICRU Report 62 refined the definition of the two dose volumes defined ICRU Report 50 as follows:
The treated volume is the tissue volume that (according to the approved treatment plan) is planned to receive at least a dose selected and specified by radiation oncology team as being appropriate to achieve the purpose of the treatment, e.g., tumor eradication or palliation, within the bounds of acceptable complications.
The irradiated volume is the tissue volume that receives a dose that is considered significant in relation to normal tissue tolerance.
Report 62 refined the definition of organs at risk as normal tissues (e.g., spinal cord) whose radiation sensitivity may significantly influence treatment planning and/or prescribed dose. The report also included a discussion regarding a system of classifying organs at risk as “serial,” “parallel,” or “serial-parallel.” Report 62 also addressed what was perhaps the most criticized limitation of Report 50, which was that it did not provide a method to account for organ-at-risk movements and changes in shape and/or size, as well as setup uncertainties. To account for such spatial uncertainties, Report 62 introduced the concept of the planning organ at risk volume (PRV), in which a margin is added around the organ at risk to compensate for that organ’s geometric uncertainties. The PRV margin around the organ at risk is analogous to the PTV margin around the CTV. The introduction of the PRV concept is timely, as its use is even more important for those conformal therapy cases involving IMRT because of the increased sensitivity of this type treatment to geometric uncertainties. For example, it is common practice to add a 0.5-cm rind around the spinal cord contour. Note that the PTV and the PRV may overlap, and often do so, which implies searching for a compromise in weighting the importance of each in the planning process. A summary of the ICRU volume nomenclature recommendations per report is presented in Table 9.2.
CONFORMAL RADIATION THERAPY PLANNING PROCESS
As previously stated, CRT treatment planning and delivery should be looked at as a process and the tools used. This process is summarized in Table 9.3 and includes (a) establishing the patient’s treatment position, constructing a patient repositioning immobilization device when needed, and obtaining a volumetric image data set of the patient in treatment position; (b) contouring target volume(s) and organs at risk using the volumetric planning image data set; (c) specifying a prescription dose for the PTV and dose–volume constraints for any OARs; (d1) for 3DCRT forward planning, determining beam orientation and designing beam apertures and computing a 3D dose distribution according to the dose prescription; (d2) for IMRT inverse planning, setting up initial beam orientations and entering optimization parameters (i.e., dose–volume constraints for PTV[s] and all regions of interest) and initiating the TPS optimization process, which generates beam fluences, resulting dose distribution, monitor units, and leaf motion files; (e) evaluating the treatment plan and, if needed, modifying the plan (e.g., beam orientations, apertures, beam weights, etc.) until an acceptable plan is approved by the radiation oncologist; and (f) implementing the approved plan on the treatment machine and verifying the patient’s treatment using appropriate QA procedures throughout the treatment. All of these tasks make up the CRT process and are discussed in the ensuing sections.
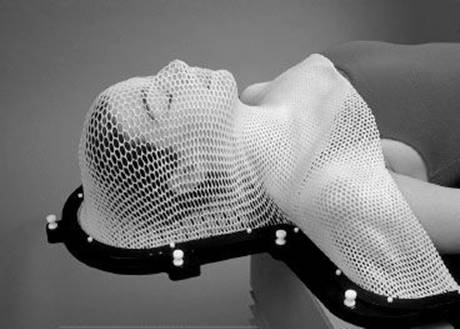
FIGURE 9.4. Example of immobilization repositioning system used for patients undergoing radiation therapy for head and neck cancer. It should be clearly understood that being able to accurately reposition the patient and account for internal organ movement in order to accurately deliver the planned dose distribution is one of the most important steps in the conformal therapy process. (Courtesy of MEDTECH, Inc., Orange City, IA.)
Patient Treatment Position and Immobilization, and Planning of Imaging
In the initial part of the CRT process (preplanning), the proposed treatment position of the patient is determined, and the immobilization device to be used during simulation/treatment is selected. In should be clearly understood that repositioning patients and accounting for internal organ movement for fractionated radiation therapy in order to accurately reproduce the planned dose distribution remain difficult technical aspects of the CRT process. Errors may occur if patients are inadequately immobilized, with resultant treatment fields inaccurately aligned from treatment to treatment (interfraction). In addition, patients and/or their tumor volume may also move during treatment (intrafraction) because of either inadequate immobilization or physiologic activity. Accounting for all of the uncertainties in the CRT planning and delivery process remains a challenge for radiation oncology, and research and development is ongoing.
Determining the treatment position of the patient and constructing the immobilization device are done in a dedicated radiation therapy CT-simulator facility. A radiation therapy CT-simulator consists of a diagnostic-quality CT scanner, laser patient positioning/marking system, virtual simulation 3D treatment-planning software, as well as various digital display systems for viewing the DRRs.38,39 The CT scanner is used to acquire a volumetric planning CT scan of a patient in treatment position. The use of intravenous or other contrast to help delineate target volumes needs to be considered during simulation in some cases. CT topograms should be generated first and reviewed prior to acquiring the planning scan to ensure that patient alignment is correct, with adjustments to be made if needed. Radiopaque markers can be placed on the patient’s skin and the immobilization device to serve as fiducial marks to assist in any coordinate transformation needed as a result of 3D planning and eventual plan implementation. An example of a typical immobilization repositioning system used for patients undergoing radiation therapy for head and neck (H&N) cancer is shown in Figure 9.4.
Planning CT scan protocols are tumor site dependent and typically range from 2 to 5 mm in slice thickness and 50 to 200 slices. In general, a 3-mm slice thickness provides adequate-quality DRR. In some sites, such as those of H&N cancer, slice thicknesses of 1 mm are often needed for delineation of very small volumes, such as the optic chiasm and the optic nerves. The same holds true for optimal reconstruction of the position of any implanted markers used, such as in prostate cancer radiation therapy.
The planning CT data set is typically transferred to a 3DTPS via a computer network. The planning CT data set provides an accurate geometric model of the patient, as well as the electron density information needed for the calculation of the 3D dose distribution that takes into account tissue heterogeneities.
Delineation of Tumor/Target Volumes and Organs at Risk
Delineation of tumor/target volume and organs at risk contours using the volumetric CT data set is typically performed by the radiation oncologist and the medical dosimetrist working as a team. The CT data are displayed at the 3DTPS workstation (Fig. 9.5), and contours are drawn manually by the radiation oncologist/dosimetrist, most often using a computer mouse or stylus on a slice-by-slice basis. Some OARs with distinct boundaries (e.g., skin, lung) can be contoured automatically, with only minor editing required; others (e.g., brachial plexus) require the hands-on effort of the radiation oncologist.40 With modern 3DTPS image segmentation software, contouring generally takes 0.5 to 1 hour, depending on the disease site. However, for some complex sites, such as H&N cancer, where many OARs and complex tumor/target volumes are the norm, this task can take several hours.
CT is still the principal source of imaging data used for defining the GTV for most sites, but this imaging modality presents several potential pitfalls. First, when contouring the GTV, it is essential that the appropriate CT window and level settings be used in order to determine the maximum dimension of what is considered potential gross disease (Fig. 9.6). Second, for those treatment sites in which there is considerable organ motion, such as for tumors in the thorax, CT images do not correctly represent either the time-averaged position of the tumor or its shape, and hence newer 4D CT technology must be used.41–43 This can be understood by appreciating the fact that single or few-slice CT simulators rely almost exclusively on the use of fast spiral CT technology and thus acquire data essentially in 2D and combine them to construct a 3D matrix. This has the effect of capturing the tumor cross-section images at particular positions in the breathing cycle. If the tumor motion is significant, different, and possibly noncontiguous, transverse sections of the tumor could be imaged at different points of the breathing cycle, leading to volume uncertainties. The interpolation process in spiral CT technology adds further to the uncertainty. As a result, the 3D reconstruction of the GTV from temporally variant 2D images often results in a poor representation of the tumor and its motion. Currently, 4D CT technology has become the standard for CT simulators, making it possible to capture images in each phase of the respiratory cycle.44,45 In addition, other technologies and methodologies to explicitly help manage the movements induced by the respiratory motion (to the order of <5 mm during treatment preparation and delivery) continue to be developed, including respiratory-gated techniques, respiration-synchronized techniques, breath-hold techniques, and forced shallow-breathing methods.46
Delineating the CTV is even more difficult and must be done by the radiation oncologist based on clinical experience (and/or the use of published CTV atlases for certain clinical sites) because current imaging techniques cannot be used to directly detect subclinical tumor involvement. This field has seen a virtual explosion in the use of multimodality imaging over the last decade, and radiation oncologists have developed considerable imaging expertise in order to accurately define GTVs and be able to define nonimaged CTVs. However, the need for a higher level of image-based cross-sectional anatomy training in this field is well recognized.47
FIGURE 9.5. Advanced image-segmentation software provides tools for radiation oncologists and treatment planners to determine critical structures and tumor and target volumes for three-dimensional planning. Computed tomography (CT) data are displayed, and contours are drawn by the treatment planner/radiation oncologist around the tumor, target, and normal tissues on a slice-by-slice basis, as seen in upper right panel. At the same time, planar images from both anteroposterior and lateral projections are displayed in bottom right and left panels. Upper left panel shows positron emission tomography scan data with overlying contours after image registration with the CT data.

FIGURE 9.6. Computed tomography (CT) slice for patient with lung cancer showing that the appropriate CT window and level settings (right frame) must be used to determine the maximum dimensions of the gross tumor volume (GTV). Note that a much smaller GTV would have been contoured with the settings used in the left frame. (From Purdy JA. Advances in three-dimensional treatment planning and conformal dose delivery. Semin Oncol 1997;24:655–672.)
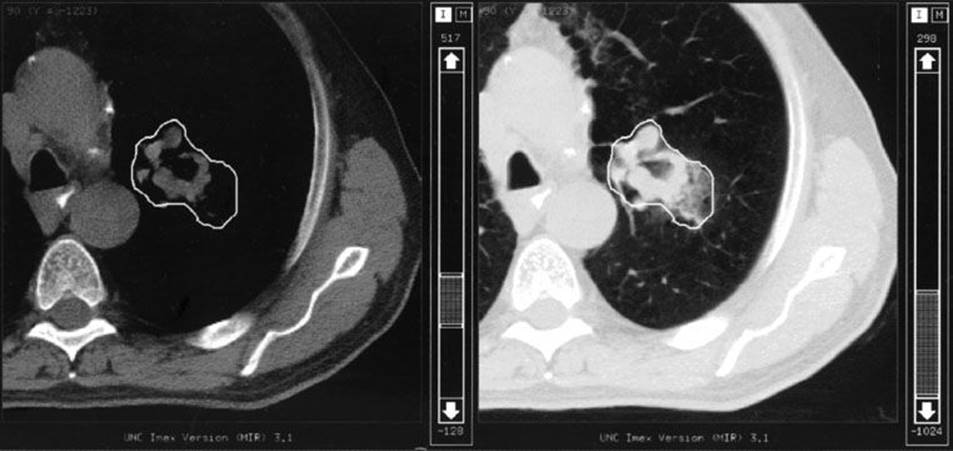
FIGURE 9.7. Computed tomography images of patient with prostate cancer showing the contour outlines for the gross tumor volume (GTV), planning target volume (PTV), bladder, and rectum. The physician made the decision that no additional margin around the prostate for the clinical target volume (CTV) was required (i.e., CTV = GTV). Note that a nonuniform margin around the GTV/CTV was used to define the PTV in the region of the rectum (see middle frame). Also note the additional PTV contours needed to cap the GTV/CTV (upper left and lower right frames). (From Purdy JA. Three-dimensional treatment planning and conformal dose delivery: a physicist’s perspective. In: Mittal BB, Purdy JA, Ang KK, eds. Advances in radiation therapy. Boston: Kluwer Academic Publishers, 1998:1–33.)

The PTV margin is specified by the radiation oncologist, often in consultation with the radiation oncology physicist and/or therapist. In most occasions, it is based on published clinical experience, that is, not calculated based on measurements performed by the department for a particular treatment machine/technique and team. Van Herk and colleagues reported extensively on the influence of systematic and random errors/variations on the required margins to account for setup error and organ motion and developed margin recipes for calculating individualized (for a department, machine, and team) margins as given by the following equation48,49:

where σ is the standard deviation of the systematic errors and σ is the standard deviation of the random errors.
When defining the PTV, the radiation oncologist should account for the asymmetric nature of positional uncertainties (Fig. 9.7). For example, it is recognized that prostate organ motion and daily setup errors may be anisotropic (side-to-side or rotational shifts of the position of the patients are likely to have a different result compared to movement in the anteroposterior direction). Thus, the PTV margin around a CTV generally should not be uniform.
Typically, when the beam portal is defined, additional margin beyond the PTV is typically required to obtain dose coverage because of beam penumbra and treatment technique. This emphasizes that treatment portal margins in relation to the PTV must be set according to the dosimetric characteristics of the beams being used. Typically, a 5-mm margin (portal edge to PTV) is a good starting point, which can be increased if needed, but one must be knowledgeable about the characteristics of the actual beams used to make this starting-point determination. An additional point to understand is that in the case of coplanar treatment techniques, the margins required across the plane of treatment and the margins orthogonal (say superior–inferior) to this plane will be different. To clarify this point, consider a pelvic four-field axial technique as an example. Portions of the lateral aspects of the PTV that are in the low-dose regions (near the penumbra) of the anterior–posterior and posterior–anterior fields will be in the high-dose regions (well away from the beam penumbra) of the lateral fields. However, the superior and inferior aspects of the PTV will always be in the same low-dose regions of all four fields, so there will be no dose filling from any of the fields. Thus, a larger portal margin in the inferior–superior dimension is needed to ensure that the prescription isodose resulting from all beams contains the PTV, while the lateral and anterior–posterior portal margins for each field may be reduced due to the other beams filling in the dose. The same holds true for the portals of the boost fields used in the so-called “integrated boost technique,” in which the beams used for treating the large volume fill up the dose in the buildup region of the boost volume. Last, the size of the margins will also be affected by the relative beam weighting. Hence, making hard rules about margin sizes is impossible and requires some planning iteration to find the right mix of beam margins.
When a PTV overlaps with a contoured normal structure, it is important to be explicit as to which volume the overlapping voxels are assigned for optimization purposes and for DVH calculations. Planning systems should allow the overlapping voxels to be included in both volumes for plan evaluation and reporting purposes. This ensures that the clinician is aware of the potential for the high-dose region to include part of the normal structure as well as the PTV when reviewing the DVHs.
In addition, most 3DTPS cannot accurately account for a PTV contour that extends outside the skin surface, resulting in a DVH that does not reflect clinical reality due to the lack of dose generated in air and in the buildup region just below the skin. In those cases, the best solution is to delineate the PTV 5 mm below the skin surface. This will also help reduce acute skin reactions by preventing the optimization process from increasing the skin dose to excessive levels. In all cases, however, the treating physician should be aware of this approximation when setting or approving actual field margins.
All of the issues discussed in this section point out the fact that the PTV/PRV concept is a useful tool that simplifies accounting for geometric uncertainties. However, its use does give rise to several dilemmas. Particularly important is the loss of actual tumor and normal organ volume information reported for researchers developing TCP and NTCP models. Although it does not appear possible to totally eliminate the PTV concept at this time, it does appear possible to use smaller margins for some sites if more frequent imaging or other technical innovation is used to reduce geometric uncertainties. For example, for prostate cancer, the use of daily imaging and other technologies to relocate the target volume in reference to the machine isocenter does allow for a smaller margin for the PTV.10,50 However, one must still be prudent in the amount of margin reduction for the prostate PTV when using these technologies. The different methods include various tradeoffs ranging from treatment machine control, which is not dependent on the patient, to systems that are completely dependent on the patient. Again, regardless of which technique is used to reduce the overall PTV margin, one must be prudent in the amount of margin reduction.
Dose Prescription
Dose prescription is the responsibility of the radiation oncologist, generally using institutional protocols based on evidence published in the literature combined with institutional experience. Typically, the CRT prescription is specified as a dose at or near the center of the PTV or (particularly for IMRT) as a dose covering a certain percentage of the PTV—for example, D95%, a dose that covers 95% of the PTV. Because the resulting dose distribution can be quite different depending on the dose prescription methodology, it is imperative that publications provide a clear and unambiguous description of the dose specification for the radiation treatment results being reported. The ICRU recently updated their recommendations for dose specification, and these will be discussed in a later section.51
Conformal Planning
For 3D CRT planning, beams can be arranged and beam apertures shaped with MLC leaves or shielding blocks to help conform the prescribed dose to the PTV and avoid OARs using BEV displays. This “forward planning” approach to CRT has now been supplemented—but not replaced—by an “inverse planning” approach as used for IMRT, which can achieve even greater conformity and OAR dose avoidance.
Forward Planning: 3DCRT
Design of the beam arrangement is the next step in the planning process for 3DCRT. The ability to orient beams in 3D allows one to develop treatment plans that use noncoplanar beams. However, when noncoplanar beam arrangements are used, care must be taken to avoid the selection of gantry and couch angles that results in table/gantry collisions or a conflict with other treatment room restrictions. The BEV and the DRR display,23,52 as shown in Figure 9.8, allows the planner to easily view the target volume and the organs at risk so that shielding blocks or MLC apertures can be drawn using a computer mouse or, as available with most current 3DTPS software versions, automatically generated with a chosen margin around the selected volume. DRRs also provide planar reference images that can be used in facilitating the plan implementation and treatment verification phases of CRT.
Inverse Planning: IMRT
The major differences between 3DCRT forward planning and IMRT inverse planning is the use of a computer optimization program that requires a formal description of the requirements using a mathematical objective function and constraints that are used by the program to find the solution. For example, after the design of the initial beam geometry, the physician/treatment planner puts into the TPS the desired dose–volume constraints for the PTVs and all OARs. The TPS optimization algorithm then divides each beam into many small beamlets (i.e., pencil beams that together make up the IMRT beam) and then iteratively alters the beamlet intensities until the 3D dose distribution best conforms to the a priori–specified dose–volume objectives. After the optimal beam intensities and resulting dose distribution have been determined, the TPS then calculates the MLC leaf sequence motions that will achieve this dose distribution and the dose recalculated. Typically there may be some differences in the optimized dose distribution and the final dose distribution that can be delivered with the computer-controlled MLC system, but this difference is usually acceptable.
Dose Distribution Calculation
A rectilinear coordinate system affixed to the patient 3D CT image set is typically used for calculating the dose distribution. This “patient or CT system” coordinate system typically has its x-axis along the horizontal axis of the transverse CT images, the y-axis along the vertical axis, and the z-axis along the couch motion. Contour points are specified as a sequence of points having x, y, z coordinates in this system. The center of each voxel in the 3D CT image matrix is computed relative to the same coordinate system and is used to look up the relative electron density values that are related to the CT numbers (see later discussion). The selection of grid spacing for the 3D dose matrix is an important consideration regarding dose computational accuracy, calculation speed, and computer hardware requirements. Drzymala et al.30 pointed out that a 2% dose accuracy or 2-mm isodose positional accuracy can generally be achieved with a grid spacing of 5 mm. However, in regions of high-dose gradients, a finer grid is typically needed, which creates larger computer files and increases the 3DTPS memory and mass storage requirements.
The reader should also understand that CT numbers are not used directly in photon dose calculations. Instead, the CT numbers are correlated with the electron density of the corresponding tissues at each voxel relative to the electron density of water.53 This is because Compton scattering is the dominant mode of interaction for the type of photon beam used in radiation therapy (cobalt-60 through 25-MV x-rays), and the absorption and scattering of photons in tissue depends primarily on the electron density of the tissue. Errors in CT numbers can result in inaccurate dose calculations. Generally, however, errors of 10% or less in electron density (CT numbers) will not result in significant errors in the dose distribution.53
Details on specific dose calculation algorithms are discussed in a separate chapter, and so only issues pertinent to the CRT planning process are discussed in this section. In the past, dose calculation algorithms were traditionally based on parametrizing dose distributions measured in water phantoms under standard conditions and applying correction factors to the beam representations for the nonuniform surface contour of the patient or the obliquity of the beam, tissue heterogeneities, and beam modifiers such as blocks, wedges, and compensator. However, more-advanced models, such as the superposition/convolution method, have been developed for CRT planning.53 It is my opinion that heterogeneity-corrected 3D treatment plans generated using such advanced algorithms should be standard of practice today for CRT planning. The study by Frank et al.54 provides a clear method for safely transitioning from a clinical experience based on planning assuming a homogeneous unit density patient to a heterogeneous patient model.
FIGURE 9.8. Beam’s-eye-view (BEV) and digitally reconstructed radiograph (DRR) display of three-dimensional radiation therapy treatment planning for a prostate cancer patient. BEV display is useful in identifying best gantry, collimator, and couch angles at which to irradiate the target and avoid irradiating adjacent normal structures by interactively moving patient and treatment beam. Critical structures and target volumes are outlined on the patient’s serial computed tomography sections. Contours are seen in perspective, as though the observer’s eye is at the radiation source looking out along the axis of the radiation beam. The beam shape is defined by multileaf collimator (MLC). (From Purdy JA. Advances in three-dimensional treatment planning and conformal dose delivery. Semin Oncol 1997;24:655–672.)

Plan Evaluation and Improvement
The 3DCRT plan evaluation/improvement process involves an iterative, interactive approach. Typically, the initial beam arrangement has been selected based primarily on clinical experience using BEV displays. The generated dose distribution is reviewed by the planner/physician, and the beam arrangement is then modified based on the review of DVHs (Fig. 9.9) and multilevel 2D displays showing isodose lines superimposed on CT images (Fig. 9.10); sometimes the display is in the form of a color wash, that is, a spectrum of colors superimposed on the anatomic information.
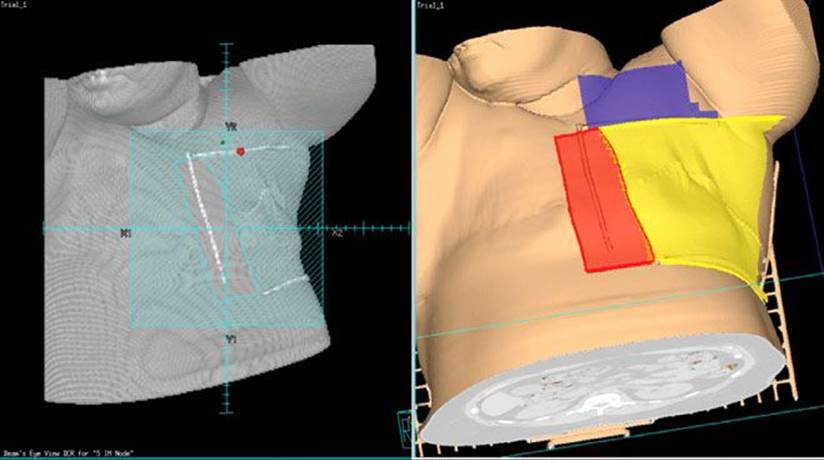
Another powerful display feature in a 3DTPS is the “room-view” or room’s-eye-view (REV), in which the planner can simulate any arbitrary viewing location within the treatment room.26,55 The REV display is used to display “dose clouds” along with rendered PTVs and OARs. Hot or cold spots that occur in the volumes of interest are clearly seen, as shown in Figure 9.11. Another valuable REV display is the so-called “skin view,” in which the beam aperture projection can be clearly seen on the skin of the (virtual) patient (Fig. 9.12).
The planned dose distribution approved by the radiation oncologist is most often one in which a uniform dose is delivered to the target volume (e.g., +7% and –5% of the prescribed dose) with doses to critical structures held below tolerance levels,56–59 as well within the constraints for the absolute maximum dose, a median dose, or a volume (e.g., V20Gy) that has been specified by the radiation oncologist.
FIGURE 9.9. Example of a treatment-planning system display (Pinnacle, Philips Medical Systems, Highland Heights, OH), showing the cumulative dose volume histograms for a typical prostate cancer patient’s plan: the prostate PTV (red) and multiple OARs (penile bulb, magenta; right femur, yellow; left femur, orange; rectum, brown; bladder, blue); also shown are associated dose statistics for the various defined volumes.
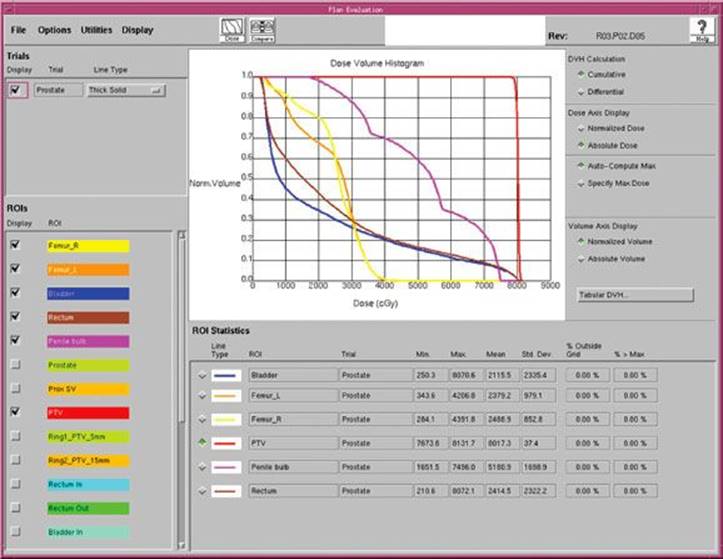
FIGURE 9.10. Dose distribution displays for a patient with prostate cancer showing coronal, sagittal, and two-axial computed tomography (CT) sections with superimposed color-coded isodose lines (73.8, 60, 50, and 40 Gy). Vertical and horizontal lines displayed on each CT section indicate the positions of each section. Evaluating volumetric three-dimensional dose distributions using only this type of two-dimensional display is difficult and time-consuming.

FIGURE 9.11. Room’s-eye-view (REV) three-dimensional (3D) isodose surface display with real-time interactivity is a valuable tool for evaluation of 3D dose distributions in terms of adequate coverage of target volumes and sparing of critical structures. The REV display enables radiation oncologists to view target volume or normal tissue volume with superimposed isodose surfaces or “dose clouds” from any arbitrary viewing angle. Shown is a four-panel REV display of the 73.8-Gy isodose volume, the prostate planning target volume (PTV), bladder, and rectum of a patient with prostate cancer treated with a six-field technique. The location of the PTV region not covered by the specified dose level is easily discernible using the REV display.
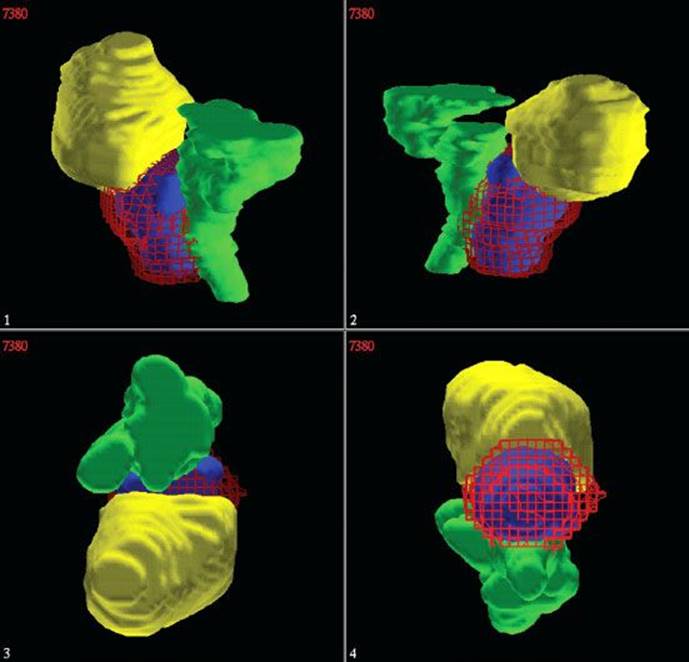
FIGURE 9.12. Room’s-eye-view (REV) display showing simulated skin surface for a breast cancer patient undergoing radiation therapy using tangential, supraclavicular, and internal mammary fields. Beam aperture projection can be clearly seen on the skin of the (virtual) patient.
Plan Implementation and Treatment Verification
Once the treatment plan has been designed, evaluated, and approved, documentation for plan implementation must be generated. Documentation includes beam parameter settings transferred to the treatment machine verify and record (V&R) system, including multileaf collimator parameters communicated over a network to the treatment machine’s computer system that controls the MLC system, DRR generation, and transfer to the machine’s image database.
In the initial period of implementing CRT techniques (or of implementing nonconventional beam arrangements) in the clinic, a verification simulation procedure is commonly done to confirm the geometric validity and accuracy of the 3D treatment plan. DRRs generated by the 3DTPS are used for comparison with the verification simulation radiographs to confirm the correctness of the beam orientations in the physical implementation. When a beam orientation cannot be simulated, orthogonal radiographs may be taken and compared with similar DRRs to ensure correct isocenter positioning. The optical distance indicator is also useful in assessing the correctness of the setup of a particular beam. Documentation provides the depth of isocenter below the skin surface on the central ray of the beam, which can then be compared with the isocenter depth measured on the simulator or treatment machine after the beam is set up using the couch and gantry positions specified by the treatment plan. Currently, however, many modern radiotherapy departments no longer have a functional conventional simulator in clinical use, and many of these types of checks are done on the treatment machine prior to first treatment.
QA checks used to confirm the validity and accuracy of the CRT plan typically include an independent check of the plan and monitor unit calculation by a physicist, isocenter placement check on the treatment machine using orthogonal radiographs, or, in some occasions a cone beam computed tomography comparison with the planning CT. Depending on the irradiated site and the departmental protocol, field aperture check using portal films or electronic portal images, and diode or metal oxide semiconductor field-effect transistor (MOSFET) in vivo dosimetry check, can be performed as well. Most important, careful scrutiny must be given to the input of data into the V&R system to assure that it is correct. These checks will be discussed in more detail in a separate section.
Dose Reporting and Dose Prescription
ICRU Reports 50 and 62 define a series of doses, including the minimum, maximum, mean dose, and ICRU reference dose (defined at the ICRU reference point) for reporting dose relevant to CRT. The ICRU reference point for a particular treatment plan should be chosen based on the following criteria: It should be (a) clinically relevant and defined in an unambiguous way, (b) located where the dose can be accurately determined, and (c) located in a region where there are no steep dose gradients. In general, this point should be in the central part of the PTV. In cases in which the treatment beams intersect at a given point, it is recommended that the intersection point be chosen as the ICRU reference point.
ICRU Report 8351 updates the previous ICRU recommendation on CRT dose reporting and recommends moving from single-spatial-point reporting (i.e., the ICRU reference point dose, minimum and maximum dose) to dose–volume reporting. This is justified based on the availability of more accurate dose-calculation algorithms and the advances and ubiquity of modern-day anatomic/functional imaging.
It also should be understood that in the past minimum dose and maximum dose referred to point doses in the dose calculation grid assigned to a single voxel. It is now acknowledged that the minimum dose may not be accurately determined because it is often located in a high-gradient region at the edge of the PTV, making it highly sensitive to the resolution of the calculation and the accuracy of delineating the CTV and determining the PTV. Moreover, treatment planning today represents only one single representation of the calculated dose distribution, while over the full course of a radiation treatment the minimum and maximum dose points are likely to shift slightly from one day to another. For all those reasons, ICRU Report 8351 recommends discontinuing the use of maximum dose and minimum dose and instead recommends for dose reporting the use of the near-maximum (corresponding to D2%) and the near-minimum (D98%). In addition, the median dose, specified by D50%, should be reported, as it is considered to best correspond the previously defined dose at the ICRU reference point.
The maximum dose as specified by a single calculation point (Dmax or D0%) has often been reported for serial-like organs or structures. Previously such a reported maximum dose was considered relevant only if the involved organ had a minimum diameter of at least 15 mm, while an even smaller dimension was considered appropriate for some organs, such as eye, optical nerve, or larynx.35 The ICRU acknowledged that the minimum diameter for the maximum dose region in a structure is not always easy to establish and hence recommend that D2% be reported. However, the ICRU pointed out that care should be taken in a change from maximum dose to the near-maximum dose, D2%.
With regard to dose homogeneity, ICRU Report 50 recommends that the dose coverage of the PTV be kept within specific limits, namely +7% and –5% of the prescribed dose.35 However, this level of dose homogeneity might not be achieved in all cases (particularly for current IMRT techniques), and ICRU Report 50 explicitly states that if this degree of homogeneity cannot be achieved, it is the responsibility of the radiation oncologist to decide whether the dose heterogeneity is acceptable, pointing out that in those parts of the PTV where the highest malignant cell concentration may be expected, that is, the GTV, a higher dose might even be an advantage. Similarly, a slight underdose to the PTV might be required (particularly if in close proximity to an OAR) or result for lung tumors surrounded by low-density lung tissue as a result of electronic disequilibrium.
Noted that ICRU Reports 50 and 62 do not make strict recommendations regarding dose prescription; instead, the ICRU states “the radiation oncologist should have the freedom to prescribe the parameters in his/her own way, mainly using what is current practice to produce an expected clinical outcome of the treatment.”35 For dose reporting, however, it is recommended to also state the prescribed dose if the actual prescription was not done accordingly.
It is now recognized that there is a large variability among institutional results in IMRT planning and reporting.60,61 Studies strongly support the ICRU Report 83 recommendation to move away from single-spatial-point prescription/reporting to dose–volume prescription/reporting. In addition, the American Society of Radiation Oncology (ASTRO) has gone even further and recommends that specific details of the inverse treatment planning and image-guided treatment processes be recorded using (a) an IMRT Treatment Planning Directive, (b) a Treatment Goal Summary, (c) an Image Guidance Summary, and (d) a Motion Management Summary.62 I strongly encourage manufacturers of radiation oncology electronic medical record systems (e.g., Elekta-Impac MOSAIQ and Varian ARIA) to quickly incorporate these templates into their user interfaces, allowing physicians to enter their IMRT prescriptions in a more robust and unambiguous manner.
Dose–Volume Histograms
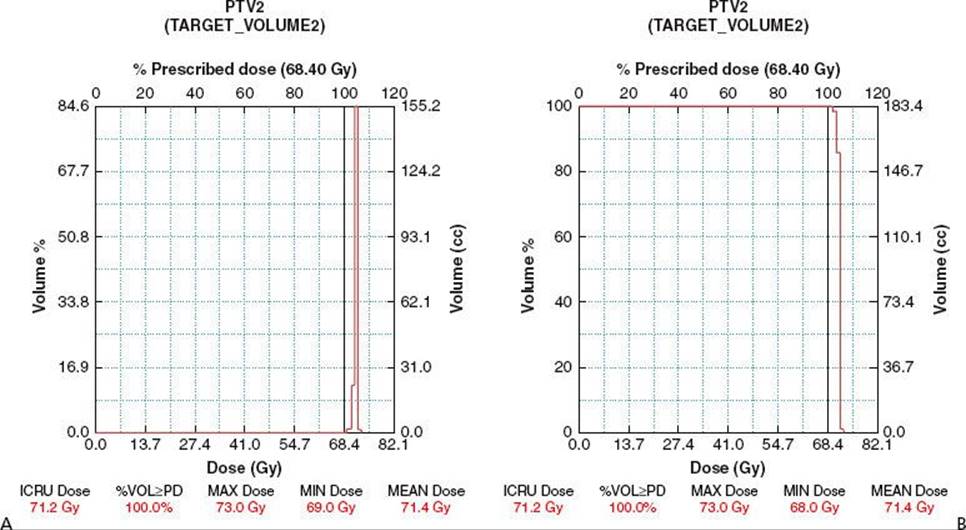
The large amount of dosimetric data that must be analyzed when a CRT plan is evaluated has prompted the development of methods of condensing and presenting the data in more easily understandable formats. One such data reduction tool is the dose volume histogram.29,30 Two types of DVHs, differential and cumulative, are available in CRT planning, with the latter now widely used in plan evaluation for assessing PTV(s) coverage and dose to OARs, as displayed in Figure 9.13. However, it must be clearly understood that the DVH does not provide any spatial information and thus can only complement and not replace spatial dose-distribution display tools such as isodose displays.
The differential DVH (dDVH), as shown in Figure 9.13A, is essentially a plot of the frequency distribution of the individual dose distribution elements (called dose voxels) obtained from the dose grid. Typically, the grid size is small enough so that the dose can be assumed to be constant within each voxel. The volume’s dose distribution is then divided into dose bins, and the voxels are grouped according to their dose bin value without regard to their spatial location. A plot of the number of voxels in each bin (y-axis) versus the bin dose range (x-axis) is by definition a differential DVH. The size of the dose bin used determines the height of each bin of the dDVH. For example, if the bin widths were increased, the heights of the histogram bins would increase because more voxels would fall into any given bin. Thus, it should be clearly understood that the detailed shape of a differential DVH depends on the dose bin size used, even though the underlying dose–volume data are the same.
A cumulative DVH (cDVH), as shown in Figure 9.13B, is a plot in which each bin represents the volume, or percentage of volume (y-axis), that receives a dose equal to or greater than the indicated dose on the x-axis. The cDVH is generated by summing all of the voxels of the corresponding dDVH to the right of each dose. The volume value for the first bin (dose origin) is the full volume of the structure because the total volume receives at least zero dose, and the volume for the last bin is that which receives the maximum dose. Note that in the literature, the “c” in the cDVH is generally dropped, leaving just DVH.
Explicit values of dose–volume parameters can be extracted from the DVH data and are called dose–volume statistics or simply dose statistics. Examples for target volumes include maximum dose, minimum dose, mean dose, and percentage volume receiving greater than or equal to the prescription dose; for OARs, they typically include maximum point dose, mean dose, and percentage volume receiving greater than or equal to an established tolerance dose. As previously stated, ICRU Report 8351 recommends replacing the minimum dose and maximum dose point doses with near-maximum (corresponding to D2%) and near-minimum (D98%).51
FIGURE 9.13. A: The differential dose–volume histogram (dDVH) for a specified target volume (PTV2)—the volume is subdivided into individual elements (called voxels) and tagged according to dose received as determined from the three-dimensional dose grid. Voxels are then grouped according to each specified dose bin value without regard to their spatial location. A plot of the number of voxels in each bin (y-axis) versus the bin dose range (x-axis) is by definition a dDVH. B: The corresponding cumulative DVH (cDVH) is generated by summing for each dose bin all of the voxels of the PTV2 dDVH to the right of each dose bin; the y-axis gives the volume, or percentage of volume, that receives a dose equal to or greater than the indicated dose on the x-axis.
Biologic Models for Dose–Volume Response
Evaluation of the quality of a treatment plan (i.e., is plan A better than plan B?) is difficult and at best a qualitative procedure. For example, it is not clear what degree of dose uniformity within the PTV is optimum, as dose levels can now be significantly escalated using CRT techniques; nor is it always clear which plan is best if the two DVHs for a specific OAR cross each other (i.e., difficulty in weighting importance of dose vs. volume).
Researchers have developed biophysical models that attempt to translate the dose–volume information into estimates of biologic response—tumor control probability (TCP) and normal tissue complication probability (NTCP) models.58,59,63 Most authors agree that the TCP and NTCP models developed thus far are not accurate enough such that the absolute values can be used to predict clinical outcome; however, they are used to compare rival plans and as such help to rank plan quality. In any case, such biologic indices should be used clinically only when their utility has been firmly established for well-defined clinical conditions. ICRU Report 83 is clear in stating that if biologically based metrics are to be reported, the assumptions used in the models, their parameters, and the model itself must be unambiguously specified.51
Tumor Control Probability
TCP plotted as a function of dose has a classic sigmoid shape, having zero control at some low dose to control at some high dose. Rather than attempt to review in detail the various models, here I discuss some relevant issues. Readers are referred to the article by Moiseenko et al. for more details.64 Simple phenomenological TCP models can be represented by the logistic function as follows:
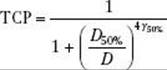
where D50% is the dose at which the TCP is 50%, γ50% is the slope of the dose–response curve at 50% tumor control, and D is the dose administered.65 Note that the use of the logistic function assumes an approximate uniform cell response and a uniform dose distribution.
For a nonuniform dose distribution, the total tumor volume is reduced to smaller volumes having “uniform” doses within each subvolume element vi. The TCP value for each volume element, TCP(v, D), can be inferred from the TCP for uniform irradiation of the entire tumor volume, TCP(1, D), using the following equation:

Thus, the TCP for the tumor receiving an inhomogeneous dose is given by the product of the individual volume element TCPs as follows:
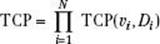
Here TCP(vi, Di) is the TCP for the ith volume element receiving dose Di, and N is the total number of tumor volume elements. Recall that the validity of this equation is highly dependent on the validity of the assumptions that the individual tumor volume elements are uniformly distributed throughout the tumor volume and are equally radiosensitive.
Normal Tissue Complication Probability
There are mainly two different approaches used in radiation therapy in modeling NTCP: the empiric model introduced by Lyman and Wolbarst66,67 and functional models that introduced concepts of serial and parallel tissue organization and functional subunits (FSUs).65,68–70
The Lyman NTCP model can be expressed in terms of an error function of dose (D) and volume (v) as follows:

where

with v equal to the partial volume (V/Vref) and the tolerance dose volume dependence given by the following power-law relationship:

D50(1) is the tolerance dose for 50% complications for uniform whole-organ irradiation, and D50(v) is the 50% tolerance dose for uniform partial-organ irradiation to the fractional volume v. The arbitrary variables m and n are found by fitting tolerance doses for uniform whole and uniform partial-organ irradiation, where m characterizes the gradient (slope) of the dose–response function at D50 and ncharacterizes the effect of volume. When n is near unity, the volume effect is large; conversely, when n is near zero, the volume effect is small. When NTCP is plotted against dose, the NTCP equation demonstrates a sigmoid shape.
Two methods are used to extend this model to nonuniform organ irradiation. The interpolation method, proposed by Lyman and Wolbarst,67 modifies the DVH to one in which the whole organ receives an effective uniform dose, Deff, that is less than or equal to the maximum organ dose. The second method, called the effective volume method, proposed by Kutcher and Burman,71 modifies the DVH to one in which a fraction of the organ, veff, receives the maximum organ dose. The Lyman model coupled with the Kutcher–Burman DVH reduction scheme (now called the Lyman–Kutcher–Burman model) is the most widely used NTCP model.63
Other NTCP models include two developed by Niemierko and Goitein—the critical element model, used for serial-like organs,72 and the critical volume model, for parallel-like organs.73 These are similar in form to that of Lyman and Wolbarst66 but include additional terms to better account for the radiosensitivity of the FSUs.
Equivalent Uniform Dose
Equivalent uniform dose (EUD) is a concept first introduced by Niemierko74 for use in evaluating and reporting inhomogeneous dose distributions and later redefined by the following equation75:
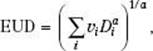
where vi is the volume of the dose-volume bin with a dose Di, and the exponent a is a complication-specific parameter.
The EUD concept assumes that any two dose distributions are equivalent if they cause the same radiobiologic effect and appears well suited for use in evaluating competing conformal plans. However, McGary et al. pointed out that there are conditions in which EUD is not adequate as a single parameter to report or analyze inhomogeneous dose distributions—for example, when the minimum dose is significantly lower than the mean dose.76–78
MANAGEMENT OF CONFORMAL RADIATION THERAPY DATA
To accurately perform the steps involved in CRT, several forms of patient imaging and other data must be acquired, displayed, manipulated, and stored. Typically, patient image data acquired from several imaging subsystems must be communicated to a TPS to permit these images to be used for treatment planning. Several software components also must be integrated so that the output of one processing step can be made available for use as input to the next step. Daily IGRT imaging is also putting large demands on data storage, and the need for more robust image processing tools is evident. These issues in data management in CRT are complex and continue to be somewhat problematic, although some progress is being made through the Integrating the Healthcare Enterprise in Radiation Oncology effort initiated by ASTRO.79
This issue is just part of larger informatics issues facing radiation oncology. There is an explosion in the types and volume of data that must be made available for scientific query. Difficulty in accessing the data in practical ways has become a critical limitation to investigators in the field and to its advancement. Unfortunately, the commercially available radiation oncology information systems are not yet adequate to meet this challenge. The great volume and diversity of the data have rendered their storage, management, and processing extremely problematic, resulting in situations in which important data and information are inefficiently disseminated and sometimes lost. In the busy clinic, failure to manage critical information may compromise patient safety. Here, a major issue is the lack of integration of the radiation oncology electronic medical record (EMR), based in systems such as Elekta-Impac MOSAIQ or Varian ARIA, with the electronic hospital record (EHR), based in systems such as those provided by Epic (Verona, WI). In most cases, we must resort to hybrid charting systems (ad hoc combinations of EMR, her, and paper charting), which entails risks and gives rise to a dangerous situation. Immediate and focused efforts in achieving these integrations and improving the radiation oncology informatics infrastructure are urgently needed.
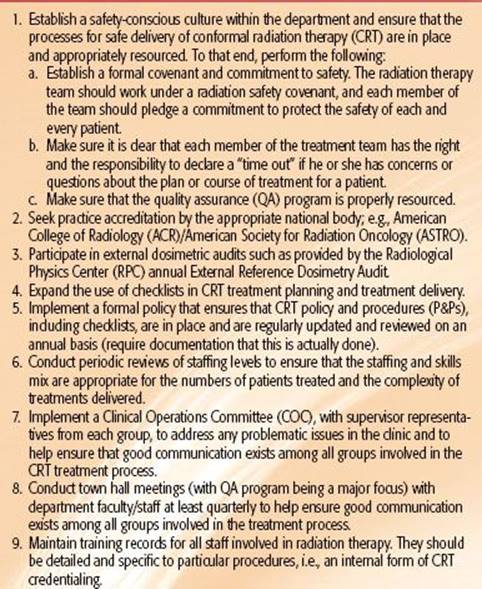
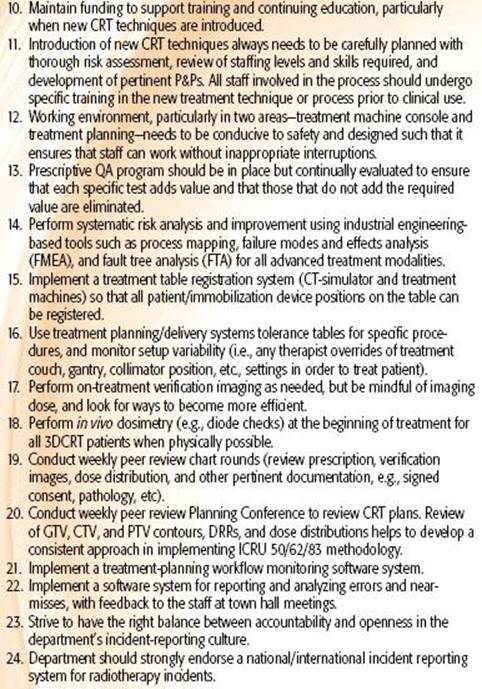
TABLE 9.4 GUIDING PRINCIPLES FOR CONFORMAL RADIATION THERAPY QUALITY ASSURANCE PROGRAM
QUALITY ASSURANCE FOR CONFORMAL RADIATION THERAPY
It is most important to realize that a QA program for CRT is an interdisciplinary effort involving radiation oncologists, radiation physicists, dosimetrists, radiation therapists, clinical engineers, and information technology specialists and that the efforts of each group often overlap substantially. To be effective, it is also essential to have the full support of the department chair and hospital administration.
While in general, radiation therapy has a long, successful history of QA, most authors have come to realize that the current approach (which relies heavily on prescriptive QA tests, tolerances, and frequencies as provided by consensus expert groups from national/international professional/scientific organizations) is likely inadequate by itself for more advanced modalities such as CRT.80–82
For example, today’s imaged-guided CRT planning and delivery processes have become much more complex and much less intuitive. These complexities, coupled with the inadequate informatics infrastructure and outdated national QA guidelines, have created enormous QA challenges. Communication among members of the planning team, including physician, resident, simulation therapist, dosimetrist, physicist, and treating therapist, is often rushed, cryptic, and complicated by the lack of integration of the radiation oncology EMR (e.g., Elekta-Impac MOSAIQ) with the hospital’s EHR (e.g., Epic software). In fact, in most cases, one must resort to a hybrid charting system (ad hoc combinations of EMR, EHR, and paper charts), which is a dangerous situation. In addition, multiple imaging modalities are often used to define target volumes, and now 4D imaging is being implemented clinically, all complicating the processing of the information. CRT plan data, transferred over a network to the V&R system and computer-controlled linac systems, carry complex specifications for treatment, including positioning of MLC leaves, sometimes variable dose rates, collimator rotation, gantry angles, and, in some instances, a moving treatment table or gantry or both. In some cases, different vendor software systems are used, and interoperability is not always robust. This continuing increasing complexity of devices and systems is clearly problematic for a totally prescriptive QA approach, and it results in increased time demands on staff and groups where there are already shortages. Recent New York Timesarticles81 have brought needed attention to this issue and spurred national organizations to work to improve the current QA situation.83,84
While it is believed that the prescriptive QA approach is valid and valuable for much of the CRT technology and procedures currently in place, new and different approaches need to be developed in parallel.85,86 These must be risk/evidence based and process oriented rather than device and procedure oriented; they likely need to be multidisciplinary in nature, resource and risk optimized, and flexible enough to cope with current and anticipated changes in technology.87 Such process-oriented QA includes risk-based analysis, process mapping, application of failure modes and effects analysis (FMEA), and fault tree analysis (FTA), including analyses of human actions and responses.88
That said, radiation oncology departments must do all that they can now to ensure that processes for safe planning and delivery of CRT are in place and appropriately resourced. Table 9.4 provides a list of guiding principles to help a department prioritize QA efforts for improving patient safety and quality for CRT. This list is a compilation of pertinent key recommendations made by several national and international groups.80,83,89–93
Quality Assurance: Treatment-Planning System
The complexity of 3DTPSs continues to increase to better facilitate the accurate delivery of CRT. In a number of instances, the TPS is an integral component of the treatment machine. Hence, this results in having more than one planning system in the department, thus increasing QA complexity. Rigorous acceptance and commissioning of the TPS is essential to ensure it is functioning accurately before it is used clinically; in this respect, it is no different than other medical devices. Full details on acceptance, commissioning, and periodic QA tests are available elsewhere.94–101
The accuracy of dose calculations must be thoroughly examined during the 3DTPS commissioning process. Periodic checks of calculations versus measured dose are also essential due to possible data corruptions in the TPS itself and to how well treatment machine parameters such as flatness and symmetry are maintained. It should be appreciated that the 3DTPS can never be fully tested, nor can the manufacturer assure the user that the system is “bug free.” Rather, the system should be tested over a range of parameters that are typical of those used in the clinic. For example, tests should include (a) consistency of input/output data, (b) monitor units calculations, (c) relative dose distributions, (d) graphical data, including BEV and field aperture display, and (e) plan evaluation tools such as DVHs and DRRs. The test procedures and results should be fully documented, as they will provide the basic test data to which the periodic QA tests can be compared.
Quality Assurance: Patient Positioning and Immobilization and Imaging Data Acquisition
CT, MRI, PET, and ultrasound imaging are used, depending on disease site, for acquiring imaging data to determine patient external contours and target and organs-at-risk volumes. Hence, there are a number of additional QA demands placed on imaging units that are specific to CRT treatment planning.39 Since the patient needs to be repositioned reproducibly on the treatment machine, special patient positioning-immobilization devices are needed. Such devices should be constructed so that they can be attached in similar manner to the treatment machine couch and the CT, MR, or PET imaging system couches used in obtaining the planning imaging data. These devices should not only attach and lock to all couches, but they also should do so in a configurable manner to allow indexing of the devices to the treatment couch for daily reproducibility.
In some instances the composition of these devices is also important; for example, low–atomic number materials are necessary for CT scanners. In addition, patient motion can distort MRI and CT images, which can cause changes in the electron densities used for dose calculation that are derived from CT. Furthermore, the position of the patient in the CT scanning ring can lead to errors in the CT numbers that are used to derive the linear attenuation coefficients of the patient.
Geometric accuracy of all imaging modalities used for planning must be checked. This can be accomplished by imaging suitably designed phantoms on the various machines and comparing the results with the known values. Special care should be given to MRI units, which may suffer from appreciable spatial distortions. If a PET-CT is used, special attention should be paid to the physical alignment of the table couch and both imaging rings. If images from CT, MR, and/or PET are registered and fused, a QA program must be implemented to ensure that the inherent algorithm used and departmental procedures are able to produce accurate composite images for planning.102,103Finally, for CT, it is necessary to obtain or confirm the relationship between CT number and electron density.
The transfer of image data routinely occurs directly via a computer network but should be checked on a regular basis. Vigilance is also necessary to eliminate any systematic errors; for example, an error in the specification of a scan diameter can lead to geometric distortions of the image.
Quality Assurance: Volume(s) Delineation
Target volume delineation is viewed by many experts in the field as being the weakest link in the entire CRT workflow chain. A high variation continues to be seen in all studies evaluating consistency of delineation of target volumes and organs at risk among physicians.104–109 This can be explained by a lack of generally accepted guidelines for volume delineation and also, most likely, insufficient training of radiation oncology residents in modern cross-sectional imaging. It is clear that errors/inconsistencies in volume delineation can seriously undermine the goals of CRT. One approach toward solving this difficult issue is to adopt guidelines and consensus volumes based on the delineation performed by a number of experts in the field.108,110 Both the Radiation Therapy Oncology Group and the European Society of Therapeutic Radiation Oncology have placed high priority on this approach and now offer more online guidelines for several sites.
It is also possible to improperly define an OAR due to faulty or incomplete CT procedures. For example, the base of the brain may be better defined on the CT slice if sagittal reconstructions are also available while contouring. In addition, if contrast is used, density overrides may be needed before treatment planning is performed to avoid the erroneous effects of the high-Z media. Related to this is the situation that occurs when high-Z materials like hip prostheses are found within the patient and density overrides are required to account for artifacts.
Quality Assurance: Designing Beams
MLC leaf settings or block apertures and beam orientation displays must be confirmed prior to clinical use and checked after any software modification. In addition, it is possible to define beam orientations that are physically impossible to set up, and this process requires use of clinical judgment by the dosimetrist generating the treatment plan. Thus, the ability to physically set up a particular beam orientation must be reviewed and verified, particularly for beam orientations involving couch rotation. In such cases, tests might have to be performed to verify clearance between the treatment machine gantry and the patient or the gantry and the treatment couch before finalizing the treatment plan.
Quality Assurance: Plan Evaluation
The fidelity of the 3DTPS plan evaluation tools (i.e., dose distribution displays, DVHs, hard copy, etc.) depends upon many factors in addition to just the accuracy of the dose calculation algorithm, and thus they should be regularly checked. For example, nonlinearities in graphical display and/or plotting systems can lead to distortions in the displayed patient anatomy and the overlying dose distributions. Hence, it is good practice to have fixed length scales displayed/printed in order to be able to check the geometric accuracy of the plan output. Furthermore, the dose distribution calculations can be sensitive to the grid size, and DVHs can additionally be sensitive to the dose bin size.111
As mentioned earlier, plan evaluation is becoming more cumbersome as treatment techniques are becoming more complex. This loss of direct “clinical feeling” of the adequacy of a treatment plan is problematic. Plan evaluation using DVHs, planar isodoses, and room’s-eye views of dose surfaces is made more robust if the department adopts a evidence-based list of dose–volume constraints for target volumes and organs at risk and documents reasons when compliance is not followed.
Quality Assurance: Treatment Plan Review
All CRT treatment plans should be reviewed, signed, and dated by the treatment planner. The treating physician should of course also review, approve, and sign the treatment plan. In addition, all plans should be independently checked prior to initiation of radiation therapy by a physicist who was not involved directly in the production of the plan. The independent plan check should assure that setup instructions have been properly recorded—for example, field size, gantry angle, and so on. In addition, beam normalization points (normally at isocenter) can be problematic if near nontissue medium or under or near an MLC leaf edge and hence should be moved to a more suitable location. The number of monitor units to realize the dose prescription is typically obtained directly from the 3DTPS. These values must be independently checked either by hand calculations or, more typically, independent computer calculations. An action level should be established based upon the accuracy of the computer algorithm and independent dose calculation procedure. Obviously, any monitor unit (MU) check system must be tested prior to clinical use and following any change or software upgrade. The American Association of Physicists in Medicine Task Group 114 report provides valuable information on the verification of MU calculations for non-IMRT radiotherapy treatments.112
Note that IMRT plans require additional checks, including review of optimization parameters, minimum gap size, minimum MU/segment, and maximum doses in and outside of the target. In addition, in the United States the patient’s plan must undergo phantom measurement checks on the intended treatment machine to verify both point dose and spatial dose distribution agreement.
Quality Assurance: Planning Conference
One of the most important components of a CRT QA program is the establishment of a weekly planning QA conference that is attended by radiation oncologists, medical physicists, radiation therapists, and dosimetrists. This is in addition to the normal new-patient chart rounds conference, at which the patient’s pertinent medical history, physical, pathology, and diagnostic imaging findings along with the tumor staging and proposed plan of treatment, including the prescription, are presented by the attending radiation oncologists or residents. In a planning QA conference, the group can review the CRT plans using a high-resolution, large-screen video projector connected to the 3DTP network. GTV, CTV, and PTV contours, DRRs, and dose distributions can all be reviewed very efficiently. This type of planning conference helps the staff to develop a very consistent approach in implementing ICRU 50/62/83 methodology for specifying volumes and provides a very effective peer review mechanism for a CRT clinical program.
Quality Assurance: Plan Implementation and Treatment Verification
If a clinic is in the initial phases of implementing CRT techniques or if experienced users implement new CRT modalities using nonconventional beam orientations, a verification simulation procedure is recommended to confirm the correctness of the beam orientations. It is important to check that all treatment plan parameters are properly implemented. This can be best accomplished by having the treatment planning team available (or on call) during this procedure so that any detected ambiguities or problems can be addressed immediately. When a beam orientation cannot be simulated, electronic portal imaging devices (EPIDs) can be used to obtain orthogonal images for comparison with similar DRRs to ensure correct isocenter positioning. Today, even more-advanced on-board imaging and other data localization systems (i.e., ultrasound, video surfacing, static kilovolt imaging, kilovolt cone beam CT, megavolt helical CT, and megavolt cone beam CT) are available.10,50 Clearly written policy and procedures (P&Ps) should be in place with regard to (a) localization procedures, (b) therapist instructions and tolerance criteria to move (or not move) a patient, (c) whether post imaging is required when a move is made, (d) subsequent reviews by physicians, and (e) the process for peer review of verification images. Special care should be taken to ensure that all beam-modifying devices are correctly positioned. Although errors in MLC settings or block fabrication/mounting should be observed when reviewing the portal images, wedge or compensator misalignment is much more problematic and may only be revealed by careful observation during patient setup.
The optical distance indicator is also useful in assessing the correctness of the setup of a particular beam. Documentation provides a depth of isocenter below the skin surface on the central ray of the beam, which can then be compared with the isocenter depth measured on the simulator or treatment machine after the beam is set up using the couch and gantry positions specified by the treatment plan.
A V&R system should be used to assure that the same parameters (within tolerance limits) are used each day. Such systems are valuable for the verification and recording of at least the following parameters: (a) monitor units, (b) energy, (c) mode, (d) collimator settings (including independent jaws and multileaf collimator), (e) collimator angle, (f) gantry angle, (g) table position, and (h) wedge number and orientation. However, V&R systems must be used with care since they can give the user a false sense of security. For example, if a setup error is made on the first day and the machine geometry parameters are captured, the system will faithfully verify this erroneous setting from day to day. To reduce the chance of this occurring, the patient should be carefully set up according to the treatment plan (best if there is a direct electronic transfer of plan parameters to the V&R system) and a robust P&P for approval of patient treatment position should be in place; upon approval, the parameters are captured with the V&R system. As vendor implementation of Digital Imaging and Communications in Medicine data exchange has matured significantly, the direct transfer of data from the TPS to the V&R system has undoubtedly reduced such errors; however, a careful check of patient position is still recommended.
Thermoluminescent dosimeters (TLDs), diodes, and MOSFET detectors are often used for in-vivo dosimetry. Diodes or MOSFETS are most used for dose checks at the beginning of treatment for all non-IMRT patients. TLDs are typically used for checking multiple dose locations for unusual treatment conditions or for critical structures in or near the treatment volume. In addition, implantable dosimeters are now being used for real-time dosimetry.113Recently, exit portal dosimetry using EPIDs has been used to provide full-field information, even for IMRT fields.114,115
SUMMARY
I strongly believe that the use of 3D treatment planning and CRT has had (and will continue to have) a major impact on the practice of radiation therapy. Phase I/II and III CRT dose-escalation studies in several disease sites have been conducted (or are underway) by the Radiation Therapy Oncology Group under cooperative agreement with the National Cancer Institute.116 In addition, there are many other individual institutional studies that have shown the benefits of 3D planning and conformal therapy, particularly for prostate cancer, head and neck cancer, and lung cancer, as documented in the literature.117 Patients identified to benefit most from 3D planning and CRT are those with tumors in sites with complex anatomy, irregularly shaped tumor volumes, tumors adjacent to radiation-sensitive normal structures, and undergoing small-volume or high-dose treatments. However, as with any major technical advance in radiation oncology, CRT use must be supported with enhanced quality assurance from all members of the treatment team.
REFERENCES
1. Purdy JA. 3-D radiation treatment planning: a new era. In: Meyer JL, Purdy JA, eds. 3-D conformal radiotherapy: a new era in the irradiation of cancer. Basel: Karger; 1996:1–16.
2. Purdy JA. From new frontiers to new standards of practice: advances in radiotherapy planning and delivery. In: Meyer JL, ed. IMRT, IGRT, SBRT. Basel: Karger; 2007:18–39.
3. Purdy JA. Advances in the planning and delivery of radiotherapy: new expectations, new standards of care. In: Meyer JL, ed. IMRT, IGRT, SBRT, 2nd ed. Basel: Karger; 2011:1–28.
4. Bortfeld T, Schmidt-Ullrich R, De Neve W, et al. Image-guided IMRT. Berlin: Springer; 2006.
5. Purdy JA. Intensity-modulated radiation therapy. Int J Radiat Oncol Biol Phys 1996;35(4):845–846.
6. Webb S. Intensity-modulated radiation therapy. Bristol: Institute of Physics Publishing; 2000.
7. Jaffray DA, Drake DG, Moreau M, et al. A radiographic and tomographic imaging system integrated into a medical linear accelerator for localization of bone and soft-tissue targets. Int J Radiat Oncol Biol Phys 1999;45:773–789.
8. Jaffray DA, Siewerdsen JH, Wong JW, et al. Flat-panel cone-beam computed tomography for image-guided radiation therapy. Int J Radiat Oncol Biol Phys 2002;53(5):1337–1349.
9. Ling CC, York E, Fuks Z. From IMRT to IGRT: frontierland or neverland? Radiother Oncol 2006;78:119–122.
10. Dawson LA, Balter JM. Interventions to reduce organ motion effects in radiation delivery. Semin Radiat Oncol 2004;14(1):76–80.
11. Keall PJ. 4-dimensional computed tomography imaging and treatment planning. Semin Radiat Oncol 2004;14(1):81–90.
12. Takahaski S. Conformation radiotherapy-rotation techniques as applied to radiography and radiotherapy of cancer. Acta Radiol Suppl 1965;242:1–142.
13. Proimos BS. Synchronous field shaping in rotational megavoltage therapy. Radiology 1960;74:753–757.
14. Trump JG, Wright KA, Smedal MI, et al. Synchronous field shaping and protection in 2-million-volt rotational therapy. Radiology 1961;76:275–283.
15. Green A, Jennings WA, Christie HM. Rotational roentgen therapy in the horizontal plane. Acta Radiol 1960;31:275–320.
16. Bjarngard BE, Kijewski PK. Computer-controlled radiation therapy. In: Proceedings 2nd Annual Symposium on Computer Applications in Medical Care. Long Beach, CA; 1978.
17. Davy TJ, Brace J. Dynamic 3-D treatment using a computer-controlled cobalt unit. Br J Radiol 1979;53:612–616.
18. Sterling TD, Knowlton KC, Weinkam JJ, et al. Dynamic display of radiotherapy plans using computer-produced films. Radiology 1973;107:689–691.
19. Sterling TD, Perry H, Katz L. Automation of radiation treatment planning V. Calculation and visualization of the total treatment volume. Br J Radiol 1965; 38:906–913.
20. McShan DL, Silverman A, Lanza D, et al. A computerized three-dimensional treatment planning system utilizing interactive color graphics. Br J Radiol 1979;52:478–481.
21. Reinstein LE, McShan D, Webber BM, et al. A computer-assisted three-dimensional treatment planning system. Radiology 1978;127:259–264.
22. Goitein M, Abrams M. Multi-dimensional treatment planning: I. Delineation of anatomy. Int J Radiat Oncol Biol Phys 1983;9:777–787.
23. Goitein M, Abrams M, Rowell D, et al. Multi-dimensional treatment planning: II. Beam’s eye view, back projection, and projection through CT sections. Int J Radiat Oncol Biol Phys 1983;9:789–797.
24. Fraass BA, McShan DL. 3-D treatment planning. I. Overview of a clinical planning system. In: Proceedings of the 9th International Conference on the Use of Computers in Radiation Therapy.Scheveningen, Netherlands; 1987.
25. Mohan R, Barest G, Brewster IJ, et al. A comprehensive three-dimensional radiation treatment planning system. Int J Radiat Oncol Biol Phys 1988;15:481–495.
26. Purdy JA, Wong JW, Harms WB, et al. Three dimensional radiation treatment planning system. In: Proceedings of the 9th International Conference on the Use of Computers in Radiation Therapy.Scheveningen, Netherlands; 1987.
27. Sherouse GW, Mosher CE, Novins K, et al. Virtual simulation: concept and implementation, in the use of computers in radiation therapy. In: Proceedings of the 9th International Conference on the Use of Computers in Radiation Therapy. Scheveningen, Netherlands; 1987.
28. Smith AF, Purdy JA. Editors’ note. Int J Radiat Oncol Biol Phys 1991;21(1):1.
29. Drzymala RE, Holman MD, Yan D, et al. Integrated software tools for the evaluation of radiotherapy treatment plans. Int J Radiat Oncol Biol Phys 1994;30(4): 909–919.
30. Drzymala RE, Mohan R, Brewster L, et al. Dose–volume histograms. Int J Radiat Oncol Biol Phys 1991;21(1):71–78.
31. Bosch WR, Low DA, Gerber RL, et al. The electronic viewbox: a software tool for radiation therapy treatment verification. Int J Radiat Oncol Biol Phys 1995;31(1):135–142.
32. Goitein M. The probability of controlling an inhomogeneously irradiated tumor. In: Goitein M, Lyman J, Maor M, et al., eds. Report of the working groups on the evaluation of treatment planning for particle beam radiotherapy.Bethesda, MD: National Cancer Institute; 1987.
33. IMRT Collaborative Working Group. Intensity modulated radiation therapy: current status and issues of interest. Int J Radiat Oncol Biol Phys 2001;51(4):880–914.
34. International Commission on Radiation Units and Measurements. Report 29: Dose Specification for reporting external beam therapy with photons and electrons. Washington, DC: International Commission on Radiation Units and Measurements; 1978.
35. International Commission on Radiation Units and Measurements. Report 50: Prescribing, recording, and reporting photon beam therapy. Bethesda, MD: International Commission on Radiation Units and Measurements; 1993.
36. International Commission on Radiation Units and Measurements. Report 62: Prescribing, recording, and reporting photon beam therapy (Supplement to ICRU Report 50). Bethesda, MD: International Commission on Radiation Units and Measurements; 1999.
37. Jin J-Y, Ajlouni M, Chen Q, et al.. A technique of using gated-CT images to determine internal target volume (ITV) for fractionated stereotactic lung radiotherapy. Radiother Oncol 2006;78(2):177–184.
38. Perez CA, Purdy JA, Harms WB, et al. Design of a fully integrated three-dimensional computed tomography simulator and preliminary clinical evaluation. Int J Radiat Oncol Biol Phys 1994;30(4):887–897.
39. Mutic S, Palta JR, Butker EK, et al. Quality assurance for computed-tomography simulators and the computed-tomography-simulation process: Report of the AAPM Radiation Therapy Committee Task Group No. 66. Med Phys2003;30(10):2762–2792.
40. Hall WH, Guiou M, Lee NY, et al. Development and validation of a standardized method for contouring the brachial plexus: preliminary dosimetric analysis among patients treated with IMRT for head-and-neck cancer. Int J Radiat Oncol Biol Phys. 2008;72(5):1362–1367.
41. Caldwell CB, Mah K, Skinner M, et al. Can PET provide the 3D extent of tumor motion for individualized internal target volumes? A phantom study of the limitations of CT and the promise of PET. Int J Radiat Oncol Biol Phys 2003;55(5):1381–1393.
42. Chen GTY, Kung JH, Beaudette KP. Artifacts in computed tomography scanning of moving objects. Semin Radiat Oncol 2004;14(1):19–26.
43. Rietzel E, Chen GT, Choi NC, et al. Four-dimensional image-based treatment planning: Target volume segmentation and dose calculation in the presence of respiratory motion. Int J Radiat Oncol Biol Phys 61(5):1535–1550.
44. Rietzel E, Pan T, Chen GT. Four-dimensional computed tomography: image formation and clinical protocol. Med Phys 2005;32(4):874–889.
45. Qi XS, White J, Rabinovitch R, et al. Respiratory organ motion and dosimetric impact on breast and nodal irradiation. Int J Radiat Oncol Biol Phys 2010; 78(2):609–617.
46. Bortfeld T, Jiang S, Rietzel E. Effects of motion on the total dose distribution. Semin Radiat Oncol. 2004;14(1):41–51.
47. Chino JP, Lee WR, Madden R, et al. Teaching the anatomy of oncology: evaluating the impact of a dedicated oncoanatomy course. Int J Radiat Oncol Biol Phys 2011;79(3):853–859.
48. van Herk M. Errors and margins in radiotherapy. Semin Radiat Oncol 2004;14(1):52–64.
49. van Herk M, Remeijer P, Lebesque JV. Inclusion of geometric uncertainties in treatment plan evaluations. Int J Radiat Oncol Biol Phys 2002;52(5):1407–1422.
50. Keall P. Locating and targeting moving tumors with radiation beams. In: Meyer JL, ed. IMRT, IGRT, SBRT, 2nd ed. Basel: Karger; 2011:118–131.
51. International Commission on Radiation Units and Measurements. Report 83: Prescribing, Recording, and reporting photon-beam intensity-modulated radiation therapy (IMRT). J ICRU 2010;10(1):1–106.
52. Sherouse GW, Novins K, Chaney EL. Computation of digitally reconstructed radiographs for use in radiotherapy treatment design. Int J Radiat Oncol Biol Phys 1990;18(3):651–658.
53. Mackie RT, Liu HH, McCullough EC. Treatment planning algorithms: model-based photon dose calculations. In: Khan FM, ed. Treatment planning in radiation oncology, 2nd ed. Philadelphia: Lippincott Williams & Wilkins; 2007:63–77.
54. Frank SJ, Forster KM, Stevens CW, et al. Treatment planning for lung cancer: Traditional homogeneous point-dose prescription compared with heterogeneity-corrected dose-volume prescription. Int J Radiat Oncol Biol Phys2003;56(5): 1308–1318.
55. Purdy JA, Harms WB, Matthews JW, et al. Advances in 3-dimensional radiation treatment planning systems: room-view display with real time interactivity. Int J Radiat Oncol Biol Phys 1993;27(4):933–944.
56. Emami B, Lyman J, Brown A, et al. Tolerance of normal tissue to therapeutic irradiation. Int J Radiat Oncol Biol Phys 1991;21:109–122.
57. Milano MT, Constine LS, Okunieff P. Normal tissue tolerance dose metrics for radiation therapy of major organs. Semin Radiat Oncol 2007;17(2):131.
58. Marks LB, Ten Haken RK, Martel MK. Guest Editor’s Introduction to QUANTEC: A Users Guide. Int J Radiat Oncol Biol Phys 2010;76(3, Suppl 1):S1–S2.
59. Marks LB, Yorke ED, Jackson A, et al. Use of normal tissue complication probability models in the clinic. Int J Radiat Oncol Biol Phys 2010;76(3, Suppl 1):S10–S19.
60. Das IJ, Chang C-W, Chopra KL, et al. Intensity-modulated radiation therapy dose prescription, recording, and delivery: patterns of variability among institutions and treatment planning systems. J Natl Cancer Inst2008;100(5):300–307.
61. Willins J, Kachnic L. Clinically relevant standards for intensity-modulated radiation therapy dose prescription. J Natl Cancer Inst 2008;100(5):288–290.
62. Holmes T, Das R, Low D, et al. American Society for Radiation Oncology recommendations for documenting intensity-modulated radiation therapy treatments. Int J Radiat Oncol Biol Phys2009;74(5):1311–1318.
63. Bentzen SM, Constine LS, Deasy JO, et al. Quantitative Analyses of Normal Tissue Effects in the Clinic (QUANTEC): an introduction to the scientific issues. Int J Radiat Oncol Biol Phys 2010;76(3, Suppl 1):S3–S9.
64. Moiseenko V, Deasy JO, Van Dyk J. Radiobiological modeling for treatment planning. In: Van Dyk J, ed. The modern technology of radiation oncology, Vol. 2. Madison, WI: Medical Physics Publishing; 2005:185–220.
65. Schultheiss TE, Orton CG, Peck RA. Models in radiotherapy: volume effects. Med Phys 1983;10:410–415.
66. Lyman JT, Wolbarst AB. Optimization of radiation therapy. III. A method of assessing complication probabilities from dose-volume histograms. Int J Radiat Oncol Biol Phys 1987;13:103–109.
67. Lyman JT, Wolbarst AB. Optimization of radiation therapy. IV. A dose-volume histogram reduction algorithm. Int J Radiat Oncol Biol Phys 1989;17(2):433–436.
68. Källman P, Lind BK, Brahme A. An algorithm for maximizing the probability of complication free tumor control in radiation therapy. Int J Radiat Oncol Biol Phys 1992;37:871–890.
69. Olsen DR, Kambestad BK, Kristoffersen DT. Calculation of radiation induced complication probabilities for brain, liver and kidney, and the use of a reliability model to estimate critical volume fractions. Br J Radiol1994;67:1218–1225.
70. Withers HR, Taylor JMG, Maciejewski B. Treatment volume and tissue tolerance. Int J Radiat Oncol Biol Phys 1988;14:751–759.
71. Kutcher G, Berman C. Calculation of complication probability factors for non-uniform tissue irradiation: the effective volume method. Int J Radiat Oncol Biol Phys 1989;16:1623–1630.
72. Niemierko A, Goitein M. Calculation of normal tissue complication probability and dose-volume histogram reduction schemes for tissues with a critical element architecture. Radiother Oncol1991;20:166–176.
73. Niemierko A, Goitein M. Modeling of normal tissue response to radiation: the critical volume module. Int J Radiat Oncol Biol Phys 1993;25:135–145.
74. Niemierko A. Reporting and analyzing dose distributions: a concept of equivalent uniform dose. Med Phys 1997;24(1):103–110.
75. Niemierko A. A generalized concept of equivalent uniform dose (EUD) [Abstract]. Med Phys 1999;26:1100.
76. McGary JE, Grant W, Woo SY, et al. Comment on “Reporting and analyzing dose distributions: A concept of equivalent uniform dose” [Med. Phys. 24, 103–109 (1997)]. Med Phys 1997;24(8):1323–1324.
77. McGary JE, Grant W, Woo SY. Applying the equivalent uniform dose formulation based on the linear-quadratic model to inhomogeneous tumor dose distributions: caution for analyzing and reporting. J Appl Clin Med Phys2000;1(4):126–137.
78. Niemierko A. Response to Comment on “Reporting and analyzing dose distributions: A concept of equivalent uniform dose” [Med. Phys. 24, 1323–1324 (1997)]. Med Phys 1997;24(8):1325–1327.
79. Abdel-Wahab M, Rengan R, Curran B, et al. Integrating the healthcare enterprise in radiation oncology plug and play—the future of radiation oncology? Int J Radiat Oncol Biol Phys 76(2):333–336.
80. Kutcher GJ, Coia L, Gillin M, et al. Comprehensive QA for radiation oncology: report of AAPM Radiation Therapy Committee Task Group 40. Med Phys 1994;21(4):581–618.
81. Bogdanovitch W. Radiation offers new cures, and ways to do harm. New York Times 24 Jan 2010. Available at: http://www.nytimes.com/2010/01/24/health/24radiation.html.
82. Williamson JF, Dunscombe PB, Sharpe MB, et al. Quality assurance needs for modern image-based radiotherapy: recommendations from 2007 interorganizational symposium on “Quality Assurance of Radiation Therapy: Challenges of Advanced Technology.” Int J Radiat Oncol Biol Phys 2008;71(1, Suppl 1):S2–S12.
83. Klein EE, Hanley J, Bayouth J, et al. Task Group 142 report: quality assurance of medical accelerators. Med Phys 2009;36(9):4197–4212.
84. ASTRO. Press release: ASTRO reaffirms commitment to quality, issues progress report on patient safety plan; 2011. Available at: http://www.astro.org/News-and-Media/News-Releases/2011/Target-Safely,-a-six-point-patient-protection-plan-developed-in-January-2010,-to-improve-the-safety-and-quality-of-radiation.aspx.
85. Pawlicki T, Mundt AJ. Quality in radiation oncology. Med Phys 2007;34(5):1529–1534.
86. Ford EC, Gaudette R, Myers L, et al. Evaluation of safety in a radiation oncology setting using failure mode and effects analysis. Int J Radiat Oncol Biol Phys 2009;74(3):852–858.
87. Pawlicki T, Dunscombe PB, Mundt AJ, et al., eds. Quality and safety in radiotherapy. New York: Taylor & Francis; 2011.
88. Rath F. Tools for developing a quality management program: proactive tools (process mapping, value stream mapping, fault tree analysis, and failure mode and effects analysis). Int J Radiat Oncol Biol Phys 2008;71(1, Suppl 1):S187–S190.
89. American College of Radiology. Practice guidelines and technical standards. Reston, VA: American College of Radiology; 2010.
90. International Atomic Energy Agency. Safety Report Series No. 17: Lessons learned from accidental exposures in radiotherapy. Vienna: International Atomic Energy Agency; 2000.
91. International Atomic Energy Agency. Comprehensive audits of radiotherapy practices: a tool for quality improvement. Vienna: International Atomic Energy Agency; 2007.
92. Royal College of Radiologists, Society and College of Radiographers, Institute of Physics and Engineering in Medicine, National Patient Safety Agency, British Institute of Radiology. Towards safer radiotherapy. London: Royal College of Radiologists; 2008.
93. Hendee WR, Herman MG. Improving patient safety in radiation oncology. Med Phys 2011;38(1):78–82.
94. Fraass B, Doppke K, Hunt M, et al. AAPM Radiation Therapy Committee Task Group 53: Quality assurance for clinical radiotherapy treatment planning. Med Phys 1998;25:1773–1829.
95. Jacky J, White CP. Testing a 3-D radiation therapy planning program. Int J Radiat Oncol Biol Phys 1990;18:253–261.
96. Van Dyk J, Barnett RB, Cygler JE, et al. Commissioning and quality assurance of treatment planning computers. Int J Radiat Oncol Biol Phys 1993;26(2):261–273.
97. Van Dyk J. Quality assurance of radiation therapy planning systems: current status and remaining challenges. Int J Radiat Oncol Biol Phys 2008;71(1, Suppl 1):S23–S27.
98. International Atomic Energy Agency. Commissioning and quality assurance of computerized planning systems for radiation treatment of cancer. Vienna: International Atomic Energy Agency; 2004.
99. Ezzell GA, Burmeister JW, Dogan N, et al. IMRT commissioning: multiple institution planning and dosimetry comparisons, a report from AAPM Task Group 119. Med Phys 2009;36(11):5359–5373.
100. Bruinvis IAD, Keus RB, Lenglet WJM, et al. Quality assurance of 3-D treatment planning systems for external photon and electron beams: Report 15 of The Netherlands Commission on Radiation Dosimetry. Delft, Netherlands; 2006.
101. Mijnheer B, Olszewska A, Fiorino C, et al. Quality assurance of treatment planning systems: practical examples of non-IMRT photon beams. ESTRO Booklet No. 7. Brussels; 2004.
102. Lavely WC, Scarfone C, Cevikalp H, et al. Phantom validation of coregistration of PET and CT for image-guided radiotherapy. Med Phys 2004;31(5):1083–1092.
103. Mutic S, Dempsey JF, Bosch WR, et al. Multimodality image registration quality assurance for conformal three-dimensional treatment planning. Int J Radiat Oncol Biol Phys 2001;51(1):244–260.
104. Gregoire V, Coche E, Cosnard G, et al. Selection and delineation of lymph node target volumes in head and neck conformal radiotherapy. Proposal for standardizing terminology and procedure based on the surgical experience. Radiother Oncol 2000;56(2):135–150.
105. Gregoire V, Levendag P, Ang KK, et al. CT-based delineation of lymph node levels and related CTVs in the node-negative neck: DAHANCA, EORTC, GORTEC, NCIC, RTOG consensus guidelines. Radiother Oncol2003;69(3):227–236.
106. Matzinger O, Gerber E, Bernstein Z, et al. EORTC-ROG expert opinion: radiotherapy volume and treatment guidelines for neoadjuvant radiation of adenocarcinomas of the gastroesophageal junction and the stomach. Radiother Oncol 2009;92:164–175.
107. Poortmans PMP, Ataman F, Bernard Davis J, et al. Guidelines for target volume definition in post-operative radiotherapy for prostate cancer, on behalf of the EORTC Radiation Oncology Group. Radiother Oncol 2007;82:121–127.
108. Symon Z, Tsvang L, Wygoda M, et al. An interobserver study of prostatic fossa clinical target volume delineation in clinical practice: are regions of recurrence adequately targeted? Am J Clin Oncol2011;34(2):145–149.
109. van Mourik AM, Elkhuizen PHM, Minkema D, et al. Multiinstitutional study on target volume delineation variation in breast radiotherapy in the presence of guidelines. Radiother Oncol 2010;94(3):286–291.
110. Miralbell R, Vees H, Lozano J, et al. Endorectal MRI assessment of local relapse after surgery for prostate cancer: A model to define treatment field guidelines for adjuvant radiotherapy in patients at high risk for local failure. Int J Radiat Oncol Biol Phys 2007;67(2):356–361.
111. Henriquez FC, Castrillon SV. Confidence intervals in dose volume histogram computation. Med Phys 2010;37(4):1545–1553.
112. Stern RL, Heaton R, Fraser MW, et al. Verification of monitor unit calculations for non-IMRT clinical radiotherapy: Report of AAPM Task Group 114. Med Phys 2011;38(1):504–530.
113. Black RD, Scarantino CW, Mann GG, et al. An analysis of an implantable dosimeter system for external beam therapy. Int J Radiat Oncol Biol Phys 2005; 63(1):290.
114. Kruse JJ. On the insensitivity of single field planar dosimetry to IMRT inaccuracies. Med Phys 2010;37(6):2516–2524.
115. Mans A, Wendling M, McDermott LN, et al. Catching errors with in vivo EPID dosimetry. Med Phys 2010;37(6):2638–2644.
116. RTOG. Image-Guided Radiation Therapy Committee. Int. J. Radiat Oncol Biol. Phys. 2001;51(3, Suppl 2):60.
117. Meyer JL, ed. IMRT, IGRT, SBRT, 2nd ed. Basel: Karger; 2011.