Michael M. Altaweel,
David L. Johnson
INTRODUCTION
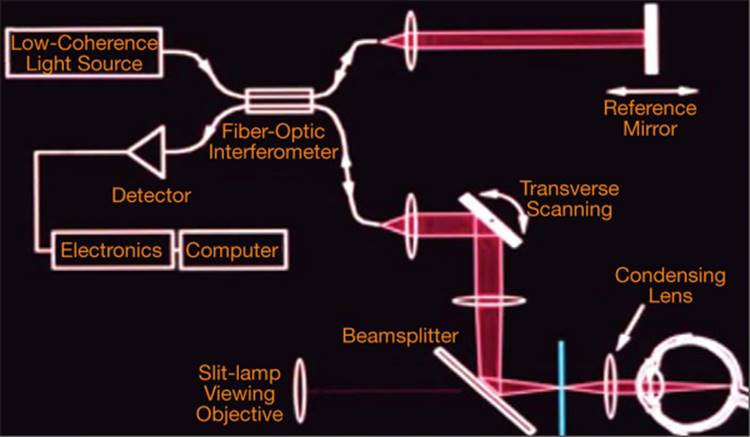
Optical coherence tomography (OCT) allows noninvasive real-time cross-sectional imaging of living tissues by measuring their optical properties (see Fig. 130.1). The use of OCT in posterior segment imaging was first reported by Huang et al in 1991.[1] Since, it became readily available for clinical use in the mid-1990s, OCT has revolutionized the way ophthalmologists diagnose and manage certain eye conditions. This is in large part due to its technical ease of use, noninvasive nature, and the incredible amount of information it provides, particularly regarding the condition of the retina and its relationship to surrounding structures. It has also gained greater use as an imaging modality for glaucoma and for anterior segment evaluation and management.[2]
|
|
|
|
FIGURE 130.1 OCT performs cross-sectional imaging of structures within the eye, allowing a noninvasive 'optical biopsy' with resolutions nearing that of histopathology. OCT is similar in principle to ultrasound but uses light rather than sound to generate images. For posterior segment imaging, light is generated from a superluminescent diode. This light is split into a reference beam and a measurement beam by a partially reflecting mirror. A portion of the measurement beam light is backscattered or reflected back from different microstructural features in the posterior segment. The reference beam is reflected back from the mirror which is at a known distance. The two light waves can combine and interfere, producing an output which is processed and quantified by the photodetector within the machine.[8-10] The technique of low-coherence interferometry is utilized to allow measurement.[8,9] The low-coherence light utilized by the OCT only causes interference when the reference beam echo delay equals the echo delay in the measurement beam. The interferometer therefore correlates the measurement light with the reference light that has a known delay to allow measurement of the echo delay and amplitude of the backscattered or backreflected light. |
OCT is also useful in other medical specialties, including otolaryngology, cardiology, gastroenterology, and vascular surgery.[3-7] Conventional imaging modalities such as magnetic resonance imaging (MRI), computerized tomography (CT), or ultrasound have maximum resolutions that are 1/10th to 1/100th that of commercially available OCT systems. OCT affords unprecedented in vivo resolution of biological tissues.
The purpose of this chapter is to introduce the technology of OCT imaging, more specifically retinal imaging. It will also provide a framework for interpretation of normal images and those of certain pathologic conditions. The examples will highlight how OCT has improved our diagnostic ability, added to our understanding the pathogenesis of retinal disorders, and influenced their management. The role of OCT in clinical trials will be discussed. OCT imaging of multiple retinal disorders will also be found in other clinical chapters. OCT imaging for the anterior segment and glaucoma will be discussed in other portions of this book.
TECHNOLOGY
The globe lends itself well to be studied using OCT because of its optical accessibility with relatively transparent tissues.[11] Posterior segment OCT utilizes light in the 800-820nm wavelength generated from a superluminescent diode. Anterior segment OCT utilizes a longer wavelength of 1300nm in order to permit deeper penetration of denser biologic tissues such as the sclera. OCT has limited clinical usefulness in tissue depths greater than 2-3 mm. Because of the extremely high detection sensitivity of the photodetector, <1 mW of power is required to obtain adequate images. This is well within safe acceptable limits.
'Tomography' refers to the fact that OCT forms a two-dimensional cross-sectional image of the retina based on a series of axial or longitudinal scans and measurements taken by the machine. With each scan pass of the retina, anywhere from 128 to 512 axial range samples are captured. Each range sample is analogous in many ways to conventional A-scans. Each of these scans is composed of 1024 data points which are 1-2 mm in depth. In order to construct a tomographic image, these data points are integrated and transformed into an image displayed in a meaningful way on the computer screen.[12]
Commercially available instrument such as the Stratus OCT-3 (Carl Zeiss Meditec Inc, Dublin, CA) have axial resolutions of 8 ?m and transverse resolution of 20 ?m. Machines used in research settings are capable of axial resolutions of 2-3 ?m[13-15] These ultrahigh-resolution OCT machines provide an unprecedented level of microstructural detail.[16]
The OCT unit consists of an acquisition module connected to a computer. Test results are displayed on a computer screen. Currently available software packages have ?20 acquisition modules or scanning modes. Modes vary according to scan patterns, resolution of microstructure, acquisition times, and target tissue of interest. Automated analysis protocols facilitate interpretation of data. Quantitative data regarding retinal thickness and qualitative information regarding morphology are obtained from the evaluation of an OCT scan. Longitudinal follow-up is possible as data from prior scans is stored on the computer hard drive or an external storage device.
OBTAINING IMAGES
One of the chief advantages of OCT versus other retinal imaging modalities is the noninvasive nature of the test. The patient is placed into the acquisition module, which is similar in design to a slit lamp. Mydriasis is helpful but not always necessary. The operator views in real time an infrared video image of the fundus displayed on the computer monitor to ensure proper alignment. The patient views a fixation light. As the scanning light used is near infrared, the patient rarely perceives it during the scan and therefore experiences minimal or no discomfort.
A sequence of axial measurements at various transverse positions is obtained in order to form a tomographic or two-dimensional representation of the retina. The faster the image acquisition time, the lower the pixel density or transverse resolution will be. Conversely, the opposite is true. Commercially available OCT instruments obtain scans at ?400 axial scans per second. In order to obtain higher-resolution scans with 512 transverse pixels, 1.28s are required (T = 512/400) per scan line. Lower resolution scan lines with a transverse pixel density of 128 require only 0.32s to acquire. These faster scans sacrifice transverse resolution while decreasing the amount of motion artifact and required patient cooperation.[12]
Typical macular scans are 6 mm in length but can be adjusted by the operator. Depending upon the acquisition protocol, anywhere from 2 to 24 scan lines are performed. Scan patterns can also be adjusted. The most commonly employed scanning patterns for macular pathology are the 'fast macular' scan and high-resolution radial scan. Fast macular scans obtain six cross-sectional scans 30° apart, with each passing through the center of the macula. The fast macular scan has a transverse resolution of 128 pixels and is obtained in 2.5s. The radial line scan has a transverse resolution of 512 pixels, thus providing a much higher level of detail, but requires much more time to obtain and repeated efforts at fixation. Macular thickness and gross abnormalities can be sufficiently interpreted using the fast macular protocol[12] and the results of testing are more reliable in situations where fixation is difficult for the patient.[17] The high-resolution cross-hair scan is often used to provide greater detail for assessment of morphological changes in the retina and adjacent structures.
|
Key Features of OCT |
|||||||||||||||
|
INTERPRETATION OF NORMAL RETINAL ANATOMY
The ability to image normal morphology and structural abnormalities with OCT is based upon the fact that biologic tissues of differing densities (i.e., normal retina, RPE, choroid, vitreous, hemorrhage, edema, drusen, etc) have different backscattering properties.[12] The OCT scan of a normal retina demonstrates characteristic features, including a distinct ability to distinguish between the retina and the vitreous, the retina and the RPE, and between the RPE and the choroid. The foveal depression is well demonstrated. Details of retinal layers have been progressively better visualized with more recent versions of the OCT.
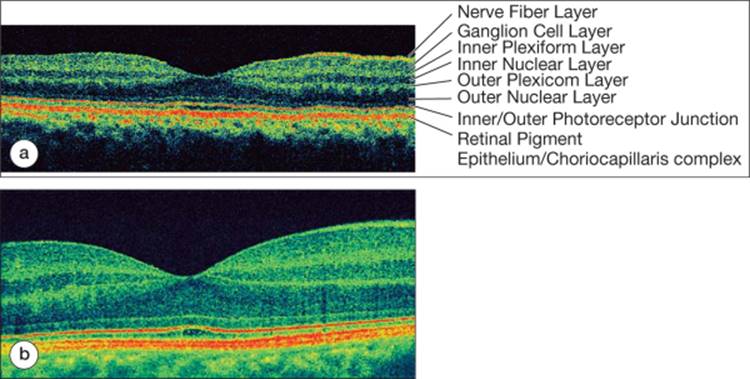
Displayed in Figure 130.2a is a cross-sectional image of the posterior pole in a normal eye obtained on the Stratus OCT-III machine. By convention the vitreous cavity is superior and the external layers of the retina and choroid are inferior. Figure 130.2b is an ultrahigh-resolution scan of a normal retina, which demonstrates much more distinction between structural elements within the retina.
|
|
|
|
FIGURE 130.2 (a) Normal retinal anatomy. Notice how the NFL increases in thickness nasally toward the optic nerve (right side of image). Cellular layers, such as the ganglion cell layers and the inner and outer nuclear layers have less intense backscattering due to the density and orientation of their respective elements. Layers with more intense reflectivity include the RPE/Choriocapillaris, the junction between the inner and outer segments of the photoreceptor layer, the inner and outer plexiform layers, as well as the NFL. Axial resolution is 8 ?m. (b) Ultrahigh-resolution OCT of a normal retina. Axial resolution is 2 ?m. Notice the greater ability to identify retinal structures/layers. |
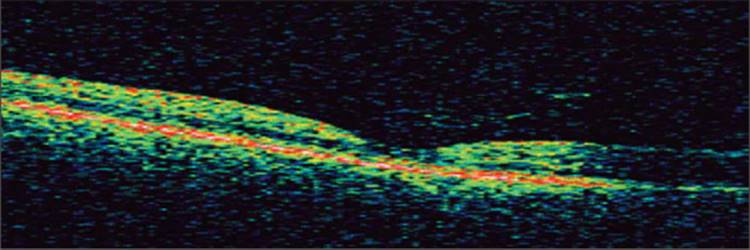
As demonstrated above, the OCT image closely resembles the histological anatomy of the retina. Delineation of cellular details with commercially available OCT technology is not yet possible. However, it is possible to distinguish between cellular and noncellular elements of the retina.[12] Ultrahigh-resolution imaging technology delivers an even greater level of resolution.[13,15] The interface between the posterior hyaloid and the internal limiting membrane (ILM) can usually only be visualized if the hyaloid is elevated off the surface of the retina (Fig. 130.7).[10] The fovea is displayed with its normal thinning, which is due to the absence of the inner retinal layers and the presence of only a thickened photoreceptor layer and the outer nuclear layer.
|
|
|
|
FIGURE 130.7 PVD. Notice the thin hyperreflective band just above the surface of the retina representing the posterior vitreous cortex, or hyaloid. |
A false color coding system ascribed by the image processing algorithm is used to distinguish between the different microstructural layers of the retina. The reflectivity of different retinal layers is based upon the arrangement of their structures as well as their biological densities and degree of pigmentation. Those structures with high biological reflectivity are represented by red, medium reflectivity with yellow/green, and those with low reflectivity are blue. Absence of a reflectivity signal is represented by black. The nerve fiber layer (NFL) and plexiform layers are highly reflective due to the horizontally oriented axonal structures. The NFL increases in thickness and reflectivity close to the optic nerve. The nuclear layers are less reflective and appear blue to black on cross-sectional images. The RPE and choriocapillaris form the outermost highly reflective structure visible due to their high melanin and vascular content respectively. These two layers cannot usually be distinguished on conventional OCT imaging because of their close proximity to one another. External to the choriocapillaris are the larger sized choroidal vessels. These vessels, as well as deeper structures, cannot usually be seen on OCT due to the shadowing from the overlying RPE and choriocapillaris.[10]
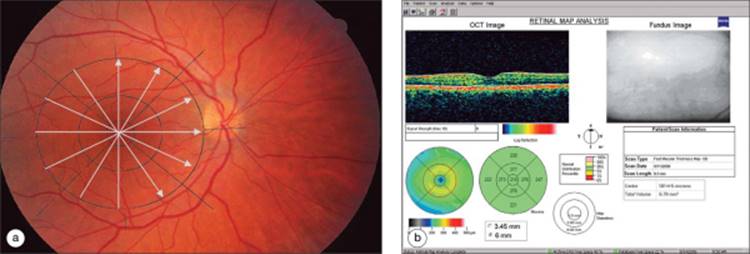
Scanned images have a legend that indicates the directionality of the currently displayed scan, as demonstrated in Figure 130.3b. The scan direction is proceeded from inferior to superior in the scan displayed. By convention, the right side of the image corresponds to the arrowhead. OCT quantitative results are generally represented in a retinal map. The macula is artificially divided into nine regions and the average retinal thickness is calculated for each region. The inner circle of the map has a diameter of 1.0 mm and correlates roughly with the fovea. The middle circle has a diameter of 3.0 mm and the outer circle a diameter of 6.0 mm, which is the length of the axial scans. A color coded map along with a legend is displayed in order to facilitate rapid interpretation of numerical values. Greater retinal thickness is represented by the 'hotter' colors such as red and white. Average retinal thickness is represented by green, and thin or atrophic areas of retina are represented by the 'cooler' colors such as blue or black. Central retinal or foveal thickness and total volume of the macula are displayed in numerical format. The standard deviation of the center point is determined by comparing the six points which cross through the center in the scanning protocol and is recorded with the center point.
|
|
|
|
FIGURE 130.3 (a) The retinal thickness map is derived from six radial scans oriented 30° apart, all passing through the center of the macula. (b) Retinal thickness map: the thickness for each of the nine macular subfields is displayed in both numerical as well as color coded formats. Central point thickness in this patient is 181 ?m, and the standard deviation is 5 ?m. The displayed scan is oriented from inferior to superior. |
Image processing algorithms allow automated measurement of retinal thickness. This is accomplished by first determining the anterior and posterior surfaces of the retina. The anterior surface of the retina is defined by the transition from the low reflectivity of the vitreous cavity to the high reflectivity of the NFL. The posterior surface of the retina is typically defined by the high reflectivity of the junction between retinal tissue and the RPE/choriocapillaris complex.[12] Normal retinal thickness is 182 ?m for the OCT-III.[18] Determinations of retinal thickness are performed automatically and can be the source of erroneous measurements.
DISTINGUISHING ARTIFACTS
In order to interpret OCT and determine whether the quantitative information is accurate, one must assess the quality of an OCT scan and recognize OCT artifacts. Fortunately, obtaining adequate OCT images is a quick process. Most artifacts are derived from difficulty with patient cooperation or abnormalities within the ocular media rather than operator error.[19]
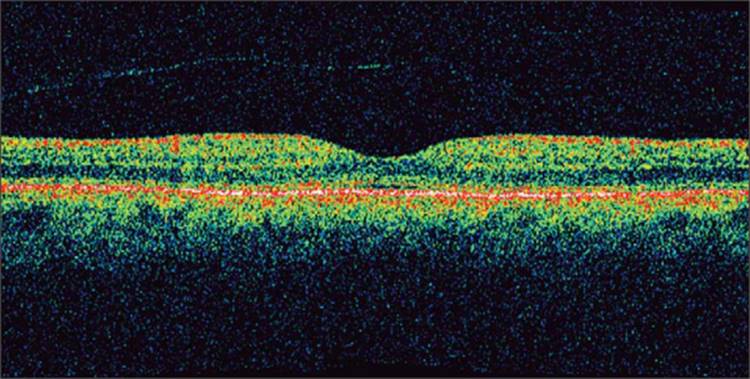
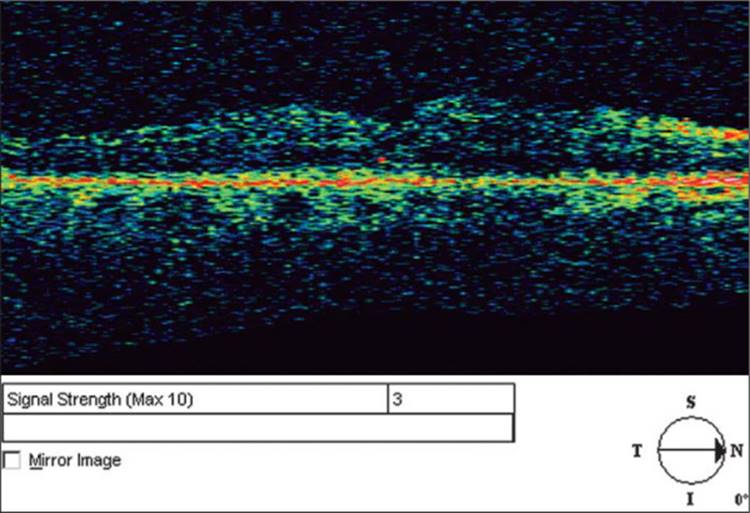
Mydriasis is not always necessary to obtain OCT but may provide a higher signal-to-noise ratio and consequently better microstructural details. Dilation also decreases the amount of 'vignetting' which is described below. Obtaining quality OCT images depends upon the light being able to reach the target tissue. If there is significant media opacification such as corneal opacification or severe cataract there will be less light reaching the posterior segment and less light returning to the inferometer for detection. This 'signal-to-noise ratio' is displayed on the screen and labeled as 'signal strength'. A signal strength of 10 represents the highest quality imaging whereas a signal strength of zero represents the lowest quality. If there is little light reaching the tissue, the images appear dull or 'washed out' and it is difficult to detect subtle abnormalities and differences in tissue reflectivity. Figure 130.4 shows an example of low signal strength. Notice how the ordinarily highly reflective structures appear blue or even black. Moderate media opacities such as early cataract, asteroid hyalosis, and mild vitreous hemorrhage do not preclude adequate imaging.[20,21] OCT can be performed through silicone oil, but not through intraocular gas.
|
|
|
|
FIGURE 130.4 Example of low 'signal-to-noise ratio'. Notice how the entire image appears 'washed out'. It is difficult to discern details of the retinal microstructure. The signal strength is relatively low at three. |
Another artifact that must be recognized is that of 'vignetting'. Vignetting occurs as the light beam is obscured by part of the iris, causing less light to reach the retina in that area.[12] The findings are quite characteristic and easily recognized (Fig. 130.5).
|
|
|
|
FIGURE 130.5 OCT image of a normal macula. The right side of the image displays a common artifact known as vignetting. This occurs when the iris blocks a portion of the light. This may occur with poor pupil dilation. |
Poor patient cooperation can lead to abnormalities on the OCT image. Image processing software corrects for a certain amount of longitudinal movement by the patient but there is little to no software correction for transverse movement or poor patient fixation. This results in reduced image quality and transverse resolution. This is particularly a problem in patients with poor visual acuity. Retinal thickness data is often less reliable in such situations. This is best demonstrated as a large standard deviation in the center-point thickness measurement. The problem is partially alleviated by utilizing the fast map protocol rather than the high-resolution scanning protocol for such patients.[17]
The automated algorithm, which determines and draws the anterior and posterior borders of the retina to allow retinal thickness measurements, can be erroneous. This is noted as misdrawn borders on the retinal thickness map (Fig. 130.6). If this occurs, the data generated by the OCT would not be correct. For a prior version of the OCT (OCT II), a graphical user interface was developed which allowed correction of this interface and subsequent measurement data.[22] This tool is being developed for future versions of the OCT.
|
|
|
|
FIGURE 130.6 Misdrawn borders results in erroneous measurement in a portion of the retinal thickness map. |
ENSURING HIGH-QUALITY OCT DATA
|
1. |
All six underlying scans present for retinal thickness map |
|
|
2. |
ILM and RPE borders drawn correctly |
|
|
3. |
Standard deviation of the center point <10% (of center-point value) |
|
|
4. |
Adequate signal strength (5 or more) |
|
|
5. |
Macula centered in the scan |
CLINICAL CONDITIONS
OCT has improved our understanding of the pathophysiology of retinal disorders, our ability to distinguish between differential diagnoses with a similar clinical appearance, our ability to follow conditions in a noninvasive manner, our ability to make treatment decisions, and our ability to educate our patients. The following examples demonstrate the utility of OCT and illustrate commonly identified abnormalities.
VITREORETINAL INTERFACE ABNORMALITIES
Posterior Vitreous Detachment
Posterior vitreous detachment (PVD) is a common phenomenon, observed in 63% of eyes over the age of 70. It results from syneresis of the vitreous gel. When the liquefied vitreous obtains access to the retro-hyaloid space through a defect in the posterior hyaloid face, PVD can occur.[23-25]
PVD often shows up on OCT as a thin, faint hyper reflective line lying above the surface of the retina. In order for the posterior hyaloid to be visualized on OCT the hyaloid must be within 100-200 ?m of the surface of the retina.[12,26] Figure 130.7, shows an example of a PVD.
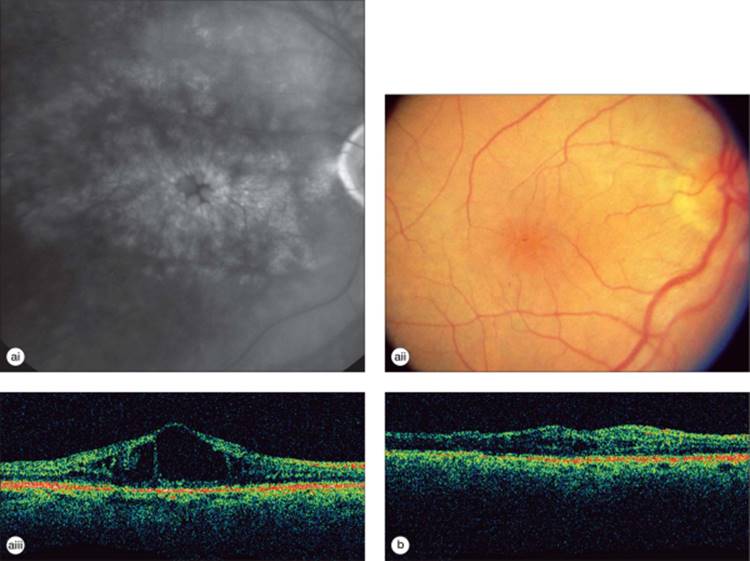
Vitreomacular Traction Syndrome
Vitreomacular traction syndrome (VMT) results from an abnormally firm adherence of the posterior hyaloid to the macular region with anteroposterior and tangential traction causing distortion of the macular architecture and retinal thickening.[27,28] Vision is frequently decreased secondary to the retinal edema as well as the abnormal macular contour. The condition may be difficult to appreciate on clinical exam, but is clearly demonstrated by OCT imaging.[29-36]
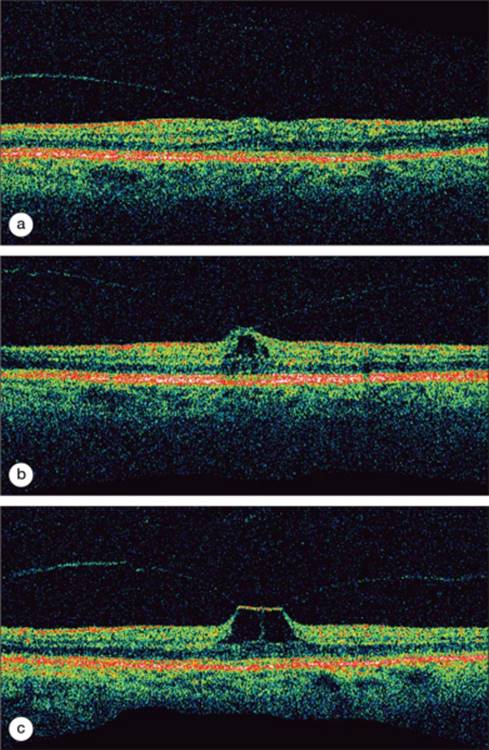
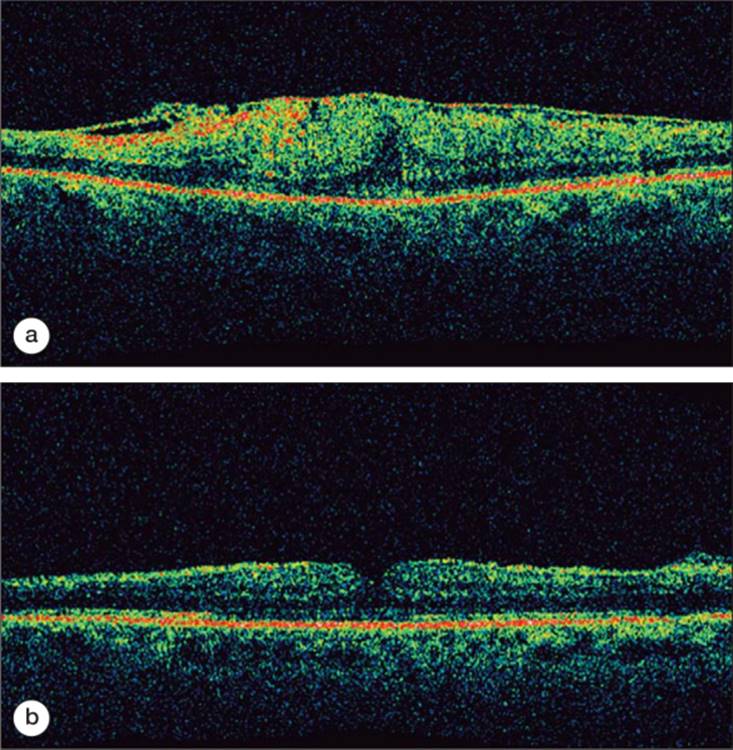
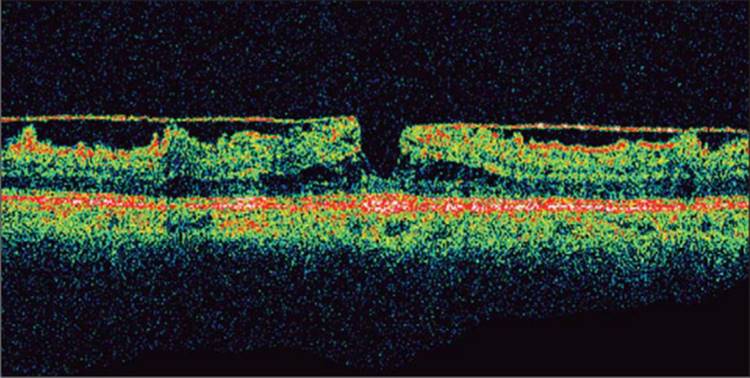
Figure 130.8 demonstrates a case of VMT traction. This is a series of OCT images taken from the same patient over the course of 13 months. Notice the thin band representing the posterior hyaloid which is inserting onto the surface of the retina. The retina displays cystic changes and there can be subretinal and sub-RPE fluid as well. There is obvious distortion of normal foveal anatomy in the later images.
|
|
|
|
FIGURE 130.8 (a-c) This series of figures demonstrates a case of VMT that progressed over the course of 13 months. The patient complained of increasingly distorted and decreased vision. |
OCT is very useful in understanding and planning the management for VMT and provides an excellent tool for patient education. These patients can clearly understand the rationale for proceeding with a vitrectomy and release of adhesions as their condition deteriorates. The OCT is equally useful in assessing management outcomes.
Epiretinal Membrane
Epiretinal membranes are caused by glial proliferation and contracture on the surface of the retina. This can lead to abnormal macular and vascular architecture. Fluorescein angiography frequently will demonstrate vascular leakage.[27,37-41]
On OCT, epiretinal membranes are manifested by an abnormal highly reflective structure lying on the surface of the retina. The membrane is more easily distinguished if there is some separation between the membrane and the surface of the retina. If there is no separation one may be able to use indirect clues to appreciate the presence of the membrane such as surface contracture and macular edema.
OCT is helpful in confirming the diagnosis as well as quantifying the amount of macular distortion present. It is often quite useful in following the patients in the pre- and postoperative stages. Figure 130.9 demonstrates a case of epiretinal membrane causing decreased vision with images of the same patient after epiretinal membrane peeling.
|
|
|
|
FIGURE 130.9 (a) demonstrates an epiretinal membrane causing distortion of macular anatomy with loss of the foveal depression and thickening of the retina. The epiretinal membrane is easily identified as the highly reflective structure lying on the surface of the retina. (b) Four months after membrane peeling, the patient's macular anatomy has returned to near normal with return of a foveal depression. One can appreciate the extent of the epiretinal membrane peeling by noticing the residual membrane on the right side of the image. |
Epiretinal membranes can lead to the appearance of a 'pseudohole'. OCT can be useful in distinguishing a 'pseudohole' from a full thickness macular hole, which can be a difficult clinical distinction. Figure 130.10 demonstrates a severe ERM with pseudohole resulting in the appearance of a steepened foveal contour, intraretinal edema, and separation of the outer nuclear layer and the outer plexiform layer. In contrast to a macular hole, the photoreceptor layer remains intact.[42-45]
|
|
|
|
FIGURE 130.10 Macular pseudohole associated with an epiretinal membrane. Notice the highly reflective membrane lying just above the surface of the retina. One can appreciate that this membrane has caused an irregular retinal surface as well as intraretinal edema. There is a layer of photoreceptors at the base of the pseudohole. |
In providing patient education regarding their ERM, the OCT is invaluable, particularly since the abnormalities may be subtle on fundus photographs.
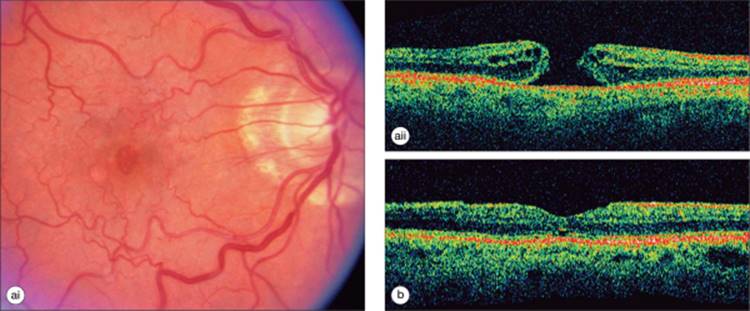
Idiopathic Macular Holes
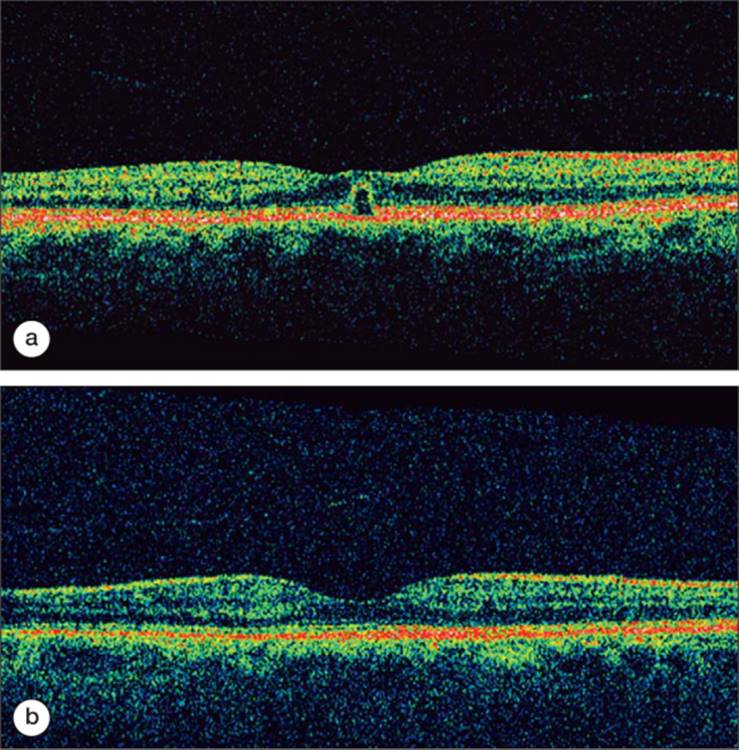
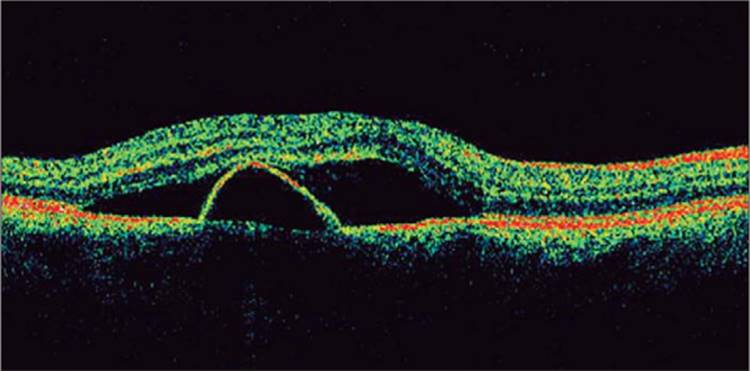
Macular holes are full thickness defects in the neurosensory retina caused by abnormal tangential or oblique vitreous traction on the foveal region. OCT assists in the diagnosis of macular hole by clearly demonstrating the retinal defect and has enhanced our understanding of the pathophysiology of hole formation.[45-47] Such images are of great benefit in patient education regarding their disorder and proposed surgical correction. Demonstration of the pathophysiology of various stages of macular holes also assists the surgeon in making treatment decisions, including whether surgery is required or not.[48,49] Early stage holes may appear as a yellow dot or circle on biomicroscopic examination, with a long differential diagnoses. OCT can demonstrate the early stages of a hole and the tractional elements responsible for hole formation. Figure 130.11 demonstrates a stage I impending macular hole. There is mild loss of visual acuity and mild metamorphopsia. A foveolar detachment is present. 50% of stage I holes will spontaneously resolve.[50,51] Therefore the OCT helped in making the correct diagnosis and in making the decision to observe the condition rather than operate.
|
|
|
|
FIGURE 130.11 (a) Demonstrates an impending macular hole with a foveolar detachment. Notice the thin posterior hyaloid band above the surface of the retina inserting onto the fovea. (b) Three months later the posterior hyaloid completely detached and the stage I hole spontaneously resolved. Notice once again the separated posterior hyaloid lying above the surface of the retina. |
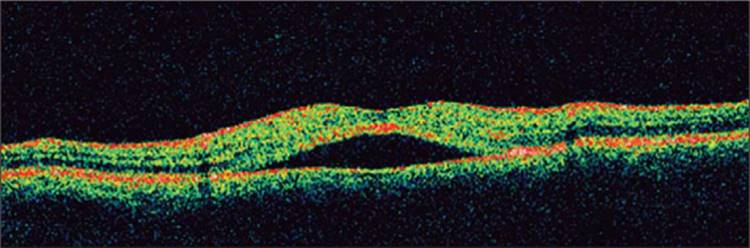
Surgical developments in the repair of macular hole have included the increasing addition of ILM peeling in an effort to improve hole closure rates.[52-56] Controversy exists concerning whether final visual outcome is improved, and whether ILM peeling is necessary.[57-59] For stage II macular holes, OCT may be instrumental in directing the choice of surgical procedure. As illustrated in Figure 130.12, stage II holes (Gass biomicroscopic staging) may be distinguished as stage IIA if the posterior hyaloid is still attached and causing traction on the edge of the macular hole or stage IIB if such traction has already been released.[60] It is postulated that a stage IIA hole may be less likely to require an ILM peel to improve closure rates than a stage IIB hole. This would avoid the additional risk imposed by performing a membrane peel during surgery.
|
|
|
|
FIGURE 130.12 (a and b) Stage IIA macular hole with a persistent attachment of the posterior vitreous leading to traction. Stage IIB hole with posterior vitreous separation may be more appropriate to treat with additional intervention such as ILM peel. |
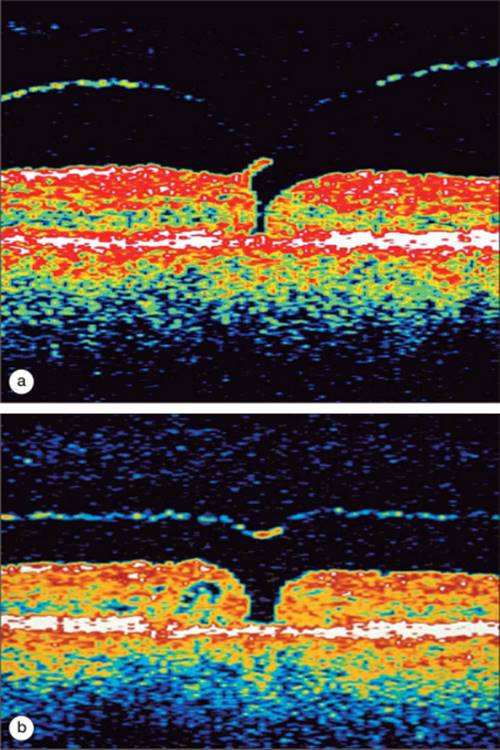
OCT can also be useful in determining the prognosis for patients with a macular hole. Figure 130.13a represents a full thickness stage IV macular hole. The rounded edges of the hole, cystic changes in the adjacent retina, and large width of the hole indicates a severe macular hole and may suggest features of chronicity. There is a higher percentage of nonclosure or lack of visual improvement despite hole closure with stage IV holes than with smaller macular holes.[61-64] The OCT is an excellent tool in providing patient education regarding macular hole and in demonstrating the anatomical success of surgical repair (Fig. 130.13b).
|
|
|
|
FIGURE 130.13 (a) Represents a stage IV full thickness macular hole with a PVD (not visible). Notice the signs of severity such as the rounded contour at the edge of the hole as well as the cystic changes within the retina adjacent to the hole. (b) Successful closure of this macular hole after pars plana vitrectomy with ILM peeling and intraocular gas tamponade. There is a return to a relatively normal foveal anatomy. |
VASCULAR ABNORMALITIES
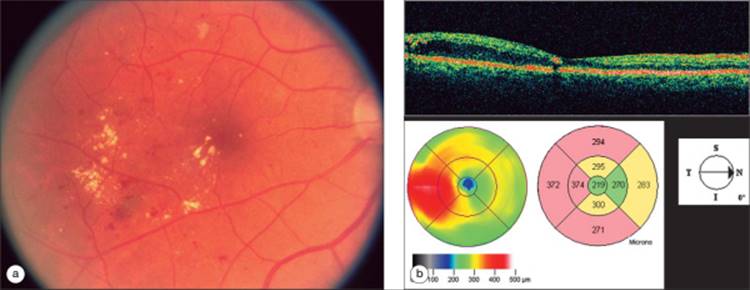
Diabetic Macular Edema
Macular edema is the leading cause of vision loss in diabetics. It affects ?14-25% of patients who have had diabetes for 10 years or more.[65-69] OCT can be used to help detect and quantify the amount of diabetic macular edema present, the proximity and involvement of the foveal region by the edema, as well as the response to therapy.[70,71] Subclinical macular edema may only be appreciated with OCT imaging. A National Eye Institute sponsored trial is assessing the utility of early intervention for such patients (Subclinical Diabetic Macular Edema Study). A number of clinical trials have recently incorporated retinal thickness as measured by OCT as a secondary endpoint. Comparisons with standardized visual acuity have found variable correlation, however morphological responses to therapy are well visualized with OCT.[72-74] Retinal thickness parameters are utilized in making re-treatment decisions. In clinical practice, the use of OCT to follow patients with diabetic macular edema has increased greatly, particularly for those managed with intravitreal steroid or anti-VEGF injections.
Figure 130.14, shows the transverse image and macular thickness assessment in a patient with clinically significant diabetic macular edema.
|
|
|
|
FIGURE 130.14 OCT and corresponding color fundus image of a patient with clinically significant diabetic macular edema. The transverse scan demonstrates intraretinal edema collecting on the temporal side of the fovea. The topographical image shows the location and extent of the retinal edema. Notice on the cross-sectional image the hard exudate immediately temporal to the fovea causing a mild shadowing effect. |
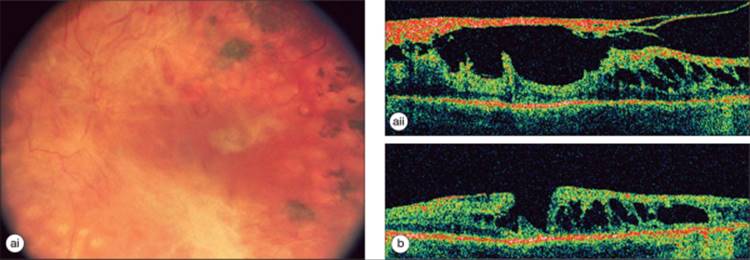
Proliferative Diabetic Retinopathy
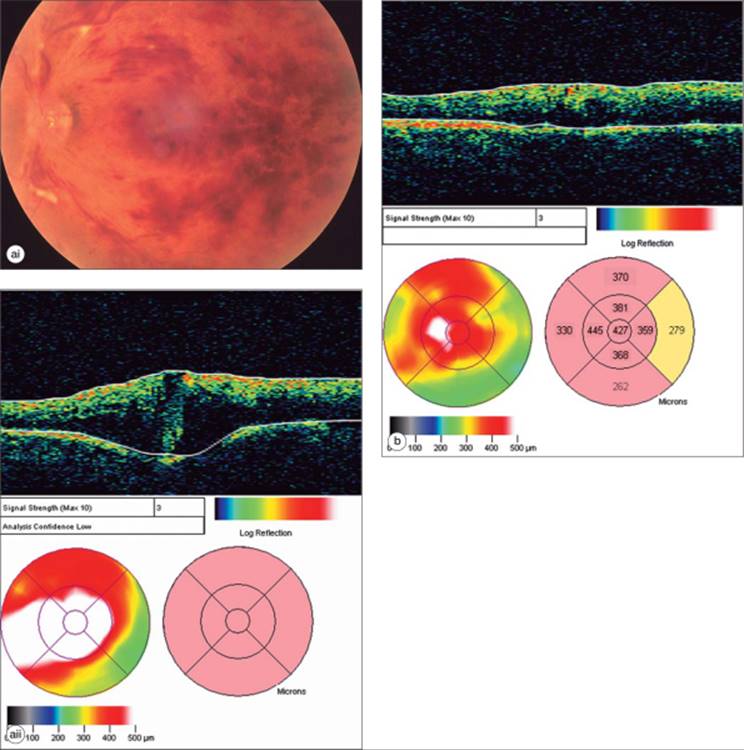
Diabetes can lead to the development of extraretinal fibrovascular proliferation extending beyond the ILM into the vitreous. Partial PVD in these cases can lead to the development of vitreous hemorrhage, macular heterotopia, and tractional retinal detachment.
Figure 130.15 illustrates the utility of OCT in surgical planning, with points of adhesion and traction evident.[75] Pars-plana vitrectomy with membrane peeling resulted in an improved macular anatomy.
|
|
|
|
FIGURE 130.15 (a) Diabetic tractional detachment of the macula. There is a thick fibrovascular membrane lying on the surface of the macula causing a tractional detachment with accumulation of a large amount of intraretinal edema. (b) Following pars plana vitrectomy with membrane peeling there is a return to a more normal macular architecture. There is still a large amount of cystic intraretinal edema present. |
Cystoid Macular Edema
Visually significant cystoid macular edema (CME) is one of the most common reasons for suboptimal visual recovery after uncomplicated cataract extraction, occurring in ?1-2% of patients. Occurrence rates may be higher in complicated cases, aphakia, diabetics, and in patients receiving topical glaucoma therapy with prostaglandin analogs.[76,77] Onset is usually 6-8 weeks after surgery.
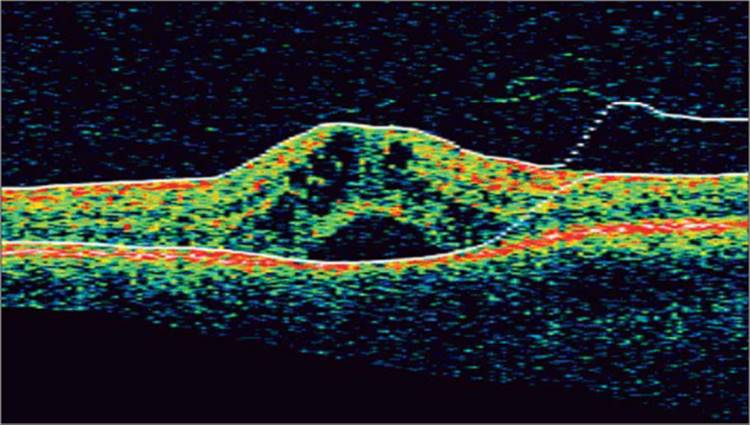
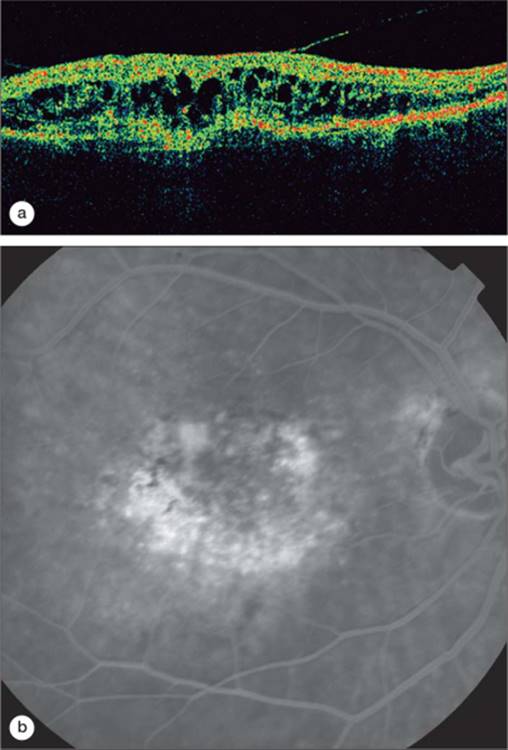
OCT is a noninvasive alternative to fluorescein angiography in making the diagnosis and following CME. The amount of intraretinal edema can be quantified. The edema is often contained within cystoid spaces in the outer plexiform layer. OCT also helps to determine if there is a component of vitreous traction contributing to the macular edema. Figure 130.16 reveals a case of CME after uncomplicated cataract extraction. OCT is particularly helpful in the diagnosis of CME associated with the therapeutic use of Niacin, as the fluorescein angiogram generally does not demonstrate leakage in these cases.[78-80]
|
|
|
|
FIGURE 130.16 (a) Patient with CME after uncomplicated extracapsular cataract extraction. Cystoid spaces are evident. There is no VMT.(b) After 2 months of treatment with topical nonsteroidal antiinflammatory drops, much of the edema has resolved. |
Branch Retinal Vein Occlusion
Branch retinal vein occlusions (BRVO) occur most commonly at arteriovenous crossings in the setting of systemic hypertension. The retinal artery can compress the vein within their common adventitial sheath, resulting in turbulent flow and thrombosis. Systemic abnormalities such as vasculitis or coagulation disorders may also lead to BRVO. The clinical picture is one of sudden painless vision loss due to ischemia, hemorrhage, or associated macular edema.
OCT is useful for evaluating the severity of macular edema associated with retinal vascular occlusion. It does not replace fluorescein angiography in the initial diagnostic evaluation but compliments it and quantifies the degree of edema (Fig. 130.17).[81,82] It is very useful in following the natural history or response to therapy in a noninvasive manner. It has been used to assist in management decisions and is a secondary endpoint in current therapeutic trials, including the standard care versus intravitreal triamcinolone for retinal vein occlusion (SCORE) study. The standard of care for BRVO with secondary center involving macular edema has been observation for a period of 3 months, followed by a treatment with grid laser in the area of ischemia and leakage if the visual acuity was less than or equal to 20/40.[83] OCT can be helpful in determining if the macular edema is worsening before this point and whether intervention may be required earlier. Conversely, it can also determine if the macular edema has been improving over the 3 months and further observation might be reasonable. Intravitreal steroids and anti-VEGF intravitreal agents have been utilized as alternative treatments with the response to therapy generally evaluated by a combination of visual acuity and retinal thickness on OCT. As these agents have a temporary effect, repeat OCTs assist the clinician in determining the optimal timing for re-treatment.
|
|
|
|
FIGURE 130.17 Inferior branch vein occlusion. Notice the cystic intraretinal edema on the cross-sectional image. The macular thickness map confirms that most of the edema is inferior to the fovea. |
Central Retinal Vein Occlusion
Central retinal vein occlusion (CRVO) is due to occlusion of the central retinal vein at or posterior to the level of the lamina cribrosa. An atherosclerotic central retinal artery may impinge upon the vein, causing turbulence, endothelial damage, and thrombus formation.[84] Clinical examination often reveals dilated and tortuous veins, optic disk edema, intraretinal hemorrhages, and retinal edema. Vision loss in CRVO may due to ischemic insult or macular edema or both. OCT has been useful in evaluating the degree of retinal thickening, which is often very severe (center-point thickness greater than 500 ?m is common) (Fig. 130.18a). The Central Vein Occlusion Study found that grid laser reduced macular edema but did not result in improved visual acuity.[85,86] Therefore the standard of care for macular edema associated with this disorder has been under observation. Among the many treatments more recently attempted for CRVO, the most frequently utilized is the injection of intravitreal steroid or anti-VEGF agents. OCT demonstrates well the effect of such medications on the macular edema (Fig. 130.20b) and can assist the clinician in making treatment decisions.[87,88] If the edema resolves but the visual acuity remains poor then the degree of ischemia probably limits the visual potential and makes further injections less valuable. Conversely, if the edema resolves well and visual acuity improves, then repeating injections for future recurrences of edema makes sense. In ongoing clinical trials, retinal thickness measured by OCT is a secondary endpoint.
|
|
|
|
FIGURE 130.18 (a) CRVO. Notice the large amount of intraretinal edema manifest on the cross-sectional image and the macular thickness map. The apparent concavity of the RPE/choriocapillaris band is an artifact due to the automated image processing software. (b) Four weeks after receiving 4 mg of intravitreal Triamcinolone, the patient's macular thickness decreased markedly. |
|
|
|
|
FIGURE 130.20 CSCR with a pigment epithelial detachment. The pigment epithelial detachment was much more clearly visualized with OCT than with fluorescein angiography. |
Central Serous Chorioretinopathy
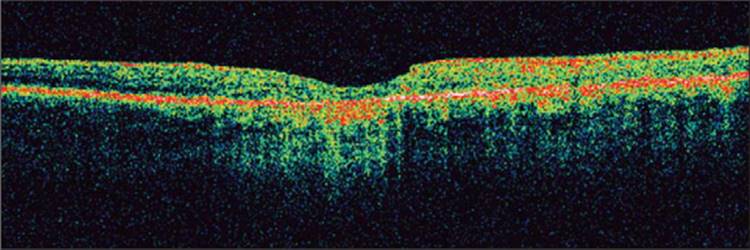
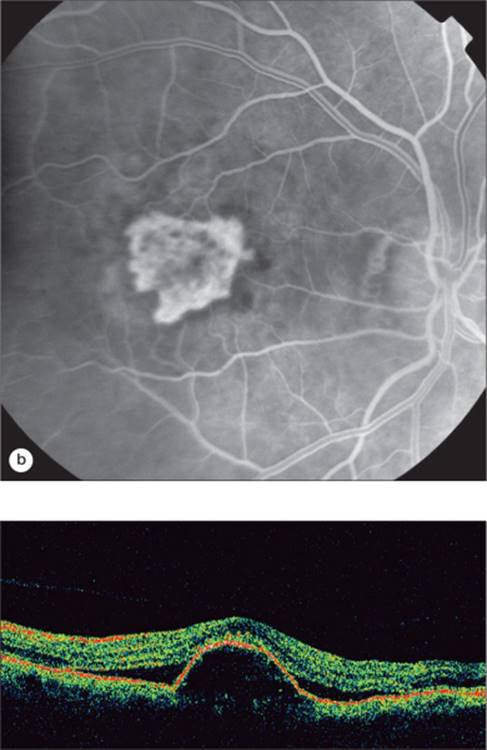
Central serous chorioretinopathy (CSCR) results from localized dysfunction of the retinal pigment epithelial cells, resulting in accumulation of fluid in the subretinal space (Fig. 130.19).[89,90,27] OCT is helpful in diagnosing the condition as well as following the patients longitudinally. OCT may also demonstrate associated lesions which may be more difficult to discern on examination or with fluorescein angiography, such as pigment epithelial detachment (Fig. 130.20). The OCT is very useful in educating the patient regarding their condition, and in demonstrating their progress and/or resolution over time.
|
|
|
|
FIGURE 130.19 CSCR with accumulation of subretinal fluid. The shadow effects lateral to the neurosensory detachment are a result of larger caliber native intraretinal blood vessels. |
Age-Related Macular Degeneration
Age-related macular degeneration (ARMD) is the leading cause of irreversible vision loss in the Western world. It affects ?10 million people in the United States with 200 000 new cases of advanced ARMD diagnosed annually. The disease is divided into two basic categories: nonexudative and exudative.
Nonexudative ARMD
Nonexudative ARMD can lead to changes in the macula such as RPE hyper- and hypopigmentation as well as basal laminar and basal linear deposits. RPE hyperpigmentation can cause increased reflectivity of the external band on OCT while RPE atrophy results in hyperreflectivity of structures deep to the RPE/choriocapillaris (Fig. 130.21).[91] Drusen will often produce a stippling effect of the external band consistent with deposits along Bruch's membrane.[92]
|
|
|
|
FIGURE 130.21 Geographic atrophy associated with ARMD. There is increased reflectivity of deeper structures centrally due to RPE atrophy beneath the fovea. Irregularities of the RPE/choriocapillaris complex on the right side of the scan are representative of drusen. |
Exudative ARMD
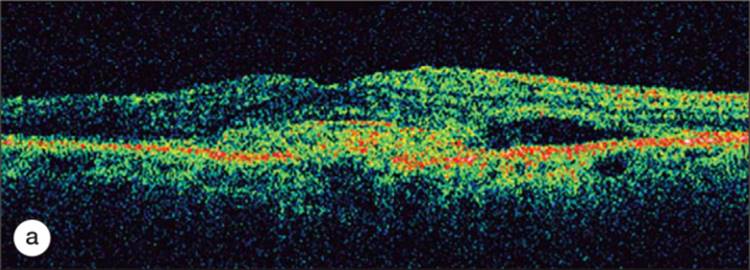
Exudative ARMD lesions are classified according to fluorescein angiography findings as either predominantly classic, minimally classic, or occult with no classic features. OCT findings do not necessarily correlate with the fluorescein classification. OCT demonstrates abnormalities in the retinal architecture in most cases of exudative AMD, with common findings of subretinal fluid, retinal thickening, pigment epithelial detachment, (Fig. 130.24) and choroidal neovascularization (CNV).[92] Occult CNV generally causes thickening of the RPE layer. The typical appearance with inability to distinguish the CNV from the RPE layer is termed type I (Fig. 130.22). This is by far more common. Classic CNV may have a similar appearance, or in some cases may break through Bruch's membrane and grow more clearly in the subretinal space (Fig. 130.23). This is termed a type II CNV. From a therapeutic perspective, this may influence the response to surgical therapy. A type II CNV complex would be more likely to respond to surgical removal without RPE damage, whereas removal of a type I membrane would be much more likely to damage the normal structure of the RPE and subsequently result in poor visual acuity. This was demonstrated in the Submacular Surgery Trial.[93,94]
|
|
|
|
FIGURE 130.24 Serous Pigment Epithelial Detachment associated with ARMD. Notice the excrescences on the surface of the RPE. There is a small amount of subretinal fluid as well. |
|
|
|
|
FIGURE 130.22 OCT and corresponding fluorescein angiography of an occult choroidal neovascular membrane with a large amount of intraretinal fluid present. There is disruption and elevation of the RPE. |
|
|
|
|
FIGURE 130.23 OCT and corresponding fluorescein angiogram of a classic CNV. Notice the discontinuity in the RPE/choriocapillaris band with a thick hyperreflective neovascular membrane in the subretinal space. There is accumulation of subretinal fluid as well as intraretinal fluid. |
OCT in the management of age related macular degeneration
Traditional therapy for exudative macular degeneration has consisted of either thermal laser photocoagulation or photodynamic therapy (PDT). Intravitreal injections with antivascular endothelial growth factor (anti-VEGF) compounds have demonstrated higher rates of vision retention and improvement and have increased greatly in use.[95-98]
OCT has been invaluable in helping retina specialists decide when to re-treat their patients with exudative ARMD. Fluorescein angiography is no longer needed at every follow up visit to make a determination of whether to re-treat or not. Typically fluorescein angiography is obtained along with OCT at the initial visit in order to confirm the diagnosis and to characterize the choroidal neovascular membrane. Once treatment is initiated, particularly with an intravitreal injection of an anti-VEGF agent, the patients can often be followed-up with serial OCT imaging and re-treated if intraretinal or subretinal fluid persists or recurs.
|
Key Features: Utility of OCT in Retinal Disorders |
||||||||||||
|
Data from a recent study using OCT to guide decisions about re-treatment suggests that this is an efficient and effective way to follow patients with exudative ARMD. In this study, patients received on average five to six intravitreal injections of an anti-VEGF compound over 1 year based on recurrence of retinal thickening rather than the 12 consecutive monthly injections required over a period of 1 year in the phase III trials.[99,100] The visual outcomes were similar with both dosing regimens.
Despite the utility of this imaging method in guiding management, retinal thickness measured on OCT does not always correlate with visual acuity. Resolution of retinal thickening may occur with the formation of a disciform scar or with the development of atrophy resulting in poor visual acuity. Resolution of retinal thickening could also occur with a favorable response to treatment resulting in stable or improved visual acuity. Therefore interpretation of the OCT data must be correlated with the visual acuity and the findings on biomicroscopic examination.
OCT in clinical trials
The use of OCT measurements as secondary endpoints in clinical trials has increased greatly in the last few years. The advantages of OCT include the noninvasive nature of the test, the ease of use for photographers and subjects, the objective measurements of retinal thickness, and the additional information regarding morphology of the retina and adjacent structures. Quantitative results are usually reported by comparing the mean change in retinal thickness or abnormal retinal thickening (total retinal thickness minus normal retinal thickness) between the treatment groups and sham group. Results may also be reported as the percentage of a group which reach a prespecified goal, such as reduction of retinal thickness by 100 ?m or reduction of abnormal thickening by 50%.
Eligibility determination
OCT determined retinal thickness criteria have been utilized in recent trials of ARMD, retinal vein occlusion, and diabetic macular edema to ensure that subjects who are enrolled have sufficient center involving retinal thickening to evaluate if the therapy under investigation is efficacious. A common requirement is the presence of a center-point retinal thickness of at least 250 ?m. In addition, OCT is used to exclude patients who demonstrate vitreoretinal abnormalities which would preclude resolution of retinal thickening with medical therapy.[101]
OCT quality
Several clinical trials have found that the reliability and reproducibility of the measurements obtained by OCT scanning are much higher if the OCT meets certain quality criteria. All six underlying scans must be present for the retinal thickness map, the ILM and RPE borders must be drawn correctly, the standard deviation of the center point must be <10% (of center-point value), signal strength should be five or greater, and the macula must be centered in the scan. In a study comparing OCT II and OCT III (current generation) measurements for diabetic macular edema, OCT III measurements were found to be reliable in 91.5% of cases compared with only 59.6% for the OCT II measurements. The advantage of the OCT III was the ability to obtain the measurements over 2.5s compared with the requirement to obtain six separate scans for the OCT II.[102] This finding was corroborated by a comparison of fast macular scans versus six high-resolution scans to obtain retinal thickness data for an exudative macular degeneration study. With 383 visits, 93.7% (359/383) of fast macular thickness maps had a center-point standard deviation of less than or equal to 10% (good quality) versus 59.0% (226/383) of high-resolution macular thickness maps. Subjects with this disorder often have difficulty fixating and were much more likely to have reliable data with the fast macular scans.[17] Scans of high quality are highly reproducible with a correlation coefficient of 0.981 for repeated OCT III scans. Ensuring OCT quality in a clinical trial setting is critical to our ability to trust the data.
Correlation with visual acuity
Hee et al demonstrated a correlation of visual acuity with retinal thickness in patients with diabetic macular edema (R[2] = 0.79).[73] Subsequent clinical trials have found variable results and in some cases the correlation is poor (R[2] = 0.07).[103] OCT measurements of retinal thickness therefore continue to be a secondary rather than primary endpoint in clinical trials. They can be useful as a marker of the biological activity of a treatment.
Grading morphology
In addition to evaluating OCT quantitative results, reading centers also assess morphological changes such as vitreoretinal interface abnormalities, intraretinal cysts, CNV, subretinal fluid, and PED. These features are graded for presence or absence and may be quantified (extent of cysts, thickness of subretinal fluid, thickness of CNV complex). Correlations are performed to evaluate whether the presence of such features at baseline are predictive of outcome, and whether the features change over time, in response to therapy.
Longitudinal follow-up
As a secondary endpoint OCT has been very useful in assessing response to therapy for macular disease. Retinal thickness measurements on OCT can be used to make retreatment decisions. For example, in ongoing trials of intravitreal triamcinolone for the management of macular edema associated with retinal vein occlusion and diabetic retinopathy, comparisons of baseline and current OCT findings are used to help determine whether treatment has been successful or not, and secondarily whether to continue treatment or not.
FUTURE TRENDS
Several aspects of OCT are being improved upon at present. Ultrahigh-resolution OCT improves resolution from 8 to 2 ?m, allowing greater visualization of structural detail which may enhance further our understanding of the pathophysiology of macular disorders.[13-15]
Spectral domain OCT also allows improved resolution,[104] with decreased acquisition time. The combination of OCT with simultaneous registration of retinal images with scanning laser ophthalmoscopy will allow improved reproducibility of measurements and ensure centration of measurements. 3 dimensional representation of retinal morphology has become possible.[105] Software developments including a graphical user interface to allow correction of misdrawn borders will enhance our ability to obtain accurate measurements.
SUMMARY
OCT is a noninvasive test that provides clinicians and researchers objective information on the presence and severity of retinal, RPE, and vitreoretinal interface abnormalities. Our understanding of the pathophysiology of macular diseases has been enhanced by OCT, leading to modifications in clinical management based on OCT findings. OCT has improved our diagnostic ability, especially for subtle macular disease. There has ensued a great increase in the use of this imaging modality for the baseline evaluation and follow-up of retinal disorders. The assessment of retinal thickness and morphology has become particularly useful in making re-treatment decisions, and has led to a decreased necessity for invasive imaging tests in follow-up. Therapeutic clinical trials have increasingly incorporated OCT measurements as secondary endpoints. OCT images are very useful in enhancing patient education regarding their disorder and management. Further refinements in technology will further improve our ability to incorporate OCT into clinical and research applications.
REFERENCES
1. Huang D, Swanson EA, Lin CP, et al: Optical coherence tomography. Science 1991; 254:1178-1181.
2. Schuman JSPC, Fujimoto JG: Optical coherence tomography of ocular diseases, 2nd edn. Thoroughfare, New Jersey, Slack, 2004.
3. Kwon RS, Brugge WR: New advances in pancreatic imaging. Curr Opin Gastroenterol 2005; 21:561-567.
4. Fujimoto JG, Pitris C, Boppart SA, et al: Optical coherence tomography: an emerging technology for biomedical imaging and optical biopsy. Neoplasia 2000; 2:9-25.
5. Pitris C, Jesser C, Boppart SA, et al: Feasibility of optical coherence tomography for high-resolution imaging of human gastrointestinal tract malignancies. J Gastroenterol 2000; 35:87-92.
6. Boppart SA, Brezinski ME, Pitris C, et al: Optical coherence tomography for neurosurgical imaging of human intracortical melanoma. Neurosurgery 1998; 43:834-841.
7. Brezinski ME, Tearney GJ, Bouma BE, et al: Imaging of coronary artery microstructure (in vitro) with optical coherence tomography. Am J Cardiol 1996; 77:92-93.
8. Born M, Wolf E, Bhatia AB: Principles of optics: electromagnetic theory of propagation, interference and diffraction of light, 7th edn. Cambridge, England, Cambridge University Press, 1999.
9. Youngquist R, Carr S, Davies D: Optical coherence domain reflectometry: a new optical evaluation technique. Opt Lett 1987; 12:158.
10. Hee MR, Izatt JA, Swanson EA, et al: Optical coherence tomography of the human retina. Arch Ophthalmol 1995; 113:325-332.
11. Swanson EA, Izatt JA, Hee MR, et al: In vivo retinal imaging by optical coherence tomography. Opt Lett 1993; 18:1864-1866.
12. Schuman JS, Pulia-to CA, Fujimoto JG: Principles of optical coherence tomography. In: Schuman JS, Fujimoto JG, ed. Optical coherence tomography of ocular diseases, 2nd edn. Thoroghfare, New Jersey: Slack; 2004:3-20.
13. Drexler W, Morgner U, Ghanta RK, et al: Ultrahigh-resolution ophthalmic optical coherence tomography. Nat Med 2001; 7:502-507.
14. Drexler W, Sattmann H, Hermann B, et al: Enhanced visualization of macular pathology with the use of ultrahigh-resolution optical coherence tomography. Arch Ophthalmol 2003; 121:695-706.
15. Drexler W: Ultrahigh-resolution optical coherence tomography. J Biomed Opt 2004; 9:47-74.
16. Gloesmann M, Hermann B, Schubert C, et al: Histologic correlation of pig retina radial stratification with ultrahigh-resolution optical coherence tomography. Invest Ophthalmol Vis Sci 2003; 44:1696-1703.
17. Altaweel M, Timm R, Webster M, et al: Assessing AMD with optical coherence tomgraphy (OCT): fast macular thickness maps versus high resolution macular thickness maps. IOVS 2006; 47:abstract 5716
18. Chan A, Duker JS: A standardized method for reporting changes in macular thickening using optical coherence tomography. Arch Ophthalmol 2005; 123:939-943.
19. Goulding A, Altaweel M: Reproducibility and quality assessment of stratus optical coherence tomography (OCT3): fast macular thickness scans. IOVS 2006; 46:abstract 1545
20. Hwang JC, Barile GR, Schiff WM, et al: Optical coherence tomography in asteroid hyalosis. Retina 2006; 26:661-665.
21. Browning DJ, Fraser CM: Optical coherence tomography to detect macular edema in the presence of asteroid hyalosis. Am J Ophthalmol 2004; 137:959-961.
22. Koozekanani D, Boyer K, Roberts C: Retinal thickness measurements from optical coherence tomography using a Markov boundary model. IEEE Trans Med Imaging 2001; 20:900-916.
23. Hayreh SS, Jonas JB: Posterior vitreous detachment: clinical correlations. Ophthalmologica 2004; 218:333-343.
24. Foos RY: Vitreoretinal juncture; topographical variations. Invest Ophthalmol 1972; 11:801-808.
25. Foos RY, Kreiger AE, Forsythe AB, et al: Posterior vitreous detachment in diabetic subjects. Ophthalmology 1980; 87:122-128.
26. Witkin AJ, Ko TH, Fujimoto JG, et al: Redefining lamellar holes and the vitreomacular interface: an ultrahigh-resolution optical coherence tomography study. Ophthalmology 2006; 113:388-397.
27. Gass J: Stereoscopic atlas of macular diseases: diagnosis and treatment, 4th edn. St Louis, Mosby, 1997.
28. Smiddy WE, Green WR, Michels RG, et al: Ultrastructural studies of vitreomacular traction syndrome. Am J Ophthalmol 1989; 107:177-185.
29. Smiddy WE, Michels RG, Glaser BM, et al: Vitrectomy for macular traction caused by incomplete vitreous separation. Arch Ophthalmol 1988; 106:624-628.
30. Margherio RR, Trese MT, Margherio AR, et al: Surgical management of vitreomacular traction syndromes. Ophthalmology 1989; 96:1437-1445.
31. McDonald HR, Johnson RN, Schatz H: Surgical results in the vitreomacular traction syndrome. Ophthalmology 1994; 101:1397-1402.discussion 1403
32. Hikichi T, Yoshida A, Trempe CL: Course of vitreomacular traction syndrome. Am J Ophthalmol 1995; 119:55-61.
33. Carpineto P, Ciancaglini M, Aharrh-Gnama A, et al: Optical coherence tomography imaging of surgical resolution of bilateral vitreomacular traction syndrome related to incomplete posterior vitreoschisis: a case report. Eur J Ophthalmol 2004; 14:438-441.
34. Carpineto P, Mastropasqua L: Incomplete posterior vitreoschisis and vitreomacular traction. Am J Ophthalmol 2005; 140:765-766.author reply 766.
35. Thomas D, Bunce C, Moorman C, et al: Frequency and associations of a taut thickened posterior hyaloid, partial vitreomacular separation, and subretinal fluid in patients with diabetic macular edema. Retina 2005; 25:883-888.
36. Catier A, Tadayoni R, Paques M, et al: Characterization of macular edema from various etiologies by optical coherence tomography. Am J Ophthalmol 2005; 140:200-206.
37. Smiddy WE, Maguire AM, Green WR, et al: Idiopathic epiretinal membranes. Ultrastructural characteristics and clinicopathologic correlation. Ophthalmology 1989; 96:811-820.discussion 821
38. Smiddy WE, Maguire AM, Green WR, et al: Idiopathic epiretinal membranes: ultrastructural characteristics and clinicopathologic correlation. Retina 2005; 25(5 Suppl):811-820.discussion 821
39. Appiah AP, Hirose T, Kado M: A review of 324 cases of idiopathic premacular gliosis. Am J Ophthalmol 1988; 106:533-535.
40. Smiddy WE, Michels RG, Gilbert HD, et al: Clinicopathologic study of idiopathic macular pucker in children and young adults. Retina 1992; 12:232-236.
41. Smiddy WE, Michels RG, Green WR: Morphology, pathology, and surgery of idiopathic vitreoretinal macular disorders. A review. Retina 1990; 10:288-296.
42. Wilkins JR, Pulia-to CA, Hee MR, et al: Characterization of epiretinal membranes using optical coherence tomography. Ophthalmology 1996; 103:2142-2151.
43. Mori K, Gehlbach PL, Sano A, et al: Comparison of epiretinal membranes of differing pathogenesis using optical coherence tomography. Retina 2004; 24:57-62.
44. Suzuki T, Terasaki H, Niwa T, et al: Optical coherence tomography and focal macular electroretinogram in eyes with epiretinal membrane and macular pseudohole. Am J Ophthalmol 2003; 136:62-67.
45. Haouchine B, Massin P, Tadayoni R, et al: Diagnosis of macular pseudoholes and lamellar macular holes by optical coherence tomography. Am J Ophthalmol 2004; 138:732-739.
46. Gaudric A, Haouchine B, Massin P, et al: Macular hole formation: new data provided by optical coherence tomography. Arch Ophthalmol 1999; 117:744-751.
47. Hee MR, Pulia-to CA, Wong C, et al: Optical coherence tomography of macular holes. Ophthalmology 1995; 102:748-756.
48. Tanner V, Chauhan DS, Jackson TL, et al: Optical coherence tomography of the vitreoretinal interface in macular hole formation. Br J Ophthalmol 2001; 85:1092-1097.
49. Haouchine B, Massin P, Gaudric A: Foveal pseudocyst as the first step in macular hole formation: a prospective study by optical coherence tomography. Ophthalmology 2001; 108:15-22.
50. Smiddy WE, Michels RG, de Bustros S, et al: Histopathology of tissue removed during vitrectomy for impending idiopathic macular holes. Am J Ophthalmol 1989; 108:360-364.
51. Smiddy WE, Michels RG, Glaser BM, et al: Vitrectomy for impending idiopathic macular holes. Am J Ophthalmol 1988; 105:371-376.
52. Ang A, Snead DR, James S, et al: A rationale for membrane peeling in the repair of stage 4 macular holes. Eye 2006; 20:208-214.
53. Posselt D, Rahman R, Smith M, et al: Visual outcomes following ICG assisted ILM peel for Macular Hole. Eye 2005; 19:279-283.
54. Smiddy WE, Feuer W, Cordahi G: Internal limiting membrane peeling in macular hole surgery. Ophthalmology 2001; 108:1471-1476.discussion 1477-1478
55. Da Mata AP, Burk SE, Foster RE, et al: Long-term follow-up of indocyanine green-assisted peeling of the retinal internal limiting membrane during vitrectomy surgery for idiopathic macular hole repair. Ophthalmology 2004; 111:2246-2253.
56. Da Mata AP, Burk SE, Riemann CD, et al: Indocyanine green-assisted peeling of the retinal internal limiting membrane during vitrectomy surgery for macular hole repair. Ophthalmology 2001; 108:1187-1192.
57. Haritoglou C, Reiniger IW, Schaumberger M, et al: Five-year follow-up of macular hole surgery with peeling of the internal limiting membrane: update of a prospective study. Retina 2006; 26:618-622.
58. Kumagai K, Furukawa M, Ogino N, et al: Long-term outcomes of internal limiting membrane peeling with and without indocyanine green in macular hole surgery. Retina 2006; 26:613-617.
59. Kimura T, Takahashi M, Takagi H, et al: Is removal of internal limiting membrane always necessary during stage 3 idiopathic macular hole surgery. Retina 2005; 25:54-58.
60. Altaweel M, Ip M: Macular hole: improved understanding of pathogenesis, staging, and management based on optical coherence tomography. Semin Ophthalmol 2003; 18:58-66.
61. Williams GA: Macular holes: the latest in current management. Retina 2006; 26(6 Suppl):S9-S12.
62. Tadayoni R, Massin P, Haouchine B, et al: Spontaneous resolution of small stage 3 and 4 full-thickness macular holes viewed by optical coherence tomography. Retina 2001; 21:186-189.
63. Larsson J, Holm K, Lovestam M-Adrian: The presence of an operculum verified by optical coherence tomography and other prognostic factors in macular hole surgery. Acta Ophthalmol Scand 2006; 84:301-304.
64. Jaycock PD, Bunce C, Xing W, et al: Outcomes of macular hole surgery: implications for surgical management and clinical governance. Eye 2005; 19:879-884.
65. Wong TY, Klein R, Islam FM, et al: Diabetic retinopathy in a multi-ethnic cohort in the United States. Am J Ophthalmol 2006; 141:446-455.
66. Knudtson MD, Klein BE, Klein R, et al: Age-related eye disease, quality of life, and functional activity. Arch Ophthalmol 2005; 123:807-814.
67. Kempen JH, O'Colmain BJ, Leske MC, et al: The prevalence of diabetic retinopathy among adults in the United States. Arch Ophthalmol 2004; 122:552-563.
68. Klein R, Klein BE, Moss SE, et al: The Wisconsin epidemiologic study of diabetic retinopathy: XVII. The 14-year incidence and progression of diabetic retinopathy and associated risk factors in type 1 diabetes. Ophthalmology 1998; 105:1801-1815.
69. Klein R, Klein BE, Moss SE, et al: The Wisconsin epidemiologic study of diabetic retinopathy. XV. The long-term incidence of macular edema. Ophthalmology 1995; 102:7-16.
70. Kim BY, Smith SD, Kaiser PK: Optical coherence tomographic patterns of diabetic macular edema. Am J Ophthalmol 2006; 142:405-412.
71. Goebel W, Franke R: Retinal thickness in diabetic retinopathy: comparison of optical coherence tomography, the retinal thickness analyzer, and fundus photography. Retina 2006; 26:49-57.
72. Cunningham Jr ET, Adamis AP, Altaweel M, et al: A phase II randomized double-masked trial of pegaptanib, an anti-vascular endothelial growth factor aptamer, for diabetic macular edema. Ophthalmology 2005; 112:1747-1757.
73. Hee MR, Pulia-to CA, Duker JS, et al: Topography of diabetic macular edema with optical coherence tomography. Ophthalmology 1998; 105:360-370.
74. Hee MR, Pulia-to CA, Wong C, et al: Quantitative assessment of macular edema with optical coherence tomography. Arch Ophthalmol 1995; 113:1019-1029.
75. Imai M, Iijima H, Hanada N: Optical coherence tomography of tractional macular elevations in eyes with proliferative diabetic retinopathy. Am J Ophthalmol 2001; 132:458-461.
76. Jaffe GJ: Cystoid macular edema. Focal Points: Clinical Modules for Ophthalmologists 1994.
77. Kraff MC, Sanders DR, Jampol LM, et al: Factors affecting pseudophakic cystoid mascular edema: five randomized trials. J Am Intraocul Implant Soc 1985; 11:380-385.
78. Dajani HM, Lauer AK: Optical coherence tomography findings in niacin maculopathy. Can J Ophthalmol 2006; 41:197-200.
79. Bressler NM: Cystoid macular edema from niacin typically is not accompanied by fluorescein leakage on angiography. Am J Ophthalmol 2005; 139:951.author reply 951.
80. Callanan D, Blodi BA, Martin DF: Macular edema associated with nicotinic acid (niacin). JAMA 1998; 279:1702.
81. Spaide RF, Lee JK, Klancnik Jr JK, et al: Optical coherence tomography of branch retinal vein occlusion. Retina 2003; 23:343-347.
82. Lerche RC, Schaudig U, Scholz F, et al: Structural changes of the retina in retinal vein occlusion - imaging and quantification with optical coherence tomography. Ophthalmic Surg Lasers 2001; 32:272-280.
83. BVOS : Argon laser scatter photocoagulation for prevention of neovascularization and vitreous hemorrhage in branch vein occlusion. A randomized clinical trial. Branch Vein Occlusion Study Group. Arch Ophthalmol 1986; 104:34-41.
84. Green WR, Chan CC, Hutchins GM, et al: Central retinal vein occlusion: a prospective histopathologic study of 29 eyes in 28 cases. Retina 1981; 1:27-55.
85. CVOS : Baseline and early natural history report. The Central Vein Occlusion Study. Arch Ophthalmol 1993; 111:1087-1095.
86. Hayreh SS: The CVOS Group M and N reports. Ophthalmology 1996; 103:350-352.author reply 353-354.
87. Ip M, Kahana A, Altaweel M: Treatment of central retinal vein occlusion with triamcinolone acetonide: an optical coherence tomography study. Semin Ophthalmol 2003; 18:67-73.
88. Ip MS, Gottlieb JL, Kahana A, et al: Intravitreal triamcinolone for the treatment of macular edema associated with central retinal vein occlusion. Arch Ophthalmol 2004; 122:1131-1136.
89. Hussain D, Gass JD: Idiopathic central serous chorioretinopathy. Indian J Ophthalmol 1998; 46:131-137.
90. Quillen DA, Gass DM, Brod RD, et al: Central serous chorioretinopathy in women. Ophthalmology 1996; 103:72-79.
91. Ahlers C, Michels S, Elsner H, et al: Topographic angiography and optical coherence tomography: a correlation of imaging characteristics. Eur J Ophthalmol 2005; 15:774-781.
92. Hee MR, Baumal CR, Pulia-to CA, et al: Optical coherence tomography of age-related macular degeneration and choroidal neovascularization. Ophthalmology 1996; 103:1260-1270.
93. Stone TW, Sternberg Jr P: Submacular surgery trials update. Ophthalmol Clin North Am 2002; 15:479-488.
94. Bressler NM, Bressler SB, Hawkins BS, et al: Submacular surgery trials randomized pilot trial of laser photocoagulation versus surgery for recurrent choroidal neovascularization secondary to age-related macular degeneration. I. Ophthalmic outcomes submacular surgery trials pilot study report number 1. Am J Ophthalmol 2000; 130:387-407.
95. Rosenfeld PJ: Intravitreal avastin the low cost alternative to lucentis. Am J Ophthalmol 2006; 142:141-143.
96. Gragoudas ES, Adamis AP, Cunningham ET, et al: Pegaptanib for neovascular age-related macular degeneration. N Engl J Med 2004; 351:2805-2816.
97. Rosenfeld PJ, Brown DM, Heier JS, Boyer DS: MARINA Study Group. Ranibizumab for neovascular age-related macular degeneration. N Engl J Med 2006 Oct 5; 355(1):1419-1431.
98. Brown DM, Kaiser PK, Michels M, Soubrane G, Heier JS: ANCHOR Study Group. Ranibizumab versus vertepor-n for neovascular age-related macular degeneration. N Eng J Med 2006 Oct 5; 355(14):1432-1444.
99. Rosen-eld PJ, Moshfeghi AA, Pulia-to CA: Optical coherence tomography -ndings after an intravitreal injection of bevacizumab (avastin) for neovascular age related macular degeneration. Ophthalmic Surg Lasers Imaging 2005; 26:331-335.
100. Fung AE, Lalwani GA, Rosenfeld PJ, Dubovy SR: An optical coherence tomography-guided, variable dosing regimen with intravitreal ranibizumab (Lucentis) for neovascular age-related macular degeneration. Am J Ophthalmol 2007 Apr; 143(4):566-583.
101. Altaweel M, Hubbard L, Gagnon R: The utility of optical coherence tomography in eligibility determination for clinical trials of macular disease therapy. Invest Ophthalmol Vis Sci 2005; 46:abstract 1577.
102. Salm D, Altaweel M, Chew E, et al: Reproducibility of macular thickness measurements within stratus OCT3 and between OCT3 and OCT2. IOVS 2005; 46:abstract 1591.
103. Diabetic Retinopathy Clinical Research Network , Browning DJ, Glassman AR, Aiello LP, Beck RW: Relationship between optical coherence tomography-measured central retinal thickness and visual acuity in diabetic macular edema. Ophthalmology 2007 Mar; 114(3):525-536.
104. Chen TC, Cense B, Pierce MC, et al: Spectral domain optical coherence tomography: ultra-high speed, ultra-high resolution ophthalmic imaging. Arch Ophthalmol 2005; 123:1715-1720.
105. Hangai M, Ojima Y, Gotoh N, Inoue R: Three-dimensional imaging of macular holes with high-speed optical coherence tomography. Ophthalmology 2007 Apr; 114(4):763-773.