The diffusing capacity normally limits the uptake of CO from alveolar air to blood
Imagine that a subject breathes air containing 0.1% CO for a brief period of time. Breathing somewhat higher levels of CO for many hours could be fatal (see pp. 1224–1225) because CO, which binds to Hb with an affinity that is 200 to 300 times higher than that of O2, prevents Hb from releasing O2 to the tissues (see pp. 655–657). If we assume that barometric pressure (PB) is 760 mm Hg and that ![]() is 47 mm Hg at 37°C, then we can compute the PCO of the wet inspired air entering the alveoli (see Box 26-1):
is 47 mm Hg at 37°C, then we can compute the PCO of the wet inspired air entering the alveoli (see Box 26-1):

(30-16)
If the subject smokes cigarettes or lives in a polluted environment, CO will be present in the mixed-venous blood—and, therefore, the alveolar air—even before our test begins. If not, the initial PCO of the mixed-venous blood entering the pulmonary capillaries will be ~0 mm Hg. Thus, a small gradient (~0.7 mm Hg) drives CO diffusion from alveolar air into blood plasma (Fig. 30-5A). As CO enters the blood plasma, it diffuses into the cytoplasm of RBCs, where Hb binds it avidly. The flow of CO from alveolus to RBC is so slow, and the affinity and capacity of Hb to bind CO is so great, that Hb binds almost all incoming CO. Because only a small fraction of the total CO in the pulmonary-capillary blood remains free in solution, the aqueous phase of the blood remains nearly a perfect sink for CO. That is, PCO in the capillary (PcCO), which is proportional to free [CO] in the capillary, rises only slightly above 0 mm Hg as the blood courses down the capillary (see Fig. 30-5B). Thus, by the time the blood reaches the end of the capillary (~0.75 second later), PcCO is still far below alveolar PCO (PACO). In other words, CO fails to reach diffusion equilibrium ![]() N30-3 between the alveolus and the blood.
N30-3 between the alveolus and the blood.

FIGURE 30-5 Diffusion of CO. In A, ΔPCO is the CO partial-pressure gradient from alveolar air to pulmonary-capillary blood. As the RBC enters the capillary, O2 occupies three of the four sites on Hb. In B, PACO is alveolar PCO. In C, the blood flow ![]() has a relative value of 1. In D, the diffusing capacity DL has a relative value of 1. Because PCO is very low in B through D, we are on the linear portion of the Hb-CO dissociation curve. Thus, the CO content at the end of the capillary is approximately proportional to the capillary PCO.
has a relative value of 1. In D, the diffusing capacity DL has a relative value of 1. Because PCO is very low in B through D, we are on the linear portion of the Hb-CO dissociation curve. Thus, the CO content at the end of the capillary is approximately proportional to the capillary PCO.
N30-3
An Analogy for the Diffusion-Limited Uptake of CO
Contributed by Emile Boulpaep, Walter Boron
The following may be a helpful analogy for how the partial pressure of CO (PCO) changes with time as blood flows down a pulmonary capillary. Keep in mind that, if the linear velocity of the blood is constant, time corresponds to distance down the capillary as shown on the x-axis in Figure 30-5B. Imagine a basement that is somewhat leaky to water. The leakiness of the wall is analogous to the diffusing capacity (DL) of the lung. After a severe rainstorm, the water outside the basement rises to a level that is 100 cm above the floor of the basement. This 100 cm of water is analogous to the alveolar PCO. The combination of the hydrostatic pressure gradient of 100 cm and the leakiness of the wall allow water to leak in at the rate of 100 L/min. Thus, the influx of water is analogous to the uptake of CO by the pulmonary-capillary blood (![]() ). Fortunately, the basement is equipped with a sump pump—activated by the presence of water—that removes water at 99 L/min. The sump pump is analogous to Hb, and the pumping of the water is analogous to the binding of CO to Hb. Thus, under the conditions of this example, the pump can remove all but 1 L/min of the incoming water, so that water level (analogous to PCO) will slowly rise. By how much will the water level rise within 5 hours, a period that is analogous to the time that an RBC spends in a pulmonary capillary?
). Fortunately, the basement is equipped with a sump pump—activated by the presence of water—that removes water at 99 L/min. The sump pump is analogous to Hb, and the pumping of the water is analogous to the binding of CO to Hb. Thus, under the conditions of this example, the pump can remove all but 1 L/min of the incoming water, so that water level (analogous to PCO) will slowly rise. By how much will the water level rise within 5 hours, a period that is analogous to the time that an RBC spends in a pulmonary capillary?
If the leakiness of the basement wall is low (low DL), then the water level may rise by only a few centimeters over the 5-hour period. Thus, even though a large amount of water may have entered during the 5 hours, the basement water level never rose enough to equilibrate with the outside water level, which was 100 cm above the floor. The reason for this failure of the water to equilibrate is that the pump was able to remove almost all the water. If the leakiness of the basement wall is higher (higher DL), then the water level after 5 hours may be 50 cm—but still less than the water level outside the wall.
It is important to recognize that the failure of the water to equilibrate across the wall in our examples was not a function of the water per se but of three parameters: (1) the relatively low leakiness of the basement wall (low DL), (2) the modest 100-cm pressure gradient driving water across the wall into the basement (low PACO), and (3) the high capacity of the pump for removing water (CO binding capacity of Hb). Obviously if the wall were substantially leakier, if the pressure gradient were substantially higher, or if the pump were substantially slower, the water level in the basement could have risen to as much as 100 cm during the 5-hour period—but never more. However, given low driving pressure and the high pump capacity, the total amount of water that entered the basement during the 5-hour period was limited by the leakiness of the basement wall. If the leakiness had been twice as great, the amount of water entering the basement during the 5-hour period also would have been twice as great. Thus, the entry of water was leakiness limited.
There are two reasons that PcCO rises so slowly as blood flows down the pulmonary capillary:
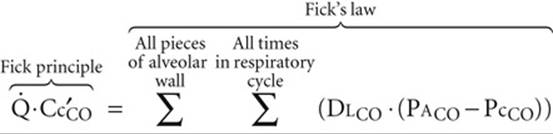
1. The CO flux (![]() ) is low. According to Fick's law,
) is low. According to Fick's law, ![]() = DLCO (PACO − PcCO). Because we chose to use an extremely low inspired PCO, the alveolar PCO driving CO diffusion was likewise extremely low, causing PcCO to rise slowly. In addition, the physiological DLCO is moderate.
= DLCO (PACO − PcCO). Because we chose to use an extremely low inspired PCO, the alveolar PCO driving CO diffusion was likewise extremely low, causing PcCO to rise slowly. In addition, the physiological DLCO is moderate.
2. Hb continuously traps incoming CO. Hb has a high affinity and high capacity for CO. Thus, for a low ![]() , PcCO—proportional to the free [CO]—rises very slowly.
, PcCO—proportional to the free [CO]—rises very slowly.
We will now explore factors that influence how much CO the blood takes up as it flows down the capillary. The principles that we develop here apply equally well to O2 and CO2. First, we use the Fick principle (see Equation 30-10) to quantitate, after the fact, how much CO has entered the blood:
![]()
(30-17)
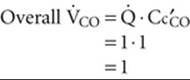
Overall ![]() is the total flow of CO along the entire length of all capillaries throughout the lungs,
is the total flow of CO along the entire length of all capillaries throughout the lungs, ![]() is cardiac output, Cc′CO is the CO content of blood at the end of the pulmonary capillary (dissolved and bound to Hb), and
is cardiac output, Cc′CO is the CO content of blood at the end of the pulmonary capillary (dissolved and bound to Hb), and ![]() is the CO content of mixed-venous blood at the beginning of the capillary. If we assume that
is the CO content of mixed-venous blood at the beginning of the capillary. If we assume that ![]() is zero, then Equation 30-17 simplifies to
is zero, then Equation 30-17 simplifies to
![]()
(30-18)
Of course, this overall ![]() , computed from the Fick principle, must be the same as the sum of the individual diffusion events, computed from Fick's law (analogous to Equation 30-12):
, computed from the Fick principle, must be the same as the sum of the individual diffusion events, computed from Fick's law (analogous to Equation 30-12):
(30-19)
How does CO uptake depend on DLCO and ![]() ? For basal conditions, we assume that DLCO and
? For basal conditions, we assume that DLCO and ![]() each have relative values of 1 and that the curve labeled “DL = 1” in Figure 30-5C describes the trajectory of PcCO. As a result, Cc′CO also has a relative value of 1. According to the Fick principle, the total amount of CO moving into the blood along the capillary is
each have relative values of 1 and that the curve labeled “DL = 1” in Figure 30-5C describes the trajectory of PcCO. As a result, Cc′CO also has a relative value of 1. According to the Fick principle, the total amount of CO moving into the blood along the capillary is
(30-20)
What would happen if we kept ![]() constant, but doubled DLCO? Fick's law (see Equation 30-19) predicts that the flow of CO into the blood for each diffusion event along the capillary would double. Thus, along the entire capillary, PcCO would rise twice as steeply (see Fig. 30-5C, curve labeled “DL = 2”) as before. As a result,
constant, but doubled DLCO? Fick's law (see Equation 30-19) predicts that the flow of CO into the blood for each diffusion event along the capillary would double. Thus, along the entire capillary, PcCO would rise twice as steeply (see Fig. 30-5C, curve labeled “DL = 2”) as before. As a result, ![]() N30-4 Cc′CO and thus
N30-4 Cc′CO and thus ![]() would also double.
would also double.
N30-4
Assumptions Underlying Figure 30-5C
Contributed by Emile Boulpaep, Walter Boron
In our analysis—in which we are halving or doubling DL—we are assuming that DL is strictly a reflection of Fick's law. That is, we are assuming that DL equals DM, and we are ignoring the buffering of CO by Hb.
In our example in which we have doubled DL (curve labeled “DL = 2” in Fig. 30-5C), we showed that the partial pressure of CO (PCO) at the end of the pulmonary capillary has doubled. The CO content of the blood at the end of the pulmonary capillary (Cc′CO) also very nearly doubles. Cc′CO has two components, the CO freely dissolved in blood and the CO bound to Hb. The latter is by far the more important. At the low capillary PCO values in our example, the relationship between capillary PCO and the CO saturation of Hb is approximately linear. According to Henry's law, the relationship between PCO and dissolved CO is also linear. Thus, the total CO content of blood at the end of the capillary is approximately proportional to PCO at the end of the capillary in our example. Thus, when DL doubles, both the PCO and the total CO content of the blood also double at the end of the pulmonary capillary.
Reducing DLCO by half would have the opposite effect: Cc′CO and thus ![]() would also halve (see Fig. 30-5C, bottom curve). Therefore, CO uptake is proportional to DLCO over a wide range of DLCO values (Table 30-1, upper half). Of course, if it were possible to make DLCO extremely high, then capillary PCO would rise so fast that CO would equilibrate with the Hb before the end of the capillary, and capillary PCO would reach alveolar PCO (see Fig. 30-5C, top curve). However, for realistic values of DLCO—as well as low alveolar PCO levels and normal Hb concentrations—CO would fail to reach equilibrium by the end of the capillary.
would also halve (see Fig. 30-5C, bottom curve). Therefore, CO uptake is proportional to DLCO over a wide range of DLCO values (Table 30-1, upper half). Of course, if it were possible to make DLCO extremely high, then capillary PCO would rise so fast that CO would equilibrate with the Hb before the end of the capillary, and capillary PCO would reach alveolar PCO (see Fig. 30-5C, top curve). However, for realistic values of DLCO—as well as low alveolar PCO levels and normal Hb concentrations—CO would fail to reach equilibrium by the end of the capillary.
TABLE 30-1
Alveolar Transport of CO
|
DLCO |
|
× |
Cc′CO |
= |
|
|
|
Vary DL ( |
2 |
1 |
2 |
2 |
||
|
1 |
1 |
1 |
1 |
|||
|
|
1 |
|
|
|||
|
Vary |
1 |
|
2 |
1 |
||
|
1 |
1 |
1 |
1 |
|||
|
1 |
2 |
|
1 |
The values in the table are all relative to “control” values of unity.
Cc′CO, CO content of the blood at the end of the capillary; DL, diffusing capacity; DLCO, diffusing capacity of the lungs for CO; ![]() , cardiac output;
, cardiac output; ![]() , overall rate of CO uptake by the pulmonary-capillary blood.
, overall rate of CO uptake by the pulmonary-capillary blood.
How would alteration of blood flow affect ![]() ? If
? If ![]() were halved and the dimensions of the capillary remained constant, then the contact time of the blood with the alveolar capillary would double. Thus, at any distance down the capillary, twice as much cumulative time would be available for CO diffusion. The trajectory of capillary PCO versus distance would be twice as steep (see Fig. 30-5D, curve labeled “
were halved and the dimensions of the capillary remained constant, then the contact time of the blood with the alveolar capillary would double. Thus, at any distance down the capillary, twice as much cumulative time would be available for CO diffusion. The trajectory of capillary PCO versus distance would be twice as steep (see Fig. 30-5D, curve labeled “![]() = 0.5”) as in the basal state (curve labeled “
= 0.5”) as in the basal state (curve labeled “![]() = 1”), and Cc′CO would also be twice as great. However, because we achieved this increase in Cc′CO by cutting
= 1”), and Cc′CO would also be twice as great. However, because we achieved this increase in Cc′CO by cutting ![]() in half, the product
in half, the product ![]() ⋅ Cc′CO =
⋅ Cc′CO = ![]() would be the same as that in the basal state (see Table 30-1, lower half).
would be the same as that in the basal state (see Table 30-1, lower half).
Doubling of blood flow would cause capillary PCO to rise only half as steeply (see Fig. 30-5D, bottom curve) as in the basal state, but still would have no effect on ![]() . Thus, for the range of DL and
. Thus, for the range of DL and ![]() values in this example, CO uptake is unaffected by changes in blood flow. Of course, if we were to reduce
values in this example, CO uptake is unaffected by changes in blood flow. Of course, if we were to reduce ![]() to extremely low values, then capillary PCO would reach alveolar PCO by the end of the capillary (see Fig. 30-5D, top curve).
to extremely low values, then capillary PCO would reach alveolar PCO by the end of the capillary (see Fig. 30-5D, top curve).
In our example, we have assumed that the PcCO profile along the capillary is linear and that changes in ![]() do not affect capillary dimensions.
do not affect capillary dimensions. ![]() N30-5 In fact, these assumptions are not entirely valid. Nevertheless, the uptake of CO is more or less proportional to the DL for CO, and rather insensitive to perfusion. Therefore, we say that the uptake of CO is diffusion limited because it is the diffusing capacity that predominantly limits CO transport. We can judge whether the transport of a gas is predominantly diffusion limited by comparing the partial pressure of the gas at the end of the pulmonary capillary with the alveolar partial pressure. If the gas does not reach diffusion equilibrium (i.e., if the end-capillary partial pressure fails to reach the alveolar partial pressure), then transport is predominantly diffusion limited. However, if the gas does reach diffusion equilibrium, then its transport is perfusion limited, as discussed next.
N30-5 In fact, these assumptions are not entirely valid. Nevertheless, the uptake of CO is more or less proportional to the DL for CO, and rather insensitive to perfusion. Therefore, we say that the uptake of CO is diffusion limited because it is the diffusing capacity that predominantly limits CO transport. We can judge whether the transport of a gas is predominantly diffusion limited by comparing the partial pressure of the gas at the end of the pulmonary capillary with the alveolar partial pressure. If the gas does not reach diffusion equilibrium (i.e., if the end-capillary partial pressure fails to reach the alveolar partial pressure), then transport is predominantly diffusion limited. However, if the gas does reach diffusion equilibrium, then its transport is perfusion limited, as discussed next.
N30-5
Assumptions Underlying Figure 30-5D
Contributed by Emile Boulpaep, Walter Boron
In analyzing Figure 30-5D, we have assumed that the linear velocity of the pulmonary-capillary blood is proportional to the flow (![]() ). Thus, when the flow doubles, we are assuming that the contact time of the blood with the alveolar capillary would fall by half.
). Thus, when the flow doubles, we are assuming that the contact time of the blood with the alveolar capillary would fall by half.
This assumption requires that the dimensions of the vessel be fixed (i.e., that neither the diameter nor the length of the capillary increase) and that the increase in flow not recruit new blood vessels. In fact, as we shall see in Chapter 31, neither of these assumptions is correct. First, if we start from a low perfusion pressure, increasing the perfusion pressure causes the recruitment of pulmonary vessels that previously were not conducting blood. Second, pulmonary vessels are highly compliant, so that increases in perfusion pressure cause the vessels to dilate. For both reasons (i.e., recruitment and dilation), pulmonary vascular resistance falls as the perfusion pressure increases. Thus, if the flow doubles, the contact time of the blood with the alveolar capillary will fall, but by less than half.
Perfusion normally limits the uptake of N2O from alveolar air to blood
Unlike CO, nitrous oxide (“laughing gas,” N2O) does not bind to Hb. Therefore, when a subject inhales N2O, the gas enters the blood plasma and the RBC cytoplasm but has nowhere else to go (Fig. 30-6A). Consequently, as blood courses down the pulmonary capillary, the concentration of free N2O—and thus capillary ![]() (
(![]() )—rises very rapidly (see Fig. 30-6B). By the time the blood is ~10% of the way along the capillary,
)—rises very rapidly (see Fig. 30-6B). By the time the blood is ~10% of the way along the capillary, ![]() has reached alveolar
has reached alveolar ![]() (
(![]() ), and N2O is thus in diffusion equilibrium between alveolus and blood. The reason N2O reaches diffusion equilibrium—whereas CO does not—is not that its
), and N2O is thus in diffusion equilibrium between alveolus and blood. The reason N2O reaches diffusion equilibrium—whereas CO does not—is not that its ![]() is particularly high, or that we chose a high inspired
is particularly high, or that we chose a high inspired ![]() . The key difference is that Hb does not bind to N2O.
. The key difference is that Hb does not bind to N2O.
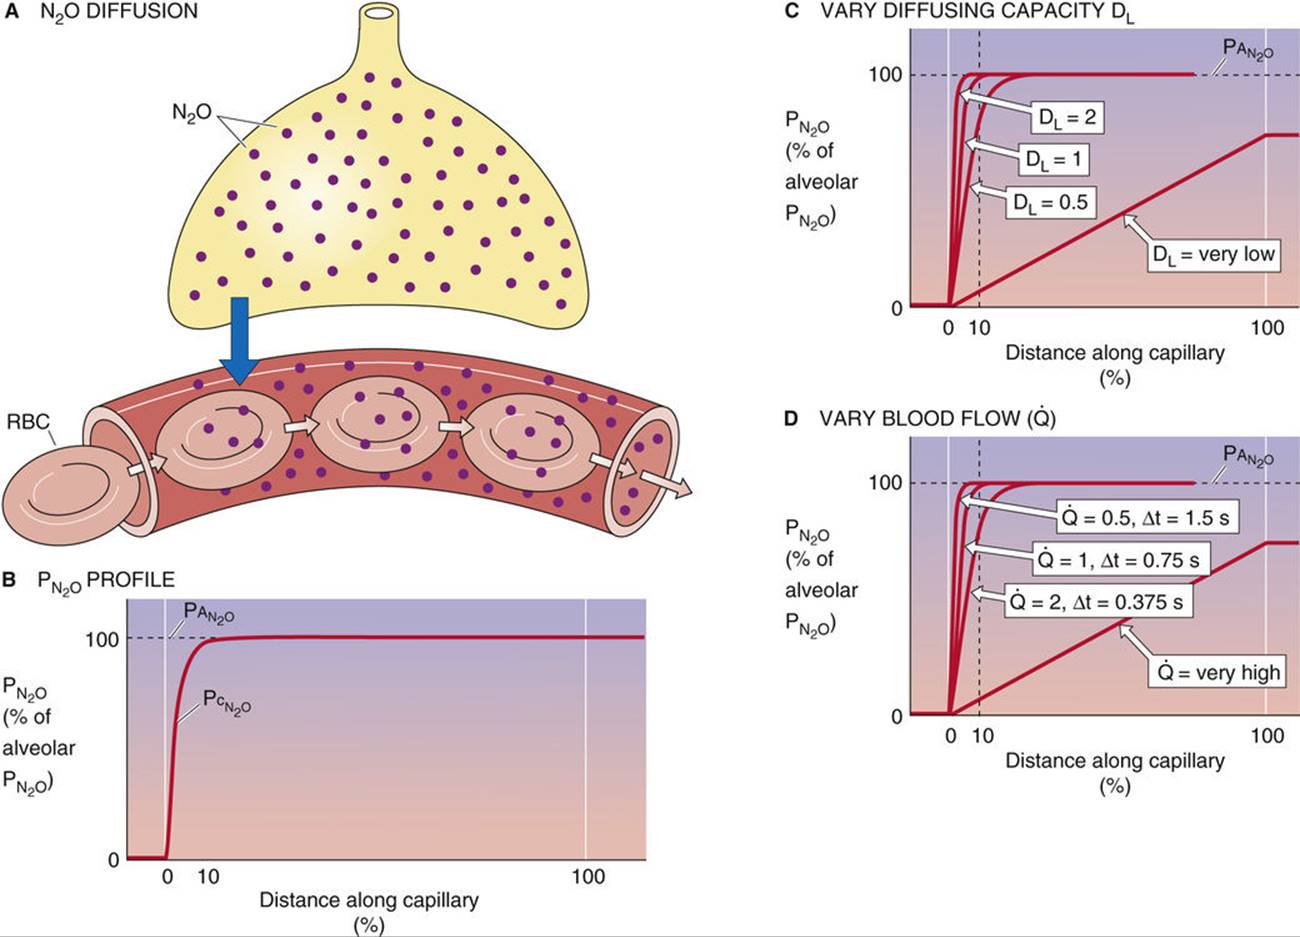
FIGURE 30-6 Diffusion of N2O. In B, ![]() is alveolar
is alveolar ![]() and
and ![]() is capillary
is capillary ![]() . In C, the blood flow
. In C, the blood flow ![]() has a relative value of 1. In D, the diffusing capacity DL has a relative value of 1. The N2O content at the end of the capillary is proportional to
has a relative value of 1. In D, the diffusing capacity DL has a relative value of 1. The N2O content at the end of the capillary is proportional to ![]() .
.
How does N2O uptake by the lungs depend on ![]() and
and ![]() ? If we assume that the N2O content of the mixed-venous blood entering the pulmonary capillary (
? If we assume that the N2O content of the mixed-venous blood entering the pulmonary capillary (![]() ) is zero, then
) is zero, then
![]()
(30 -21)
![]() is the N2O content of the blood at the end of the pulmonary capillary and represents entirely N2O physically dissolved in blood, which according to Henry's law (see Box 26-2) is proportional to
is the N2O content of the blood at the end of the pulmonary capillary and represents entirely N2O physically dissolved in blood, which according to Henry's law (see Box 26-2) is proportional to ![]() . The overall
. The overall ![]() computed from the Fick principle in Equation 30-21 is the sum of individual diffusion events along the capillary:
computed from the Fick principle in Equation 30-21 is the sum of individual diffusion events along the capillary:
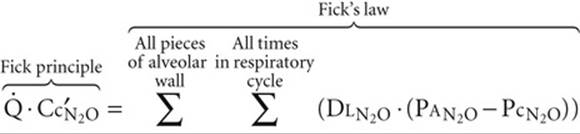
(30-22)
Because N2O reached diffusion equilibrium at ~10% of the way down the capillary (i.e., ![]() =
= ![]() ), the individual diffusion terms in Equation 30-22 equate to zero for the distal 90% of the capillary!
), the individual diffusion terms in Equation 30-22 equate to zero for the distal 90% of the capillary!
We can approach the uptake of N2O in the same way we did the uptake of CO. We begin, under basal conditions, with relative values of 1 for ![]() ,
, ![]() , and end-capillary N2O content (
, and end-capillary N2O content (![]() ). Thus, the initial
). Thus, the initial ![]() is
is ![]() = 1.
= 1.
Figure 30-6C shows that doubling of ![]() doubles the flow of N2O into the blood for each diffusion event, causing
doubles the flow of N2O into the blood for each diffusion event, causing ![]() to rise twice as steeply as before along the capillary. However, even though this doubling of
to rise twice as steeply as before along the capillary. However, even though this doubling of ![]() causes N2O to come into diffusion equilibrium twice as fast as before, it has no effect either on the N2O content of end-capillary blood or on
causes N2O to come into diffusion equilibrium twice as fast as before, it has no effect either on the N2O content of end-capillary blood or on ![]() , both of which remain at 1. Cutting
, both of which remain at 1. Cutting ![]() in half also would have no effect on
in half also would have no effect on ![]() . Thus, N2O uptake is insensitive to changes in
. Thus, N2O uptake is insensitive to changes in ![]() at least over the range of values that we examined (Table 30-2, upper half). In other words, the uptake of N2O is not diffusion limited.
at least over the range of values that we examined (Table 30-2, upper half). In other words, the uptake of N2O is not diffusion limited.
TABLE 30-2
Alveolar Transport of N2O
|
|
|
× |
|
= |
|
|
|
Vary DL ( |
2 |
1 |
1 |
1 |
||
|
1 |
1 |
1 |
1 |
|||
|
|
1 |
1 |
1 |
|||
|
Vary |
1 |
|
1 |
|
||
|
1 |
1 |
1 |
1 |
|||
|
1 |
2 |
1 |
2 |
What would be the effect of reducing ![]() by half while holding
by half while holding ![]() constant? If we assume that capillary dimensions remain constant, then halving of
constant? If we assume that capillary dimensions remain constant, then halving of ![]() would double the contact time of blood with the alveolus and make the
would double the contact time of blood with the alveolus and make the ![]() trajectory along the capillary twice as steep as before (see Fig. 30-6D). Nevertheless,
trajectory along the capillary twice as steep as before (see Fig. 30-6D). Nevertheless, ![]() remains unchanged at 1. However, because we reduced
remains unchanged at 1. However, because we reduced ![]() by half,
by half, ![]() also falls by half. Conversely, doubling of
also falls by half. Conversely, doubling of ![]() causes
causes ![]() to double. Thus, N2O uptake is more or less proportional to blood flow (i.e., perfusion) over a wide range of
to double. Thus, N2O uptake is more or less proportional to blood flow (i.e., perfusion) over a wide range of ![]() values (see Table 30-2, lower half). For this reason, we say that N2O transport is predominantly perfusion limited. The transport of a gas is predominantly perfusion limited if the gas in the capillary comes into equilibrium with the gas in the alveolar air by the end of the capillary.
values (see Table 30-2, lower half). For this reason, we say that N2O transport is predominantly perfusion limited. The transport of a gas is predominantly perfusion limited if the gas in the capillary comes into equilibrium with the gas in the alveolar air by the end of the capillary.
In principle, CO transport could become perfusion limited and N2O transport could become diffusion limited under special conditions
Although normally CO transport is diffusion limited and N2O transport is perfusion limited, changes in certain parameters could, at least in theory, make CO uptake perfusion limited, or make N2O uptake diffusion limited. To illustrate, we introduce an analogy (Fig. 30-7): workers at a railroad siding trying to load boxes (transport gas at a rate ![]() ) onto the cars of a passing train. Each worker (the diffusive event) has a limited rate for putting boxes on the train, and the total rate is the sum for all the workers (DL). Each railway car (the RBC) has a limited capacity for holding boxes, and the total capacity is the sum for all cars (Hb concentration). Finally, because the train is moving (the perfusion rate,
) onto the cars of a passing train. Each worker (the diffusive event) has a limited rate for putting boxes on the train, and the total rate is the sum for all the workers (DL). Each railway car (the RBC) has a limited capacity for holding boxes, and the total capacity is the sum for all cars (Hb concentration). Finally, because the train is moving (the perfusion rate, ![]() ), a limited time is available to load each railway car.
), a limited time is available to load each railway car.

FIGURE 30-7 Railway car analogy. Workers represent the diffusion of O2 across the alveolar wall. Railway cars represent the capacity of the blood to carry O2. The speed of the train represents blood flow.
First imagine that the speed of the train perfectly matches the number of workers (see Fig. 30-7A). Thus, all workers are always fully occupied, and the railway cars depart the siding fully loaded; the last box is put on each car just as the car leaves the siding. Any decrease in worker number, any increase in the carrying capacity of each car, or any increase in train speed causes the railway cars to leave the siding at least partially empty. Thus, if we fix train speed at “normal,” decreasing the number of workers below “normal” (see Fig. 30-7B) would cause a proportional decrease in the shipping rate—the number of boxes the train carries away per hour. In other words, when the number of workers is between zero and normal, the shipping rate is worker (diffusion) limited.
Now return to the original “perfect-match” condition in which both worker number and train speed are normal. Increasing worker number at constant train speed has no effect on either the number of boxes loaded onto each railway car (which remain filled to capacity) or the shipping rate (see Fig. 30-7C). In this higher range of worker number, the shipping rate is no longer limited by the workers, but by the speed of the train or by the carrying capacity of the railway cars. Thus, we could say that the shipping rate is speed (perfusion) limited, although it would be equally true to say that it is carrying-capacity (Hb) limited.
Let us return again to the original condition in which worker number perfectly matches train speed. Increasing train speed while fixing worker number at the normal value causes railway cars to leave the siding partially empty (see Fig. 30-7D). However, shipping rate is unaffected because the normal number of boxes is simply distributed over a greater number of cars. Under these conditions, shipping rate is again worker (diffusion) limited because increasing the number of workers would proportionally increase shipping rate. In fact, whenever you see cars leaving the siding only partially filled, you can conclude that shipping rate is worker (diffusion) limited, regardless of whether this situation arose because of a decrease in worker number, an increase in train speed, or an increase in car carrying-capacity.
Finally, let us again return to the perfectly matched initial condition and now decrease train speed while holding worker number fixed at the normal value. As velocity decreases below normal, shipping rate decreases proportionally (see Fig. 30-7E), even though the railway cars leave the siding fully loaded. Thus, shipping rate is speed (perfusion) limited. It would be equally true to characterize the system as being limited by carrying capacity (Hb). In fact, whenever you see cars leaving the siding fully filled, you can conclude that shipping rate is speed (perfusion) limited, regardless of whether this situation arose because of an increase in worker number, a decrease in train speed, or a decrease in car carrying capacity.
The reader is now in a position to consider factors that could render CO transport predominantly perfusion limited or N2O transport diffusion limited. Several changes to the system would cause CO transport to be no longer limited by DLCO. ![]() N30-6 Conversely, several other changes would cause the transport of N2O to be no longer limited by
N30-6 Conversely, several other changes would cause the transport of N2O to be no longer limited by ![]() .
.
N30-6
Making CO Uptake Perfusion Limited or Making N2O Uptake Diffusion Limited
Contributed by Emile Boulpaep, Walter Boron
After analyzing our railway car analogy, we are now in a position to consider factors that could—at least in principle—render the transport of CO predominantly perfusion limited, or that could—at least in principle—render the transport of N2O predominantly diffusion limited. Let us first consider CO uptake.
At least six changes to the system (eTable 30-1) could cause pulmonary capillary PCO (PcCO) to reach alveolar PCO (PACO) by the end of the capillary and thus cause CO transport no longer to be limited by DLCO.
1. Increase DLCO (i.e., increase the number of workers in the analogy of Fig. 30-7). This change would increase the flow of CO into the capillary for each diffusion event and thus increase both the rate at which the Hb would load up with CO and the rate at which free CO (proportional to PCO) could accumulate in the capillary. Another way of increasing the flow of CO into the capillary would be to increase PCO, which would increase the driving force for CO diffusion. Keep in mind that it is the product of PCO and DLCO that—according to Fick's law—determines diffusion.
2. Decrease (or totally eliminate) Hb (i.e., decrease the carrying capacity of each railway car). In the extreme, eliminating Hb would force all incoming CO to remain free in solution, so that free [CO] (i.e., PcCO) would rapidly rise along the pulmonary capillary.
3. Increase the CO content of mixed-venous blood (partially preload railway cars with dummy boxes before the cars enter the dock area). By partially loading the Hb with CO before the blood even came into contact with the alveoli, we would reduce the amount of additional CO that could bind to Hb before the Hb-CO complex was in equilibrium with free CO. With fewer binding sites available for the CO diffusing in from the alveoli, the level of free CO would rise more rapidly. In the extreme, PcCO would reach PACO by the end of the capillary.
4. Decrease ![]() (decrease train speed). By increasing the contact time of capillary blood with the alveoli, we would allow each bolus of capillary blood to undergo more diffusion events as it moves a certain distance along the length of the capillary. Thus, for a given distance traveled along the capillary, the blood would take up more CO, more CO would bind to Hb, and more CO also would remain free—so that PcCO would more closely approach PACO.
(decrease train speed). By increasing the contact time of capillary blood with the alveoli, we would allow each bolus of capillary blood to undergo more diffusion events as it moves a certain distance along the length of the capillary. Thus, for a given distance traveled along the capillary, the blood would take up more CO, more CO would bind to Hb, and more CO also would remain free—so that PcCO would more closely approach PACO.
5. Lengthen the capillary (increase the length of the loading dock, with a proportional increase in the number of workers). The effect of this maneuver is the same as for point 4 above in that it increases the contact time of the blood with the pulmonary capillary.
6. Distend the capillary while keeping ![]() constant (decrease train speed). In this case, we would decrease the linear velocity of the blood, increasing the contact time with the capillary. The effect, however, would not be quite as dramatic as that in point 4 because the increase in diameter would decrease the surface-to-volume ratio so that each bolus of blood would be able to avail itself of a smaller surface area for diffusion. Keep in mind that linear velocity will decrease with the square of the radius, whereas surface area will increase only linearly with area.
constant (decrease train speed). In this case, we would decrease the linear velocity of the blood, increasing the contact time with the capillary. The effect, however, would not be quite as dramatic as that in point 4 because the increase in diameter would decrease the surface-to-volume ratio so that each bolus of blood would be able to avail itself of a smaller surface area for diffusion. Keep in mind that linear velocity will decrease with the square of the radius, whereas surface area will increase only linearly with area.
At least four changes to the system would cause the transport of N2O, normally perfusion limited, to become diffusion limited (eTable 30-2). In other words, capillary ![]() would fail to reach alveolar
would fail to reach alveolar ![]() by the end of the pulmonary capillary.
by the end of the pulmonary capillary.
1. The first is to greatly decrease ![]() (i.e., decrease the number of workers). The result will be to slow diffusion. In the extreme, we could decrease the flow of N2O so much that the N2O fails to achieve equilibrium by the end of the capillary. Another way of decreasing the flow of N2O into the capillary would be to decrease
(i.e., decrease the number of workers). The result will be to slow diffusion. In the extreme, we could decrease the flow of N2O so much that the N2O fails to achieve equilibrium by the end of the capillary. Another way of decreasing the flow of N2O into the capillary would be to decrease ![]() , which would decrease the driving force for N2O diffusion. Keep in mind that it is the product of
, which would decrease the driving force for N2O diffusion. Keep in mind that it is the product of ![]() and
and ![]() that—according to Fick's law—determines diffusion.
that—according to Fick's law—determines diffusion.
2. Increase ![]() (increase train speed). An increase in
(increase train speed). An increase in ![]() increases the linear velocity of the blood and thus decreases the time available for N2O diffusion into a bolus of blood. If the increase in
increases the linear velocity of the blood and thus decreases the time available for N2O diffusion into a bolus of blood. If the increase in ![]() is sufficiently large, then the amount of N2O diffusing into the lumen will be so small that capillary
is sufficiently large, then the amount of N2O diffusing into the lumen will be so small that capillary ![]() will never reach alveolar
will never reach alveolar ![]() . That is, the contact time will be insufficient for N2O to achieve equilibrium.
. That is, the contact time will be insufficient for N2O to achieve equilibrium.
3. Shorten the capillary (decrease the length of the loading dock). Like the increase in ![]() , the decrease in capillary length will decrease the contact time for a bolus of blood with the pulmonary capillary.
, the decrease in capillary length will decrease the contact time for a bolus of blood with the pulmonary capillary.
4. Decrease capillary diameter while keeping ![]() constant (increase train speed). This maneuver would increase the linear velocity of the blood, decreasing the contact time of a bolus of blood with the capillary. The effect might be even more dramatic than that in point 2 because the decrease in diameter would increase the surface-to-volume ratio so that each bolus of blood would be able to avail itself of a greater surface area for diffusion.
constant (increase train speed). This maneuver would increase the linear velocity of the blood, decreasing the contact time of a bolus of blood with the capillary. The effect might be even more dramatic than that in point 2 because the decrease in diameter would increase the surface-to-volume ratio so that each bolus of blood would be able to avail itself of a greater surface area for diffusion.
In case you are wondering why the N2O analysis has two terms less than the CO analysis, one term is missing because N2O does not interact with Hb (point 2 for CO), and a second term is missing because we cannot further decrease the mixed-venous N2O content below zero (point 3 for CO).
eTABLE 30-1
Changes that Could Theoretically Make the Transport of a Diffusion-Limited Gas (CO) Become Perfusion Limited
|
Change* |
Why Change Makes Transport Perfusion Limited |
|
↑ DL or ↑ PACO (↑ number of workers) |
If CO could enter rapidly enough, it could load the Hb with CO and cause free [CO] to rise rapidly. |
|
↓ [Hb] (↓ capacity of each car) |
Because carrying capacity for CO is reduced, a given rate of CO transport causes the concentration of free CO to rise rapidly. |
|
↑ |
If the Hb were sufficiently preloaded with CO, not much additional CO would need to enter to fully load the Hb. |
|
↓ |
If the contact time of blood with alveolar air were sufficiently long, enough CO could enter to load the Hb, causing the concentration of free CO to rise rapidly. |
|
↑ Capillary length (lengthen loading dock) |
The contact time of blood with alveolar air would be increased, so that Hb would eventually become loaded, as described above. |
|
↑ Capillary diameter at fixed |
As above, contact time would increase. |
*Descriptions in parentheses refer to the railway car analogy in Figure 30-7.
eTABLE 30-2
Changes that Could Theoretically Make the Transport of a Perfusion-Limited Gas (N2O) Become Diffusion Limited
|
Change* |
Why Change Makes Transport Diffusion Limited |
|
↓ DL or ↓ PACO (↓ number of workers) |
If N2O entered slowly enough, |
|
↑ |
If the contact time of blood with alveolar air were sufficiently brief, not enough N2O would enter the blood to cause |
|
↓ Capillary length (shorten loading dock) |
The contact time of blood with alveolar air would be decreased, so that N2O would fail to reach diffusion equilibrium, as described above. |
|
↓ Capillary diameter at constant |
As above, contact time would decrease. |
*Descriptions in parentheses refer to the railway car analogy in Figure 30-7.
The uptake of CO provides an estimate of DL
Because the pulmonary diffusing capacity plays such an important role in determining the partial-pressure profile of a gas along the pulmonary capillary, being able to measure DL would be valuable. Moreover, an approach that is easily applicable to patients could be useful both as a diagnostic tool and as a means to follow the progression of diseases affecting DL.
We have already observed (see Equation 30-9) that we can use Fick's law to compute the overall uptake of a gas if we summate many individual diffusion events for all pieces of alveolar wall and all times in the respiratory cycle:

(30-23)
If we could ignore spatial and temporal nonuniformities, then we could eliminate the two troublesome Σ symbols and compute an overall DLgas from the overall ![]() . We could accommodate modest spatial and temporal variations in PAgas by computing an average alveolar partial pressure (
. We could accommodate modest spatial and temporal variations in PAgas by computing an average alveolar partial pressure (![]() ). Furthermore, if the partial-pressure profile of the gas along the capillary were linear, we could use an average capillary partial pressure (
). Furthermore, if the partial-pressure profile of the gas along the capillary were linear, we could use an average capillary partial pressure (![]() ) as well. If we could identify a gas for which these assumptions are reasonable, we could simplify Equation 30-23 to an expression that is similar to the version of Fick's law with which we started this chapter (see Equation 30-7):
) as well. If we could identify a gas for which these assumptions are reasonable, we could simplify Equation 30-23 to an expression that is similar to the version of Fick's law with which we started this chapter (see Equation 30-7):
![]()
(30-24)
Which gas could we use to estimate DL? We certainly do not want to use N2O, whose uptake is perfusion limited. After all, ![]() is more or less proportional to changes in
is more or less proportional to changes in ![]() , but virtually insensitive to changes in DL (see Table 30-2). Viewed differently, the driving pressure between alveolus and capillary (
, but virtually insensitive to changes in DL (see Table 30-2). Viewed differently, the driving pressure between alveolus and capillary (![]() ) is high at the beginning of the capillary but soon falls to zero (see Fig. 30-6B). Thus, it would be very difficult to pick a reasonable value for the average capillary
) is high at the beginning of the capillary but soon falls to zero (see Fig. 30-6B). Thus, it would be very difficult to pick a reasonable value for the average capillary ![]() to insert into Equation 30-24. However, CO is an excellent choice because its uptake is diffusion limited, so that changes in the parameter of interest (i.e., DL) have nearly a proportionate effect on
to insert into Equation 30-24. However, CO is an excellent choice because its uptake is diffusion limited, so that changes in the parameter of interest (i.e., DL) have nearly a proportionate effect on ![]() . Viewed differently, the driving pressure between alveolus and capillary (PACO − PcCO) is nearly ideal because it falls more or less linearly as blood courses down the pulmonary capillary (see Fig. 30-5B). Thus, we might solve Equation 30-24 for DLCO:
. Viewed differently, the driving pressure between alveolus and capillary (PACO − PcCO) is nearly ideal because it falls more or less linearly as blood courses down the pulmonary capillary (see Fig. 30-5B). Thus, we might solve Equation 30-24 for DLCO:
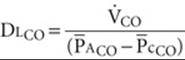
(30-25)
Note that DLCO and ![]() are average values that reflect properties of all alveoli throughout both lungs at all times in the respiratory cycle.
are average values that reflect properties of all alveoli throughout both lungs at all times in the respiratory cycle. ![]() reflects minor changes during the respiratory cycle, as well as more substantial variations in PACO from alveolus to alveolus due to local differences in ventilation and perfusion (see pp. 689–690). Finally,
reflects minor changes during the respiratory cycle, as well as more substantial variations in PACO from alveolus to alveolus due to local differences in ventilation and perfusion (see pp. 689–690). Finally, ![]() reflects not only the small increase in PcCO as blood flows down the capillary, but also any CO that may be present in the mixed-venous blood that enters the pulmonary capillary. For nonsmokers who live in a nonpolluted environment,
reflects not only the small increase in PcCO as blood flows down the capillary, but also any CO that may be present in the mixed-venous blood that enters the pulmonary capillary. For nonsmokers who live in a nonpolluted environment, ![]() is nearly zero, and thus we often can ignore
is nearly zero, and thus we often can ignore ![]() .
.
We will discuss two general methods for estimating DLCO, the steady-state technique and the single-breath test. These tests, both using CO, are useful for estimation of pulmonary diffusing capacity in a clinical setting, even among very ill patients in the intensive care unit.
In the steady-state technique (Fig. 30-8), the subject breathes a low-CO air mixture (e.g., 0.1% to 0.2%) for approximately a dozen breaths to allow PACO to stabilize. Calculating DLCO requires at least two measurements: ![]() and
and ![]() . We compute the rate of CO uptake from the difference between the amounts of CO in inspired air versus expired air over time. We can directly measure
. We compute the rate of CO uptake from the difference between the amounts of CO in inspired air versus expired air over time. We can directly measure ![]() in an alveolar-air sample (see pp. 676–677). DL is then
in an alveolar-air sample (see pp. 676–677). DL is then ![]() . If the subject happens to be a smoker or to live in a polluted environment, an accurate measurement of DL requires a venous blood sample to estimate the
. If the subject happens to be a smoker or to live in a polluted environment, an accurate measurement of DL requires a venous blood sample to estimate the ![]() . In this case, we calculate DL from the more complete expression in Equation 30-25.
. In this case, we calculate DL from the more complete expression in Equation 30-25.
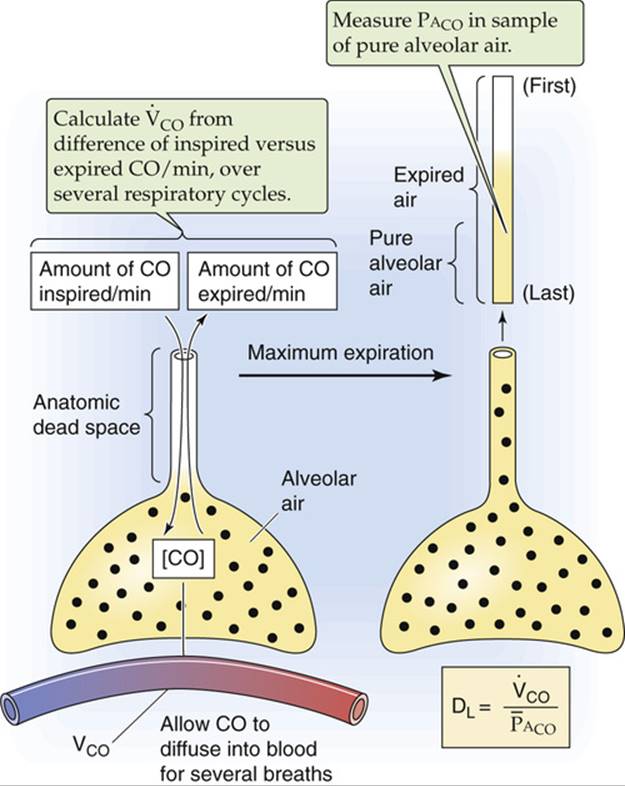
FIGURE 30-8 Steady-state method for estimating DLCO.
In the single-breath technique (Fig. 30-9), the subject makes a maximal expiratory effort to residual volume (see p. 602) and then makes a maximal inspiration of air containing CO and holds the breath for 10 seconds. The inhaled air is a mixture of dilute CO (e.g., 0.3%) plus a gas such as helium, which has a low water solubility and thus a negligible transport across the blood-gas barrier (see Equation 30-5). We can use helium to compute the extent to which the inhaled CO/He mixture becomes diluted as it first enters the alveoli, and also to calculate the alveolar volume into which the CO/He mixture distributes (see p. 602). This information allows us to calculate two crucial parameters at the beginning of the breath-holding period: (1) PACO and (2) the amount of CO in the alveoli. During the 10 seconds of breath holding, some of the inhaled CO diffuses into the blood. The greater the DLCO, the greater the diffusion of CO, and the more PACO falls. As the subject exhales, we obtain a sample of alveolar air and use it to determine two crucial parameters at the end of the breath-holding period: (1) PACO and (2) the amount of CO in the alveoli. The initial and final PACO values allow us to compute ![]() . The initial and final alveolar CO amounts allow us to compute
. The initial and final alveolar CO amounts allow us to compute ![]() during the 10-second breath-holding period.
during the 10-second breath-holding period.
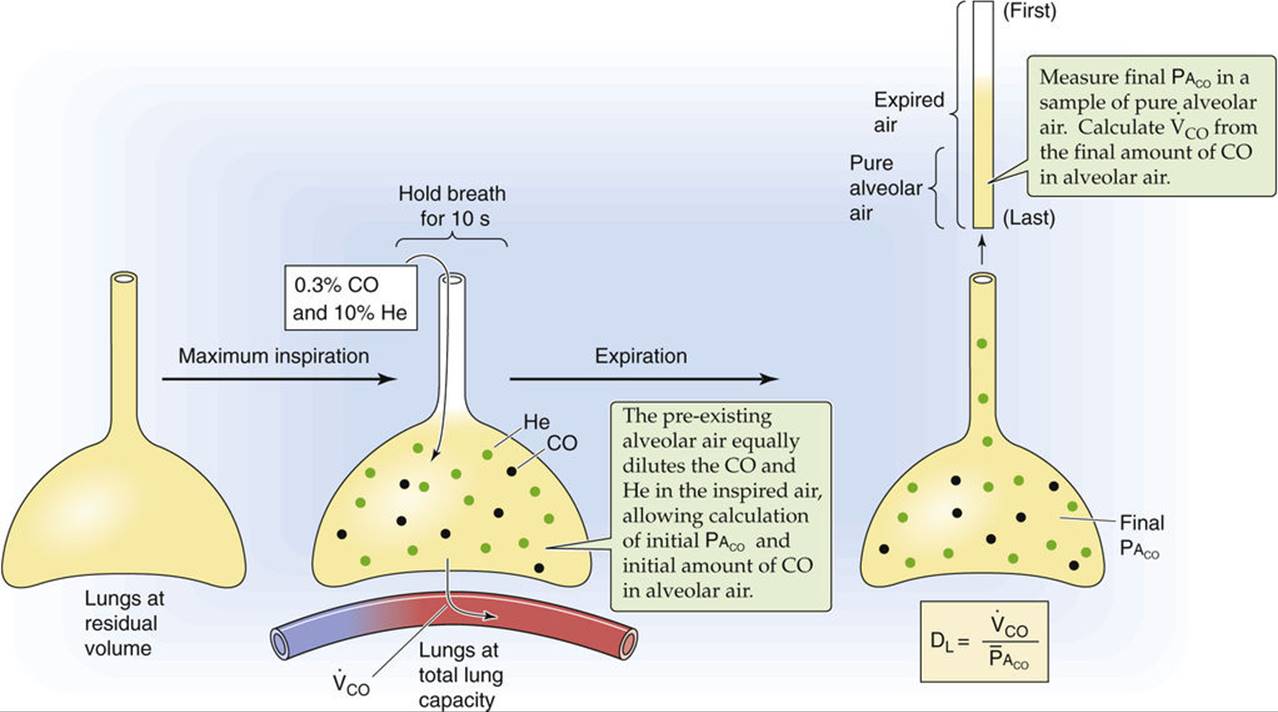
FIGURE 30-9 Single-breath method for estimating DLCO.
Bear in mind that the value of DLCO determined by use of either of these methods is an average pulmonary diffusing capacity. As discussed in Chapter 31, pulmonary disease can cause ventilation to become nonuniform, making it difficult to obtain alveolar-air samples that are representative of the entire lung. ![]() N30-7 A normal value for DLCO is ~25 mL CO taken up per minute for each millimeter of mercury of partial pressure driving CO diffusion and for each milliliter of blood having a normal Hb content. This value of DLCO depends not only on DM (i.e., the “membrane” or truly diffusive component of DL) in Equation 30-15 but also on θ ⋅ Vc. For CO transport, DM and θ ⋅ Vc are each ~50 mL CO/(min ⋅ mL blood):
N30-7 A normal value for DLCO is ~25 mL CO taken up per minute for each millimeter of mercury of partial pressure driving CO diffusion and for each milliliter of blood having a normal Hb content. This value of DLCO depends not only on DM (i.e., the “membrane” or truly diffusive component of DL) in Equation 30-15 but also on θ ⋅ Vc. For CO transport, DM and θ ⋅ Vc are each ~50 mL CO/(min ⋅ mL blood):
N30-7
Effect of Nonuniformity of Ventilation on Alveolar-Air Samples
Contributed by Emile Boulpaep, Walter Boron
In Chapter 31, we will introduce the single-breath N2-washout technique and Fowler method for measuring anatomical dead space (see pp. 676–677). In this approach, the subject inhales one breath of 100% O2, and we assume that the inspired 100% O2 distributes evenly throughout all the alveoli of the lungs. If ventilation is indeed uniform, the inspired O2 dilutes alveolar N2 uniformly in all regions of the lung. Thus, when the subject exhales, the air emerging from the alveolar air spaces should have a uniform [N2], and the plateau of the single-breath N2 washout should be flat, as shown by the part of the red curve in Figure 31-2C labeled “Pure alveolar air.”
However, if the alveoli are unevenly ventilated, the inhaled 100% O2 will not distribute uniformly throughout the lungs and therefore will not uniformly dilute the pre-existing alveolar N2. Regions of the lung that are relatively hypoventilated will receive relatively less 100% O2 during the single inspiration, so that they will be relatively poor in O2 but rich in N2. Conversely, hyperventilated regions will receive relatively more of the inhaled 100% O2 and hence will be O2 rich and N2 poor. During the expiration, we no longer observe a plateau for [N2]. Why? After exhalation of the anatomical dead space, the first alveolar air out of the lungs is dominated by the O2-rich/N2-poor gas coming from the relatively hyperventilated airways—which inflate and deflate relatively quickly. As the expiration continues, the alveolar air gradually becomes dominated more and more by the O2-poor/N2-rich gas from the hypoventilated airways, which inflate and deflate relatively slowly. Because of this shift from hyperventilated to hypoventilated regions, the [N2] gradually creeps upward—that is, there is no clear plateau—in subjects with a sufficiently high nonuniformity of ventilation.

(30-26)
Thus, 1/(θ ⋅ Vc) makes a major contribution to the final DLCO. Because Vc is proportional to the Hb content of the blood, and because Hb content is decreased in anemia, a subject can have a reduced DLCO even though the diffusion pathways in the lung (i.e., DM) are perfectly normal. Recall that 1/(θ ⋅ Vc) makes an insignificant contribution to the DL for O2. Nevertheless, it is the DL for CO—and not that for O2—that one uses for a clinical index of diffusing capacity. Table 30-3 summarizes several factors that can affect the calculated DLCO.
TABLE 30-3
Factors that Affect the Diffusing Capacity for CO
|
FACTOR |
EFFECT |
EXPLANATION |
|
Body size |
↑ Size → ↑ DLCO |
With ↑ in lung size, diffusion area (A) and volume of pulmonary-capillary blood (Vc) both ↑. |
|
Age |
↑ Age → ↓ DLCO |
DLCO decreases by ~2% per year after age 20. |
|
Sex |
Male → ↑ DLCO |
Corrected for age and body size, DLCO is about 10% greater in men than women. |
|
Lung volume |
↑ Volume → ↑ DLCO |
In an individual, ↑ in lung volume causes an ↑ in volume of pulmonary-capillary blood (Vc), an ↑ in diffusion area (A), and a ↓ in diffusion distance (a). |
|
Exercise |
Exercise → ↑ DLCO |
An ↑ in |
|
Body position |
DLCO: supine > sitting > standing |
Changes in posture presumably ↑ volume of pulmonary-capillary blood (Vc). |
|
|
↑ |
O2 lowers the rate at which CO combines with Hb. |
|
|
↑ |
CO2 causes an ↑ in volume of pulmonary-capillary blood (Vc). |
DLCO, diffusion capacity of CO; ![]() , partial pressure of CO2 in alveolar air;
, partial pressure of CO2 in alveolar air; ![]() partial pressure of O2 in alveolar air;
partial pressure of O2 in alveolar air; ![]() , cardiac output.
, cardiac output.
N30-10
Effect of CO2 on the Diffusing Capacity
Contributed by Emile Boulpaep, Walter Boron
An increase in arterial ![]() causes an increase in pulmonary-capillary blood (Vc) and thus an increase in the (θ ⋅ Vc) term of DL:
causes an increase in pulmonary-capillary blood (Vc) and thus an increase in the (θ ⋅ Vc) term of DL:
![]()
The preceding equation is a repetition of Equation 30-15. We will see in Chapter 31 that a high ![]() causes pulmonary vasoconstriction (see p. 687). Evidently, the predominant effect of increasing
causes pulmonary vasoconstriction (see p. 687). Evidently, the predominant effect of increasing ![]() (e.g., caused by breathing CO2) is to constrict pulmonary venules more than arterioles, thereby distending the pulmonary capillaries and thus increasing Vc. Note that according to this scenario, CO2 has no effect on DM (i.e., it has no direct effect on diffusion per se).
(e.g., caused by breathing CO2) is to constrict pulmonary venules more than arterioles, thereby distending the pulmonary capillaries and thus increasing Vc. Note that according to this scenario, CO2 has no effect on DM (i.e., it has no direct effect on diffusion per se).
References
Hyde RW, Lawson WH, Forster RE. Influence of carbon dioxide on pulmonary vasculature. J Appl Physiol. 1964;19:734–744.
Rankin J, McNeill RS, Forster RE. Influence of increased alveolar carbon dioxide tension on pulmonary diffusing capacity for CO in man. J Appl Physiol. 1960;15:543–549.
Schnermann J, Chou C-L, Ma T, et al. Defective proximal tubular fluid reabsorption in transgenic aquaporin-1 null mice. Proc Natl Acad Sci U S A. 1998;95:9660–9664.
For both O2 and CO2, transport is normally perfusion limited
Uptake of O2
Blood enters the pulmonary capillaries (Fig. 30-10A) with the ![]() of mixed-venous blood, typically 40 mm Hg. Capillary
of mixed-venous blood, typically 40 mm Hg. Capillary ![]() reaches the alveolar
reaches the alveolar ![]() of ~100 mm Hg about one third of the way along the capillary (see Fig. 30-10B, black curve). This
of ~100 mm Hg about one third of the way along the capillary (see Fig. 30-10B, black curve). This ![]() profile along the pulmonary capillary is intermediate between that of CO in Figure 30-5B (where CO fails to reach diffusion equilibrium) and N2O in Figure 30-6B (where N2O reaches diffusion equilibrium ~10% of the way along the capillary). The transport of O2 is similar to that of CO in that both molecules bind to Hb. Why, then, does O2 reach diffusion equilibrium, whereas CO does not?
profile along the pulmonary capillary is intermediate between that of CO in Figure 30-5B (where CO fails to reach diffusion equilibrium) and N2O in Figure 30-6B (where N2O reaches diffusion equilibrium ~10% of the way along the capillary). The transport of O2 is similar to that of CO in that both molecules bind to Hb. Why, then, does O2 reach diffusion equilibrium, whereas CO does not?

FIGURE 30-10 Diffusion of O2. In A, as the RBC enters the capillary, O2 occupies three of the four sites on Hb. In B through D, ![]() is alveolar
is alveolar ![]() . In B and D,
. In B and D, ![]() is constant.
is constant.
The uptake of O2 differs from that of CO in three important respects. First, Hb that enters the pulmonary capillary is already heavily preloaded with O2. Because Hb in the mixed-venous blood is ~75% saturated with O2 (see p. 650)—versus ~0% for CO—the available O2-binding capacity of Hb is relatively low. Second, because the alveolar ![]() is rather high (i.e., ~100 mm Hg)—versus <1 mm Hg for CO—the alveolar-blood
is rather high (i.e., ~100 mm Hg)—versus <1 mm Hg for CO—the alveolar-blood ![]() gradient is large (i.e., ~60 mm Hg) and the initial rate of O2 diffusion from the alveolus into pulmonary-capillary blood is immense. Third, DL for O2 is higher than that for CO, owing to a greater θ ⋅ Vc. As a result of these three factors, Hb in pulmonary-capillary blood rapidly approaches its equilibrium carrying capacity for O2 along the first third of the capillary. Because capillary
gradient is large (i.e., ~60 mm Hg) and the initial rate of O2 diffusion from the alveolus into pulmonary-capillary blood is immense. Third, DL for O2 is higher than that for CO, owing to a greater θ ⋅ Vc. As a result of these three factors, Hb in pulmonary-capillary blood rapidly approaches its equilibrium carrying capacity for O2 along the first third of the capillary. Because capillary ![]() reaches alveolar
reaches alveolar ![]() , O2 transport is perfusion limited, as is the case for N2O. Because O2 normally reaches diffusion equilibrium so soon along the capillary, the lung has a tremendous DL reserve for O2 uptake.
, O2 transport is perfusion limited, as is the case for N2O. Because O2 normally reaches diffusion equilibrium so soon along the capillary, the lung has a tremendous DL reserve for O2 uptake. ![]() N30-8 Even if we reduce
N30-8 Even if we reduce ![]() by half, O2 still reaches diffusion equilibrium about two thirds of the way along the capillary (see Fig. 30-10B, blue curve). If we could double
by half, O2 still reaches diffusion equilibrium about two thirds of the way along the capillary (see Fig. 30-10B, blue curve). If we could double ![]() , O2 would reach diffusion equilibrium much earlier than usual (see Fig. 30-10B, red curve). However, neither change in
, O2 would reach diffusion equilibrium much earlier than usual (see Fig. 30-10B, red curve). However, neither change in ![]() would affect O2 uptake, which is not diffusion limited.
would affect O2 uptake, which is not diffusion limited.
N30-8
Capillary Reserve in Renal Glomerulus
Contributed by Emile Boulpaep, Walter Boron
The DL reserve for O2 along the pulmonary capillaries is reminiscent of the filtration reserve that exists along the capillaries of the glomerulus in the kidney (see pp. 745–746). In both cases, the system is able to accommodate a substantial increase in blood flow before saturating.
The DL reserve for O2 uptake is extremely important during exercise, when cardiac output can increase by up to a factor of 5 (see p. 410), a change that substantially decreases the contact time of the blood with the pulmonary capillaries. The contact time appears not to decrease by more than a factor of ~3, probably because the slightly increased pressure recruits and distends the pulmonary vessels (see p. 687). As a result, even with vigorous exercise, ![]() reaches virtual equilibrium with the alveolar air by the end of the capillary (see Fig. 30-10C, green curve)—except in some elite athletes.
reaches virtual equilibrium with the alveolar air by the end of the capillary (see Fig. 30-10C, green curve)—except in some elite athletes. ![]() N30-9 Thus, the increase in
N30-9 Thus, the increase in ![]() during exercise leads to a corresponding increase in
during exercise leads to a corresponding increase in ![]() , which carries obvious survival benefits. In patients with pulmonary disease, thickening of the alveolar blood-gas barrier can reduce
, which carries obvious survival benefits. In patients with pulmonary disease, thickening of the alveolar blood-gas barrier can reduce ![]() sufficiently that equilibration of
sufficiently that equilibration of ![]() fails to occur by capillary's end during exercise (see Fig. 30-10C, brown curve). In this case, O2 transport becomes diffusion limited.
fails to occur by capillary's end during exercise (see Fig. 30-10C, brown curve). In this case, O2 transport becomes diffusion limited.
N30-9
Exercise-Induced Arterial Hypoxemia in Females
Contributed by Emile Boulpaep, Walter Boron
In elite male athletes—and thoroughbred race horses, which are bred to have an impressive cardiac output—maximal aerobic exercise may lead to arterial hypoxemia—a fall in the ![]() of arterial blood. The reason for this hypoxemia is believed to be a cardiac output that outstrips the lung's diffusion reserve, leading to a failure to reach diffusion equilibrium in the pulmonary capillaries (i.e., diffusion-limited O2transport). Note that in most men—those with normal levels of maximal cardiac output—maximum exercise does not lead to arterial hypoxemia. Instead, the exercise-induced increase in ventilation maintains a near-normal arterial
of arterial blood. The reason for this hypoxemia is believed to be a cardiac output that outstrips the lung's diffusion reserve, leading to a failure to reach diffusion equilibrium in the pulmonary capillaries (i.e., diffusion-limited O2transport). Note that in most men—those with normal levels of maximal cardiac output—maximum exercise does not lead to arterial hypoxemia. Instead, the exercise-induced increase in ventilation maintains a near-normal arterial ![]() and usually a lower-than-normal arterial
and usually a lower-than-normal arterial ![]() .
.
In women, however, it is common for exercise to lead to arterial hypoxemia. This effect does not correlate with level of physical fitness but appears to be constitutional, possibly reflecting an exercise-induced increase in ventilation-perfusion mismatch.
Reference
Harms CA, McClaran SR, Nickele GA, et al. Exercise-induced arterial hypoxaemia in healthy young women. J Physiol. 1998;507:619–628.
Like exercise, high altitude stretches out the ![]() profile along the capillary (see Fig. 30-10D, red curve). The reasons are two, both of which stem from the low barometric pressure at altitude, which leads to a proportional decrease in ambient
profile along the capillary (see Fig. 30-10D, red curve). The reasons are two, both of which stem from the low barometric pressure at altitude, which leads to a proportional decrease in ambient ![]() (see p. 1230) and thus to a fall in alveolar
(see p. 1230) and thus to a fall in alveolar ![]() . First, the low
. First, the low ![]() causes the alveolar-capillary
causes the alveolar-capillary ![]() gradient at the beginning of the capillary to fall, reducing the absolute O2transport rate. It is true that continued O2 extraction by the systemic tissues causes
gradient at the beginning of the capillary to fall, reducing the absolute O2transport rate. It is true that continued O2 extraction by the systemic tissues causes ![]() to fall as well in the mixed-venous blood that enters the pulmonary capillaries. However, at altitude, the difference driving O2 uptake,
to fall as well in the mixed-venous blood that enters the pulmonary capillaries. However, at altitude, the difference driving O2 uptake, ![]() , is still smaller than normal. Second, because at altitude
, is still smaller than normal. Second, because at altitude ![]() is lower, we now operate on a steeper part of the Hb-O2 dissociation curve (see Fig. 29-3). Thus, a given increment in the O2content of the pulmonary-capillary blood occurs with a smaller increase in
is lower, we now operate on a steeper part of the Hb-O2 dissociation curve (see Fig. 29-3). Thus, a given increment in the O2content of the pulmonary-capillary blood occurs with a smaller increase in ![]() .
.
The combination of exercise and high altitude can cause O2 transport to become diffusion limited even in healthy individuals (see Fig. 30-10D, green curve). If the subject also has a pathological condition that lowers ![]() , then transport may become diffusion limited even more readily at altitude. Obviously, any combination of exercise, high altitude, and reduced
, then transport may become diffusion limited even more readily at altitude. Obviously, any combination of exercise, high altitude, and reduced ![]() compounds the problems for O2 transport.
compounds the problems for O2 transport.
Escape of CO2
Mixed-venous blood entering the pulmonary capillary has a ![]() of ~46 mm Hg, whereas the alveolar
of ~46 mm Hg, whereas the alveolar ![]() is ~40 mm Hg (Fig. 30-11A). Thus, CO2 diffuses in the opposite direction of O2—from blood to alveolus—and
is ~40 mm Hg (Fig. 30-11A). Thus, CO2 diffuses in the opposite direction of O2—from blood to alveolus—and ![]() falls along the pulmonary capillary (see Fig. 30-11B, black curve), eventually reaching diffusion equilibrium. Compared with O2, one factor that tends to speed CO2 equilibration is that the DL for CO2is 3-fold to 5-fold greater than that for O2 (see p. 664). However, two factors tend to slow the equilibration of CO2. First, the initial
falls along the pulmonary capillary (see Fig. 30-11B, black curve), eventually reaching diffusion equilibrium. Compared with O2, one factor that tends to speed CO2 equilibration is that the DL for CO2is 3-fold to 5-fold greater than that for O2 (see p. 664). However, two factors tend to slow the equilibration of CO2. First, the initial ![]() gradient across the blood-gas barrier is only ~6 mm Hg at the beginning of the capillary, ~10% as large as the initial
gradient across the blood-gas barrier is only ~6 mm Hg at the beginning of the capillary, ~10% as large as the initial ![]() gradient. Second, in their physiological ranges, the CO2-dissociation curve (see Fig. 29-10) is far steeper than the Hb-O2 dissociation curve (see Fig. 29-3). Thus, a decrement in the CO2 content of the pulmonary-capillary blood causes a relatively small decrease in
gradient. Second, in their physiological ranges, the CO2-dissociation curve (see Fig. 29-10) is far steeper than the Hb-O2 dissociation curve (see Fig. 29-3). Thus, a decrement in the CO2 content of the pulmonary-capillary blood causes a relatively small decrease in ![]() . Thus, a smaller gradient and a steeper dissociation curve counteract the larger DL. Many authors believe that, as indicated by the black curve in Figure 30-11B, capillary
. Thus, a smaller gradient and a steeper dissociation curve counteract the larger DL. Many authors believe that, as indicated by the black curve in Figure 30-11B, capillary ![]() reaches alveolar
reaches alveolar ![]() about one third of the way along the pulmonary capillary (as is the case for O2). Others have suggested that CO2equilibration is slower, occurring just before the end of the pulmonary capillary. In either case, CO2 excretion is perfusion limited. The decrease in DL that occurs in certain lung diseases (see next section) or heavy exercise (see Fig. 30-11B, red and blue curves) may cause the transport of CO2 to become diffusion limited.
about one third of the way along the pulmonary capillary (as is the case for O2). Others have suggested that CO2equilibration is slower, occurring just before the end of the pulmonary capillary. In either case, CO2 excretion is perfusion limited. The decrease in DL that occurs in certain lung diseases (see next section) or heavy exercise (see Fig. 30-11B, red and blue curves) may cause the transport of CO2 to become diffusion limited.

FIGURE 30-11 Diffusion of CO2. In B, ![]() is alveolar
is alveolar ![]() .
.
Pathological changes that reduce DL do not necessarily produce hypoxia
The measured pulmonary diffusing capacity for CO falls in disease states accompanied by a thickening of the alveolar blood-gas barrier, a reduction in the surface area (i.e., capillaries) available for diffusion, or a decrease in the amount of Hb in the pulmonary capillaries. Examples of pathological processes accompanied by a decrease in DL include the following:
Diffuse interstitial pulmonary fibrosis, a fibrotic process causing a thickening of the interstitium, thickening of alveolar walls, and destruction of capillaries—sometimes with marked decreases in DL. In some cases, the cause is unknown (i.e., idiopathic); in others it is secondary to such disorders as sarcoidosis, scleroderma, and exposure to occupational agents (e.g., asbestos).
Chronic obstructive pulmonary disease (COPD), which not only increases the resistance of conducting airways (see p. 597) but can lead to a destruction of pulmonary capillaries and thus a reduction in both (1) surface area available for diffusion, and (2) total pulmonary-capillary Hb content (see p. 619).
Loss of functional lung tissue, as caused by surgical removal of lung tissue. DL falls because of a decrease in both (1) surface area, and (2) total pulmonary-capillary Hb content.
Anemia, in which the fall in total Hb content decreases the θ ⋅ Vc component of DLCO.
Although pulmonary diseases can cause both a decrease in DL and hypoxemia (i.e., a decrease in arterial ![]() ), it is not necessarily true that the decrease in DL is the sole or even the major cause of the hypoxemia. The same diseases that lower DL also upset the distribution of ventilation and perfusion throughout the lung. As discussed in Chapter 31, mismatching of ventilation to perfusion among various regions of the lungs can be a powerful influence leading to hypoxemia. Furthermore, because the lung has a sizeable DL reserve for O2 (and perhaps for CO2 as well), DL would have to decrease to about one third of its normal value for O2 transport to become diffusion limited. Thus, in a disease causing both a decrease in DL and disturbances in the distribution of ventilation and perfusion, it is difficult to determine the extent to which an accompanying reduction of DL is responsible for the resulting hypoxemia.
), it is not necessarily true that the decrease in DL is the sole or even the major cause of the hypoxemia. The same diseases that lower DL also upset the distribution of ventilation and perfusion throughout the lung. As discussed in Chapter 31, mismatching of ventilation to perfusion among various regions of the lungs can be a powerful influence leading to hypoxemia. Furthermore, because the lung has a sizeable DL reserve for O2 (and perhaps for CO2 as well), DL would have to decrease to about one third of its normal value for O2 transport to become diffusion limited. Thus, in a disease causing both a decrease in DL and disturbances in the distribution of ventilation and perfusion, it is difficult to determine the extent to which an accompanying reduction of DL is responsible for the resulting hypoxemia.