
Roger Mazze, PhD Oded Langer, MD, PhD Matthew Murphy, BS
Science is a very human form of knowledge. We are always at the brink of the known. We always feel forward for what is to be hoped.
—Jacob Bronowski
Key Points
• Diurnal glucose patterns during pregnancies uncomplicated by dysglycemia are characterized by 20% lower glucose exposure and variability.
• Current screening and diagnostic tests for dysglycemia in pregnancy cannot detect perturbations in glycemic control caused by the daily routine of activity and nutrition.
• Maintenance of tight glycemic control in pregnancy is achievable if the underlying dysglycemia can be detected and the appropriate therapy is immediately initiated.
• Continuous glucose surveillance, employing continuous glucose monitoring throughout pregnancy, should be a fundamental tool in the management of pregnancy if mimicking normal glycemia is to be achieved.
The significance of glucose monitoring in pregnancy complicated by diabetes cannot be overstated. Although the evidence remains equivocal as to the precise contribution glucose control provides to the maternal and fetal outcomes of pregnancy, there is no doubt that its importance remains paramount. Perhaps the most potent argument can be summed up by this observation: “if the human body spends so much energy to maintain the blood glucose level within such a narrow range, it is because otherwise it would be deleterious.”1 Pregnancies characterized by normal glucose metabolism have the lowest risk of maternal and fetal complications when compared to those complicated by any degree of dysglycemia.2-6
Our studies have shown that women with normal glucose tolerance (NGT) in pregnancy (as measured by oral glucose tolerance test [OGTT] and corroborated by diurnal glucose profiles) are characterized by blood glucose levels (60-120 mg/dL or 3.3-6.7 mmol/L) 20% below those of nonpregnant women without diabetes; and, that this disparity is maintained throughout pregnancy despite an increase in human placental lactogen, consequential insulin resistance, increased maternal weight, and significant changes in diet and activity.7 These metabolic changes, culminating at the end of pregnancy, are essential for normal fetal nourishment, growth and development, and adequate maternal metabolism. Furthermore, any period of hyperglycemia may be consequential, leading to accelerated and exaggerated fetal growth resulting in large-for-gestational-age or macrosomic infants.6 Excessively low glucose may retard growth. Oscillating glucose levels, alternating between hyperglycemia and hypoglycemia, may have both fetal and maternal consequences as they have been shown to increase the risk of apoptosis. Therefore, maintenance of glycemic control within a very narrow range in both normal and metabolically challenged pregnancies contributes significantly to the reduction of adverse perinatal outcomes. Consequently, it has become increasingly important to measure and manage the volatility or variability in glucose excursions. With the advent of continuous glucose monitoring (CGM), it has become feasible to measure and potentially manage the diurnal glucose patterns of women during pregnancy without confining them to bed rest. It is possible to characterize diurnal glucose perturbations and to detect the slightest abnormalities in glucose metabolism under conditions of daily living and potentially ameliorate them.
Until the advent of home glucose reflectance meters, routine prenatal care for the woman with diabetes included blood drawn while in the doctor’s office and sent to a laboratory for analysis. For home management, women were supplied with urine glucose testing kits. With the advent of reflectance meters, modern obstetrical practice could instantly measure blood glucose, as could patients at home. But, what did these measures mean? Was a single glucose of 55 mg/dL too low and suggest hypoglycemia or glucose of 180 mg/dL too high and signal hyperglycemia? Does a single glucose measure have any significance? To determine this, it is important to note where the glucose came from and where is it going. Shown in Figure 12-1 is a graphic display or modal day of a single glucose value (left side) obtained at 7 am. Shown on the right two panels are two possible directions from where this glucose came and to where it is going. The difference between the two is significant as in one case (top) the origin is from a state of hypoglycemia and moving toward hyperglycemia, whereas the bottom panel shows the reverse. The clinical decision would be incorrect and potentially a serious mistake if the wrong path were assumed. Suppose, instead, both the origin and the path are known. In this illustration (which represents 288 CGM values displayed according to time), it is clear that if the bottom right panel is followed, the patient is experiencing overnight hyperglycemia proceeded by a lowering of blood glucose after awakening. This is followed by stabilization of glucose within the target range (defined by the two solid parallel lines set at 60-120 mg/dL) until the evening postprandial period when glucose levels rise again. This level of specificity is only possible through use of CGM, which allows for a closer examination of overall glucose exposure.

CHARACTERIZING GLUCOSE CONTROL
In the lexicon of glucose monitoring and diurnal glucose patterns, glucose exposure has become an important concept. Essentially, the clinical question is whether there is excess exposure, where it occurs and at what frequency. Exposure is by convention measured as the area under the curve (AUC). Because a daily CGM tracing produces a single continuous curve, then the area under this curve would constitute exposure and the difference between the patient’s curve and the reference or curve for NGT in pregnancy would define or characterize “excess” of “reduced” exposure. To measure glucose exposure, the curve is segmented into 24 equal parts each representing one hour (x axis) and the height of the curve (hourly median) as the y axis. Therefore, AUC =  where i = hour of the day and P50i = the smoothed 50th percentile value for the ith hour of the day. Note, this value is displayed as mg/dL x 24 hours. For example, in Figure 12-1, the 7 to 8 am period is 1 x 80 mg/dL= 80 mg/dL/hr and the 9 to 10 pm period is 1 x 110 mg/dL = 110 mg/dL x h. By summing the hourly area for the full day, the AUC is 2100 mg/dL x 24 hours.
As shown in Figure 12-1, the diurnal pattern represents a single day. Is this sufficient data on which to base a clinical decision? The question can be reframed as to whether there are sufficient data to predict the next several days assuming there are no significant alterations in meals and treatment. Figure 12-2 shows graphics that represent three individuals days (1, 2, and 3) of glucose values as well as the three days combined into one modal or representative diurnal glucose profile. Note that each successive day’s glucose pattern differs from the one before in several important ways. The overall glucose exposure for each day is different as is the variability. To represent these differences, we developed the ambulatory glucose profile (AGP).8

As shown in Figure 12-2, right panel, the AGP employs the same individual glucose values that comprise the data from the three individual days; however, it disregards the dates and only considers the time associated with each value. The AGP is depicted by five frequency curves drawn to denote the underlying pattern these glucose values represent. The center curve is the median. At each five-minute time interval, the values are plotted and since more than one day is represented, the median is calculated as the middle value; 50% of all CGM values fall above and 50% fall below this point. In many cases, the mean and median are the same. However, because glucose values are not normally distributed, the mean is replaced by the median in the AGP. The area under the median represents the glucose exposure for multiple days.
The next two curves on either side of the median represent the 25th (lower) and 75th (upper) percentile curves. The area between them (shaded) is called the interquartile range (IQR). For each time period, 50% of all values will be found within the IQR. For example, at 8 am, 50% of all glucose values fall between 70 and 120 mg/dL, whereas at 4 pm 50% of the values fall between 70 and 90mg/dL. The outlier values (10th and 90th percentiles) are represented by the bottom and top curves (depicted in dotted lines). Ten percent of all values fall below the 10th percentile and above the 90th percentile curves. Examining the AGP, between 10 and 11 pm, 10% of CGM values are below the lower 60 mg/dL and 10% are above 110 mg/dL.
By representing the glucose values as five curves, or AGP, it is possible to rapidly determine whether there is an underlying pattern. In Figure 12-2, the AGP in the right panel shows that glucose levels overnight are variable with 50% (IQR) ranging from 70 to 110 mg/dL, which narrows at 4 am. Between 7 and 11 am, the glucose levels remain at the upper limits of the target range they then descend and remain in range until 8 am. At this point, about 10% of all values fall to hypoglycemic levels from which they do not recover. Two questions emerge: (1) how predictable is this pattern; and (2) is the current intervention efficacious? Xing et al. after a multicenter trial (n = 185) with CGM concluded that 12 to 15 days of CGM are needed to “optimally assess overall glucose control.”9 However, this study was carried out in nonpregnant subjects. Since, in current obstetrical practice, there is a need to rapidly confirm a diagnosis of glucose intolerance, detect the underlying glucose abnormalities, and initiate treatment is the hallmark of successful restoration of euglycemia, we sought to determine the minimum number of days that are sufficient for clinical decision making.7 We studied 82 women in pregnancy (51 NGT, 25 gestational diabetes mellitus [GDM], and 6 pre-gestational diabetes [pre-GD]). The three-day AGP appeared to be sufficient to establish reference values with consistency. Next the AGPs of the 30 subjects with diabetes were analyzed. The three-day profiles were sufficient to detect underlying metabolic perturbations. In addition, we examined 21 nonpregnant women matched for age (31 ± 7 years of age) with NGT.8 All women with abnormal glucose tolerance were treated to 80% of values between 60 and 120mg/dL (3.3-6.7 mmol/L). We then determined the mean values for glucose exposure, variability, and percent hypoglycemia. The results are reported in Table 12-1, and reference AGPs are illustrated in Figures 12-3 to 12-5. They are comparable to the findings of other investigators using both longitudinal and in-hospital data for normal pregnancies.10,11
TABLE 12-1 Maternal Reference Values for Diurnal Glucose Pattern Characteristics Normalized by Subgroup7
|
Group (Count) |
Exposure AUC (mg/dL/24 h) |
Variability IQR (mg/dL) |
%Hypoglycemia BG <60 mg/dL |
|
Nonpregnant (NGT 21) |
2444 ±165 |
21.6 ± 4 |
1 ± 1 |
|
Normal pregnant (NGTP 51) |
2042 ± 295 |
23 ± 9 |
13 ± 15 |
|
Gestational diabetes (GDM 24) |
|||
|
Treated medically (18) |
2284 ± 261 |
35 ± 12 |
12 ± 11 |
|
Diet treatment (7) |
2125 ±110 |
27 ± 7 |
10 ± 5 |
|
Pregestational (pre-GD 6) |
2580 ± 526 |
50 ± 19 |
11 ± 7 |
Abbreviations: AUC, area under the curve; BG, blood glucose; GDM, gestational diabetes mellitus; IQR, interquartile range; NGT, normal glucose tolerance NGTP normal glucose tolerance in pregnancy.
CGM AS A DIAGNOSTIC TOOL
The diagnosis of diabetes in pregnancy has taken on considerable importance with the proposal for altering the diagnostic criteria. What role can CGM play in this debate? Can CGM identify women with underlying abnormalities that go undetected by current screening and diagnostic criteria? Is the OGTT the best diagnostic tool? To address these questions, we re-examined 51 cases of NGT for whom we collected CGM data along with perinatal outcomes.7 For each case, we produced the AGP from CGM data, measured the newborn weight, and sought to determine whether the diurnal glucose pattern provided early evidence of fetal outcome.
Figure 12-3 shows the AGP report for a woman (23 years old, body mass index [BMI] 38 kg/m2) whose screening glucose challenge test (GCT) was positive and whose 100 g three-hour oral glucose tolerance test (OGTT) was negative (80, i eat 148, 113, and 97 mg/dL). Following the glucose tolerance test, she underwent CGM. Although at risk for GDM due to her obesity as a result of the OGTT, no further intervention was initiated. As indicated in the AGP, her mean glucose was 90 mg/dL, and her overall glucose exposure was within target. As indicative of our reference cases, 1.5% of her values were within the hypoglycemic range for pregnancy. She delivered at 40 weeks, and the birth weight was 3540 g.
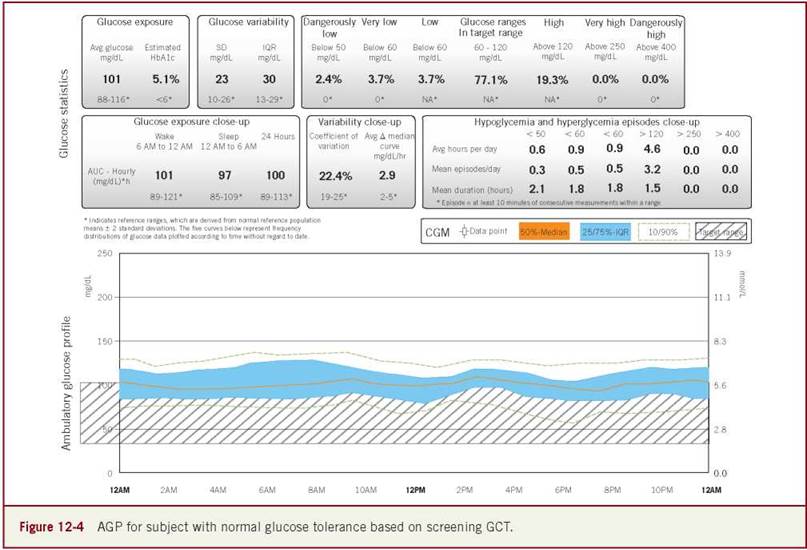
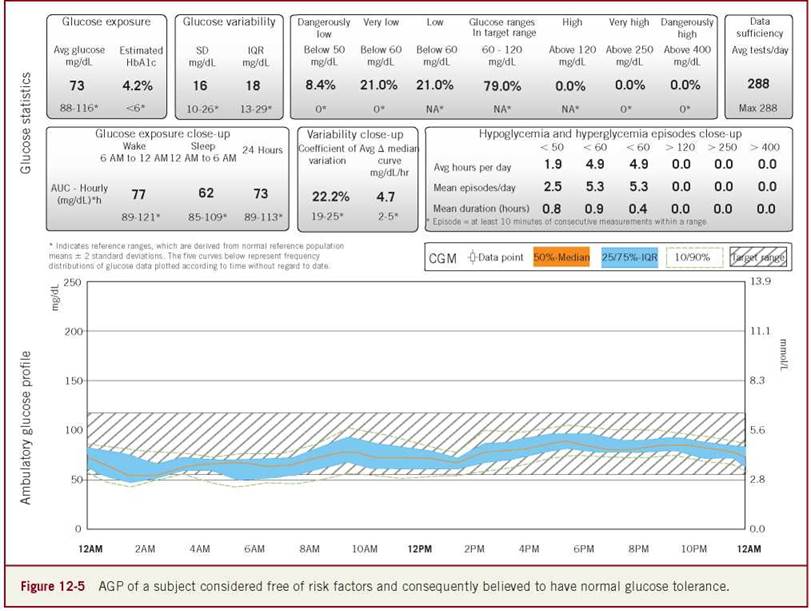
Figures 12-4 and 12-5 show additional cases with NGT based on either GCT or OGTT. In both cases, the birth weights may have been indicative of an underlying dysglycemia not revealed during the standard screening and diagnostic tests. Was there evidence in their AGPs that might have indicated an increased risk of adverse fetal outcome despite the results of the glucose tolerance test?
Figure 12-4 is the AGP of a female aged 23 years with BMI 37.2 kg/m2. She began CGM immediately following her CGT (1 h 93 mg/dL) in her 24th gestational week. Birth weight was 4270 g at an estimated 41 weeks gestational age (considered large for gestational age [LGA]). Close examination of her CGM data revealed that 19.3% of her glucose values exceeded the top limit of the target range. She averaged 4.6 hours in the hyperglycemic range each day. During periods of persistent hyperglycemia, it is likely that the excess glucose exposure was shunted to the developing fetus. Further evidence indicates that her overall glucose control was mean 101 mg/dL and exposure was 2424 mg/dL * 24 h or 20% greater than “ideal” glycemic control in pregnancy.
Figure 12-5 shows the AGP of a female, 23 years of age, with a BMI of 30 kg/m2. Because she had no family or personal history of diabetes and no apparent risk factors, she did not undergo screening. She delivered at 37 weeks with fetal weight 2410 g, considered small for gestational age (SGA). Examination of her AGP revealed that her average glucose was 73 mg/dL with 8.4% of CGM below target, spending 4.9 hours each day in the hypoglycemic range. The hypoglycemia appeared chronic as it occurred overnight and well into the day, ending at approximately 4 pm. Although there was no ketone data, the low birth weight may be indicative of fetal undernourishment.
The use of CGM with corresponding AGP analysis as a diagnostic tool remains controversial. These three examples are suggestive of a possible application of this technology in an area of diabetes that has remained mysterious to many. What is the purpose of screening and diagnosis in terms of the discovery of GDM? It would appear that the short-term answer is clear, “to reduce the risk of adverse perinatal, neonatal and material outcomes.” Linking the diagnosis to the detection of dysglycemia and furthermore to the identification of the factors contributing to the dysglycemia seems significant. Diurnal glucose patterns provide a unique vantage point for understanding how activities of daily living contribute to glycemic control, which was not feasible prior to the advent of CGM. Should everyone undergo a period of CGM during pregnancy in place of or in addition to more standardized testing, perhaps. Current technology makes this unfeasible but raises the question as to who should be considered for this level of investigation. The examples of three women who were deemed to have “NGT” revealed that the woman with the high- risk profile due to obesity (Figure 12-4) produced a healthy child; the woman with a similar profile produced a macrosomic infant and the woman with no risk factors produced a small for gestational age (SGA) infant. It would suggest that in the three cases since the AGPs were distinctive, they may have been useful.
CGM AS A THERAPEUTIC TOOL
It had been assumed axiomatic that with the additional information available through self-monitored blood glucose (SMBG), perinatal outcomes would improve. The evidence is somewhat equivocal although leaning in favor of a beneficial effect when month. In the left panel, the initial AGP showed that the mean glucose was 77 mg/dL with an IQR (variability) of 27 mg/dL. Overall glucose exposure was 1872 mg/dL x 24 hours. Did the profile corroborate the clinical decision to initiate dietary treatment? Closer examination revealed significant and prolonged overnight hypoglycemia with 21% of the CGM values below 50 mg/dL. The uninterrupted hypoglycemic episodes lasted on average 1.3 hours; and there were four such episodes each night. The AGP clearly indicates that the episodes begin at midnight and continue periodically until 8 am. Had only SMBG been available, it would have produced a consistent within target fasting as the patient awakened after 8 am. Once awake, the patient’s diurnal glucose pattern changed. Generally glucose levels remained within the target range with periodic excursions (10 am to 12 noon, 3-4 pm, 7-9 pm, and 10-11 pm) into the hyperglycemic range (shown in dashed lines). Constituting 7.4% of the CGM values, these hyperglycemic excursions lasted on average 40 minutes. The combination of significant hypoglycemia with periodic hyperglycemia appeared to corroborate the original diagnosis. Since the initial discovery occurred early in pregnancy, dietary intervention with close monitoring could be initiated with low risk of worsening the dysglycemia.

The first task appeared to be a reduction in the risk of severe hypoglycemia. As shown in the right panel of Figure 12-6, the change in treatment (increase in carbohydrate proportion) used properly. With the advent of CGM, the axiom should take on even more significance. Twenty-four-hour uninterrupted monitoring should provide a physiologic framework for clinical decision making in three general areas: (1) detection of the underlying dysglycemia; (2) selection of the most efficacious therapy; (3) measuring treatment effectiveness and guiding adjustments. Can CGM assist in detecting even the slightest dysglycemia in a manner that will guide treatment decisions? In our analysis of patients treated with diet only therapy and periodically monitored by CGM over a period of seven months, we could identify underlying dysglycemia heretofore impossible to detect.7
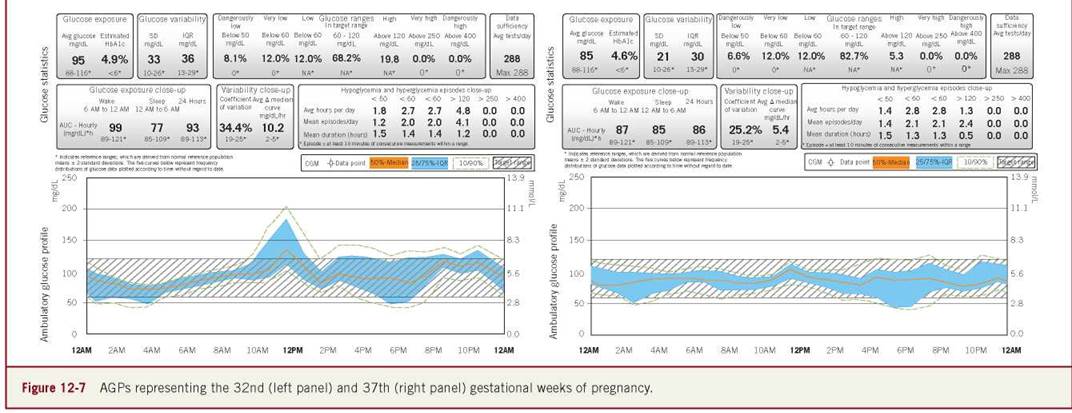
Figures 12-6 and 12-7 track the progress of a 37-year-old woman (parity 0) with a BMI of 19.2 kg/m2 who underwent an OGTT in her third month of pregnancy. The results (fasting: 81 mg/dL, 1 hour: 108 mg/dL, 2 hours: 187 mg/dL, 3 hours: 101 mg/dL) indicated GDM due to the combination of one abnormal value (3 hours) and the timing of the OGTT. Rather than repeating the OGTT in the third trimester, the clinicians decided to place the patient on a restricted diet comparable to that used for patients with GDM (40% carbohydrate, 20% protein, and 40% fat) and periodically monitor her on a monthly basis employing CGM followed up by alterations in treatment if required. Figure 12-6 depicts the AGP for the period immediately following the OGTT and the next significantly reduced the incidence of severe hypoglycemia to 6.7% and the duration to 30 minutes. It also moved the hypoglycemic episodes to daytime (8 am to 4 pm). As illustrated in the AGP, there was a significant increase in the breakfast postprandial glucose excursions reaching as high as 200 mg/dL. However, since this was limited to one time period and dietary related, the intervention could be focused. Further examination revealed that the proportion of values within target had risen to 79.6% and that the mean glucose (8 mg/dL) and glucose exposure (1944 mg/dL x 24 hours) were within target.

The second sequence of AGPs (Figure 12-7) was completed during the 8th and 9th months of pregnancy treated with diet only therapy. As shown in the left panel, the attempt to ameliorate the postprandial hyperglycemia failed. Peak glucose levels at mid-day increased to 200 mg/dL. Overall, mean glucose level increased to 95 mg/dL with 68.2% within target and 19.8% above target. Excess glucose exposure was 400 mg/dL x 24 hours, which is 20% above target. On a daily basis, the patient averaged two episodes of severe hypoglycemia, each lasting 90 minutes. The first episode occurred overnight. Due to the wide variability, the episode would be unpredictable. During some days, the glucose would be in target, while on other days, the glucose would be below target. The second episode occurred between 5 and 7 pm with less certainty than the overnight hypoglycemia. The wide IQR is indicative of inconsistent patterns related to nutrition and activity making it difficult to adjust treatment. Nevertheless, by the next monitoring period, one week prior to delivery (shown in the right panel), the postprandial hyperglycemia was resolved, much of the overnight hypoglycemia was corrected and the overall variability was reduced. This resulted in a lower mean glucose and consequently near normal glucose exposure. This raised the proportion of values within target to 82.7%. Birth via vaginal delivery occurred at 38.2 gestational weeks and birth weight was 3230 g.
The review of this sequence of AGPs representing six months of pregnancy revealed findings that heretofore were generally hidden, especially in GDM treated by diet only. Most prominent was the identification of repeated episodes of (<60 mg/dL) hypoglycemia. Examination of all women treated by diet only therapy in this series revealed that they ranged from 10% to 20% hypoglycemia. When compared to women treated with pharmacologic agents, the range was almost identical 12% versus 10%, respectively. In this case, postprandial glucose excursions were >200 mg/dL suggesting the possibility of underlying type 2 diabetes, which would not have been supported by her BMI and therefore unlikely to be under surveillance. Comparing all women with diet only treatment with women treated with pharmacologic agents, less than 0.5% of the time patients diet only treatment experience resulted in glucose >200 mg/dL, whereas patients treated with pharmacologic agents had nearly triple the incidence. Further analysis of CGM data showed that women treated with pharmacologic agents had greater variability (IQR 27.4 vs. 34.4 mg/dL) and glucose exposure (2125 vs. 2284 mg/ dL x 24 hours) than women treated with diet only.
Close examination of the relationship between the CGM data and maternal/fetal biophysical parameters revealed that women treated with pharmacologic agents tended to be heavier (BMI 33 vs. 22 kg/m2) and their offspring larger (birth weight 3188 vs. 2973 g). This would be predictable based on their greater glucose exposure. In this series of women, the OGTT was consistently higher for the insulin- or glargine-treated group when compared to diet. This is not surprising as the initial clinical decision was made based on the results of the glucose tolerance test.
What then did CGM with AGP analyses contribute? Before examining the question, the same study series collected AGPs on patients with pregestational diabetes. Figure 12-8 shows the AGP of a 26-year-old woman with BMI 26.6 kg/m2 with type 1 diabetes in her third trimester treated with basal/bolus insulin. In comparison to the subject shown previously, this subject exceeds the other in all AGP characteristics except hypoglycemia. Glucose exposure is more than 20% above target and glucose variability is twofold greater than the target. Less than half the CGM values are within target. Consequently, the patient spends 15% of the time in hypoglycemia and 40% in hyperglycemia. The wide variability throughout the day and overnight makes clinical decision making especially difficult. Virtually at every time period, there is a risk of hypoglycemia if too much insulin is administered to overcome the hyperglycemia. The two highest risk periods are 4 to 6 am and 5 to 7 pm. At these times, there is an equal risk of hypoglycemia or hyperglycemia. This is due to the day-to-day differences in glycemic control. The period of least risk of hypoglycemia and consequently the greatest likelihood of succeeding in overall reduction in glycemia is 8 am to 2 pm. Not surprisingly this period extends from breakfast through lunch. Dietary changes are likely to reduce the high glucose during this period and to lessen the variability. This step takes precedence. The next step would be to reduce the basal insulin to correct the hypoglycemia, but only after the dietary changes are evaluated.

The importance of tight glycemic control in minimizing perinatal complications is well documented. In the absence of CGM, the task is limited by the willingness on the part of the patient to monitor as much as seven times each day and in the cases just reviewed overnight as well. Realistically, this is a daunting task often with inadequate results. In light of the evidence that normal pregnancies are portrayed by tight glycemic control, which has been characterized as 20% lower than that of a normal nonpregnant individual with diurnal glucose levels remaining within a narrow corridor (between 10 mg/dL above and below the median), it is incumbent to find a means to reach this goal. Failing to achieve tight glycemic control increases the risk of LGA and macrosomia, cesarean delivery, shoulder dystocia, fetal malformations, neonatal hypoglycemia, jaundice, and stillbirth.12-13 For women with preexisting diabetes, the American Diabetes Association (ADA) advises achievement of HbA1c levels below 6% prior to pregnancy to attain perinatal risk levels comparable to normal pregnancies.14,15 This may suggest that for such individuals, CGM should start prior to conception. In addition to optimal HbA1c levels, the ADA suggests that pre- and postprandial glucose levels in all pregnancies complicated by diabetes should mimic those found in normal pregnancies. However, in pregnancy, the use of HbA1c is limited.16 The need to have immediate feedback as to the efficacy of treatment and to rapidly identify periods of high risk all but rule out its use. HbA1c does not reflect and cannot detect hypoglycemia. Although it can suggest hyperglycemia and glucose variability, it cannot pinpoint their frequency, duration or contribution to overall glycemic perturbations. While determining an individual’s HbA1c level may be an applicable method of estimating gross glucose levels (e.g., mean glucose level of past three months), it does not present a measure of daily glucose variability.
The cases reviewed confirmed that diurnal glucose patterns during pregnancies uncomplicated by dysglycemia are characterized by 20% lower glucose exposure and variability. Second, maintenance of this narrow range in pregnancy is achievable if the underlying dysglycemia can be detected. Third, continuous glucose surveillance, employing CGM throughout pregnancy, should be a fundamental tool in the management of pregnancy if mimicking normal glycemia is to be achieved.
REFERENCES
1. Ceriello A, Ihnat MA. ‘Glycaemic variability’: a new therapeutic challenge in diabetes and the critical care setting. Diabetic Med. 2010;27(8):862-867.
2. Di Cianni G, Miccoli R, Volpe L, et al. Intermediate metabolism in normal pregnancy and in gestational diabetes. Diabetes Metab Res Rev. 2003;19(4):259-270.
3. HAPO Study Cooperative Research Group, Metzger BE, Lowe LP, Dyer AR, et al. Hyperglycemia and adverse pregnancy outcomes. N Engl J Med. 2008;358(19):1991-2002.
4. Shand AW, Bell JC, McElduff A, et al. Outcomes of pregnancies in women with pre-gestational diabetes mellitus and gestational diabetes mellitus; a population-based study in New South Wales, Australia, 1998-2002. Diabet Med. 2008;25(6): 708-715.
5. Banerjee S, Ghosh US, Banerjee D. Effect of tight glycaemic control on fetal complications in diabetic pregnancies. J Assoc Physicians India. 2004;52:109-113.
6. Herranz L, Pallardo LF, Hillman N, et al. Maternal third trimester hyperglycaemic excursions predict large-for-gestational-age infants in type 1 diabetic pregnancy. Diabetes Res Clin Pract. 2007;75(1):42^6.
7. Mazze R, Yogev Y, Langer O. Measuring glucose exposure and variability using continuous glucose monitoring in normal and abnormal glucose metabolism in pregnancy. J Matern Fetal Neonatal Med. 2012;25(7):1171-1175.
8. Mazze R, Strock E, Wesley D, et al. Characterizing glucose exposure for individuals with normal glucose tolerance using continuous glucose monitoring and ambulatory glucose profile (AGP) analysis. Diabetes Technol Ther. 2008; 10(3): 149-159.
9. Xing D, Kollman C, Beck R, et al. Optimal sampling intervals to assess long-term glycaemic control using continuous glucose monitoring. Diabetes Technol Ther. 2011;13:351-358.
10. Siegmund T, Rad NT, Ritterath C, et al. Longitudinal changes in the continuous glucose profile measured by the CGMS in healthy pregnant women and determination of cut-off values. Eur J Obstet Gynecol Reprod Biol. 2008;139(1):46-52.
11. Riskin-Mashiah S, Damti A, Younes G, Auslander R. Normal fasting plasma glucose levels during pregnancy: a hospital-based study. J Perinat Med. 2011;39(2):209-211.
12. Gonzalez-Quintero VH, Istwan NB, Rhea DJ, et al. The impact of glycemic control on neonatal outcome in singleton pregnancies complicated by gestational diabetes. Diabetes Care. 2007;30(3):467^70.
13. Kerényi Z, Tamas G, Kivimaki M, et al. Maternal glycemia and risk of large-for-gestational-age babies in a population-based screening. Diabetes Care. 2009;32(12):2200-2205.
14. American Diabetes Association. Standards of medical care in diabetes-2010. Diabetes Care. 2010;33(suppl 1):S11-S61.
15. American Diabetes Association. Standards of medical care in diabetes. Diabetes Care. 2011;34(suppl 1):S11-S61.
16. Kerssen A, de Valk HW, Visser GH. Do HbA1c levels and the self-monitoring of blood glucose levels adequately reflect glycemic control during pregnancy in women with type 1 diabetes mellitus? Diabetologia. 2006;49(1):25-28.