
Thaddeus Waters, MD Patrick Catalano, MD
The world isn’t just the way it is. It is how we understand it....
And in understanding something, we bring something to it...
—Yann Martel (Life of Pi)
Key Points
• Normal Pregnancy is characterized by a 40%-50% decrease in peripheral (skeletal muscle) and endogenous (primarily liver) insulin sensitivity; as a result there is a two- to threefold increase in insulin secretion and insulin clearance by 20%-30%
• Gestational diabetes mellitus (GDM) is characterized by inadequate pancreatic Β-cell response for the increased level of insulin resistance present in women with GDM as compared with a matched control group
• Women with GDM have approximately 50% less total insulin secretion in comparison to non-GDM women
INTRODUCTION
Gestational diabetes (GDM) is the most common type of diabetes identified during pregnancy, affecting 3%-7% of all pregnancies.1-3 For any gravida, the natural increase in insulin resistance with subsequent increasing postprandial glucose levels, makes pregnancy a “diabetogenic state.” In a pregnancy not complicated by GDM, the increase in insulin resistance is met by an increase in insulin production to maintain a euglycemic state.4 In contrast, women who develop GDM can have a suboptimal insulin response (a failure of the pancreatic β-cell to compensate for the increasing insulin resistance), a decrease in peripheral and central insulin sensitivity, or a mix of both.5 Although primarily a disorder of glucose metabolism, GDM affects all aspects of maternal nutrient metabolism. However, the basic pathophysiology of GDM can be established by describing the changes that lead to a deviation from the normal glucose homeostasis of pregnancy. This review will explore the metabolic imbalances that characterize GDM, both in terms of the insulin secretion/sensitivity relationship and disturbances in the rhythms of glucose homeostasis.
GLUCOSE HOMEOSTASIS/NORMAL PREGNANCY
Glucose homeostasis involves a complex relationship between blood glucose concentration (G), insulin response (I), peripheral insulin sensitivity (IS), hepatic glucose production (HGP), and insulin clearance (IC). Glucose is absorbed via sodium-dependent transporters on the apical membrane of the intestine against the normal concentration gradient. Subsequent efflux is facilitated by diffusion transporters on the basement membrane of the epithelium.
Both the density of the transporters and the sodium gradient that drives the uptake regulate the transport of glucose. Within the fetal compartment, glucose concentration is a result of placental facilitated diffusion transporters solely and is then regulated by the concentration gradient and fetal metabolism.6
Facilitated-diffusion glucose transporters (GLUT) consist of several types that vary in their kinetic properties, functional roles and localization, with at least five subtypes important within pregnancy. GLUT1 is present in placenta, muscle, adipose tissue, brain, and endothelium and is involved in cellular metabolism. Present within the syncytiotrophoblast and on the microvillous and basal membranes, GLUTls are the primary transporter of glucose to the fetus.7 GLUT2 is present on pancreatic P-cells, liver, small intestine, and renal proximal tubules and acts as a glucose sensor and fructose transporter. GLUT3 is present in neural tissue and the small intestines and acts as a scavenger under conditions in which G is low and in high demand due to increased metabolism. GLUT4 is expressed only in insulin-responsive tissue such as muscle, heart, and adipose tissue. Finally, GLUT5 is a fructose transporter found in the small intestine, brain, muscle, and adipose tissue.8,9
Peripheral glucose metabolism primarily takes place within skeletal muscles requiring the GLUT4 transporter. Studies in human skeletal muscle and adipose tissue have demonstrated defects in the post-receptor insulin-signaling cascade during pregnancy. Friedman et al. showed that women in late pregnancy have reduced insulin receptor substrate-1 (IRS-1) concentrations compared with those of nonpregnant women.10 Downregulation of the IRS-1 protein closely parallels insulin’s decreased ability to induce additional steps in the insulin-signaling cascade, which normally result in the transporter (GLUT-4) arriving at the cell surface to allow glucose to enter the cell. During late pregnancy in women with GDM, in addition to decreased IRS-1 concentrations, the insulin receptor-β (i.e., component of the insulin receptor within the cell rather than on the cell surface) has a decreased ability to undergo tyrosine phosphorylation.10 This is an important step in the action of insulin after it has bound to the insulin receptor on the cell surface. This additional defect in the insulin-signaling cascade is not found in pregnant or nonpregnant women with normal glucose tolerance and results in a 25% lower glucose transport activity (Figure 21-1).
Once glucose is absorbed, insulin secretion increases to return the G to normal levels (Figure 21-1). It is apparent with a glucose load that G and I oscillate back and forth to achieve a homeostatic level. The time that glucose rises before returning to fasting levels reflects the homeostatic control of the insulin- glucose interaction, the responsiveness, and output of the pancreatic β-cells, and can distinguish normal from the abnormal responses typical of diabetes in and out of pregnancy.11 The relationship between the amplitude and time taken for the oscillations to disappear (dampening time) is indicative of the efficiency of the control system and the insulin resistance of the tissues. In early pregnancy, maternal insulin requirements increase over the prepregnancy state (Figure 21-3), this appears to be independent of the increase or decrease in insulin sensitivity. However as pregnancy advances in the second and third trimesters, there is a compensatory increase in insulin secretion with an increasing glucose load. Further variations in the maternal insulin response are observed according to the degree of maternal obesity.12 For women who are lean prior to pregnancy, the mean insulin concentration and overall insulin response are more pronounced compared to obese controls. Additionally, for obese subjects, there is an increase in insulin clearance later in pregnancy with an observed increase in endogenous basal glucose concentration.13,14 The observation by Catalano et al. of an increase in fasting HGP in nondiabetic lean subjects, despite the anticipated increase in fasting insulin concentration, suggests that central hepatic insulin sensitivity is diminished as pregnancy advances. For obese subjects, hepatic insulin sensitivity was reduced further because of less suppression of HGP during insulin infusion.

Bergman postulated that in normal individuals, the sensitivitysecretion relationship could most efficiently be expressed as a rectangular hyperbola.15 In such a hyperbolic representation, the product of insulin sensitivity and insulin secretory response (ISR) would equal a constant, the disposition index (DI). Simply stated, the DI is a measure of the ability of the β-cells to compensate for insulin resistance. Others have confirmed this hyperbolic relationship.4,16 The DI then provides a quantitative and convenient approach to studying insulin dynamics. This fixed relationship between insulin response and insulin resistance by Bergman has also been observed in pregnancy.17 The Bergman minimal model employs mathematical modeling to derive an estimate of insulin-mediated glucose disposal from a frequently sampled intravenous glucose tolerance test (FSIGT). The time course of plasma glucose is fitted using nonlinear least-squares methods with plasma insulin values as a known input to the system.18 Similarly, the euglycemic-hyperinsulinemic clamp uses the glucose infusion rate required to maintain euglycemia during a constant insulin infusion to estimate insulin resistance.19 The modified FSIGT has been shown to have a strong positive correlation (r = 0.89) with the clamp method.20 Others have shown insulin sensitivity values, calculated from the reduced sampling insulin-modified protocol, to correlate significantly with those obtained with the “clamp” across the spectrum of glucose tolerance.21 Compared to the clamp technique, other methods estimating insulin sensitivity have been described including the ISOGTT, ISqUICK, and ISHOMA. Kirwan et al. validated these indices in pregnant women with normal glucose tolerance and found significant correlations between ISCLAMP and ISOGTT (r2 = 0.74), which was noted to be superior to the ISqUICK and ISHOMA They further evaluated ISCLAMP and ISOGTT throughout pregnancy. The prepregnancy period revealed a correlation of r2 = 0.63; early pregnancy r2 = 0.80; late pregnancy r2 = 0.64. The data suggest that estimates of insulin sensitivity from the ISOGTT during pregnancy are significantly more accurate than those obtained from fasting glucose and insulin values.22

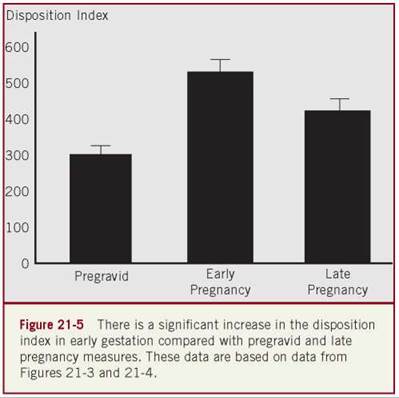
First reported by Spellacy and Goetz, there is a normal increase of insulin resistance near mid pregnancy, which continues through the third trimester. Compared to the prepregnancy state (Figure 21-4), there is a paradoxical initial improvement in insulin sensitivity early in pregnancy with a significant reduction in later pregnancy.23,24 There is also an observed difference in the DI in early pregnancy as compared with either pregravid or late gestation (Figure 21-5). Hence, the increase in insulin sensitivity coupled with an increase in insulin response in early gestation suggests an independent metabolic adaptation of both Β-cell function and peripheral insulin resistance in early gestation.

The initial improvement in insulin sensitivity early in pregnancy with a marked reduction later in gestation is true for women with and without GDM. When evaluating lean and obsess women, Catalano et al. noted a 56% increase of insulin resistance in lean women and a 47% increase in obese gravidas using the euglycemic-hyper- insulemic clamp method.12,25 Several etiologies of the progressive insulin resistance of pregnancy have been described. Both increasing maternal adiposity and the insulin-desensitizing effects of the hormonal products of the placenta have historically been linked to the diminished insulin sensitivity of pregnancy (such as human placental lactogen, progesterone, and estrogen). This is supported by the observation that insulin sensitivity rapidly improves after delivery. More recent evidence supports other mediators of insulin resistance, such as leptin, tumor necrosis factor-а (TNF-а), and resistin.26 Catalano et al.27 demonstrated increases in insulin resistance that correlated with TNF-a. TNF-а has also been shown to have a positive correlation with both body mass index (BMI) and hyperinsulinemia,28 whereas infusion of TNF-а decreases insulin sensitivity in skeletal muscle cells. In a regression analysis including leptin, HPL, cortisol, human chorionic gonadotropin, estradiol, progesterone, and prolactin, TNF-а was the strongest predictor of insulin sensitivity.29 In addition to other cytokines, the placenta produces TNF-а, with the majority transported into the maternal circulations. Other factors, such as circulating free fatty acids and other inflammatory mediators (such as C-reactive protein [CRP] and interlukin-6) may also contribute to the insulin resistance of pregnancy, particularly for obese women.30 More recently, using samples selected from the Hyperglycemia and Adverse Pregnancy Outcome (HAPO) trial, Lowe et al. observed that levels of inflammatory mediators, such as adeponectin, plasminogen activator inhibitor type 1 (PAI-1) and CRP varied in a constant manor across the spectrum of increasing levels of maternal glucose.31
GDM
Simply stated, GDM is a form of hyperglycemia that results from an insulin supply that is inadequate to maintain glucose homeostasis. The majority of women with GDM appear to have Β-cell dysfunction. However, the etiology of inadequate Β-cell responses diverse and includes autoimmune related destruction, monogenic causes, and in the setting of diminished insulin sensitivity.
Outside of pregnancy, the two major classifications of diabetes are type 1 and type 2. Type 1 DM results from autoimmune destruction of pancreatic P-cell, and accounts for 5%-10% of diabetes in the general population.32 Initial investigations reported 10%-35% of GDM patients to have circulating antibodies against pancreatic islet cells.30,33-36 This led to the opinion that GDM may be within the spectrum of type 1 DM. However, subsequent investigations using specific monoclonal antibodies noted only 1%-2% of GDM women to have circulating antibodies.36 For this small subset of patients, the abnormal glucose homeostasis observed in pregnancy results from inadequate insulin secretion from autoimmune damage of β-cells and likely represents previously undiagnosed or evolving type 1 DM.
Monogenic diabetes refers to the genetic causes of diabetes and includes two forms. The most common is maturity-onset diabetes of youth (MODY), an autosomal dominant disease with associated mutations in the glucokinase gene. Other less common genetic mutations are noted in mitochondrial DNA, often observed with other clinical syndromes. MODY is characterized by abnormalities of Β-cells mass or function with two discrete subtypes: MODY1 and MODY2.37 For both subtypes, onset occurs in young adulthood and patients tend not to be obese or insulin resistant. Mutations that are associated with MODY subtypes have been reported in women with GDM including mutations in genes coding for glucokinase (MODY2), hepatocyte nuclear factor 1-а (MODY3), and insulin promotor factor 1 (MODY4).38-42 In general, MODY mutations account for less than 10% of GDM subjects, and likely represent a subset of those women with undiagnosed pre-GDM.
For the vast majority of patient diagnosed with GDM, the pathophysiology is far more similar to type 2 DM with diminished skeletal muscle and hepatic sensitivity to insulin, and inadequate β-cells response to an increasing glucose load. Similar to women without GDM, there is a natural decrease in insulin sensitivity observed for GDM subjects over pregnancy. For women with GDM, the observed increase in insulin resistance is greater when compared to women with normal glucose testing and there is a diminished response to insulin for peripheral glucose uptake and suppression of HGP.12,30 Additionally, the observed insulin response to a given glucose load is muted for GDM patients, particularly in later pregnancy. Postpartum, women with GDM have a persistent insulin resistance and diminished insulin response, providing further support that these subjects are within the spectrum of type 2 DM.


Several authors have used the Bergman minimal model to determine variations in the DI and insulin sensitivity for subjects with and without GDM in both early and late pregnancy. In this model,20 for nonpregnant glucose-tolerant women, a hyperbolic relationship between insulin sensitivity (SI) and insulin secretion, for both first (Ф1) and second phase (Ф2) insulin response is observed. When comparing pregnant (late gestation) and nonpregnant women with normal glucose tolerance testing, Ф1 was not related to SI (Figure 21-6) whereas Ф2 was (Figure 21-7), however the calculated DI was constant for these women (DI = 7.08), with a shift toward a decreased SI during pregnancy. The loss of the hyperbolic relationship between SI and Ф1 for 75% of gravidas was felt to be due, at least in part, to the effect of the fetal compartment on lowering fasting glucose in pregnancy, suppressing insulin storage and initial release. When comparing women with and without GDM, further alterations in glucose metabolism can be found.43 SI is significantly decreased in obese GDM gravidas compared to those with normal glucose tolerance (NGT), whereas lean GDM subjects have a lower Ф1.12,23,25,44 In studies that used a modified FSIGT over the late second and early third trimesters prior to treatment, both lean and obese gravidas showed a decreased capacity to secrete insulin even when adjusted for the level of glycemia. Using a graphic representation to express the DI (Figure 21-8), both groups demonstrated a decrease in Ф1, well below the 95% CI for normal pregnancy. However, 44% of lean and 22% of obese gravidas measured at or above the normal curve, consistent with the incidence of metabolic abnormalities found postpartum45-48 and the incidence of type 2 DM in former lean and obese GDM subjects.49
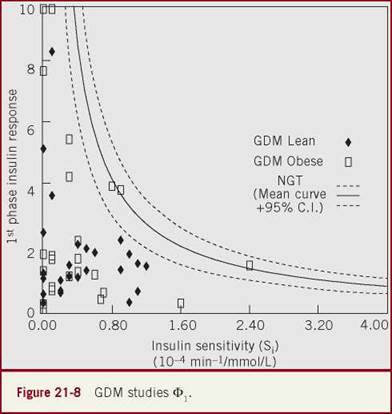
Ryan et al.23 studied normal pregnant women at 28 weeks gestation (n = 5) and GDM at 36 weeks (n = 5), all with the eug- lycemic clamp technique. They found that SI was lower in three of the five GDM women. Their patients were obese and had elevated fasting levels (>130 mg/dL) that may have indicated overt diabetes. They did find that insulin infusion approached normal levels when good glycemic control was obtained in two subjects. Catalano et al.25 studied nonobese GDM (n = 8) prior to pregnancy, at 12-14 weeks, and 34-36 weeks gestation using the euglycemic clamp. They found mildly increased sensitivity early in pregnancy with a large fall by late gestation. GDM gravidas increased Ф1 as did NGT, but not in proportion to the decrease in SI; there was no difference from normal levels of Ф2. Kautzky-Willer et al.45 studied normal lean pregnant women (n = 9) and lean GDM (n = 10) using an unmodified FSIGT. They studied patients between 26 and 31 weeks gestation, prior to institution of therapy. They found SI 50% lower in GDM. Both Ф1 and Ф2 were reduced compared to NGT in the study. Berkus et al.43 studied a larger group of GDM subjects, matched for BMI and gestational age (26-32 weeks), and prior to any therapy. An insulin-modified FSIGT was used because of the blunted insulin release in pregnancy to assure adequate insulin for the calculation of resistance. They were able to demonstrate a combined defect in insulin release and sensitivity that characterizes both lean and obese GDM women (Figure 21-8). Ф2 was similar to NGT except in subjects likely to have overt diabetes (Figure 21-9).
As pregnancy advances, there is a decrease in the observed fasting glucose concentration for women with GDM. This is likely due to the increase in fasting insulin production observed for lean and obese gravidas with GDM. Paradoxically in late pregnancy, glucose production (particularly HGP) increases in women with GDM.12,14 This suggests an impaired hepatic sensitivity to progressively increasing insulin levels. Studies of human skeletal muscle and adipose tissues have observed signaling defects of insulin-sensitive receptors, including GLUT4 transporter that support an impaired tissue response to increasing insulin concentrations. For any pregnant women, there are observed changes within the insulin-signaling cascade for GLUT4, with additional abnormalities noted for women with GDM. As noted earlier, all pregnant women have a decreased expression of IRS-1 within the GLUT transporter system. The decreased expression of IRS-1 is matched by the observed progressive decreased ability of insulin to stimulate the normal signaling of GLUT4 to approach the cellular membrane and initiate glucose uptake. For women with GDM, there is a marked decrease of insulin-stimulated phosphorylation of the receptor, which results in an observed 25% reduction in glucose transport activity. Therefore, GDM does not appear to result from an abnormality of the insulin receptor (GLUT4) within skeletal muscles.50 Rather women with GDM have alterations of the insulin-signaling pathway,51-54 subsequent abnormal location of the GLUT4 transporter,55 reduced expression of PPARy,51 increased expression of the membrane glycoprotein PC-1,53 and reduced insulin-mediated glucose transport,54,55 all which may contribute to abnormal glucose control.
Little data is known about the genetics of GDM. For women with GDM, variants in allele frequency have been observed within genes coding for islet-specific promoter of glucokinase,54 calpin-10,56 the sulfonylurea receptor 1,57 and the B3 adrenoreceptor. Radaelli et al. reported that women with GDM, compared to women with type 1 DM, had 49 alterations in gene expression at key steps of energy metabolism within the placenta. The majority of those alterations were observed in pathways related to lipid metabolism (67%) and glucose pathways (9%). On the basis of this data, the authors concluded that genes that code for fetoplacental lipid metabolism are increased with GDM and may be essential in the development of observed clinical outcomes such as fetal macrosomia.58
POSTPARTUM
As noted earlier, GDM likely represents a continuum within the spectrum of disease that ultimately manifests as type 2 DM. After delivery, when the placental mediators of insulin resistance subside, women who were diagnosed with GDM continue to have increased insulin resistance compared to normal controls (Figure 21-4). This supports the hypothesis that women with GDM have a chronic component of insulin resistance.45-48,50,59,60 Therefore, it is not surprising that long-term follow-up studies of women with GDM showed that the incidence of eventual overt diabetes was 47% in obese women and 26% in women of normal weight.61 The likely contributors to this chronic insulin resistance include common risk factors for type 2 DM including obesity, weight gain, and age in addition to biochemical mediators such as leptin,62 TNF-a,63 and CRP.64 Often, the observed hyperglycemia of pregnancy is limited at first to only pregnancy, with up to 90% women having normal glucose testing immediately postpartum.65 However, over time, the majority of women (70%) diagnosed with GDM will have a positive test for overt diabetes.66
Homko et al.59 found that women with GDM during late pregnancy had a large Β-cell defect with their first phase insulin response decreased compared to controls. Following delivery, ISR was decreased 40% from levels during pregnancy and not significantly lower than controls. However, this degree of insulin response was not normal as women with previous GDM were more resistant than controls. Subsequent investigations of postpartum changes in insulin sensitivity for patients with GDM have been performed.67 Berkus et al. reported on 32 previous GDM patients that underwent a repeat FSIGT three months postpartum, all of whom had a normal 75 g 2-hour oral glucose tolerance test (OGTT) by WHO criteria. Glucose values were greater for obese (BMI > 29) versus lean and the area under the curve (AUC) glucose was also greater for previous GDM versus NGT controls. Plotting out the DI for the postpartum group (Figure 21-10) demonstrated that 69% lean and 86% obese subjects had DI below the normal curve. Thus, they were unable to release the appropriate insulin for their degree of insulin sensitivity. However, 80% were able to secrete adequate amounts of insulin in the second phase for the degree of insulin resistance as well as the increased glucose concentrations (Figure 21-11). This pattern is characteristic of type 2 DM and is consistent with the epidemiologic evidence of a high incidence of subsequent diabetes in former GDM women.


Longitudinal studies of the pathophysiology of overt diabetes that develops subsequent to GDM reveal some interesting data. Several factors have been observed to contribute to progressive Β-cell underperformance including weight gain, progressive hyperglycemia, and additional pregnancies.68,69 For most women, Β-cell function can continue to preserve glucose homeostasis until the DI becomes significantly diminished (less than 15% of normal). After this threshold is breached, additional decreases in the DI manifest as progressively poor glucose control. Interestingly, treatment at this stage of disease with insulin therapy, prior to the development of true diabetes, results in both a downregulation of insulin secretion70 and a preservation of β-cell function with a reported decrease in the risk of diabetes.71
SUMMARY
The alterations in maternal metabolism resulting in the development of GDM are but a perturbation of the normal metabolic physiologic changes during pregnancy. The normal increases in insulin response in early pregnancy are necessary for the anabolic changes in early pregnancy, that is, adipose tissue accretion is necessary for the caloric demands of the third trimester and lactation. The increased insulin resistance observed in late gestation allows for nutrient transfer, not only glucose but lipids and amino acids as well, required for fetal growth and development. For the vast majority of GDM observed today, the increases in maternal obesity, malnutrition, and lack of physical activity result in a poor metabolic profile prior to conception. As the metabolic changes in pregnancy occur regardless of the maternal pregravid metabolic condition, it is not surprising that the number of women with GDM continues to increase, regardless of the criteria used in the diagnosis. If there is a silver lining in this metabolic cloud, it is that the diagnosis of GDM provides an opportunity to institute prevention early in the course of type 2 DM disease progression. Lifestyle intervention as reported in the Diabetes Prevention Programs72 demonstrate that prevention or at least delay of type 2 DM is possible for this high-risk population.
REFERENCES
1. King H. Epidemiology of glucose intolerance and gestational diabetes in women of childbearing age. Diabetes. 1998;21(suppl 2): 9-13.
2. Engelgau NM, Herman WH, Smith PJ, et al. The epidemiology of diabetes and pregnancy in the US. Diabetes Care. 1998;18:1029-1033.
3. Naylor CD, Sermer M, Chen E, Sykora K. Cesarean delivery in relation to birth weight and gestational glucose tolerance: pathophysiology or practice style? JAMA. 1996;275:1165-1170.
4. Kahn SE, Prigeon RL, McCulloch DK, et al. Quantification of the relationship between insulin sensitivity and β-cell function in human subjects: evidence for a hyperbolic function. Diabetes. 1993;42:1663-1672.
5. Kuhl C. Insulin secretion and insulin resistance in pregnancy and GDM: implications for diagnosis and management. Diabetes. 1991;40(suppl 2):18-24.
6. Marconi AM, Davoli E, Citin I, et al. Impact of conceptus mass on glucose disposal rate in pregnant women. Am J Physiol. 1993;264 (4 pt 1):E514-E518.
7. Barros LF, Yudilevich DL, Jarvis SM, et al. Quantitation and immunolocalization of glucose transporters in the human placenta. Placenta. 1995;16:623.
8. Muekler M. Facilitative glucose transporters. Eur J Biochem. 1994;219:713-725.
9. McGowan KM, Long SD, Pekala PH. Glucose transporter gene expression: regulation of transcription and mRNA stability. Pharmacol Ther. 1995;66:465-505.
10. Friedman JE, Ishizuka T, Shao J, et al. Impaired glucose transport and insulin receptor tyrosine phosphorylation in skeletal muscle from obese women with gestational diabetes. Diabetes. 1999;49:1807-1814.
11. Ackerman E, Rosevear JW, McGuckin WF. Q mathematical model of glucose tolerance test. Phys Med Biol. 1964;9:203-213.
12. Catalano PM, Huston L, Amini SB, et al. Longitudinal changes in glucose metabolism during pregnancy in obese women with normal glucose tolerance and gestational diabetes. Am J Obstet Gynecol. 1999;180:903-916.
13. Catalano PM, Drago NM, Amini SB. Longitudinal changes in pancreatic b-cell function and metabolic clearance rate of insulin in pregnant women with normal and abnormal glucose tolerance. Diabetes Care. 1998;21:403.
14. Catalano PM, Tyzbir ED, Wolfe RR, et al. Longitudinal changes in basal hepatic glucose production and suppression during insulin infusion in normal pregnant women. Am J Obstet Gynecol. 1992;167:913.
15. Bergman RN, Phillips LS, Cobelli C. Physiologic evaluation of factors controlling glucose tolerance in man: measurement of insulin sensitivity and B-cell glucose sensitivity from the response to intravenous glucose. J Clin Invest. 1981;68:1456-1467.
16. Wagenknecht LE, Meyer EJ, Rewers M, et al. The Insulin Resistance Atherosclerosis Study (IRAS): objectives, design, and recruitments results. Ann Epidemiol. 1996;5:464-472.
17. Buchanan TA. Pancreatic B-cell defects in gestational diabetes: implications for the pathogenesis and prevention of type 2 diabetes. J Clin Endocrinol Metab. 2001;86:989-993.
18. Pacini G, Bergman RN. MINMOD: a computer program to calculate insulin sensitivity and pancreatic responsivity from a frequently sampled intravenous glucose tolerance test. Count Methods Program Biomed. 1986;23:113-122.
19. DeFronzo RA, Tobin JD, Anders R. Glucose clamp technique: a method for quantifying insulin secretion and resistance. Am J Physiol. 1979;237:E214-E223.
20. Bergman RN, Prager R, Volund A, et al. Equivalence of the insulin sensitivity index in man derived by the minimal model method and the euglycemic glucose clamp. J Clin Invest. 1987;79:790-800.
21. Saad MF, Anderson RL, Laws A, et al. A comparison between the minimal model and the glucose clamp in the assessment of insulin sensitivity across the spectrum of glucose tolerance. Diabetes. 1994;43:1114-1121.
22. Kirwan JP, Huston-Presley L, Kalhan SC, et al. Clinically useful estimates of insulin sensitivity during pregnancy. Diabetes Care. 2001;24:1602-1607.
23. Ryan EA, O’Sullivan MJ, Skyler JS. Insulin action during pregnancy: studies with the euglycemic clamp technique. Diabetes. 1985;34:380-389.
24. Buchanan TZ, Metzer BE, Frienkel N, et al. Insulin sensitivity and β-cell responsiveness to glucose during late pregnancy in lean and moderately obese women with normal glucose tolerance or mild gestational diabetes. Am J Obstet Gynecol. 1990;162:1008-1014.
25. Catalano PM, Tyzbir ED, Roman NM, et al. Longitudinal changes in insulin release and insulin resistance in nonobese pregnant women. Am J Obstet Gynecol. 1992;165:1667-1672.
26. Lang C, Dobrescu C, Bagby C. Tumor necrosis factor impairs insulin action on peripheral glucose disposal and hepatic glucose output. Endocrinology. 1992;130:43-48.
27. Catalano P, Highman T, Huston L, et al. Relationship between reproductive hormones/TNF-a and longitudinal changes in insulin sensitivity during gestation. Diabetes. 1996;45(suppl 2):175a.
28. Hotamisligil GS, Spiegelman BM. Tumor necrosis factor-a: a key component of the needs spaceobesity-diabetes link. Diabetes. 1944;43:1271-1278.
29. Kirwan JP, Haugel-du Mouzon S, Lepercq J, et al. TNF-a is a predictor of insulin resistance in human pregnancy. Diabetes. 2002;51:2207.
30. Xiang AH, Peters RH, Trigo E, et al. Multiple metabolic defects during late pregnancy in women at high risk for type 2 diabetes. Diabetes. 1999;48:848-854.
31. Lowe LP, Metzger BE, Lowe WL, et al. Inflammatory mediators and glucose in pregnancy: results from a subset of the Hyperglycemia and Adverse Pregnancy Outcome (HAPO) Study. J Clin Endocrinol Metab. 2010;95:5427-5434.
32. American Diabetes Association. Diagnosis and classification of diabetes mellitus. Diabetes Care. 2004;27(suppl 1):S5-S10.
33. Petersen JS, Dyrberg T, Damm P, et al. GAD65 autoantibodies in women with gestational or insulin dependent diabetes mellitus diagnosed during pregnancy. Diabetologia. 1996;39:1329-1333.
34. Weng J, Ekelund M, Lehto M, et al. Screening for MODY mutations, GAD antibodies, and type 1 diabetes-associated HLA genotypes in women with gestational diabetes mellitus. Diabetes Care. 2002;25:68-71.
35. Mauricio D, Corcoy RM, Codina M, et al. Islet cell antibodies identify a subset of gestational diabetic women with higher risk of developing diabetes shortly after pregnancy. Diab Nutr Metab. 1992;5:237-241.
36. Catalano PM, Tyzbir ED, Sims EAH. Incidence and significance of islet cell antibodies in women with previous gestational diabetes. Diabetes Care. 1990;13:478^82.
37. Fajans SS, Bell GI, Polonsky KS. Molecular mechanisms and clinical patho-physiology of maturity-onset diabetes of the young. N Engl J Med. 2001;345:971-980.
38. Weng J, Ekelund M, Lehto M, et al. Screening for MODY mutations, GAD antibodies, and type 1 diabetes-associated HLA genotypes in women with gestational diabetes mellitus. Diabetes Care. 2002;25:68-71.
39. Kousta E, Ellard S, Allen LI, et al. Glucokinase mutations in a phenotypically selected multiethnic group of women with a history of gestational diabetes. Diabet Med. 2001;18:683-684.
40. Ellard S, et al. A high prevalence of glucokinase mutations in gestational diabetic subjects selected by clinical criteria. Diabetologia. 2000;43:250-253.
41. Saker PJ, Hattersley AT, Barrow B, et al. High prevalence of a missense mutation of the glucokinase gene in gestational diabetic patients due to a founder-effect in a local population. Diabetologia. 1996;39:1325-1328.
42. Chen Y, Liao WX, Roy AC, et al. Mitochondrial gene mutations in gestational diabetes mellitus. Diabetes Res Clin Pract. 2000;48:29-35.
43. Berkus MD, Langer O, Siler-Khodr TM. Obesity affects insulin resistance in GDM in late pregnancy. Am J Obstet Gynecol. 1998;176:S181.
44. Buchanan TA, Metzger BE, Freinkel N, et al. Insulin sensitivity and β-cell responsiveness to glucose during late pregnancy in lean and moderately obese women with normal glucose tolerance or mild gestational diabetes. Am J Obstet Gynecol. 1990;162:1008-1014.
45. Kautzky-Willer A, Prager R, Waldhausl W, et al. Pronounced insulin resistance and inadequate β-cell secretion characterize lean gestational diabetes during and after pregnancy. Diabetes Care. 1997;20:1717-1723.
46. Ward WK, Johnston CLW, Beard JC, et al. Insulin resistance and impaired insulin secretion in subjects with histories of gestational diabetes mellitus. Diabetes. 1985;34:861-869.
47. Catalano PM, Bernstein IM, Wolfe RR, et al. Subclinical abnormalities of glucose metabolism in subjects with previous gestational diabetes. Am J Obstet Gynecol. 1986;155:1255-1262.
48. Ryan EA, Imes S, Liu D, et al. Defects in insulin secretion and action in women with a history of gestational diabetes. Diabetes. 1995;44:506-512.
49. O’Sullivan JB. Body weight and subsequent diabetes mellitus. JAMA. 1982;248:949-952.
50. Damm P, Handberg A, Kühl C, et al. Insulin receptor binding and tyrosine kinase activity in skeletal muscle from normal pregnant women and women with gestational diabetes. Obstet Gynecol. 1993;82:251-259.
51. Catalano PM, Nizielski SE, Shao J, et al. Downregulated IRS-1 and PPARgamma in obese women with gestational diabetes: relationship to FFA during pregnancy. Am J Physiol Endocrinol Metab. 2002;282:E522-E533.
52. Shao J, Yamashita H, Qiao L, et al. Phosphatidylinositol 3-kinase redistribution is associated with skeletal muscle insulin resistance in gestational diabetes mellitus. Diabetes. 2002;51:19-29.
53. Shao J, Catalano PM, Yamashita H, et al. Decreased insulin receptor tyrosine kinase activity and plasma cell membrane glycoprotein-1 over expression in skeletal muscle from obese women with gestational diabetes (GDM): evidence for increased serine/ threonine phosphorylation in pregnancy and GDM. Diabetes. 2000;49:603-610.
54. Friedman JE, Ishizuka T, Shao J, et al. Impaired glucose transport and insulin receptor tyrosine phosphorylation in skeletal muscle from obese women with gestational diabetes. Diabetes. 1999;48:1807-1814.
55. Garvey WT, Maianu L, Zhu JH, et al. Multiple defects in the adipocyte glucose transport system cause cellular insulin resistance in gestational diabetes. Diabetes. 1993;42:1773-1785.
56. Leipold H, Knofler M, Gruber C, et al. Calpain-10 haplotype combination and association with gestational diabetes mellitus. Obstet Gynecol. 2004;103:1235-1240.
57. Rissanen J, Markkanen A, Kàrkkàinen P, et al. Sulfonylurea receptor 1 gene variants are associated with gestational diabetes and type 2 diabetes but not with altered secretion of insulin. Diabetes Care. 2000;23:70-73.
58. Radaelli T, Lepercq J, Varastehpour A, et al. Differential regulation of genes for fetoplacental lipid pathways in pregnancy with gestational diabetes and type 1 diabetes mellitus. Am J Obstet Gynecol. 2009;201:209.e1-209.e10.
59. Homko C, Sivan E, Xinhua C, et al. Insulin secretion during and after pregnancy with gestational diabetes mellitus. J Clin Endocrinol Metab. 2001;86:568-573.
60. Osei K, Gaillard TR, Schuster DP. History of gestational diabetes leads to distinct metabolic alterations in nondiabetic African- American women with a parental history of type 2 diabetes. Diabetes Care. 1998;21:1250-1257.
61. O’Sullivan JB. Gestational diabetes and its significance. AdvMetab Disord. 1970;1(suppl 1):339.
62. Kautzky-Willer A, Pacini G, Tura A, et al. Increased plasma leptin in gestational diabetes. Diabetologia. 2001;44:164-172.
63. Winkler G, Cseh K, Baranyi E, et al. Tumor necrosis factor system and insulin resistance in gestational diabetes. Diabetes Res Clin Pract. 2002;56:93-99.
64. Retnakaran R, Hanley AJ, Raif N, et al. C-reactive protein and gestational diabetes: the central role of maternal obesity. J Clin Endocrinol Metab. 2003;88:3507-3512.
65. Kjos SL, Buchanan TA, Greenspoon JS, et al. Gestational diabetes mellitus: the prevalence of glucose intolerance and diabetes mellitus in the first two months postpartum. Am J Obstet Gynecol. 1990;163:93-98.
66. Kim C, Newton KM, Knopp RH. Gestational diabetes and the incidence of type 2 diabetes. Diabetes Care. 2002;25:1862-1868.
67. Berkus MD, Langer O, Siler-Khodr TM, et al. Insulin secretion and sensitivity postpartum. J Soc Gynecol Invest. 1996;3:295A.
68. Peters RK, Kjos SL, Xiang A, Buchanan TA. Long-term diabetogenic effect of a single pregnancy in women with prior gestational diabetes mellitus. Lancet. 1996;347:227-230.
69. Buchanan TA, et al. Changes in insulin secretion and sensitivity during the development of type 2 diabetes after gestational diabetes in Hispanic women. Diabetes. 2003;52(suppl. 1):A34.
70. Buchanan TA, Xiang AH, Peters RK, et al. Response of pancreatic B-cells to improved insulin sensitivity in women at high risk for type 2 diabetes. Diabetes. 2000;49:782-788.
71. Buchanan TA, Xiang AH, Peters RK, et al. Preservation of pancreatic B-cell function and prevention of type 2 diabetes by pharmacological treatment of insulin resistance in high-risk hispanic women. Diabetes. 2002;51:2769-2803.
72. Ratner RE, Christophi CA, Metzger BE, et al. Prevention of diabetes in women with a history of gestational diabetes: effects of metformin and lifestyle interventions. J Clin Endocrinol Metab. 2008;93:4774-4779.