Peter A. Mossey
Julian Little
Cleft lip with or without cleft palate (CL/P) and isolated cleft palate (CP) are serious birth defects, which on a worldwide level affect approximately 1 in every 600 newborn babies. This means that assuming a global birth rate of 15,000 children per hour (United States Bureau of the Census, http://www.census.gov/ipc/www/ibdnew.html, 2001), a child with a cleft is born somewhere in the world every 2.5 min. From birth to maturity, children with oral clefts (OCs) undergo multidisciplinary surgical and nonsurgical treatment with considerable disruption to their lives and often adverse psychological consequences to themselves and their families.
Efforts over the years have been made to record the frequency of birth defects, and accurate data on epidemiology are important for documenting the burden in relation to the planning of public health services. They also form the basis for research into causes. The eventual objective must be, from both scientific and humanitarian viewpoints, to advance the knowledge and understanding of causative factors and to institute primary preventive measures. Among the barriers to achieving this objective are (1) the heterogeneity of OCs, (2) the lack of standard criteria for the collection of data, and (3) the lack of and/or failure to apply an internationally comparable OC classification.
Search Strategy for Identification of Relevant Studies
The search strategy began with a free text search of Medline (from 1966, http://www.ncbi.nlm.nih.gov/PubMed/) and EMBASE (from 1989, http://www.silverplatter.com/catalog/embx.htm) and OVID (http://www.ovid.com/sales/medical.cfm), which incorporates Medline, BIDS and a number of university medical databases. The PubMed database was searched with the key words cleft, lip, palate, and incidence, producing 377 records ranked by date. EMBASE was searched using cleft lip or cleft palate combined with prevalence or incidence, yielding a total of 239 references. OVID was searched using cleft lip, cleft palate, and incidence or prevalence, producing a total of 755 references dating back to 1965. In addition, selected literature was hand-searched, including the Cleft Palate Journal dating back to 1960, and references were identified in earlier work on neural tube defects (Elwood et al., 1992). Where available, the following information was also noted: gender distribution, ethnic origin of the parents, and whether the figures included stillbirths and induced abortions. This hand search concentrated on reports from more obscure journals and from various parts of the world, for which the above data sets may not contain complete records. This included the Indian subcontinent, Africa, Asia, and the Middle East. In all searches, there was no restriction on language and original papers were sought. For a small percentage of the literature, only abstracts were reviewed. Bibliographies and review articles from the literature obtained in the hand search enabled identification of any missed articles. The searches are supplemented by EUROCAT (http://www.iph.fgov.be/eurocat/eurocat.htm) and ICBDMS (http://www.icbd.org) reports, in particular for examining time trends.
Among the minimum data required for eligibility were the following:
· Year of publication, reference population, and sample size
· Subdivision into cleft subgroups
· Type of pregnancy outcome included, e.g., live births, stillbirths, induced abortions
Other issues affecting comparison of studies, e.g., ascertainment methods, association of abnormalities or syndromes, family history, were noted but not used as criteria for exclusion.
Methodological Issues Relevant to the Data Presented
Descriptive Epidemiology
The completeness of ascertainment may differ between countries, depending on the number and type of sources of ascertainment, the type of pregnancy outcome (live births, terminations, stillbirths), and the recognition of syndromic individuals. These issues can considerably affect the comparability of such data (McMahon and Pugh, 1970; Leek, 1983). Epidemiological data were derived from OC registries or surgical records, which may be different from the actual number of affected OC individuals. Temporal trends in the prevalence at birth of OCs exist, which can in part be explained by the differing levels of ascertainment within countries as they develop.
Another critical requirement is that the observer defines precisely the population in which the frequency of malformation is measured. A major issue is whether one reports or estimates rates in all recognized conceptuses, all births, or all live births. The term births is somewhat ambiguous because it (usually) included stillbirths, which does not have a uniform definition. In summarizing the data, we have considered issues such as (1) live births vs. stillbirths, (2) associated malformations, and (3) particular factors contributing to the prevalence of isolated CP.
Live Births vs. Stillbirths
The proportion of serious malformations is higher in stillbirths than in live births, so the inclusion of stillbirths tends to elevate the birth prevalence or incidence rates over those derived if only live births are considered. Similarly, inclusion of data on miscarriages and abortions, i.e., losses earlier in gestation, may increase rates over those found if only live births and stillbirths are analyzed.
Vanderas (1987) examined the problem of inclusion or exclusion of stillbirths in the ascertainment of OCs in a number of international studies, some of which included live births, stillbirths, and abortions in their evaluation of prevalence at birth. The OC rates were 6.43/1000 stillbirths vs. 2.16/1000 live births in a study of the white population of Iowa (Hay, 1971). In a study on live births in the pooled data from black, Mexican, and white populations (Lutz and Moor, 1955), rates were 2.72/1000 stillbirths vs. 0.91/1000 live births. The risk of developing clefts in stillbirths and abortions appears therefore to be about three times as frequent as in live births. Also, clefts with associated malformations behaved differently epidemiologically in comparison to clefts without associated malformations.
A further study, in Hungary (Czeizel, 1984), reported that the proportion of CP without cleft lip (CL) was about sevenfold greater in stillbirths (primary fetal deaths 28 weeks or older) than in live births (2.38/1000 vs. 0.36/1000). In comparison, for CL/P, the ratio was a little less than threefold (3.17/1000 vs. 1.15/1000). As may be expected, this differential between live births and stillbirths is greater for individuals with additional malformations elsewhere than for those with only CL, CP, or both (CLP).
Krause et al. (1963), examined human embryos and fetuses and reported that the frequency of clefts with associated malformations was 11.61/1000 and that the frequency of clefts without associated malformations was 7.22/1000. Nishimura et al. (1966) reported the frequency of CL/P in 1213 voluntarily aborted human embryos to be 14.7/1000. In a separate study of 5117 voluntarily aborted human embryos, Iizuka (1973) found that the prevalence at birth of CL was 4.3/1000, that of CLP was 8.10/1000, and that of isolated CP was 3.2/1000. Thus, the lumping of figures that include not only live births but also stillbirths and/or induced abortions will not be comparable to figures for live births only. If fetal deaths or earlier losses are included in summary rates, then this should be noted specifically and rates should be presented separately for live births and for embryonic and fetal deaths.
Associated Malformations
It is generally accepted that associated malformations occur less frequently in infants who have CLP than in those who have CP and even less still in those with isolated CL. For example, a 17-year study in north-eastern France reported rates of associated malformations to be 46.7% in CP, 36.8% in CLP, and 13.6% in CL (Kallen et al., 1996). Cornel et al. (1992) reported associated abnormalities in 23% of CL/P cases and in 52% of cases with isolated CP. Numerous other studies also found congenital anomalies to be much more commonly associated with CP than with CL/P (Ingalls et al., 1964; Drillien et al., 1966; Moller, 1972; Emanuel et al., 1973). In the Finnish population, however, CL/P was as often associated with other malformations as was CP (Saxen and Lath, 1974). Familial background was also more often reported in association with CP than with CL/P in Finland, which contrasts with the findings of others, e.g., Fogh-Andersen (1942) in Denmark.
Some studies also subdivide CL/P into unilateral and bilateral groups when examining additional malformations and report an increase in additional malformations in the bilateral subgroup (Hagberg et al., 1997). Some reports do not define what is meant by associated abnormalities, while others give ambiguous descriptions. Conway and Wagner (1966) recorded only the “ten most common” associated abnormalities listed on birth certificates over an 11-year period. This may explain some of the variation observed in the reporting of the frequency of other abnormalities accompanying OCs (see tables in Appendix I).
Prevalence of Isolated Cleft Palate
There is considerable heterogeneity in what is described as isolated CP. Many figures for isolated CP are provided without an adequate explanation of inclusion/exclusion criteria. For instance, the most common syndrome with isolated CP as a feature is the Pierre Robin syndrome, and inclusion or exclusion may make a substantial difference to the figures. This subgroup is also more susceptible to ascertainment bias as the prevalence of submucous clefting within the general population is thought to be as common as overt isolated CP. In a detailed study of isolated CP in Denmark, Christensen and Fogh-Andersen (1994) noted a marked difference in sex ratios for nonsyndromic overt CP including the hard palate and non-syndromic overt CP of the soft palate only. This, combined with the tendency for hard palate and soft palate clefts not to occur within the same families indicates that they may be two etiologically distinct subgroups of CP. Therefore, the authors recommended that future studies on isolated CP distinguish between hard palate, soft palate, and submucous hard palate in an attempt to disclose etiological heterogeneity within secondary palatal clefting.
Inclusion of the Robin sequence is also complicated by the fact that its etiology is heterogeneous and its diagnosis inconsistent. Some authorities state that respiratory distress is an essential part of the anomaly (Shprintzen and Singer, 1992), while others make a diagnosis on the basis of glossoptosis and micrognathia with the cleft, whether or not there is respiratory distress (Caouette-Laberge et al., 1994). The Pierre Robin anomaly also occurs in association with other monogenie disorders, e.g., Stickler's syndrome.
Further complications in the consideration of isolated CP are two recognized genetic phenomena: (1) the association of CP with 22qll.2 deletion in the velocardiofacial syndrome and (2) X-linked clefting. The prevalence at birth of velocardiofacial syndrome in many populations is unknown, and diagnosis may be delayed, thus affecting the birth prevalence figures. X-linked clefting has been reported in some populations, e.g., the Icelandic population (Moore et al., 1987), but has not been investigated in many others. Also, Lowry and Renwick (1969) reported X-linked submucous CP as part of an X-linked recessive trait, which might complicate the picture regarding CP birth prevalence and sex ratio figures.
Geographical Variation in the Epidemiology of Oral Clefts
Epidemiological data for OCs from the three different sources outlined above are presented as follows:
· Peer-reviewed publications, Table 12.1 (complete data shown in Appendix 12.I
· Data from the European Registry of Congenital Anomalies and Twins (EUROCAT) registration system, Appendix 12.II
· Data collected through the National Birth Defects Prevention Network (NBDPN) in the United States, Appendix 12.III
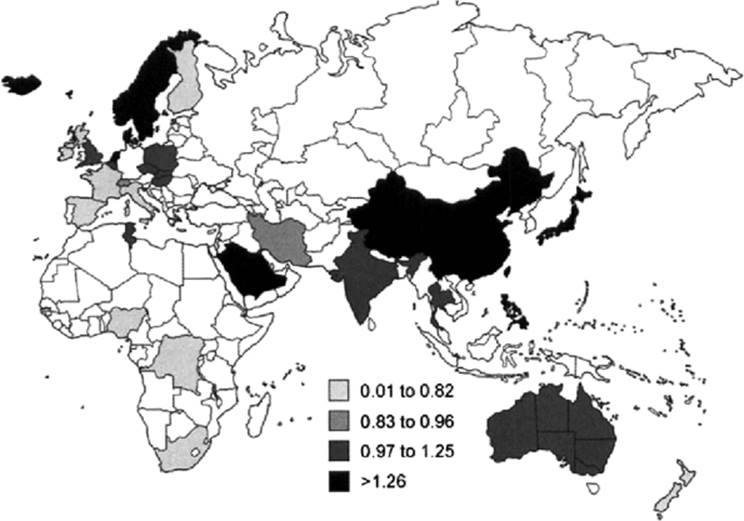
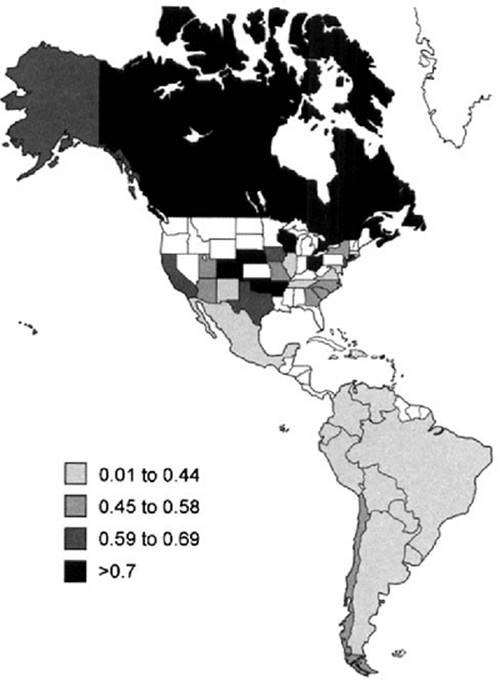
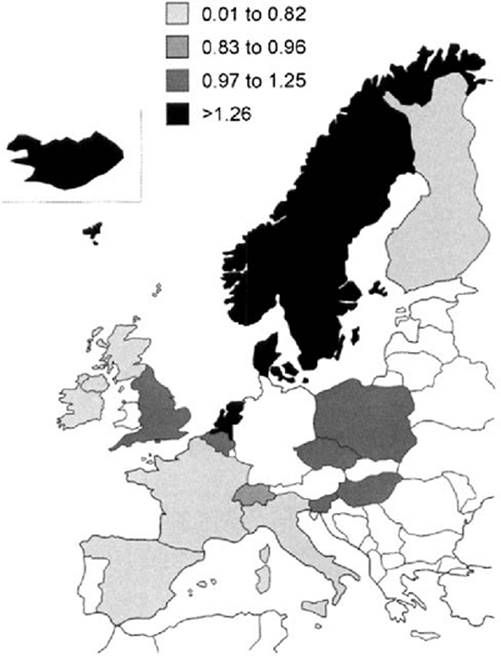
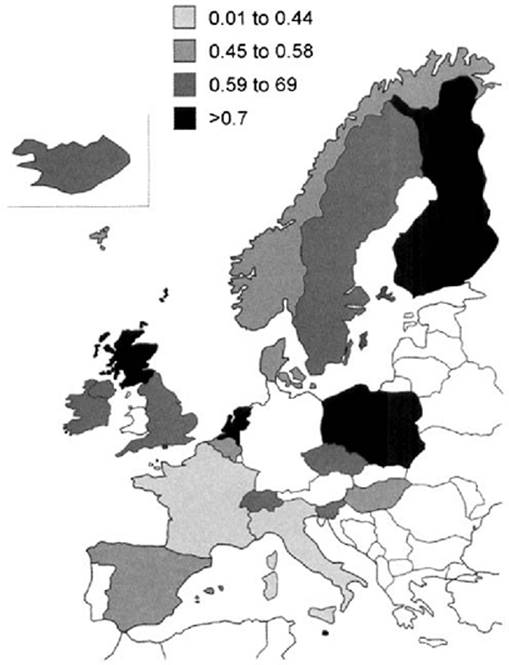
· A series of maps (Figs. 12.1,12.2,12.3,12.4,12.5 and 12.6) are included to illustrate some of the birth prevalence data for isolated CP and cleft lip and palate (CL/P). The data used for the maps were taken from individual reports or from registries that are mentioned in the text of the chapter (Appendix 12.I).
· There is insufficient detail in the maps (Fig. 12.1,12.2,12.3,12.4,12.5,12.6) to reflect regional differences within countries. These maps are intended merely to illustrate general trends in the population distribution of CP and CL/P. They also indicate that there is a dearth of published information available for some countries and geographical areas of the world.
The commentary relates mainly to the peer-reviewed literature, with occasional reference to the other registration systems, and deals with CL/P and CP separately.
Prevalence of Cleft Lip with or without Cleft Palate
United States and Canada
One of the fundamental differences between the OC epidemiology data in Europe and North America is the ethnic heterogeneity that characterizes most of the North American population. It was therefore important to examine the North American data in the light of ethnic origin. The highest prevalence of CL/P was found in British Columbia among Native Americans, 2.73/1000 live births (Lowry and Renwick, 1969). The next highest, 1.99/1000 births, is from the Californian registry in the period 1983-1992 (Croen et al., 1998), representing Native Americans only. The lowest figures are from nonwhite populations in New York [0.29 reported by Conway and Wagner (1966)] and Mississippi [0.30 as reported by Das et al. (1995)].
|
TABLE 12.1A. Extremes of Cleft Lip with or without Palate Prevalence: Highest and Lowest figures |
||||||||||||||||||||||||||||||||||||||||||||||||||||||||||||||||||||||||||||||||||||||||||||||||||||
|
||||||||||||||||||||||||||||||||||||||||||||||||||||||||||||||||||||||||||||||||||||||||||||||||||||
|
TABLE 12.1B. Extremes of Cleft Palate Prevalence: Highest and Lowest Figures |
||||||||||||||||||||||||||||||||||||||||||||||||||||||||||||||||||||||||||||||||||||||||||||||||||||
|
||||||||||||||||||||||||||||||||||||||||||||||||||||||||||||||||||||||||||||||||||||||||||||||||||||
|
|
|
FIG. 12.1. Distribution of cleft lip with or without cleft palate for Europe, Africa, Asia, and Australia. |
The NBDPN examined OC prevalence by U.S. state. The highest recorded is for New Mexico at 1.73/1000 live births in the 1995–1996 cohort, which included stillbirths as well as live births and is a relatively small sample. In Wisconsin 1989–1995, prevalence was 1.56/1000 with live births and stillbirths combined. The lowest recorded prevalence rate for CL/P was 0.59 in Alaska and Illinois; the Alaskan sample was for 1996 only, while the Illinois sample was a 7-year sample (1989–1996) and included stillbirths.
Central and South America
Most of the registers in South America report through the Latin American Collaborative Study of Congenital Malformations (ECLAMC; Appendix I, Table 12.IC), and the OC figures include associated abnormalities. The highest CL/P prevalence figure is from Bolivia (2.28/1000), with Argentina (1.16/1000) and Chile (1.13/1000) next. These are geographically in the southern, and generally less developed, parts of South America. At the lowest end of the scale is the geographically and genetically different population in Central America and the Caribbean, with Das et al. (1995) reporting a prevalence of 0.42/1000, the next lowest rate is for Venezuela (on the northern coast), with a prevalence of 0.77/1000.
|
|
|
FIG. 12.2. Distribution of cleft palate for Europe, Africa, Asia, and Australia. |
|
|
|
FIG. 12.3. Distribution of cleft lip with or without cleft palate for North and South America. |
Australia and New Zealand
The figures for Australia and New Zealand recognize the different ethnic origins of the indigenous people of these of islands and the settlers. Prevalence figures range from remarkable extremes for nonsyndromic clefts of 2.27 in Aborigines in a study between 1980 and 1987 (Bower et al., 1989) to the lowest recorded figure outside of Africa of 0.39 in New Zealand Maoris between 1960 and 1976. In the same study, New Zealand whites occupied an intermediate position (1.19) (Chapman, 1983).
|
|
|
FIG. 12.4. Distribution of cleft palate for North and South America. |
Europe
The highest birth prevalence of CL/P from all European countries was 1.46 (Cornel et al., 1992). Overall, the areas of highest prevalence within Europe are Norway, Denmark, Sweden, Iceland, and the northern Netherlands. Intermediate levels occur in Central Europe, and the lowest are in southern Europe. In the British Isles, the frequency varies between 0.6 and 1.04, which is nearer to the southern European figures.
Middle East
In the Middle East, the highest record for CL/P prevalence is 1.89/1000 in a Saudi Arabian hospital-based study (Borkar et al., 1993). The next highest is considerably lower (1.06/1000 live births) for nonsyndromic OCs, reported in Kuwait between 1985 and 1987 (Srivastava and Bang, 1990). Taher (1992) reported what he regarded as a cluster in one hospital in Tehran with a prevalence of 3.12/1000. Chemical sulfur mustard gas was implicated in the etiology during this 4-year period, 1983–1988. The lowest prevalence (0.37/1000 live births) was recorded by Azaz and Koyoumdjisky-Kaye (1967) in a hospital-based study of Israeli Jews between 1960 and 1962. The next lowest recorded prevalence was 0.85/1000 live births in Iran (Rajabian and Sherkat, 2000).
|
|
|
FIG. 12.5. Distribution of cleft lip with or without cleft palate for Europe. |
|
|
|
FIG. 12.6. Distribution of cleft palate for Europe. |
Far East
Data on CL/P prevalence from the Far East are often quoted as single figures with all clefts combined rather than separate figures for CP and CL/P. The highest rate reported is from Japanese data, a hospital-based sample in Hiroshima between 1948 and 1954, revealing a prevalence of 2.13/1000 live births (Neel, 1958). In the Philippines, Murray et al. (1997) reported a prevalence of 1.94/1000 live births in a 7-year survey of hospital records between 1989 and 1996, with this figure including syndromic clefts (21%). The lowest quoted figure is also from a hospital-based study of live births in Japan between 1979 and 1982 (Kondo, 1987), 0.97/1000; the next lowest was reported by Natsume et al. (1987), 1.02/1000 live births, in Haichi, Japan. These studies are not strictly comparable because of differences in ascertainment criteria; they also reveal the difficulty of comparing hospital vs. population-based studies.
Indian Subcontinent
On the Indian subcontinent, highest CL/P prevalences were recorded in Maharashtra (2.32/1000) in a hospital-based study that included live births and stillbirths (Chaturvedi and Banerjee, 1989). This is followed by a rate of 1.61/1000 in Calcutta in a 29-month hospital-based study (Nair and Mathai, 1964). The lowest prevalences were seen in Madurai (0.77/1000 live births) in a hospital-based study (Kamala et al., 1978) and in a small 2-year hospital-based study in New Delhi (0.41/1000 live births) (Kulshrestha et al., 1983).
Africa
In Africa, the highest figure of 1.63 comes from a relatively small 6-month hospital-based study in Nairobi reported by Khan (1965), which is out of step with other African studies; selection bias is suspected. The next highest rate is from Tunisia in northern Africa, where live births and stillbirths were recorded in a 9-month study, with a prevalence of 1/1000 births (Khrouf et al., 1986). Many of the studies reveal figures less than half of that; e.g., the next highest is from Nigeria (0.47/1000) (Gupta, 1969) and the lowest (0.2, 0.21, and 0.3/1000 live births) were recorded in hospital-based studies in Johannesburg (Kromberg and Jenkins, 1982) and Nigeria (Iregbulem, 1982; Ogle, 1993). All three of these were small studies that may be suspected of underascertainment.
Prevalence of Isolated Cleft Palate
United States and Canada
In North America, the highest reported prevalence for CP is 1.11 for Native Americans in the Californian registry between 1983 and 1992 (Croen et al., 1998). This is followed closely by the East Indian ethnic subgroup in California in the same study (1.06/1000). The lowest figures reported are 0.22 for nonwhites in New York City (Conway and Wagner, 1966) and 0.24/1000 for nonwhites in Mississippi in 1980-1989 (Das et al., 1995). In the NBDPN, which compared the frequency of clefts in various states, the highest reports come from Wisconsin (1.45) and Connecticut (0.95), with the lowest in New Mexico (0.18) and Tennessee (0.29).
Central and South America
The prevalence of CP in South America shows remarkably little variation, with eight out of the 10 South American countries contributing to the ECLAMC Registry; prevalence rates are between 0.2 and 0.4/1000 births. The lowest is 0.06/1000 in Peru, while the highest prevalence was recorded in Chile, 0.46/1000. The figures from Central America for prevalence of isolated CP were 0.2/1000 in a hospital-based study in the Caribbean (Garcia-Godoy, 1980) and 0.27/1000 in a hospital-based register in Mexico (Perez-Molina et al., 1993).
Australia and New Zealand
In Oceania, a remarkably high figure for isolated CP was reported for the Maoris in New Zealand, with a prevalence of 1.87/1000 between 1960 and 1976 (Chapman, 1983); figures of 0.64 and 0.67 were reported for whites in New Zealand (Chapman, 1983) and Australia (Bower et al., 1989), respectively.
Europe
The prevalence of isolated CP is highest in Finland, with a rate of 0.97/1000 from in a study between 1948 and 1975 (Rintala, 1986); in a later study, between 1974 and 1988, Tolarova and Cervenka (1995) reported a birth prevalence of 1.01. The next highest rate in Europe was reported by Womersley and Stone (1987) in the west of Scotland, 0.81, between 1974 and 1985. The lowest reported European figures come from Denmark (0.36/1000) in a study between 1938 and 1957 (Fogh-Andersen, 1961) and central and eastern France (0.42/1000) (Kallen et al., 1996). In the EUROCAT regional registry (which does not include Finland), the highest figure is from Glasgow (western Scotland) (0.94) and the lowest (0.25/1000) is from Northern Ireland in the same time period (1990 and 1994). In general, the figures from Europe are characterized by significant variation, not only between countries but also within. For instance, the Paris registry reveals a relatively low frequency of CP (0.47/1000), while the figure for Strasbourg is 0.88/1000 (ICBDMS, 2000).
Middle East
From the relatively few studies from the Middle East, the extremes in CP birth prevalence range from a low of 0.17/1000 in a hospital-based study of Israeli Jews (Azaz and Koyoumdjisky-Kaye, 1967) to a high of 0.42/1000 for nonsyndromic clefts (Srivastava and Bang, 1990) in a population-based study in Kuwait. Taher (1992) reported what he regarded as a cluster in one hospital in Tehran with a birth prevalence of 0.62/1000 for CP (and a remarkably high figure of 3.12/1000 for CL/P). Chemical sulfur mustard gas was implicated in the etiology during this 4-year period (1983–1988).
Far East
The highest recorded figure for isolated CP comes from an 18-year hospital-based study in Tokyo, in which Mitani (1954) reported 0.73/1000 births. The lowest figure, 0.15/1000 live births, was recorded by Xiao (1989) in a large cross-sectional study of 945 hospitals in China in a 12-month period between October 1986 and September 1987. The next lowest figure comes from a report by Emanuel et al. (1972), who recorded a figure of 0.16/1000 in a hospital-based study in Taipei (Taiwan).
Indian Subcontinent
Much of the data from India come from relatively small local hospital-based studies recording the prevalence of birth defects including OCs. While the majority of these studies record figures for CL/P, many do no record isolated CP. Of those that do, the lowest figure, 0.32/1000, comes from a study by Singh and Sharma (1980) in New Delhi. The highest figure, 0.48/1000, comes from a small study in Kanpur by Mital and Grewal (1969). While a meta-analysis was carried out by Verma and Mathews (1983), this was methodologically flawed and included various prospective and retrospective studies of live births and stillbirths throughout India. However, the figures of 1.20/1000 for CL/P and 0.44/1000 for CP appear to be the best available estimates for OC prevalence in the Indian subcontinent.
Africa
The lowest recorded birth prevalence for OC comes from Africa, and the lowest rate of any study in the world is that from the hospital live births series reported by Ogle (1993) between October 1977 and June 1979 in a hospital-based study in Nigeria. The prevalence at birth was 0.02/1000 in a study of over 56,000 live births. The next lowest, 0.07/1000, was recorded by Iregbulem (1982) in another hospital series, in Enugu, Nigeria. The highest prevalence rates come from Tunisia on the north coast, where Khrouf et al. (1986) recorded 0.4/1000 in a hospital-based study that included the recording of abnormalities in stillbirths. The next highest, 0.33/1000, comes from a hospital-based study in Nairobi reported by Khan (1965).
Discussion
Ethnic Origin, Migration, and Population Admixture Studies
While only a few studies have been carried out in Africa to examine cleft prevalence, they suggest a low prevalence of both CP and CL/P. African-Americans have lower rates for both CP and CLP than whites in the United States, and a study in Birmingham (UK) showed that those originating from the Caribbean have low OC rates (Leek and Lancashire, 1995) (Table 12.2). Studies from Asia reveal high rates of CL/P but not CP in mainly hospital-based series, and similarly higher rates on the Indian subcontinent. Studies in North America also reveal high rates of CL/P in persons of Japanese or Chinese origin (Croen et al., 1998; Tolarova and Cervenka, 1998).
Ching and Chung (1974) have shown that the racial differences in CL/P birth prevalence are likely to have a genetic basis. In an extensive study from Hawaii, they showed that Japanese immigrants continue to have increased birth prevalence of CL/P and, by studying interracial crosses, that Caucasian-Japanese matings have intermediate birth prevalence, suggesting that the racial differences are independent of environment. Support for this theory is provided by Leek (1972), who showed that the variation in the birth prevalence of CL/P between different ethnic groups living in the same areas is eight times greater that that among geographically scattered populations of the same ethnic origin.
Among Filipinos, prevalence data for CL/P revealed a difference by country, with the highest prevalence observed in the Philippines, an intermediate prevalence Hawaii, and the lowest prevalence in California (Croen et al., 1998). Such variations in cleft prevalence according to maternal country of birth may reflect changes in nongenetic risk factors, such as maternal diet, that may occur following migration. Variations in prevalence may also be related to racial and ethnic differences in nongenetic factors associated with clefting risk, and this assists with the formulation of future hypotheses in OC research.
|
TABLE 12.2. Prevalence at Birth of Oral Clefts by Ethnic Group of Parents (Birmingham 1960–1984) |
|||||||||||||||||||||||||||||||||
|
|||||||||||||||||||||||||||||||||
In the United States, Croen et al. (1998) recognized that the considerable population admixture requires investigation of variation of OC prevalence according to parental race, ethnicity, and maternal country of birth. This issue is particularly relevant in OC with the known ethnic variations; it is therefore important to pursue clues as to the relative contribution of genetics and environmental factors to the etiology. Croen and colleagues (1998) subdivided patients in the Californian birth defects monitoring program into 13 ethnic subsets. They also recorded OC risk according to whether mother and father were of the same race or ethnicity.
A further study in the United States examined rates of CL/P by state (Table 12.3) and Hispanic ethnicity by subdividing the data into three subgroups: Hispanics, non-Hispanic whites, and non-Hispanic blacks (Kirby et al., 2000). They concluded that CL/P prevalence was greatest among whites (1.03/1000) and lowest among blacks (0.54/1000), with Hispanics having an intermediate prevalence (0.97/1000).
Relative Proportions of Different Cleft Types
When considering OC frequency, the proportion of different types of cleft has important implications for the clinical workload but is also of interest in providing clues about the underlying etiology. The relative proportions of syndromic clefts and associated abnormalities are also important in determining etiological factors. European and U.S. studies on nonsyndromic cleft prevalence in general suggest that unilateral CLP is the most frequent single type of cleft, accounting for about 30% to 35% of cases. Isolated CL and CP each account for between 20% to 25%, and bilateral CLP is the most rare (about 10%), with submucous and other clefts accounting for the rest (Hagberg et al., 1997).
|
TABLE 12.3. Number and Rates of Cleft Lip with or without Cleft Palate by State Hispanic Ethnicity (USA National Center for Health Services 1993–1995) |
|||||||||||||||||||||||||||||||||||||||||||||||||||||||||||||||||||||||||||||||||||||||||||||||||||
|
|||||||||||||||||||||||||||||||||||||||||||||||||||||||||||||||||||||||||||||||||||||||||||||||||||
Furthermore, of all CLP cases, 80% are unilateral and 20% are bilateral. Overall, 15% of all OCs are syndromic (12% of CL/P and 25% of CP). Over 300 syndromes are recognized (involving the oral, cardiac, skeletal, and other body areas), and of the remaining 85% of OC individuals, 50% have other less welldefined anomalies (OMIM, 2000; http://www3.ncbi.nlm.nih.gov/omim/).
Fogh-Andersen (1942), using data from Denmark, reported a CL:CLP:CP ratio of 1:2:1, which is often quoted as the normal ratio for the different types of cleft, especially for European or Caucasian populations. This has on occasion been used as a guide [e.g., Woolf et al. (1963), who felt that, because of underascertainment of isolated CP in their hospital-based sample in Utah, the figure should be adjusted in line with this ratio]. It may, however, be erroneous to assume this as a universal figure, as other studies indicate. A number of Japanese studies (Natsume and Kawai, 1986; Natsume et al., 1987) reveal a much lower prevalence at birth of CP, with a CL:CP ratio of 8:3. Similarly, in Africa, CP is a much lower proportion of the overall prevalence at birth of clefting, being 4% in a newborn Zairian sample (Ogle, 1993) and 19% in a large Nigerian study (Iregbulem, 1982). In the latter study, CL was much more common than CLP, the ratios being 49% for CL, 32% for CLP, and 19% for CP.
Closer inspection of the figures in studies that provide a breakdown of clefts into different subgroups is interesting. Table 12.4 was compiled from a selection of studies that provide this information and presents in particular the relative frequency of CL and CLP, as well as the overall prevalence of CL/P. The general trend is that in those regions of the world where cleft prevalence is highest, the ratio of CLP to CL is highest, and in regions of lowest cleft prevalence, the proportion of the more severe forms of clefting is correspondingly low. This provides indirect support for the multifactorial threshold model and for the notion of OC being a threshold characteristic with genetic predisposition.
The data in Table 12.4, however, need to be interpreted with caution because of the heterogeneity associated with the ascertainment methods from which the figures were derived. The data are from a range of studies of varying sizes, some looking at nonsyndromic cases only, and some including associated malformations; also, some included stillbirths as well as livebirths and some did not. Since other studies have revealed a greater proportion of associated malformations with the more severe clefts and the milder clefts may not be as easily ascertained in areas with a higher proportion of severe cases, these factors must be accounted for before firm conclusions can be drawn.
Gender Ratios in Various Types of Cleft
Among the accepted epidemiological differences between CL/P and isolated CP is the now widely accepted male predilection for CL/P and female tendency toward CP. Therefore, to quote a sex ratio for OC as a whole, in view of the acknowledged differences in sex ratios for the subgroups, is meaningless.
The differences in sex ratios within the OC groups have proven to be more complicated, varying with severity of the cleft, number of affected siblings in a family, and ethnic origin. In all studies of white populations, CL/P occurs more frequently in males than females, with an average male to female ratio of 2:1 (Wyszynski et al., 1996). In Japanese populations, there is a significant male excess in the CLP group but not in the CL only group (Fujino et al., 1963). In the white population, the male excess in the CL/P group becomes more apparent with increasing severity of cleft (Fogh-Andersen, 1942) and less apparent when more than one sibling is affected in the family (Niswander et al., 1972). In both races, there appears to be a slight excess of affected females in the CP group (Fraser, 1970; Wyszynski et al., 1996), although there remains some uncertainty and variation in the gender distribution of isolated CL. No generally accepted explanation for these gender differences exists, although sex differences in the timing of critical developmental stages in craniofacial development are thought to have an as yet undefined role in their etiology (Burdi and Silvey, 1969).
|
TABLE 12.4. Relative Proportions of Cleft Lip Subtypes in a Sample Studies |
||||||||||||||||||||||||||||||||||||||||||||||||||||||||||||||||||||||||||||||||||||||||||||||||||||||||||||||||||||||
|
||||||||||||||||||||||||||||||||||||||||||||||||||||||||||||||||||||||||||||||||||||||||||||||||||||||||||||||||||||||
It is generally considered that clefts with associated malformations are different epidemiologically from clefts without associated malformations (Vanderas, 1987). However, the subdivision of primary palatal clefting into CL and CLP is somewhat controversial. Some argue that they are embryologically the same structure and the pathogenesis is presumably chronologically the same, with clefting of the hard palate being a secondary phenomenon occurring because of the disturbance surrounding the primary palate cleft (Fogh-Andersen, 1942). It is, however, possible to have a CL and/or primary palate and a separate cleft of the soft palate with an intact hard palate between the two clefts, suggesting that they may be separate events (Hook and Porter, 1982; Vanderas, 1987; Sayetta et al., 1989).
A review of the literature reveals that only a subset of the epidemiological reports sub-divide the primary palatal clefting into CL and CLP. For those that do, there is considerable variation in the gender ratio for CL. There also tends to be less variation in CLP, and by virtue of the fact that CLP is much more common than isolated CL, the gender ratios for CL/P invariably reveal a male predilection. This may, however, mask an important underlying trend in CL gender ratios with considerable variation between ethnic groups. Womersley and Stone, (1987) reported a CL male to female ratio of 3:1 in the west of Scotland, which is considerably higher than other U.K. and European figures. For example, in Czechoslovakia, the CL male to female ratio was 1.5 (Tolarova, 1987) and in Denmark, 1.73 (Melnick et al., 1980). Precisely the same value (1.73) was reported by Woolf et al. (1963) in Utah. Similar gender ratios have been reported in other U.S. studies, such as Gilmore and Hofman (1966) in Wisconsin and Shaw et al. (1991) in California. However, the ratio is much lower in other countries, such as Nigeria (1.1 to 1; Iregbulem, 1982). In China, Yi et al. (1999) reported a male to female ratio of 0.85 to 1. In a 15-year sample of clefts in Iran (Rajabian and Sherkat, 2000) and in a small sample of clefts in the Jewish population in Israel (Azaz and Koyoumdjisky-Kaye, 1967), CL was also more common in females.
Unilateral Clefts and Laterally
The tendency for unilateral CL to be left-sided has proved to be a consistent finding. Of unilateral CL (80%-85% of all CL cases), approximately two-thirds have left-sided defects regardless of sex, ethnic group, and severity of defect (Fogh-Andersen, 1942; Fraser and Calnan, 1961). Since then, this predilection for the left side in unilateral clefts has been a recurrent finding in the OC literature (Bonaiti et al., 1982; Tolarova, 1987; Jensen et al., 1988), and this seems to be a feature in all ethnic groups.
No convincing explanation for these differences has been advanced, but a proposed explanation is that blood vessels, supplying the right side of the fetal head, leave the aortic arch closer to the heart and are perhaps better perfused by blood than those going to the left side (Johnston and Brown, 1980). Therefore, this left-sided characteristic would equally affect males and females, and this was confirmed for both unilateral CL and unilateral CL/P in a study of the Metropolitan Atlanta Congenital Defects Program (Paulozzi and Lary, 1999). An earlier report from the Netherlands by Cornel et al. (1992), however, examined laterality according to gender in an 8-year study and found that the predilection to left-sided clefting was seen only in boys.
Time Trends
The best data on which to base judgments on time trends for OC prevalence at birth are provided by the registries, where the criteria and infrastructure for the collection of data over a time period in a defined geographical area are relatively consistent. Data from the EUROCAT registry Report 6 (1980–1992) and Report 7 (1990–1994) provide a reasonable estimate of time trends in prevalence during these two time periods for CP and CL/P subgroups. While interesting variations during these time periods can be observed in various registries, there is no overall consistent trend to suggest that OC is significantly increasing or reducing in prevalence.
The ICBDMS, like EUROCAT, does not reveal any remarkable time trends in the period 1974–1998, with the occasional exception, such as the Finnish data. In Finland, the prevalence of CP has steadily increased over this period and, for CL/P, there is a similar, though lesser, trend. In contrast, many of the other countries that contribute data to ICBDMS, e.g., the United States and most of the European countries such as England and Wales, Ireland, northern Netherlands, Italy, and Hungary, reveal a tendency to reduction in frequency of CL/P. Apart from the aforementioned trend in Finland, the birth prevalence of CP remains remarkably consistent throughout this time period.
One of the most comprehensive data sets comes from Denmark, where there is a mandatory reporting system and a rigorous ascertainment procedure. The reported birth prevalence of OC in Denmark has risen from 1/667 live-born infants in 1942 to 1/529 in 1981 (Jensen et al., 1988). This increase may be due to better reporting and recording, decreased neonatal mortality, increasing environmental teratogens (e.g., drugs), and increased frequency of marriage among cleft patients because of better care.
The decline in OC in England and Wales apparent in notification data does not appear in the EUROCAT Registry data from Liverpool or Glasgow (EUROCAT Reports, 1995, 1996). However, EUROCAT data from Northern Ireland show a consistent decline in birth prevalence for CP. In parallel with the increased prevalence in Denmark over time between the 1940s and 1970s, increases were also noted in Finland during the same period. Seasonal patterns are little studied, but where they have been (Saxen and Lathi, 1974), no consistency has been noted.
Genetics and Environmental Factors
The overall variation in craniofacial morphology worldwide is related to ethnicity, and heritable characteristics (parental craniofacial characteristics being an example) are associated with ethnicity. The myriad of identifiable environmental causes are not uniform worldwide, individual countries and regions of countries being subjected to considerably differing lifestyle factors and environmental conditions. Maternal cigarette smoking and alcohol consumption remain the most plausible environmental factors in the cause of OC, but the evidence is not entirely consistent and may differ for CP and CL/P. Gene-environment interactions may also play a role, and in two studies smoking has been shown to be a more potent risk factor when present in conjunction with the transforming growth factor-alpha TaqI C2 allele (Hwang et al., 1995; Shaw et al., 1996). Specific environmental etiologies were implicated in OC in the Tehran study (Taher, 1992), and Zieglowski and Hemprich (1999) showed a dramatic increase (9.4%) in CLP 1 year after the Chernobyl nuclear accident, though there may be an element of selection bias in this figure.
Variations in genotype are associated with ethnicity, and thus it is possible that the effects of gene-environment interactions may vary considerably between ethnic groups. This may also account for some of the ethnic and geographic variation in the epidemiology of OC.
Socioeconomic Status
A number of studies have speculated on socioeconomic status, but in general, little attempt has been made to record it accurately or to analyze the correlation with CP or CLP. Croen et al. (1998) examined variation in the prevalence of CP and CL/P among Filipinos in California, Hawaii, and the Philippines and demonstrated a gradient, with the highest prevalence observed in the Philippines, an intermediate prevalence in Hawaii, and the lowest prevalence in California. They speculated that this variation may reflect differences in environmental risk factors, such as lack of maternal periconceptional vitamin supplementation.
Womersley and Stone (1987) examined the prevalence of facial clefting within Greater Glasgow according to housing and social characteristics. The highest rates were observed in areas of high unemployment, poor housing, and unskilled workers, whereas the lowest rates were found in affluent areas with large owner-occupied housing and professional or non-manual workers. The majority of cases examined were CP, and there appeared to be less variation in CL/P cases. The authors concluded that a deprived environment enhances the susceptibility to CP and that interaction between low socioeconomic status or a poor environment with a teratogen might explain Glasgow's high prevalence of CP. Diet, infection, and drugs were suggested.
Sivaloganathan (1972) examined social class and OC in a hospital-based sample in Kuala Lumpur, Malaysia, between September 1969 and May 1971. They found that 65% of clefts were from the lower class, 28% from the middle class, and 7% from the upper class, indicating either that clefting is associated with poor socioeconomic status and environmental factors or that there is a genetic predisposition. In a similar hospital-based study in Thailand, Chuangsuwanich et al. (1998) reported that low socio-economic status is also a significant etiological factor for OC.
It might be expected that if low socioeconomic status were a significant factor, time trend data would reflect this in areas where there have been improvements in living standards. Some trends are detectable from the available data in Europe (of which the EUROCAT data are regarded as being the most reliable), and these show that globally there was no reduction in the birth prevalence of OC between 1980 and 1996. This is despite considerable improvements in living conditions and nutrition during this same time period. This might well be due to a concomitant increase in exposure to other environmental teratogens, or it may be a genetic phenomenon. In the context of gene-environment interaction, Khoury and James (1993) state that if genetic susceptibility is not accounted for in the study of environmental factors, the results may be misleading.
It may be that the factors associated with low socioeconomic status can account for some of the world-wide variation in the prevalence of OC. The overall conclusion is that socio-economic status in OC is not well studied. One of the barriers to investigation of the role of socioeconomic status in OC is that common criteria for the description of low socioeconomic status do not exist. Also, in those studies where socioeconomic status or social class have been examined, different criteria have been used, making valid intercenter comparisons impossible.
Recommendations for Producing Better Descriptive Statistics in Oral Clefts Epidemiology
Oral clefting is a heterogeneous group of defects with a considerable range of severity; therefore, there will inevitably be variability in ascertainment rates. Many earlier publications were less discriminating on the differences in frequency between CP and CL/P, often quoting a combined figure. Many of the more recent papers do differentiate and some subdivide CL and CLP.
For example, the overall data from Europe show a fivefold variation in CL/P and a threefold variation in CP. The explanation for such variation may, at least partly, be due to the variable quality of data. It is therefore important that methods of ascertainment are specified, as well as whether studies were population-based or hospital-based. Accurate data require a recording system using multiple sources of ascertainment.
Population-Based vs. Hospital-Based Registries
In much of the older literature and in current work in less developed countries, data are often available only on births delivered in hospital. Unless almost all births occur in hospital, such data may be biased. However, if hospital confinement is more available to women from the upper socio-economic groups, hospital-derived rates may underestimate those for the community as a whole.
Interpretation of hospital series, therefore, is not straightforward unless the proportion of births in the community delivered in hospital approaches 100%.
Even so, when hospital records alone are searched, the number of cases expressed as a percentage of all known cases found using multiple sources of ascertainment may be low, as indicated by the Hungarian figure of 52.5% based on this one source of ascertainment (Czeizel and Revesz, 1970).
While complete ascertainment is almost impossible to achieve, we can come close to this by pooling data from several overlapping sources. The quality of a population-based perinatal register will depend on how many sources are used and how thorough the ascertainment process is; also, cleft registers or hospital-based registers tend to be a subset, excluding stillbirths, early deaths, minor anomalies not requiring surgery, patients who move away, miscoding, etc. As well as being less complete, a hospital-based registry will tend to have fewer cases with associated abnormalities because of stillbirths and perinatal deaths and because another feature may be more important than the cleft.
Multiple Sources of Ascertainment
Multiple sources of ascertainment from population-based samples should be used for incidence statistics, and complete censuses or representative samples should be employed for prevalence statistics. These constitute the best approaches available for preparing accurate estimates of rates because no single data source has sufficient reliability (Czeizel and Tusnadi, 1971).
In preparing incidence data to support genetic and other etiological studies, all abortions and stillbirths should be included or appropriate adjustments made. Whether terminations and fetal deaths are included, the inclusion criteria, and the methods used should be clarified. Similarly, the effects of differential prenatal and postnatal death rates on the apparent sex ratios for clefts should be documented. All degrees of cleft expression should be diagnosed to prevent underascertainment.
Cleft Type and Associated Malformations
All epidemiological and genetic data should be presented by specific cleft type whenever possible (Fogh-Andersen, 1942; Fraser, 1970). Each cleft type should be subdivided by the presence or absence of associated congenital malformations (Emanuel et al., 1973). Where possible, syndromic cleft cases should be separated from nonsyndromic ones and the classification used and how this was done should be explained, e.g., by a dysmorphologist. Birth prevalence statistics for clefts will further benefit risk factor studies if they are tallied separately for familial and sporadic cases (Melnick et al., 1980; Bixler, 1981), in which the genetic and environmental risk factors may differ, and then for syndromic vs. nonsyndromic status within these categories. Since the major cleft phenotypes are actually heterogeneous entities, disaggregating them for statistical purposes may aid the investigation of unitary disease categories.
Ethnic Grouping
Where possible, data within countries should be presented by ethnic group, although it must be recognized that grouping by ethnic origin is not entirely objective. Also, in light of some emerging evidence, it may be useful to have a record of socioeconomic status. Ideally, data sets containing core information agreed by consensus should be collected, while additional information should be collected for studies in suspected high-risk population subgroups: specific parental genotypes or phenotypes, older parents, medicated mothers, mothers with certain chronic diseases, and parents with unique dietary or other environmental exposures.
Conclusions
The overall conclusions to be drawn from the data presented in this chapter are as follows:
· There is ample evidence of the distinctly different nature of CL/P and CP and emerging evidence of distinct differences in subgroups within these overall conditions.
· There is a great deal of geographical variation, which is more apparent for CL/P than CP.
· There is considerable variation in the proportion of OC cases with additional congenital anomalies and syndromes.
· The limited available data suggest that migrant groups retain rates of CL/P similar to those of their area of origin.
· There is no consistent evidence of time trends, nor is there consistent variation by socioeconomic status or seasonality, but these areas have not been adequately studied. There is a need to investigate such parameters within as well as between different populations.
· There is considerable international variation in the frequency of OCs, but validity and comparability of data are adversely affected by numerous factors: source population of births considered (hospital vs. population), time period, method of ascertainment, inclusion/exclusion criteria, and sampling fluctuation.
· There are many parts of the world for which we have little or no information on the frequency of OCs, in particular parts of Africa, Asia, and Eastern Europe.
References
Abyholm, FE (1978). Cleft lip and palate in Norway. I. Registration, incidence and early mortality of infants with CLP. Scand J Plast Reconstr Surg 12: 29–34.
Altemus, LA (1966). The incidence of cleft lip and palate among North American Negroes. Cleft Palate J 3: 357–361.
Antoszewski, B, Kruk-Jeromin, J (1997). The incidence of cleft lip and (or) palate in children of Lodz in the years 1982–1991. Pol Merkuriusz Lek 3: 10–12.
Azaz, B, Koyoumdjisky-Kaye, E (1967). Incidence of clefts in Israel. Cleft Palate Craniofac J 4: 227–233.
Beckman, L, Myrberg, N (1972). The incidence of cleft lip and palate in northern Sweden. Hum Hered 22: 417–422.
Bellis, TH, Wohlgemuth, B (1999). The incidence of cleft lip and palate deformities in the south-east of Scotland (1971–1990). Br J Orthod 26: 121–125.
Bixler, D (1981). Genetics and clefting. Cleft Palate J 18: 10–18.
Bonaiti, C, Briard, ML, Feingold, J, et al. (1982). An epidemiological and genetic study of facial clefting in France: epidemiology and frequency in relatives. J Med Genet 19: 8–15.
Borkar, AS, Mathur, AK, Mahaluxmivala, S (1993). Epidemiology of facial clefts in the central province of Saudi Arabia. Br J Plast Surg 46: 673–675.
Bower, C, Forbes, R, Seward, M, Stanley, F (1989). Congenital malformations in Aborigines and non-Aborigines in Western Australia, 1980–1987. Med J Aust 151: 245–248.
Brogan, WF, Woodings, JL (1974). A decline in the incidence of cleft lip and palate in Western Australia, 1963 to 1972. Med J Aust 2: 8–11.
Burdi, AR, Silvey, RG (1969). Sexual differences in closure of the human palatal shelves. Cleft Palate J 6: 1–7.
Calzolari, E, Milan, M, Cavazzuti, GB, et al. (1988). Epidemiological and genetic study of 200 cases of oral cleft in the Emilia Romagna region of northern Italy. Teratology 38: 559–564.
Caouette-Laberge, L, Bayet, B, Larocque, Y (1994). The Pierre Robin sequence: review of 125 cases and evolution of treatment modalities. Plast Reconstr Surg 93: 934–942.
Castilla, EE, Lopez-Camelo, JS, Campana, H (1999). The Altitude as a Risk Factor for Congenital Anomalies. Am J Med Genet 86: 9–14.
Chandra, P, Harilal, KT (1977). Congenital malformation in Madras—a study of 24,192 consecutive births. Med Genet India 1: 47–52.
Chapman, CJ (1983). Ethnic differences in the incidence of cleft lip and/or cleft palate in Auckland, 1960–1976. N Z Med J 96: 327–329.
Chaturvedi, P, Banerjee, KS (1989). Spectrum of congenital malformations in the newborns from rural Maharashtra. Indian J Pediatr 56: 501–507.
Chi, S, Godfrey, K (1970). Cleft lip and palate in New South Wales. Med J Aust 2: 1172.
Ching, GHS, Chung, CS (1974). A genetic study of cleft lip and palate in Hawaii. 1. Interracial crosses. Am J Hum Genet 26: 162–172.
Choudhury, AR, Mukherjee, M, Sharma, A, et al. (1989). Study of 126,266 consecutive births for major congenital defects. Indian Pediatr 56: 493–499.
Choudhury, AR, Talukder, G, Sharma, A (1984). Neonatal congenital malformations in Calcutta. Indian J Pediatr 21: 399–405.
Christensen, K, Fogh-Andersen, P (1994). Etiological subgroups in non-syndromic isolated cleft palate. A genetic epidemiological study of 52 Danish birth cohorts. Clin Genet 46: 329–335.
Chuangsuwanich, A, Aojanepong, C, Muangsombut, S, Tongpiew, P (1998). Epidemiology of cleft lip and palate in Thailand. Ann Plast Surg 41: 7–10.
Chung, CS, Myrianthopoulos, NC (1968). Racial and prenatal factors in major congenital malformations. Am J Hum Genet 20: 44.
Conway, H, Wagner, KJ (1966). Incidence of clefts in New York City. Cleft Palate J 3: 284–290.
Cooper, ME, Stone, RA, Liu, Y, et al. (2000). Descriptive epidemiology of nonsyndromic cleft lip with or without cleft palate in Shanghai, China from 1980 to 1989. Cleft Palate Craniofac J 37: 274–280.
Cornel, MC, et al. (1992). Some epidemiological data on oral clefts in the northern Netherlands 1981–1988. J Craniomaxillofac Surg 20: 147–152.
Coupland, MA, Coupland, Al (1988). Seasonality, birth prevalence and sex distribution of cleft lip and palate births in the Trent region. Cleft Palate J 25: 33–37.
Croen, LA, Shaw, GM, Wasserman, CR, Tolarova, MM (1998). Racial and ethnic variations in the prevalence of orofacial clefts in California, 1983–1992. Am J Med Genet 79: 42–47.
Czeizel, A (1984). Incidence and prevalence as measures of the frequency of birth defects. Am J Epidemiol 119: 141–142.
Czeizel, A, Revesz, C (1970). Major malformations of the central nervous system in Hungary. Br J Prev Soc Med 24: 205–222.
Czeizel, A, Tusnadi, G (1971). An epidemiologic study of cleft lip with or without cleft palate and posterior cleft palate in Hungary. Hum Hered 21: 17–38.
Czeizel, AE (1997). First 25 years of the Hungarian Congenital Abnormality Registry. Teratology 55: 299–305.
Das, SK, Runnels, RSJ, Smith, JC, Cohly, HH (1995). Epidemiology of cleft lip and cleft palate in Mississippi. South Med J 88: 437–442.
Davis, JS (1924). The incidence of congenital clefts of the lip and palate. Ann Surg 80: 363.
Drillien, CM, Ingram, TTS, Wilkinson, EM (1966). The Causes and Natural History of Cleft Lip and Palate. Edinburgh.
Elwood, JM, Little, J, Elwood, JH (1992). Epidemiology and Control of Neural Tube Defects. Oxford: Oxford University Press, pp. 96–101.
Emanuel, I, Culver, BH, Erickson, JD, et al. (1973). The further epidemiological differentiation of cleft lip and palate: a population study of clefts in King County, Washington, 1956–1965. Teratology 7: 271–281.
Emanuel, I, Huang, SW, Gutman, LT, et al. (1972). The incidence of congenital malformations in a Chinese population: the Taipei collaborative study. Teratology 5: 159.
Fitzpatrick, DR, Raine, PA, Boorman, JG (1994). Facial clefts in the west of Scotland in the period 1980-1984: epidemiology and genetic diagnoses. J Med Genet 31: 126–129.
Fogh-Andersen, P (1942). Inheritance of Harelip and Cleft Palate. Copenhagen: Arnold Busck.
Fogh-Andersen, P (1961). Incidence of cleft lip and palate: constant or increasing? Acta Chir Scand 122: 106–111.
Fraser, FC (1970). The genetics of cleft lip and cleft palate. Am J Hum Genet 22: 336–352.
Fraser, GR, Calnan, JS (1961). Cleft lip and palate: seasonal incidence, birth weight, birth rank, sex, site, associated malformations and parental age. Arch Dis Child 36: 420–423.
Garcia-Godoy, F (1980). Cleft lip and cleft palate in Santo Domingo. Community Dent Oral Epidemiol 8: 89–91.
Ghosh, S, Santosh, K, Butani, R (1985). Congenital malformations in a longitudinally studied birth cohort in an urban community. Indian J Med Res 82: 427–433.
Gilmore, SI, Hofman, SM (1966). Clefts in Wisconsin: incidence and related factors. Cleft Palate J 3: 186–199.
Goravalingappa, JP, Nashi, HK (1979). Congenital malformations in a study of 2398 consecutive births. Indian J Med Res 69: 140–146.
Goulet, O, Hochez, J, Berchel, C, et al. (1986). Incidence des malformations congenitales a la naissance dans une maternite guadeloupeenne. Arch Fr Pediatr 43: 507–511.
Grace, GL (1943). Frequency of occurrence of cleft palates and hare-lips. J Dent Res 22: 495.
Gregg, T, Boyd, D, Richardson, A (1994). The birth prevalence of cleft lip and palate in Northern Ireland from 1980–1990. Br J Orthod 21: 387–392.
Gupta, B (1969). Incidence of congenital malformation in Nigerian children. West Afr Med J 18: 22–27.
Gupta, BM, Mathur, HC, Sharda, DC (1971). A study of congenital malformations in central Rajasthan. Arch Child Health 13: 30–36.
Harrison, KA, Rossiter, CE, Ekanem, AD, Chong, H (1985). Child-bearing, health and social priorities: a survey of 22,774 consecutive hospital births in Zana, northern Nigeria. Br J Obstet Gynaecol 5: 81–85.
Hay, S (1971). Incidence of selected congenital malformation in Iowa. Am J Epidemiol 94: 572–584.
Hikita, Y (1953). Incidence of harelip and cleft palate in Nagasaki [in Japanese]. Nagasaki Med J 28: 1371.
Hixon, EH (1951). A study of the incidence of cleft lip and cleft palate in Ontario. Can J Public Health 4: 508.
Hook, EB, Porter, IH (1982). Incidence and prevalence as measures of the frequency of birth defects. Am J Epidemiol 116: 743–747.
Hwang, SJ, Beaty, TH, Panny, SR, et al. (1995). Association study of transforming growth factor alpha (TGFa) TaqI polymorphism and oral clefts: indication of gene-environment interaction in a population-based sample of infants with birth defects. Am J Epidemiol 141: 629–636.
Iizuka, T (1973). High incidence of cleft lip and cleft palate in the human embryos and early fetuses. Okajimas Folia Anat Jpn 50: 259–271.
Ingalls, TH, Taube, IE, Kilingberg, MA (1964). Cleft lip and cleft palate: epidemiological considerations. Plast Reconstr Surg 1–10.
Iregbulem, LM (1982). The incidence of cleft lip and palate in Nigeria. Cleft Palate J 19: 201–205.
Ivy, RH (1962). The influence of race on the incidence of certain congenital anomalies, notably cleft lip-cleft palate. Plast Reconstr Surg 30: 581.
Jensen, BL, Kreiborg, S, Dahl, E, Fogh-Andersen, P (1988). Cleft lip and palate in Denmark 1976-1981: epidemiology variability and early somatic development. Cleft Palate J 25: 258–269.
Kallen, B, Harris, J, Robert, E (1996). The epidemiology of orofacial clefts. 2. Associated malformations. J Craniofac Genet Dev Biol 16: 242–248.
Kamala, KG, Raghavendran, VD, Krishnamurthy, KA (1978). Congenital malformations in the newborn in Madurai. Med Genet India 2: 53–59.
Khan, AA (1965). Congenital malformation in African neonates in Nairobi. J Trop Med Hyg 68: 272.
Khanna, KK, Prasad, LSN (1967). Congenital malformations in the newborn. Indian J Pediatr 34: 63–72.
Khoury, MJ, James, LM (1993). Population and familial relative risks of disease associated with environmental factors in the presence of gene/environment interaction. Am J Epidemiol 137: 1241–1250.
Khrouf, N, Spang, R, Podgorna, T, et al. (1986). Malformations in 10,000 consecutive births in Tunis. Acta Paediatr Scand 75: 534–539.
Kirby, R, Petrini, J, Alter, C (2000). Collecting and interpreting birth defects surveillance data by Hispanic ethnicity: a comparative study. The Hispanic Ethnicity Birth Defects Workgroup. Teratology 61: 21–27.
Kjaskova, B (1973). An epidemiology study of cleft lip in Bohemia.
Knox, G, Braithwaite, F (1962). Cleft lips and palates in Northum-berland and Durham. Arch Dis Child 38: 66–70.
Kobayasi, Y (1958). A genetic study on harelip and cleft palate [in Japanese with English summary]. Jpn J Hum Genet 3: 73.
Kondo, K (1987). Seasonal patterns of birth defects in Japan. Seasonal Effects Reprod Psychoses Prog Biometeorol 5: 133–138.
Kozelj, V (1996). Epidemiology of orofacial clefts in Slovenia, 1973-1993: comparison of the incidence in six European countries. J Craniomaxillofac Surg 24: 378–382.
Krause, BS, Kitamure, H, Ooe, T (1963). Malformations with cleft lip and palate in human embryos and foetuses. Am J Obstet Gynecol 86: 321.
Kromberg, JGR, Jenkins, T (1982). Common birth defects in South African blacks. S Afr Med J 62:
Kulshrestha, R, Nath, LM, Upadhyaya, P (1983). Congenital malformations in liveborn infants in a rural community. Indian Pediatr 20: 45–19.
Kurozumi, S (1963). A genetic study of harelip and cleft palate [in Japanese with English summary]. Jpn J Hum Genet 8: 120.
Leek, I (1969). Ethnic differences in the incidence of malformations following migration. Br J Prev Soc Med 23: 166.
Leek, I (1972). The etiology of human malformations: insights from epidemiology. Teratology 5: 303–314.
Leek, I (1983). Fetal malformations. In: Obstetrical Epidemiology. London: Academic Press.
Leek, I, Lancashire, RJ (1995). Birth prevalence of malformations in members of different ethnic groups and in the offspring of matings between them, in Birmingham, England. J Epidemiol Community Health 49: 171–179.
Lesi, FEA (1969). The significance of congenital defects in developing countries. Med Today 4: 347–353.
Ligutic, I, Barisic, I, Kapitanovic, H, et al. (1997). Eleven years of registration of congenital anomalies in Croatia associated with the EUROCAT international project. Lijec Vjesn 119: 47–53.
Long, S, Robert, E, Laumon, B, et al. (1992). Epidemiologie des fentes labiales et palatines dans la region Rhone-Alpes/Auvergne/Jura. A propos de 903 cas enregistres entre 1978 et 1987. Pediatrie 47: 133–140.
Lowry, RB, Renwick, DH (1969). Incidence of cleft lip and palate in British Columbia Indians. J Med Genet 6: 67–69.
Lowry, RB, Trimble, BK (1977). Incidence rates for cleft lip and palate in British Columbia 1952-71 for North American Indian, Japanese, Chinese and total populations: secular trends over twenty years. Teratology 16: 277–283.
Lowry, RB, Thunem, NY, Uh, SH (1989). Birth prevalence of cleft lip and palate in British Columbia between 1952 and 1986: stability of rates. CMAJ 140: 1167–1170.
Lutz, KR, Moor, FB (1955). A study of factors in the occurrence of cleft palate. J Speech Hear Dis 20: 271.
Master-Notani, P, Kolah, PJ, Sanghvi, LD (1968). Congenital malformations in the new born in Bombay part II. Acta Genet (Basel) 18: 193–205.
Mathur, BC, Karan, S, Vijaya Devi, KK (1975). Congenital malformation in the newborn. Indian Pediatr 12: 179–183.
McMahon, B, McKeown, T (1953). The birth prevalence of harelip and palate related to birth rank and maternal age. Am J Hum Genet 5: 176–183.
McMahon, B, Pugh, TF (1970). Epidemiology: Principles and Methods. Boston: Little, Brown.
Melnick, M, Shields, ED, Bixler, D (1980). Studies of cleft lip and cleft palate in the population of Denmark. Prog Clin Biol Res 46: 225–248.
Menegotto, BG, Salzano, FM (1991). Epidemiology of oral clefts in a large South American sample. Cleft Palate Craniofac J 28:
Milan, M, Astolfi, G, Volpato, S, et al. (1994). 766 cases of oral cleft in Italy. Eur J Epidemiol 10: 317–324.
Mital, VK, Grewal, RS (1969). Congenital anomalies in neonates. Indian J Pediatr 36: 356–365.
Mitani, S (1954). Malformations of the newborn infants. J Jpn Obstet Gynecol Soc 1: 301.
Moller, P (1965). Cleft lip and cleft palate in Iceland. Arch Oral Biol 10: 407–420.
Moller, P (1972). Epidemiological and genetic study of cleft lip and palate in Iceland. Ala J Med Sci 119–136.
Moore, GE, Ivens, A, Chambers, J, et al. (1987). Linkage of an X-chromosome cleft palate gene. Nature 326: 91–92.
Murray, JC, Daack-Hirsch, S, Buetow, KH, et al. (1997). Clinical and epidemiological studies of cleft lip and palate in the Philippines. Cleft Palate Craniofac J 34: 7–10.
Myrianthopoulos, NC, Chung, CS (1974). Congenital malformations in singletons: epidemiologic survey (report from the Collaborative Perinatal Project). Birth Defects 10: 11.
Nair, NS, Mathai, NM (1964). Congenital malformation in the new-born at Calicut—a preliminary report. Antiseptic 61: 823–829.
National Birth Defects Prevention Network (2000). Teratology 61: 86–158.
Natsume, N, Kawai, T (1986). Incidence of cleft lip and cleft palate in 39,696 Japanese babies born during 1983. Int J Oral Maxillofac Surg IS: 565–568.
Natsume, N, Suzuki, T, Kawai, T (1987). Maternal reactions to the birth of a child with cleft lip and/or palate. Plast Reconstr Surg 79: 1003–1004.
Neel, IV (1958). A study of major congenital defects in Japanese infants. Am J Hum Genet 10: 398.
Nishimura, H, Takano, K, Tanimura, T, Yasuda, M (1968). Normal and abnormal development of human embryos: first report of the analysis of 1,213 intact embryos. Teratology 1: 281–290.
Niswander, JD, Adams, MS (1967). Oral clefts in the American Indians. Public Health Rep 82: 807–812.
Niswander, JD, MacLean, CJ, Chung, CS, Dronamraju, K (1972). Sex ratio and cleft lip with or without cleft palate. Lancet 2: 858–860.
Ogle, OE (1993). Incidence of cleft lip and palate in a newborn Zairian sample. Cleft Palate Craniofac J 30: 250–251.
Owens, JR, Jones, JW, Harris, F (1985). Epidemiology of facial clefting. Arch Dis Child 60: 521–524.
Paulozzi, LJ, Lary, JM (1999). Laterality patterns in infants with external birth defects. Teratology 60: 265–271.
Perez-Molina, JJ, Alfaro-Alfaro, N, Angulo-Castellanos, E, Nario-Castellanos, JG (1993). The prevalence and risk factors of cleft lip and cleft palate in 2 hospitals in the city of Guadalajara, Jalisco, Mexico. Bol Med Hosp Infant Mex 50: 110–113.
Rajabian, MH, Sherkat, M (2000). An epidemiologic study of oral clefts in Iran: analysis of 1669 cases. Cleft Palate Craniofac J 37: 191–196.
Rank, BK, Thomson, JA (1960). Cleft lip and palate in Tasmania. Med J Aust 10: 683.
Rintala, AE (1986). Epidemiology of orofacial clefts in Finland: a review. Ann Plast Surg 17: 456–459.
Sato, M (1966). Statistical study on the congenital malformations in Japan. J Jpn Obstet Gynecol Soc 18: 74.
Saxen, I (1975). Epidemiology of cleft lip and palate: an attempt to rule out chance correlations. Br J Prev Soc Med 29: 103–110.
Saxen, I, Lathi, A (1974). Cleft lip and palate in Finland: incidence, secular, seasonal geographical variations. Teratology 9: 217–224.
Sayetta, RB, Weinrich, MC, Coston, GN (1989). Incidence and prevalence of cleft lip and palate: what we think we know. Cleft Palate J 26: 242–248.
Sharma, B, Bajpai, PC, Sharma, NL (1972). Some observations on congenital malformations. Indian J Pediatr 39: 286–292.
Shaw, GM, Croen, LA, Curry, CJ (1991). Isolated cleft malformations in the families of South American oral cleft neonates. J Med Genet 28: 110–113.
Shaw, GM, Wasserman, CR, Lammer, EJ, et al. (1996). Orofacial clefts, parental cigarette smoking, and transforming growth factor-alpha gene variants. Am J Hum Genet. 58: 551–561.
Shija, JK, Kingo, ARM (1985). A prospective clinical study of congenital anomalies seen at Harare Central Hospital, Zimbabwe. Cent Afr J Med 31: 145–149.
Shprintzen, RJ, Singer, L (1992). Upper airway obstruction and the Robin sequence. Int Anesthesiol Clin 30: 109–114.
Singh, M, Sharma, NK (1980). Spectrum of congenital malformations in the newborn. Indian J Pediatr 47: 239–244.
Sivaloganathan, V (1972). Cleft lips in Malaysians. Plast Reconstr Surg 49: 176–179.
Spry, CC, Nugent, MAC (1975). Some epidemiological aspects of clefts of the primary and secondary palate in South Australia, 1949–1968. Aust Dent J 20: 250–256.
Srivastava, A, Bang, RL (1990). Facial clefting in Kuwait and England: a comparative study. Br J Plast Surg 43: 457–462.
Stevenson, AC, Johnston, HA, Stewart, MIP, Golding, DR (1966). A report of a study of series of consecutive births in 24 centers. Bull WHO 34: 1–127.
Stoll, C, Alembik, Y, Dott, B, Roth, MP (2000). Associated malformations in cases with oral clefts. Cleft Palate Craniofac J 37: 41–47.
Stoll, C, Alembik, Y, Dott, B, Roth, MP (1992). Epidemiological and genetic study in 207 cases of oral clefts in Alsace, north-eastern France. J Med Genet 28: 325–329.
Taher, AA (1992). Cleft lip and palate in Tehran. Cleft Palate Craniofac J 29: 15–16.
Tal, Y, Dar, H, Winter, ST, Bar-Joseph, G (1974). Frequency of cleft lip and palate in northern Israel. Israel J Med Sci 10: 515.
Tan, KL (1988). Incidence and epidemiology of cleft lip/palate in Singapore. Ann Acad Med Singapore 17: 311–314.
Tanaka, T (1972). A clinical, genetic and epidemiological study on cleft lip and/or cleft palate. Jpn J Hum Genet 16: 278.
Tandu-Umba, NF, Ntabona, B, Mputu, L (1984). Etude epidemiologique des malformations congenitales visibles en milieu zairois. Gynecol Obstet 79: 131–135.
Tolarova, MM (1987). Orofacial clefts in Czechoslovakia: incidence, genetics and prevention of cleft lip and palate over a 19 year period. Scand J Plast Reconstr Surg 21: 19–25.
Tolarova, MM, Cervenka, J (1998). Classification and birth prevalence of orofacial clefts. Am J Med Genet 75: 126–137.
Tsukamoto, S (1956). In discussion on the malformations [in Japanese]. World Obstet Gynecol 8: 843.
Tsutsui, H (1951). Study on the etiology of clefts of the lip and the palate I. Clinico-statistical observation [in Japanese]. J Dent (Japan) 8: 3.
Tyan, ML (1982). Differences in the reported frequencies of cleft lip plus cleft lip and palate in Asians born in Hawaii and the continental United States (41,474). Proc Soc Exp Biol Med 171:41-45.
United States Bureau of the Census. International Data Base. 2001. http://www.census.giv/ipc/www/ibdnew.html
Vanderas, AP (1987). Social and Biological Effects on Perinatal Mortality. Budapest: WHO.
Verma, IC, Mathews, AR (1983). Congenital malformations in India. (Reprinted from Peoples of India, edited by GV Satyavati. New Delhi: Indian Council of Medical Research, 1983).
Wayne Loretz, MPH, et al. (1961). The study of cleft lip and cleft palate births in California. Am J Public Health 51: 873–877.
Wei, PY, Chen, YP (1965). Congenital malformations, especially anencephalus, in Taiwan. Am J Obstet Gynecol 91: 870.
Womersley, J, Stone, DH (1987). Epidemiology of facial clefts. Arch Dis Child 62: 717–720.
Woolf, CM, et al. (1963). A genetic study of cleft lip and palate in Utah. Am J Hum Genet 15: 209–215.
Wyszynski, DF, Beaty, TH, Maestri, N (1996) Genetics of Non-Syndromic Cleft Lip with or without Cleft Palate Revisited. Cleft Pal CraniofJ 33: 406–417.
Xiao, KZ (1989). Epidemiology of cleft lip and cleft palate in China. Chung Hua I Hsueh Tsa Chih 69: 192–194.
Yi, NN, Yeow, VK, Lee, ST (1999). Epidemiology of cleft lip and palate in Singapore—a 10 year hospital-based study. Ann Acad Med Singapore 28: 655–659.
Zieglowski, V, Hemprich, A (1999). Facial cleft birth rate in former East Germany before and after the reactor accident in Chernobyl. Mund Kiefer Gesichtschir 3: 195–199.
Appendix 12.I. international prevalence figures for oral clefts
|
TABLE 12.IA. International Epidemiology of Oral Clefts—;Europe* |
||||||||||||||||||||||||||||||||||||||||||||||||||||||||||||||||||||||||||||||||||||||||||||||||||||||||||||||||||||||||||||||||||||||||||||||||||||||||||||||||||||||||||||||||||||||||||||||||||||||||||||||||||||||||||||||||||||||||||||||||||||||||||||||||||||||||||||||||||||||||||||||||||||||||||||||||||||||||||||||||||||||||||||||||||||||||||||||||||||||||||||||||||||||||||||||||||||||||||||||||||||||||||||||||||||||||||||||||||||||||||||||||||||||||||||||||||||||||||||||||||||||||||||||||||||||||||||||||||||||||||||||||||||||||||||||||||||||||||||||||||||||||||||||||||||||||||||||||||||||||||||||
|
TABLE 12.IB. International Epidemiology of Oral Clefts—USA and Canada* |
||||||||||||||||||||||||||||||||||||||||||||||||||||||||||||||||||||||||||||||||||||||||||||||||||||||||||||||||||||||||||||||||||||||||||||||||||||||||||||||||||||||||||||||||||||||||||||||||||||||||||||||||||||||||||||||||||||||||||||||||||||||||||||||||||||||||||||||||||||||||||||||||||||||||||||||||||||||||||||||||||||||||||||||||||||||||||||||||||||||||||||||||||||||||||||||||||||||||||||||||||||||||||||||||||||||||||||||||||||||||||||||||||||||||||||||||||||||||||||||||||||||||||||||||||||||||||||||||||||||||||||||||||||||||||||||||||||||||||||||||||||||||||||||||||||||||||||||||||||||||||||||
|
TABLE 12.IC. International Epidemiology of Oral Clefts—Central and South America* |
||||||||||||||||||||||||||||||||||||||||||||||||||||||||||||||||||||||||||||||||||||||||||||||||||||||||||||||||||||||||||||||||||||||||||||||||||||||||||||
|
||||||||||||||||||||||||||||||||||||||||||||||||||||||||||||||||||||||||||||||||||||||||||||||||||||||||||||||||||||||||||||||||||||||||||||||||||||||||||||
|
TABLE 12.ID. International Epidemiology of Oral Clefts—Australia and New Zealand* |
||||||||||||||||||||||||||||||||||||||||||||||||||||||||||||||||||||||||||||||||||||||||||||||||||||||||||||||||||||||||||||||||||||||||||||||||||||||||||||
|
||||||||||||||||||||||||||||||||||||||||||||||||||||||||||||||||||||||||||||||||||||||||||||||||||||||||||||||||||||||||||||||||||||||||||||||||||||||||||||
|
TABLE 12.IE. International Epidemiology of Oral Clefts—Far East* |
|||||||||||||||||||||||||||||||||||||||||||||||||||||||||||||||||||||||||||||||||||||||||||||||||||||||||||||||||||||||||||||||||||||||||||||||||||||||||||||||||||||||||||||||||||||||||||||||||||||||||||||||||||||||||||||||||||||||||||||||||||||||||||||||
|
|||||||||||||||||||||||||||||||||||||||||||||||||||||||||||||||||||||||||||||||||||||||||||||||||||||||||||||||||||||||||||||||||||||||||||||||||||||||||||||||||||||||||||||||||||||||||||||||||||||||||||||||||||||||||||||||||||||||||||||||||||||||||||||||
|
TABLE 12.IF. International Epidemiology of Oral Clefts—Middle East* |
|||||||||||||||||||||||||||||||||||||||||||||||||||||||||||||||||||||||||||||||||||||||||||||||||||||||||||||||||||||||||||||||||||||||||||||||||||||||||||||||||||||||||||||||||||||||||||||||||||||||||||||||||||||||||||||||||||||||||||||||||||||||||||||||
|
|||||||||||||||||||||||||||||||||||||||||||||||||||||||||||||||||||||||||||||||||||||||||||||||||||||||||||||||||||||||||||||||||||||||||||||||||||||||||||||||||||||||||||||||||||||||||||||||||||||||||||||||||||||||||||||||||||||||||||||||||||||||||||||||
|
TABLE 12.IG. International Epidemiology of Oral Clefts—Indian Subcontinent* |
||||||||||||||||||||||||||||||||||||||||||||||||||||||||||||||||||||||||||||||||||||||||||||||||||||||||||||||||||||||||||||||||||||||||||||||||||||||||||||||||||||||||||||||||||||||||||||
|
||||||||||||||||||||||||||||||||||||||||||||||||||||||||||||||||||||||||||||||||||||||||||||||||||||||||||||||||||||||||||||||||||||||||||||||||||||||||||||||||||||||||||||||||||||||||||||
|
TABLE 12.IH. International Epidemiology of Oral Clefts—Africa* |
||||||||||||||||||||||||||||||||||||||||||||||||||||||||||||||||||||||||||||||||||||||||||||||||||||||||||||||||||||||||||||||||||||||||||||||||||||||||||||||||||||||||||||||||||||||||||||
|
||||||||||||||||||||||||||||||||||||||||||||||||||||||||||||||||||||||||||||||||||||||||||||||||||||||||||||||||||||||||||||||||||||||||||||||||||||||||||||||||||||||||||||||||||||||||||||
Appendix 12.II. Time Trends for Oral Cleft Prevalence in Europe
|
TABLE 12.II. Time Trends in Birth Prevalence of Cleft Palate (CP) and Cleft Lip with or without Cleft Palate (CL/P) from Overlapping Time Periods in Consecutive EUROCAT Reports (EUROCAT 1995 = 1980–1992, EUROCAT 1996 = 1990–1994) |
||||||||||||||||||||||||||||||||||||||||||||||||||||||||||||||||||||||||||||||||||||||||||||||||||||||||||||||||||||||
|
||||||||||||||||||||||||||||||||||||||||||||||||||||||||||||||||||||||||||||||||||||||||||||||||||||||||||||||||||||||
Appendix 12.III. Birth Prevalence of Oral Clefts in Selected U.S. States
|
TABLE 12.III. Birth Defect Surveillance Data from Selected U.S. States, 1989–1996* |
||||||||||||||||||||||||||||||||||||||||||||||||||||||||||||||||||||||||||||||||||||||||||||||||||||||||||||||||||||||||||||||||||||||||||||||||||||||||||||||||||||||||||||||||||||||||||||||||||||||||||||||||||||||||||||||||||||||||||||||||||||||||||||||||||||||||||||||
|
||||||||||||||||||||||||||||||||||||||||||||||||||||||||||||||||||||||||||||||||||||||||||||||||||||||||||||||||||||||||||||||||||||||||||||||||||||||||||||||||||||||||||||||||||||||||||||||||||||||||||||||||||||||||||||||||||||||||||||||||||||||||||||||||||||||||||||||