Elizabeth Lee Daugherty
David Shade
Henry E. Fessler
The sophistication of bedside intensive care unit (ICU) monitoring equipment and the precision of its displayed values may tempt clinicians to accept these data without question. However, critically ill patients place substantial demands on these measurement technologies. Although the technology is governed by rigorous industry standards, it is not foolproof. To ensure accuracy and recognize and correct sources of error, the practicing intensivist must be aware of key technical aspects of pressure transduction.
This chapter reviews the basic principles of vascular pressure measurement, including principles of wave transmission, transduction, signal processing, and recording. Clinical aspects of measuring vascular pressure, such as its indications and interpretation of findings, are covered in other chapters. The goal of this chapter is to equip the practicing clinician to select the appropriate measurement tool, optimize its performance, and recognize and correct its shortcomings.
Wave Transmission
The technical demands for recording an accurate systemic or pulmonary arterial pressure are much more stringent than for venous pressures. In order to discern fine details within a venous pressure, such as the a and v waves, high fidelity is needed, but even a simple water manometer can measure a central venous pressure. Therefore, this chapter will focus on the measurement of arterial pressure.
Cardiac contraction generates a pressure wave that travels at wave speed, much faster than the propulsion of the stroke volume through the arteries. This pressure wave must travel down the arterial tree and through a catheter, stopcocks, tubing, and a flush device, until finally terminating at the transducer. The pressure wave signal is invariably altered along the way. Modifications that are due to vascular characteristics often convey important biologic information. However, other modifications may be introduced by the external connecting tubing, catheters, and stopcocks. These changes can obscure important findings or mislead the clinician. These external connections are usually the weakest link between the patient and the bedside monitor, and every effort should be made to minimize the degradation of the signal occurring between the blood vessel and the transducer. Some familiarity with the vocabulary and physics of wave transmission is necessary to discuss how this goal can be achieved.
Natural Frequency
A pressure wave travels down the conducting tubing and deflects the transducer diaphragm, which rebounds and generates a reflected wave. When this reflected wave reaches the tip of the catheter, another reflected wave travels back toward the transducer. The oscillatory behavior of this system is determined by certain physical properties of its components (1,2,3,4). The natural frequency (fn) of a system is the frequency at which a signal, such as a change in pressure, will oscillate in a uniform, frictionless tube. This frequency is measured in hertz (Hz), cycles per second. As will be seen, a higher fnis desirable in a high-fidelity measuring device. Natural frequency decreases with increasing tube length, since at any given wave speed, a round trip in a longer tube simply takes more time. Natural frequency increases with wave speed, which in turn increases with tube radius and tube wall stiffness and decreases with the density of the conducting medium (5). Thus, short, wide, rigid tubing; a stiff transducer; and dense conducting media (e.g., saline rather than air) yield a higher fn.
Damping
Pressure waves would reverberate forever in the absence of friction. However, friction is present in the pressure monitoring system due the movement of the waves in the conducting tubing. Although there is no net flow in the system, minute amounts of the medium shift to and fro during wave transfer. The friction generated by the movement of the conducting medium decreases the amplitude of the reflected wave, or damps it. Stiffer transducer diaphragms and stiffer conducting tubing will result in less damping since smaller volumes are required to displace them. Damping is also influenced by the mass of the conducting medium since wave transmission requires acceleration and deceleration of that medium. Finally, tubing resistance, which impedes the minute amount of reciprocative flow needed for pressure wave transmission, causes dissipation of energy from the pressure wave and increases damping. The damping coefficient, zeta (ζ), is therefore calculated from the determinants of mass of the system, the tubing's length and radius, the density of the conducting medium, and the resistance of the system as calculated from Poiseuille's Law:

where E = stiffness coefficient of the transducer and tubing (ΔP/ΔV), ρ = density of conducting fluid, µ = viscosity of conducting fluid, r = tube radius, and L = tube length. Note that both natural frequency, fn, and damping, ζ, are influenced by some of the same factors, but in opposite directions.
Since friction and inertia cannot be eliminated in real systems, one cannot measure the undamped fn of a pressure wave but instead measures the wave's damped natural frequency, fd. The fd and ζ define the performance capacity of a catheter–tubing–transducer system, which must be adequate to accommodate the signal it is transducing, the pulse.
|
|
|
Figure 16.1. A device for bench testing the frequency response of pressure transducers and tubing. A pump generates a sinusoidal pressure through a range of frequencies. These are applied simultaneously to a high-fidelity reference transducer and the test transducer–tubing system. The output from the test transducer increases to a maximal amplitude at its natural frequency, designated F. |
The complex pulse wave is composed of a group of simple sine waves of varied amplitude and frequency. The highest-amplitude sine wave component of the pulse wave has a frequency equal to the heart rate. The pulse wave is reproduced by summing this component and a series of harmonics, each with a smaller amplitude and a frequency that is some multiple of the primary frequency (second harmonic = 2 × primary frequency, etc.). Combining the first six to ten harmonics results in a close representation of the actual pulse contour. Thus, a recording system must be able to capture a frequency at least six to ten times the pulse rate with good fidelity to be able to faithfully record an arterial pressure tracing.
When the frequency of the harmonics that contribute meaningfully to the contour of the pulse wave approach the fd of the recording system, considerable errors can occur. This effect is analogous to pushing a pendulum at its fd, where a small, well-timed repetitive push can cause a large amplitude oscillation. The effect of this phenomenon in a transducer system can be demonstrated using a test system like that illustrated in Figure 16.1. A pressure wave of a given amplitude is generated and simultaneously recorded by a high-fidelity reference transducer and by the tubing–transducer system being tested. As the range of pressure wave frequencies is varied, one can observe and compare the output recorded by both devices. The amplitude of the test transducer peaks at its damped natural frequency, when the input wave frequency is perfectly in phase with the reflected wave oscillating in the transducer system. Because adequate measurement demands that fd exceed the pulse rate by six to ten times, to appropriately record pressure in a patient with a pulse of 120 (2 Hz; Hz = heart rate/60), fd should exceed 12 to 20 Hz. Transducer–tubing systems commonly found in clinical use often meet this criterion by only a narrow margin (6).
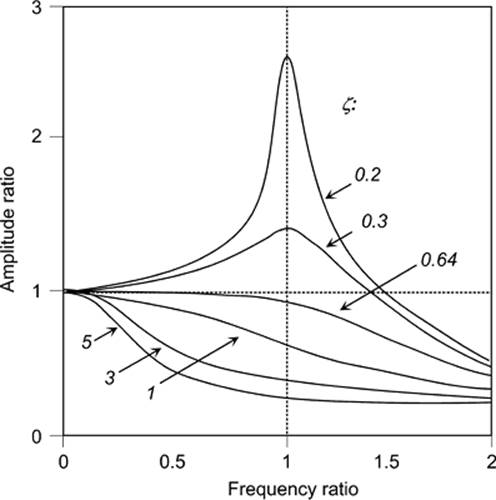
In the same way that a pendulum pushed at its fn in the absence of friction would spin continuously around its axis, a completely undamped transducer stimulated at its fn would record a pressure of infinite amplitude. The relationship between the amplitudes of output and input signals is expressed in the amplitude ratio. When the amplitude ratio equals one, the transducer is reproducing the wave exactly. When it is greater than one, the transducer is amplifying the wave, and when it is less than one, the wave is being damped. Standard engineering equations can be used to calculate the amplitude ratio and the effects of different degrees of damping at varying frequencies, as is illustrated in Figure 16.2. In this figure, frequency ratios represent the relationship between the input frequency and the damped natural frequency of the system. When the frequency ratio equals one, the input wave is at exactly the transducer's natural frequency. In a system with little damping (low values of ζ), one sees a significant rise in the amplitude ratio when input frequencies approach fd. When a system is “overdamped,” the recorded system output drops significantly below the true amplitude at frequencies that are well below the natural frequency. Critical damping is the least amount of damping resulting in an amplitude ratio no greater than one and an output signal that is never amplified (7).
|
|
|
Figure 16.2. Effects of damping on transducer output. The frequency ratio is the ratio between the frequency at which the transducer is being stimulated and its natural frequency. The amplitude ratio is the ratio between the amplitudes of input to output signals. Different degrees of damping, zeta (ζ), are shown. With little damping, the output greatly amplifies the input over a wide range of frequencies and reaches maximum at the natural frequency. With extensive damping, the output amplitude falls at relatively low frequencies. At ζ of approximately 0.64, damping is critical (i.e., this is the lowest ζ where the amplitude ratio never exceeds one). However, this damping does not yield the broadest usable bandwidth. If one considers an amplitude ratio from 0.85 to 1.15 as reasonably accurate, then a ζ of 0.4 to 0.5 provides a greater bandwidth. This would mean that harmonics near the natural frequency would be amplified by up to 15%, and above the natural frequency they would be attenuated. However, if the natural frequency is high enough relative to the wave being studied, this will still yield acceptable accuracy. |
When choosing the ideal damping for a clinical transducer system, one targets the level of damping that extends the usable frequency range or band width to the greatest degree. The most useful damping for a clinical transducer system is less than critical damping, or slight underdamping. Although the amplitude ratio is slightly greater than one near fd (6,8), the amplification of the highest-frequency harmonics of a pulse wave does not generally result in clinically important errors.
There is an important relationship between the fd and ζ necessary to accurately record a vascular pressure. If the fd is well above six to ten times the pulse, the system can accurately reproduce that wave over a wide range of zetas. High harmonics that will be distorted are of such minute amplitude that their amplification or attenuation will not distort the reproduced wave. Conversely, when fd approaches important frequencies in the pulse wave, the values of ζ that allow for high fidelity recording are more limited. Gardner evaluated this relationship in a variety of commercially available transducers and found many of those systems to be barely adequate for pressure measurements in those critically ill patients with tachycardia and a hyperdynamic heart (6). Further, pulmonary artery waveforms have more high-frequency components than do systemic arterial waveforms. For this reason, careful selection of fd and ζ are especially important in systems intended to measure pulmonary pressures, where any small errors may be clinically significant.
Standardized industry guidelines (9) ensure that the transducers themselves are appropriate for ICU use. Either the transducer's fd or its usable bandwidth will be listed in the technical specifications. Bandwidths are generally described in terms of Hz either as “flat to X Hz,” or “+/– 15% to X Hz,” indicating little distortion in the amplitude ratio up to the designated frequency. Guidelines require a frequency response range up to 200 Hz for typical external strain gage pressure transducers (9), and catheter tip micro transducers may have a useable bandwidth up to 20,000 Hz (10,11).
Transduction
Transducer Properties
For our purposes, transduction is the conversion of a pressure signal to an electrical one. Accurate conversion of signals requires several key system characteristics, including stability, linearity, adequate frequency response, lack of hysteresis, and freedom from noise.
Stability implies that the characteristics of the system remain constant over time. Both a system's gain and its baseline may be influenced by instability, or drift, resulting in errors. Baseline refers to the electrical signal corresponding to atmospheric pressure, and gain is the relationship between a change in pressure and a change in electrical signal. If the baseline of a system drifts from a pressure of zero to 10 mm Hg, the application of 100 mm Hg would be recorded as 110. In this case the applied pressure is measured accurately, but the starting point requires correction. If the gain has drifted, the starting point is correct, with a zero reading being equal to atmospheric pressure, but application of 100 mm Hg would result in an incorrect electrical signal measuring 110 mm Hg. A change in baseline is more easily detected and corrected, by rezeroing the transducer, than is instability in gain.
Linearity indicates that electrical output remains linearly proportional to input throughout the range of measurement. Linear signals can be calibrated with few data points and linear amplifiers for such signals are relatively easy to design. With computer-based signal processing, linearity has become less important. Although most unprocessed output of pressure transducers is nonlinear, this problem may be corrected either through electronic processing or by setting the limits of a transducer's useable range to include only its most linear portion.
Frequency response describes a system's outputs in response to input signals of varying frequencies, usually in terms of amplitude distortion and phase distortion. Amplitude distortion refers to a change in the output ratio at different frequencies, as previously described. Phase distortion refers to the phase shift between input and output pressure waves that results from time lag. For example, the pulse displayed on the bedside display lags behind cardiac contraction by the momentary time it took for the pulse to travel down the arterial tree and external tubing. A constant phase shift is not problematic, as long as correction is made for this phenomenon when attempting to precisely synchronize events such as the electrocardiogram (ECG) and pulse. However, phase shift can be a significant problem in systems that cause different degrees of shift for inputs of varying frequency. Such a system would allow a different, frequency-dependent phase shift for the various components of a complex biologic wave and would produce a slurred output waveform.
Transducers should be free of hysteresis, in which the output signal varies with the system's recent history. That is, as it passes through the same pressure, a system with hysteresis will indicate a different value on the way down than on the way up. This characteristic would distort instantaneous recording of pulsatile signals.
Finally, a transducer should also introduce minimal noise. Both mechanical and electrical noise may influence vascular pressure measurement. Interference from patient movement, mechanical ventilation, fluorescent lighting, and nearby electronics should be minimized as much as possible.
Transducer Design
Several authors have reviewed the theory of transducer design (1,2,4,12,13). Manufacturers have utilized varying ways to address the four elements of transducer design we have discussed above. The most commonly used design is known as a Wheatstone bridge. This design uses four strain sensors whose resistance changes when they are stretched or compressed. The bridge is designed such that all resistances are equal when no strain is applied to the transducer. When pressure is applied, two of the resistors are stretched and the others are compressed. The measured pressure is determined from the resulting imbalance of resistance between the pairs of resistors.
The strain sensors of most clinical transducers are etched from silicon. With this technology, transducers can be inexpensive enough to make them appropriate for single use. This decreases processing costs and also limits their potential role in nosocomial infection. The transducers are durable and small, require minimal power and simple electronics, and are manufactured with a degree of uniformity that eliminates the need for tedious manual calibration of each transducer (14). Silicon's substantial changes in resistance with minimal changes in length give these strain gauges a high degree of sensitivity (15). This small requirement for volume displacement optimizes fd and ζ. The Association for the Advancement of Medical Instrumentation and the American National Standards Institute have published manufacturing standards that dictate accuracy and safety characteristics for clinical transducers (9).
The Tubing System
Tubing
Although the fidelity of recorded pressures cannot exceed the capabilities of the transducer, performance is usually degraded below that optimal potential by other components between the transducer and the patient. Therefore, the most accurate waves can be recorded from micro-transducer–tipped catheters that are inserted directly in a blood vessel. For external transducers, every element added between the blood vessel and the transducer is a potential problem. The problems are minimized by designs that reduce ζ or increase fd. Because damping is proportional to resistance, smaller intravascular catheters (16), clot, or kinking of the catheter will increase damping. Because the mass of fluid in the catheter also increases damping, catheter and tubing length should be minimized. Longer tubing systems have decreased fd and reduce the usable bandwidth. Thus, if very long connecting tubes are used between the patient and transducer, more errors are likely than if the transducer is in close proximity to the blood vessel (17). Wave speed increases in stiffer tubes, so compliant tubing will also decrease fd (12,16,18). Because air is compressible, bubbles increase the compliance of the system, both increasing damping and decreasing fd. As an extreme illustration of this phenomenon, removing microscopic air bubbles by boiling the liquid used to fill the connecting tubing can double the fd of a transducer system (8). Warmer room temperature can also alter fd by softening tubing and expanding air bubbles (19).
Flush Systems
In the flush device, resistance reduces high pressure in the flush bag to <1 mm Hg at the transducer, while maintaining a continuous flow of solution to prevent clots (20,21). Depressing a lever or plunger bypasses the resistance, exposes the transducer to a square wave of pressure, and generates rapid flow into the patient. This can displace small clots or, as will be seen, can be used to test the intact recording system. Drip chambers should not be used in the tubing from the flush bag, or should be purged of air prior to use to eliminate risk of air embolization from turbulence during rapid flushes (21,22). Air dissolved under pressure in the flush bag can also form bubbles when decompressed in the tubing downstream from the flush device (19). These gradually collect and coalesce at stopcocks or connections and can impair the fidelity of recorded waveforms.
Signal Processing
Electronic Filtration
Transducer output may be electronically filtered to minimize noise, electrical interference, respiratory artifact, and other sources of error. Filtering can be applied either to the raw electrical signal with electronic circuits or after digital conversion with computer algorithms. Forms of filtration include low-pass filters, which attenuate high-frequency components; high-pass filters, which attenuate low-frequency components; and band-pass filters, which allow a frequency range to pass unaltered and attenuate frequencies surrounding the band. Filters can vary in their cutoff frequencies, their extent of attenuation, and the sharpness of the transition from passage to blockage.
By first separating a pulse wave into systolic and diastolic portions, different filters may be applied to the regions to suit each component's anticipated characteristics. Although the manufacturer specifies a default set of filters, the clinician may select other options based on observation of the waveform. If the catheter–tubing–transducer combination has fd that is sufficient for the measured waveform, a low-pass filter with a cutoff frequency just below fd will attenuate excessive high-frequency noise without distorting the true waveform. Such selective filtering, like appropriate mechanical damping, extends the usable bandwidth.
Analog-to-digital Conversion
Electrical transducer output is transmitted to a digital computer for further processing, analysis, recording, and display. Digital processors are binary devices, meaning they only recognize the absence or presence of a voltage level, as designated by a 0 or 1. The total number available to a binary device is equal to 2n, where n is the number of digit positions. Each digit position is referred to as a “bit.” Thus, an eight-bit quantity, a byte, can assume 256 different values (28 = 256).
To process an electrical signal, a computer must convert the voltage to a number, analog-to-digital (A/D) conversion. The analog input voltage may assume any of the infinite continuous values within its range, such as 0 to 5 volts. The digital output, however, must be a discrete number whose possible output values are finite and depend on the A/D converter resolution. A/D converter resolution is specified in bits. Thus, an 8-bit A/D converter's output must assume 1 of just 256 possible values, while the output of a 12-bit converter may assume any 1 of 4,096 values (212 = 4,096).
The input voltage is linearly mapped to the output numbers. An 8-bit A/D converter with an input of 0 volts will therefore have an output of 0, 2.5 volts will convert to an output of 128, and 5 volts an output of 256. Each different value of the A/D converter's output represents a range of (5.00/256) or 19.5 millivolts. Any voltage falling within a range of 19.5 millivolts is rounded up or down to the nearest digital output value. If the full-range input voltage is calibrated to represent 0 mm Hg to 300 mm Hg (so that 0 volts = 0 mm Hg and 5 volts = 300 mm Hg), then the finest resolution of the A/D converter is 1.2 mm Hg. This resolution can be increased by increasing the bits in the output. A 12-bit A/D converter with a 0- to 300-mm Hg pressure transducer has a resolution of 0.07 mm Hg (212 = 4,096; 300/4,096 = 0.073). The A/D resolution sets the resolution limit for the displayed waveform and any derived pressures calculated after conversion. However, even an eight-bit converter should be adequate for most clinical decisions.
The digitization process is also influenced by the sampling rate. The continuous analog transducer voltage output is sampled as a series of “snapshots,” reducing the digital output signal to a series of points. The points are constrained in the y plane, pressure, by the A/D resolution. They are also constrained in the x plane, time, by the sampling rate. If one represented a circle using increasing numbers of dots, three equidistant dots would look like a triangle; four like a square; five like a pentagon. As more dots are added, the representation will look increasingly circular. Analogously, a sufficient sampling rate of an input waveform is essential to adequately represent the wave in digital form. Representation of a sine wave of frequency f requires sampling at a frequency of 2*f, known as the Nyquist sampling rate. Complex waveforms like the pulse must be sampled at a frequency at least twice that of the highest-frequency component of interest. For a pulmonary arterial pressure input whose highest significant frequency components can reach 20 Hz, an A/D converter must sample at a minimum of 40 Hz. After sampling, curve-fitting algorithms are also applied to reduce the potentially jagged appearance of a wave on the bedside display.
Digital Display
The pressure waveform is processed further to display parameters such as systolic pressure, mean pressure, or pulmonary artery occlusion pressure as numerical values. This software has substantially evolved and improved. Early digital displays simply used the highest and lowest pressures within a certain time window as systolic and diastolic. They displayed values that fluctuated erratically with minor patient or transducer movement. Later electronics timed the calculation of systolic and diastolic values to the ECG. This change reduced sensitivity to random artifact, but still captured substantial beat-to-beat variation. Low-pass filtering of the analog signal was added to obtain mean pressure. Alternatively, the digitized values within a time window including several complete heart beats may be averaged (a moving average). The window duration and filtration frequency represent a compromise between rapid response to sudden changes and stability of the displayed values. Short windows produce more variability and more false monitor alarms, while long windows may delay the recognition of important changes. More complicated algorithms can be used to select the peak systolic and nadir diastolic values and display their moving averages.
Simple averages or ECG-gated values, however, do not anticipate known sources of error. Vascular pressures change physiologically with the respiratory cycle. Vascular pressure measurements recorded within the thorax, such as pulmonary artery pressure, vary due to the changes in pleural pressure and respiration-induced changes in vascular filling. In vessels with low pressures, and particularly when pleural pressure changes are exaggerated due to disease or effort, the respiratory variation may confound clinical decisions. As a reflection of the state of cardiac filling, one is generally interested in the transmural pressure of intrathoracic vessels. However, the pressure on their surface is usually unmeasurable. Therefore, by convention, these vascular pressures are measured at end-expiration. Barring significant recruitment of expiratory muscles, pressure on the surface of vessels within the thorax is likely to be close to atmospheric pressure at end-expiration. For systemic arterial pressures, this rationale is less compelling. Mean arterial pressure, integrating pressures through the respiratory cycle, represents the average pressure driving arterial flow. Nevertheless, systolic and diastolic arterial pressures are also conventionally recorded at end-expiration.
More advanced processing algorithms attempt to display digital values timed to end-expiration. Simply searching for the highest or lowest value within a time window (e.g., highest systolic value) is insufficient, because the phase difference between the respiratory cycle and the associated changes in vascular pressure differs when the patient is on positive pressure ventilation or breathing spontaneously. That is, pleural pressure falls during spontaneous ventilation, rises during positive pressure ventilation, and changes biphasically during assisted ventilation. The highest systolic value will occur at end-expiration in the spontaneously breathing patient but not in patients on other modes.
Therefore, more complicated logic is necessary. The waveform is divided into individual beats, and separate filters are applied to systolic and diastolic phases and the mean pressure to reduce artifact. Systolic, diastolic, and mean pressures are calculated individually for each cardiac cycle. A weighted moving average is then computed, in which each heartbeat contributes to the average in inverse proportion to its variance from the previous average. For example, a systolic pressure from a heartbeat that is close to the average systolic pressure is weighted more heavily than one that is far from the previous average. This yields approximately end-expiratory values as follows: Inspiration is generally more rapid and of shorter duration than expiration. Therefore, vascular pressures under the influence of pleural pressure will change rapidly during inspiration, and slowly during late expiration. The algorithm weights the calculated pressure toward the slowly changing, end-expiratory values. Note, however, that this logic will fail with patients receiving inverse ratio ventilation and patients with both rapid respiratory rates and slow heart rates. For the measurement of pressures where accuracy is critical (such as the pulmonary artery wedge pressure), one should not rely on the displayed numerical pressure. End-expiration must be determined by inspecting the patient, and the simultaneous pressure measured directly from the waveform. An electronic cursor, placed manually or automatically and inspected for proper positioning, should be used to ensure end-expiratory values.
Troubleshooting
Simplicity and uniformity in transducer and catheter setup is key to minimizing opportunity for errors. Tubing should be stiff tubing designed for pressure monitoring, used with a minimum length and few stopcocks and connectors.
Zeroing
A common source of error is the zero reference level for pressure measurement. All pressures are measured relative to the horizontal plane at which the transducer is set to zero. When the transducer is connected to a fluid-filled catheter, any hydrostatic pressure imposed by the catheter will be sensed by the transducer. The recorded pressure will rise as the transducer is lowered, and vice versa. This continues to occur when the catheter is attached to a patient.
Most agree that vascular pressure should be referenced to the level of the heart; that is, the recording system should read zero pressure when the open end of a transduced fluid-filled tube is held at the horizontal plane of the heart. The optimal external anatomic landmark representing this plane remains a subject of debate. Many suggest the midaxillary line (23,24), but others have recommended estimation of the uppermost boundary of the heart (25). For simplicity and uniformity, the midaxillary line is best for general use. More complicated systems invite errors in practice, even if their perfect application could theoretically improve accuracy.
This anatomic reference level should be on the same horizontal plane, not of the transducer diaphragm, but of the port or stopcock that is opened to atmospheric pressure when the electronics are zeroed. The transducer itself could be in any convenient location. The amplifier will add or subtract the hydrostatic pressure of the fluid between the zero point and transducer. After zeroing, however, the height of the transducer relative to the zero level must remain fixed. For this reason, the zero reference level should be dictated by a unitwide policy, and proper zero positioning should be confirmed prior to recording vascular pressure. If the transducer height moves, the zero reference level will change, resulting in erroneous readings. A parallel change in all the vascular pressures measured with the same transducer (e.g., central venous, pulmonary arterial, and wedge pressures), in a clinically stable patient, suggests a change in transducer level.
One simple way to provide consistency is to secure the transducer to the patient's arm near the heart and zero it using the port molded into the transducer body. This will allow fewer errors than attaching the transducer to an IV pole, in which case elevating the bed or sitting the patient up will change his or her horizontal relationship to the zero point. However, rezeroing to the cardiac level will be needed when patient orientation is changed (such as lateral decubitus or prone positions). Care must also be taken that the transducer has not rotated to a dependent position on the arm, or slipped to the elbow in a patient who is anything but completely flat.
Calibration
Modern disposable transducers are generally accurate to ±3% (26) and do not require calibration. Transducer accuracy can be compromised by mechanical trauma, overpressurization during assembly, or fluid entry on the ambient pressure side of the transducer diaphragm. Accuracy of a clinical transducer can be verified by calibration against a mercury manometer. For older, expensive, reusable transducers, this step was essential, since the gain had to be adjusted for each transducer. Most contemporary bedside monitors do not even allow gain adjustment, and an inaccurate transducer is best simply replaced.
Testing the Frequency Response
Intensive care units, operating rooms, and other monitoring settings combine various components from various manufacturers into their systems for vascular pressure measurement. The parts may vary between units or perhaps even from patient to patient or nurse to nurse, and will change as suppliers change over time. The performance specifications of individual components such as transducers and amplifiers are provided in their user manuals, but the performance of the integrated system is usually untested.
Fortunately, the catheter–tubing–transducer system allows simple bedside study. By using the flush device, one can apply a near square-wave pressure signal, and the features of the recorded output can be examined. When the flush device resistor is bypassed, a high-pressure signal is produced, which goes off-scale on the bedside monitor. When the lever is released, however, a square-wave low-pressure signal is generated, which falls within the range of the display. Proper functioning is indicated when this signal rapidly reverberates a few times and then decays back to the underlying vascular pressure.
If one records the effects of such a fast flush, those results may also be assessed quantitatively. The time between peaks of the oscillating signal is the roundtrip travel time of the pressure wave to the catheter tip and back. It is equal to 1/fd. The decrease in amplitude of consecutive oscillations is from damping. ζ can be calculated from the amplitude ratio of consecutive oscillations A1 and A2 (1,6):
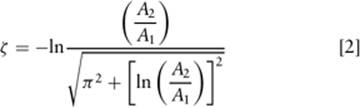
Using this equation, clinical engineers can evaluate their hospital's complete catheter–transducer subsystem. A related bench technique uses a “pop test,” in which a balloon attached to a transducer and catheter system is popped with a needle to produce the square wave of pressure. The Association for the Advancement of Medical Instrumentation publishes a comprehensive manual to guide the evaluation of pressure transducer systems by clinical engineering departments (19).
Overdamping Errors
Overdamping is a common problem that causes errors in the measurement of systolic and diastolic pressure. Overdamping is suggested during a bedside flush test by a gradual pressure decay or an undershoot and slow return to baseline without any oscillation (27). The effect of overdamping on the waveform is to first cause the wave to lose details such as the dicrotic notch and a brisk systolic upstroke, or the a, v, and c waves of a venous pressure. With more damping, the wave will appear sinusoidal, systolic pressure will fall, and diastolic pressure rise toward the mean arterial pressure. Even with extreme overdamping, the mean pressure remains accurate.
Numerous problems in the catheter–tubing–transducer subsystem can cause overdamping. These include air bubbles, blood clots or fibrin within the catheter or tubing, catheter tips abutting a vessel wall, or kinks or partially closed stopcocks. Flushing or changing the tubing and obsessively purging air bubbles solves many overdamping problems. If the damped waveform is associated with kinking or thrombosis of the catheter, poor blood return, or sensitivity to minor catheter movement, it may need replacement.
Underdamping Errors
In tachycardic, hyperdynamic patients, excessive oscillation may be apparent in the pulse recording, especially at peak systole. This problem occurs when important harmonics of the pulse approach the transducer system's fd. Underdamping causes systolic and diastolic pressure to be over- and underestimated, respectively. The excessive oscillations will also interfere with the algorithms used to calculate a digital display of systolic and diastolic pressure. Even manual estimation of these pressures from the bedside oscilloscope or printed record is inaccurate, since the pulse pressure is exaggerated.
The characteristics of the transducer system can be studied and optimized to reduce underdamping errors. During observation of a fast flush, oscillations that are widely spaced indicate a low fd, which may poorly suit a patient whose pulse is dynamic with upper harmonics of high amplitude. Natural frequency is reduced by lengthy or compliant tubing or by bubbles. Removing unneeded tubing extensions and diligently clearing bubbles will bring the flush test oscillations closer together, and the waveform will show more detail with greater accuracy.
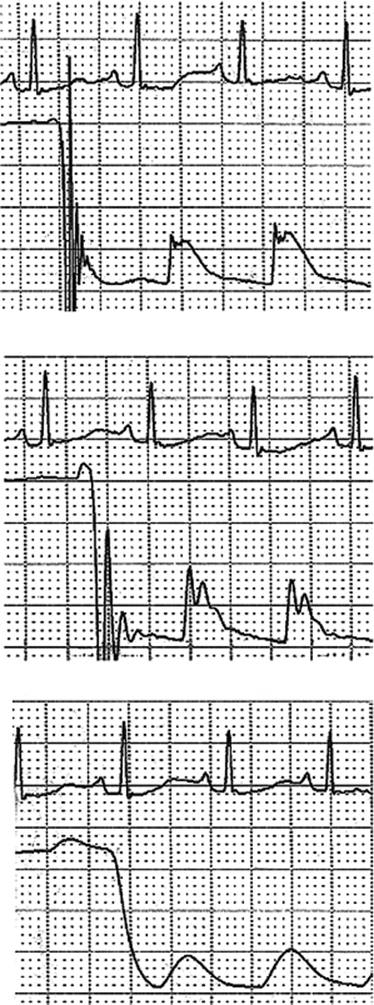
The reverberations in the pulse can be smoothed away by injecting a tiny bubble of air into the transducer or catheter. However, this practice is not recommended. While the air bubble will increase the damping, it also decreases fd. The waveform will be made to appear more normal, but may be no more accurate. If larger bubbles are introduced, the excessive damping causes the pulse pressure to narrow toward the mean arterial pressure. The effects of adding a bubble of increasing size on a flush test and arterial pressure tracing is shown in Figure 16.3. Note that a small bubble (middle panel) yields a wave that looks appropriate, but the widely spaced oscillations after the fast flush indicate the reduced fd.
One would like to increase the damping of the system without decreasing its natural frequency. This effect can be achieved by reducing the amplifier high-pass filtration frequency just enough to eliminate the reverberations, as is outlined in most monitoring equipment user's manuals. Too much electronic damping will degrade the waveform just as would excess mechanical damping. Filtering should generally not be reduced below 12 Hz to avoid removing the higher-order harmonics contributing to the systolic waveform. There are also mechanical devices that attach to a stopcock near the transducer and increase damping. These devices are designed to match the transducer impedance to that of the tubing, decreasing wave reflections without altering fd (6,12).
Artifact that appears similar to underdamping can also occur when long, flexible catheters are vibrated by high-velocity blood flow, termed “catheter whip.” This phenomenon should be suspected when long intravascular catheters are used in high-flow vessels of much larger diameter, such as long femoral or pulmonary artery catheters. Contributions of underdamping to the waveform appearance can be ruled out by inspecting the fast flush and optimizing the external tubing system. Artifact due to movement of the catheter tip is difficult to eliminate. In the pulmonary artery, stabilizing the catheter tip by inflating the balloon to measure a pulmonary artery occlusion pressure will remove the “whip.” Measurement of mean pressures will also remain accurate.
|
|
|
Figure 16.3. Effects of adding a bubble of increasing size to a transducer–catheter system recording an arterial pressure waveform and recording of a “fast flush.” The upper panel shows the waveform with no bubble. The flush oscillates rapidly, and the pulse shows a brisk hyperdynamic upstroke and slight overshoot. In the middle panel, a small (<0.1 mL) bubble decreases the natural frequency of the system. This is shown by the wider spacing of the oscillations following the fast flush, and increases the peak systolic overshoot. The bottom panel shows the effects of a slightly larger bubble. The return from the flush is now delayed and does not oscillate, and the pulse waveform is lacking in detail with a reduced amplitude. |
Future Directions
Fifty years of engineering refinement have produced transducers that are many times more accurate than needed for most clinical decisions in critical care medicine. Basic knowledge of the physics of wave transmission and transduction and thoughtful bedside setup and inspection will minimize artifact. Further, simple, uniform protocols and education can reduce human errors. Once there steps are achieved, improved invasive vascular pressure measurement will not require greater accuracy in signal acquisition.
Instead, technical innovation is needed in data management. Enormous amounts of data are collected by bedside monitoring systems in the form of trend records. However, spurious values are recorded along with accurate ones. A nurse or doctor can easily recognize and discard such values (e.g., a pressure recorded while a stopcock is closed to draw blood, or while a patient is moving). However, it is a complex computational task to program this into a computer, and this field is in its infancy (28).
Another aspect of data management in need of innovation is alarms. Vascular pressure monitoring systems are only one of numerous sources of alarms in ICUs. Other sources include the ECG, oximetry, ventilators, infusion pumps, and virtually all mechanical devices at the patient's bedside. In a recent quality improvement review of alarm data from a 15-bed intermediate care unit in our hospital, an astounding 27,000 alarms were recorded in a 24-hour period. Furthermore, this number excluded equipment not monitored centrally (e.g., excluded were ventilators, infusion pumps, and bed alarms).
Over 90% of ICU alarms are either false alarms or of no clinical significance (29,30). The rest are a major source of ambient noise and distract nurses from true alarms requiring intervention (28,31). Current alarm technology is simplistic. An alarm is triggered whenever a parameter falls above or below an acceptable range. On the other hand, clinically important trends do not trigger alarms until they fall outside of the range. Trend-based alarms (32) or use of artificial intelligence algorithms may someday improve the specificity of alarms (28).
Summary
Invasive measurement of vascular pressure has become commonplace in the care and monitoring of the critically ill. However, decisions based on inaccurate or misleading information could prove costly. Simple, consistent setups that respect the physics of wave transmission will minimize errors. Critical evaluation of the quality of these data and recognition of the limitations of the technology will allow the clinician to optimize pressure recording fidelity.
Pearls
· Natural frequency is the frequency at which a wave oscillates in a tubing system.
· Damping is the attenuation of a wave due to friction.
· Natural frequency and damping characteristics set the performance limits of a system of a transducer and all its attached tubing and connectors.
· The pulse is a complex waveform whose accurate recording requires a system with adequate natural frequency and damping.
· Clinical pressure recording systems are optimized with proper setup, flushing, and zeroing.
· Use of the fast-flush device on a pressure transducer can diagnose potential sources of error.
References
1. Fry DL. Physiologic recording by modern instruments with particular reference to pressure recording. Physiol Rev. 1960;40:753–788.
2. van der Tweel LH. Some physical aspects of blood pressure, pulse wave, and blood pressure measurements. Am Heart J. 1957;53(1):4–17.
3. Kleinman B. Understanding natural frequency and damping and how they relate to the measurement of blood pressure. J Clin Monit. 1989;5(2):137–147.
4. Hansen AT, Warburg E. The theory for elastic liquid-containing membrane manometers. Acta Physiol Scand. 1950;19:306–332.
5. Wilson TA, Hyatt RE, Rodarte JR. The mechanisms that limit expiratory flow. Lung. 1980;158(4):193–200.
6. Gardner RM. Direct blood pressure measurement–dynamic response requirements. Anesthesiology. 1981;54(3):227–236.
7. Fessler H, Shade D. Measurement of vascular pressure. In: Tobin MJ, ed. Principles and Practice of Intensive Care Monitoring. New York: McGraw-Hill; 1997:91–106.
8. Shapiro GG, Krovetz LJ. Damped and undamped frequency responses of underdamped catheter manometer systems. Am Heart J. 1970;80(2):226–236.
9. Blood Pressure Transducers. 2nd ed. Arlington, VA: Association for the Advancement of Medical Instrumentation; 1994.
10. Nichols WW, Walker WE. Experience with the Millar PC-350 catheter-tip pressure transducer. Biomed Eng. 1974;9(2):58–60.
11. Millar HD, Baker LE. A stable ultraminiature catheter-tip pressure transducer. Med Biol Eng. 1973;11(1):86–89.
12. Allan MW, Gray WM, Asbury AJ. Measurement of arterial pressure using catheter-transducer systems. Improvement using the Accudynamic. Br J Anaesth. 1988;60(4):413–418.
13. Geddes LA. The Direct and Indirect Measurement of Blood Pressure. Chicago: Year Book Medical Publishers; 1970.
14. Bailey RH, Bauer JH, Yanos J. Accuracy of disposable blood pressure transducers used in the critical care setting. Crit Care Med. 1995;23(1):187–192.
15. Geddes LA, Athens W, Aronson S. Measurement of the volume displacement of blood-pressure transducers. Med Biol Eng Comput. 1984;22(6):613–614.
16. Heimann PA, Murray WB. Construction and use of catheter-manometer systems. J Clin Monit. 1993;9(1):45–53.
17. Miller GS, Zbilut JP. Practical evaluation of catheter-transducer coupling systems for artifact. Heart Lung. 1983;12(2):156–161.
18. Hunziker P. Accuracy and dynamic response of disposable pressure transducer-tubing systems. Can J Anaesth. 1987;34(4):409–414.
19. Evaluation of Clinical Systems for Invasive Blood Pressure Monitoring. Arlington, VA: Association for the Advancement of Medical Instrumentation; 1992.
20. Gardner RM, Warner HR, Toronto AF, et al. Catheter-flush system for continuous monitoring of central arterial pulse waveform. J Appl Physiol. 1970;29(6):911–913.
21. Gardner RM, Bond EL, Clark JS. Safety and efficacy of continuous flush systems for arterial and pulmonary artery catheters. Ann Thorac Surg. 1977;23(6):534–538.
22. Soule DT, Powner DJ. Air entrapment in pressure monitoring lines. Crit Care Med. 1984;12(6):520–522.
23. Pedersen A, Husby J. Venous pressure measurement. I. Choice of zero level. Acta Med Scand. 1951;141(3):185–194.
24. Yang SS. From Cardiac Catheterization Data to Hemodynamic Parameters. 3rd ed. Philadelphia: Davis; 1988.
25. Courtois M, Fattal PG, Kovacs SJ Jr, et al. Anatomically and physiologically based reference level for measurement of intracardiac pressures. Circulation. 1995;92(7):1994–2000.
26. Gardner RM. Accuracy and reliability of disposable pressure transducers coupled with modern pressure monitors. Crit Care Med. 1996;24(5):879–882.
27. Morris AH, Chapman RH, Gardner RM. Frequency of technical problems encountered in the measurement of pulmonary artery wedge pressure. Crit Care Med. 1984;12(3):164–170.
28. Imhoff M, Kuhls S. Alarm algorithms in critical care monitoring. Anesth Analg. 2006;102(5):1525–1537.
29. Tsien CL, Fackler JC. Poor prognosis for existing monitors in the intensive care unit. Crit Care Med. 1997;25(4):614–619.
30. Chambrin MC, Ravaux P, Calvelo-Aros D, et al. Multicentric study of monitoring alarms in the adult intensive care unit (ICU): a descriptive analysis. Intens Care Med. 1999;25(12):1360–1366.
31. Edworthy J, Hellier E. Alarms and human behaviour: implications for medical alarms. Br J Anaesth. 2006;97(1):12–17.
32. Schoenberg R, Sands DZ, Safran C. Making ICU alarms meaningful: a comparison of traditional vs. trend-based algorithms. Proc AMIA Symp. 1999;379–383.