The essentials of anesthesia are: applied physiology, pharmacology, and clinical monitoring with a little bit of internal medicine.
John Sandison, 1980.
Respiratory physiology is difficult; if the answer is simple you don’t understand the question.
Peter Slinger, 2013.
During surgery, the anesthesiologist becomes, in part, an applied respiratory physiologist and an understanding of the physiology and pharmacology pertaining to the respiratory system is fundamental to anesthetic management. Understanding gas exchange is particularly challenging because respiratory physiology is not an exact science. Anesthesiologists work mainly with concepts that allow them to treat and predict the alterations in respiration associated with anesthesia and a variety of diseases. However, these concepts are all specific to the context of a patient’s gas exchange at a specific time and in a specific situation and often cannot be extrapolated precisely to a situation of altered physiology. As will be discussed, even fundamental basics of respiratory physiology such as dead space and functional residual capacity are never absolute values but are dynamic and always changing.
Functional Anatomy
Upper Airway Anatomy and Gas Flow
Oropharynx and Nasopharynx
The air passages extending from the nares and lips through the nasopharynx and oropharynx, through the larynx to the cricoid cartilage make up the functional upper airway. The upper airway serves a host of functions; warming and humidifying passing air, filtering particulate matter, and preventing aspiration.1
During normal quiet breathing, air enters via the nose, a chamber separated in the midline along its entire length by a cartilaginous and bony septum. It is bounded laterally by the inferior, middle, and superior turbinates overlying the sinus ostia and inferiorly by the hard and soft palates and joining the nasopharynx posteriorly. The mucosa covering these structures is highly vascular and well innervated, facts that must be appreciated when performing nasopharyngeal intubation with endotracheal tubes, nasogastric sumps or feeding tubes, or fiberoptic bronchoscopes; this tissue is sensitive to even modest stimulation and is easily torn, leading to significant bleeding. The nasal passages represent a significant resistance to airflow, normally double that found in mouth breathing. Hence, normal subjects or patients will revert to mouth breathing during exercise or respiratory failure.
The pharynx is 12- to 15-cm long and is divided into the nasopharynx, the oropharynx, and the laryngopharynx (lying posterior to the larynx). The oropharynx is further subdivided into the velopharynx (posterior to the soft palate) and the retroglossal pharynx (posterior to the base of the tongue)2 (Fig. 24-1). The supine position, sleep, and general anesthesia may promote obstruction of the oropharynx by the tongue, soft palate, and pharyngeal musculature as their tone decreases.3 Flexion of the cervical spine generally increases upper airway resistance. During inspiration, a nonsedated spontaneously breathing patient dilates the oropharyngeal pharynx by contracting the genioglossus muscle and elevating the tongue off the pharyngeal wall in a coordinated reflex. This subconscious phasic inspiratory dilation opposes the tendency of the upper airway to collapse due to the negative airway pressure generated by the diaphragm during inspiration. Unfortunately, this reflex genioglossus activity is easily abolished by low doses of most anesthetics, with the exception of ketamine.4

Larynx
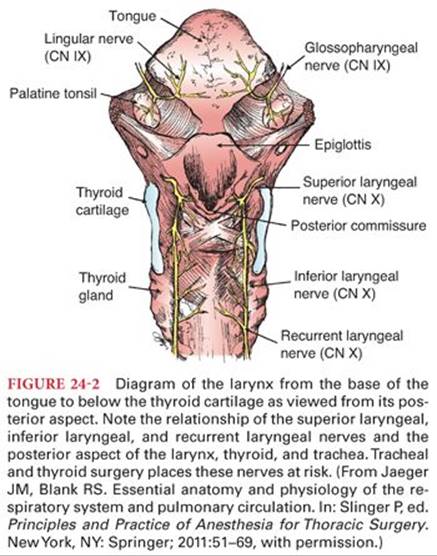
The larynx is a complex structure that lies anterior to the 4th to the 6th cervical vertebra and consists of several muscles, their ligaments, and associated cartilaginous structures (Fig. 24-2). The inlet of the larynx is bordered by the epiglottis, aryepiglottic folds, and the arytenoids. The larynx itself bulges into the pharynx posteriorly creating a deep pharyngeal recess anterolaterally on either side, the pyriform fossae. The pyriform fossae, which lie to each side of midline, are clinically relevant because of their tendency to trap food or foreign objects in the pharynx and as potential sites for the application of topical anesthesia to block the internal branch of the superior laryngeal nerve. The larynx serves as the organ of phonation, plays an important role in coughing, and in protection of the airway from entrainment of solids and liquids during swallowing.5
The primary support structure of the larynx is the thyroid cartilage that forms the point of articulation of the paired arytenoid cartilages with the vocal ligaments and their controlling musculature. Other essential structures include the hyoid bone and its attachments, the epiglottis, the cricoid cartilage, and the corniculate cartilages. The hyoid bone is a U-shaped bone that is attached directly to the stylohyoid ligament and muscle, to the mandible and tongue by the hyoglossus, mylohyoid, geniohyoid, and digastric muscles, and to the pharynx by the middle pharyngeal constrictor muscle. Beneath the hyoid bone is the remainder of the larynx suspended by its attachment, the thyrohyoid membrane and muscle. Although its function other than as a flexible anchor is unclear, it is possible to bisect its mandibular attachments (“suprahyoid release”) and mobilize the larynx in order to facilitate its caudal displacement in tracheal resection procedures. The epiglottis is the midline elastic cartilage found inferior to the base of the tongue. It is anchored anteriorly to the hyoid bone and inferiorly to the inside of the anterior portion of the thyroid cartilage immediately above the vocal cords. Bilateral folds of the epiglottis curve posteriorly to form a mucosal ridge attached to the arytenoid cartilages sitting on top of the posterior lamina of the cricoid, the aryepiglottic folds. The epiglottis, aryepiglottic folds, and the corniculate tubercles form the inlet into the glottis below. The thyroid cartilage contains the larynx with its paired lamina fused anteriorly at the laryngeal prominence and extending posteriorly to terminate in superior and inferior horns or cornu. The thyroid cartilage serves as a stable point of attachment for numerous small muscles and ligaments which manipulate the vocal cords. The thyroid cartilage also has a mobile, membranous attachment to the cricoid ring.
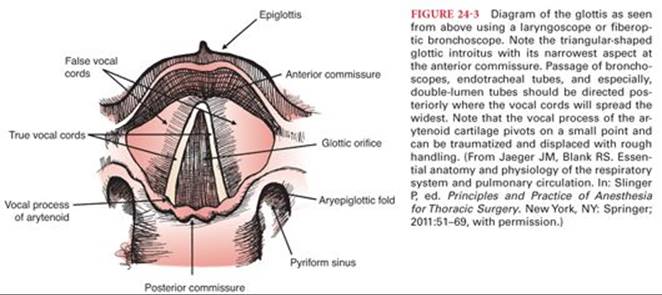
The paired vocal cords attach posteriorly to the vocal process of each arytenoid and anteriorly meet at the junction of the thyroepiglottic ligament of the anterior portion of the thyroid cartilage. The triangular opening formed by the vocal ligaments is the glottis with its apex anteriorly (Fig. 24-3). The mean length of the relaxed open glottis is approximately 23 mm in males and 17 mm in females. The glottis at its widest (posterior) point is 6 to 9 mm but can be “stretched” to 12 mm.6 It should be noted that the vocal cords are covered by a thin, adherent mucosa, producing a pearly white appearance. The absence of any submucosa implies that the vocal cords are unlikely to “swell” significantly as there is minimal space to accumulate edema fluid. However, the folds of mucosa and fibrous tissue lying parallel to the true vocal cords just superiorly in the glottis, the vestibular folds or “false vocal cords,” can become edematous. The intrinsic laryngeal musculature functions to open the glottis during inspiration; close the glottis and constrict the superior structures during swallowing; and finely control abduction, adduction, and tension of the true vocal cords during phonation.
Pharyngeal Innervation
Innervation of the pharynx is supplied via sensory and motor branches of the glossopharyngeal nerve (CN IX) and vagus nerve (CN X) (external and internal branches of the superior laryngeal nerves, recurrent laryngeal nerves). The sensory innervation of the nasopharynx is derived from the maxillary division of the trigeminal nerve (CN V), whereas the oropharynx is diffusely innervated by sensory branches from the glossopharyngeal nerve (CN IX). The internal branch of the superior laryngeal nerve pierces the lateral aspect of the thyrohyoid membrane along with the superior laryngeal artery and vein to provide sensation for the base of the tongue, vallecula, epiglottis, aryepiglottic folds, pyriform recesses, and the superior aspect of the true vocal cords. The external branch of the superior laryngeal nerve provides motor to the cricothyroid muscle, a tensor of the true vocal cords. The recurrent laryngeal nerves supply sensation to the vocal cords and tracheobronchial tree as well as motor to all the remaining intrinsic musculature of the larynx. The right recurrent laryngeal nerve passes inferior to the right subclavian artery but the left originates at the level of the aortic arch and loops around the ligamentum arteriosum then both nerves ascend cephalad along the tracheoesophageal groove. This anatomy must be appreciated during esophageal and thyroid surgery and during both cervical and anterior mediastinoscopy, as these structures can be at risk. The larynx receives its blood supply from the superior and inferior laryngeal arterial branches of the superior and inferior thyroid arteries, respectively. These arteries follow the course of the superior and recurrent laryngeal nerves.
The major function of the upper airway is to provide a conduit for the initial inhalation then exhalation of gases to and from the lungs while contributing to multiple other functions (e.g., eating, drinking, speaking, etc). With respect to inhalation, the nasopharynx and posterior pharynx warm and humidify the inspired gas. This aids in maintaining core temperature and protects the more delicate epithelia lining the lower airways from desiccation. The airway epithelium secrets mucus, which coats the airway surface and maintains tissue hydration and also serves to trap particulate matter, bacteria, and viruses. Mucus also contains a number of enzymes with antioxidant, antiprotease, and antibacterial properties.7
Another important role of the airways and their mucus coat is the filtering of inhaled particulate matter by an elaborate defense system that takes advantage of the air-flow characteristics of the upper and lower airways and their associated epithelium. There are three mechanisms at work to produce mechanical filtering of inspired gases.1 The first, inertial impaction, is capable of trapping particulates larger than 10 microns by virtue of the turbulent flow across the mucus lining the passageways. It accomplishes this task in minutes with mucus and saliva eventually swallowed. Gas flow slows within the bifurcating and branching tracheobronchial tree until it becomes more laminar. Particulates impact the airway wall according to particle size (sedimentation). Normally, the particles, including bacteria and similar-sized particles, are trapped in the mucus at this level of more proximal airways and are transported cephalad by the constant motion of the cilia, an apical feature of the respiratory epithelium, at a rate of approximately 2.5 mm per minute in the bronchi but over 5 mm per minute in the trachea. Lower airway mucus is usually cleared in about 24 hours although this can be drastically retarded in disease states such as cystic fibrosis or chronic bronchitis or conditions altering ciliary function or growth, such as tobacco smoking.8 The filtering processes appear effective down to particles approximately 0.01 micron in diameter.
Upper Airway Gas Flow
Gas flow is directly proportional to the pressure gradient (ΔP) and inversely proportional to the resistance. When a gas (or liquid) flows through a straight unbranched tube, flow will usually be laminar and resistance is directly proportional to the viscosity of the gas and inversely proportional to the 4th power of the radius.
Resistance = 8 × length × (viscosity/π) × (radius)4
However, at very high flow rates or when gas flows through an irregular tube or orifice, flow tends to become turbulent and resistance becomes proportional to the density of the gas and inversely proportional to the 5th power of the radius (i.e., changes in airway caliber affect resistance to turbulent flow more than laminar flow). Reynolds number is a dimensionless number that allows estimation of whether a flow is turbulent or laminar.9
Reynolds number = velocity × diameter × density/viscosity
In the airway, Reynolds numbers for air during quiet breathing are <2,000 throughout most of the upper and lower airway (Fig. 24-4). Reynolds numbers >4,000 are associated with turbulent flow and 2,000 to 4,000 is a mixture of laminar and turbulent flows. Helium is a gas with a low density compared to air or oxygen; however, the viscosity of the three is almost equal. A mixture of 80% helium/20% oxygen has a density approximately 0.33 that of air and 0.30 that of oxygen. In conditions of increased turbulent flow in large airways due to a mass or edema, breathing a mixture of helium and oxygen will decrease dyspnea for some patients (this is also why breathing helium changes phonation so that a person may imitate Donald Duck). This applies only to turbulent flows in large airways. Helium does not relieve dyspnea due to increased distal laminar airflow resistance such as in asthma or chronic obstructive pulmonary disease (COPD).

Tracheal and Bronchial Structure
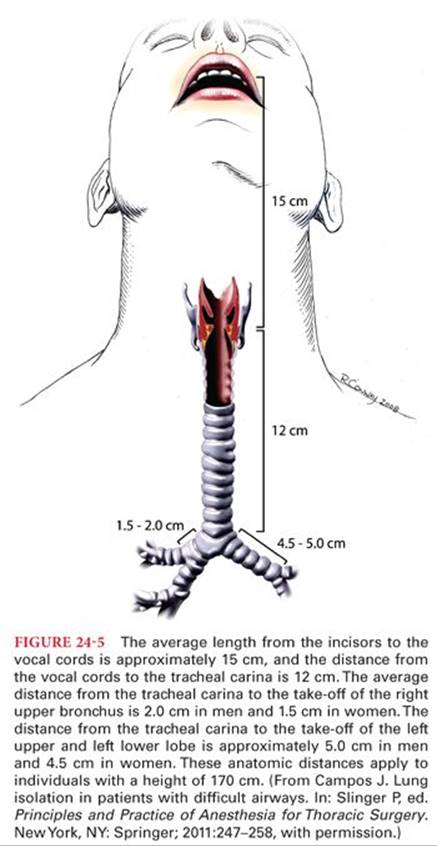
The trachea originates at the cricoid cartilage (at the level of vertebra C6) and extends approximately 10 to 12 cm (females) and 12 to 14 cm (males) to terminate in a bifurcation (carina) at the T4/5 vertebral level (2nd intercostal space, the angle of Louis) (Fig. 24-5). The trachea is 22 ± 1.5 mm (males) to 19 ± 1.5 mm (females) in diameter and consists of 16 to 20 U-shaped cartilaginous rings that are closed posteriorly by fibrous tissue and a longitudinal smooth muscle band, the trachealis muscle.
The right main bronchus is wider (16 vs. 13 mm), shorter (1.5 to 2.5 vs. 4.5 to 5.0 cm) and more vertical than the left. The right main bronchus gives off the upper lobar bronchus then continues as the bronchus intermedius giving off the right middle lobar bronchus and right lower lobar bronchus at the hilum of the lung at T5 (Fig. 24-6). The left main bronchus passes inferiorly and laterally below the aortic arch, anterior to the esophagus and descending thoracic aorta to reach the hilum of the left lung at T6. These dimensions can be quite variable among individuals and chest pathology can drastically change the anatomy.

The lobar bronchi (right upper, right middle, right lower and the left upper, left lower) extend into their segmental bronchi that can be readily visualized during flexible bronchoscopy. The right upper lobe bronchus gives off 3 segmental bronchi (apical, anterior, posterior) (Fig. 24-7), the right middle lobe bronchus splits into 2 segmental bronchi (lateral, medial), and the right lower lobe bronchus divides into a superior segment (directed posteriorly) and a basilar segmental bronchus which divides into 4 segments (medial basal, anterior basal, lateral basal, posterior basal) for a total of 10 segmental branches on the right. The left upper lobar bronchus splits into the superior division with “3” segments (a “fused” apical-posterior and an anterior) and the inferior division or lingual with 2 segments (superior and inferior). The left lower lobe bronchus branches into 4 lower segmental branches (superior, a “fused” anteromedial basal, lateral basal, and posterior basal) for a total of “10” segments on the left. An online interactive bronchoscopy simulator is available to demonstrate this anatomy (Fig. 24-8).


Respiratory Airways and Alveoli
The airways continue to divide into smaller diameter conduits until one arrives at the bronchioles with diameters less than 0.8 mm. At this level, the airways lose all remnants of cartilage and begin the transformation from purely conducting airways to those described as respiratory bronchioles. Respiratory bronchioles eventually divide into the final four generations of alveolar ducts, which then consist primarily of openings into the terminal alveolar sacs. In the descriptive model of Weibel10 (Fig. 24-9A), the trachea branches into 23 generations of airways. The first 15 generations serve as conducting airways and the subsequent 8 generations become sufficiently thin-walled to allow some degree of gas exchange and are called acinar airways. One clinical aspect of this geometric progression of increasingly narrower airways (and blood vessels) by divergence and multiplication is that the overall cross-sectional area and therefore resistance to gas flow (or blood flow) becomes markedly less compared to the resistance of the proximal airway (or blood vessel) (Fig. 24-9B). This has an important impact on distribution of gas and blood flow, flow velocity, and, hence, transit time through key areas of gas exchange.

The interior of the trachea is lined with ciliated columnar epithelium, goblet cells (responsible for mucus production) (Fig 24-10), and with interspersed specialized chemical and tactile neuroreceptors. The lining of the airways transitions from pseudostratified columnar epithelia in the larger bronchi to a thinner cuboidal ciliated variety in the small bronchi. The airway epithelium and submucosa also contain lymphocytes, mast cells, and a variety of neuroendocrine cell types. The next layer consists of circumferential bands of smooth muscle cells and a connective tissue layer containing submucosal glands and plates of cartilage (replacing the solid cartilage rings in the very large airways) (Fig. 24-11). The outermost layer is a loose adventitial shell with lymphatic vessels, sympathetic and parasympathetic nerves, and nourishing blood vessels.


The respiratory bronchioles terminate in a pulmonary acinus, which has the appearance of a cluster of grapes on a network of stems. Each acinus may contain multiple alveolar ducts communicating with 2,000 alveoli arranged in a ring-like, honeycomb network. The alveolus is considered the primary site of gas exchange between the blood and gas in the lung. The alveolar septa are about 5 to 8 microns thick and are opposed by an alveolar surface on either side with the alveolar capillary bed sandwiched inside. The walls of the alveoli are extremely thin, between 0.1 and 0.2 microns, a feature that promotes rapid equilibration of gas by diffusion with the pulmonary capillary blood. In addition, gas can exchange between alveoli through pores of Kohn. There are approximately 300 million alveoli in the human lung, which provides an extraordinary surface area for gas exchange (e.g., 70 m2).
There are three major cell types found in the alveolus: alveolar type I cells, alveolar type II cells, and alveolar macrophages. However, there are other cell types found under certain conditions in the lung (e.g., inflammation). Alveolar type I cells are squamous epithelial cells that cover most of the alveolar surface. These nucleated cells have few cytoplasmic organelles and a sparse cytoplasm splayed out in sheets over the alveolar surface forming a thin barrier between the air space and the pulmonary capillary endothelium. Alveolar type II cells are fewer in number, somewhat spherical, and coated on their apical surface with microvilli. In contrast to type I cells, alveolar type II cells possess many organelles including multilayered granular structures called lamellar bodies (Fig. 24-12). These lamellar bodies are the source of pulmonary surfactant, a lipoprotein coating the interior surface of the alveolus and capable of significantly reducing the surface tension of the alveolus air-surface interface. Surface tension reduction is considered an important physical mechanism to reduce any tendency for alveolar collapse at very low lung volumes.

The immune defenses of the lung are extremely important because of the direct exposure of this organ to the external environment via the airways. There are a number of excellent reviews of the immune function of the lung but it is important to realize that there are many questions unanswered about how the lung responds to invasion and inflammation. Yet from a clinical standpoint, the pulmonary inflammatory response will greatly influence the perioperative management of the surgical patient. A few major defensive cell types residing in the alveolar spaces and interstitium are worth mentioning. Alveolar macrophages are derived from bone marrow monoblast precursor cells and migrate to the lung parenchyma (Fig. 24-13).11 Alveolar macrophages are free to move over the surface of the alveolus and phagocytize foreign material that enters the alveolus including bacteria and particulates. Macrophages are cleared either through the lymphatics or are carried up and expelled via the airways. Lymphocytes, largely T lymphocytes, are widely distributed in the normal lung within paratracheal and hilar lymph nodes, in the interstitium of the bronchial tree as nodules or individual cells and in the alveolar walls. They play a critical role in the lung’s primary immune response to inhaled antigens. Under some pathologic conditions in the lung, it is becoming apparent that an exaggerated inflammatory response and the activity of these cells and others may be harmful to the lung; the acute respiratory distress syndrome (ARDS) and emphysema are examples.

Pulmonary Circulation
Although the blood flow through the pulmonary circulation is normally equal to the blood flow though the systemic circulation (a major exception being intracardiac shunting when it exceeds systemic circulation), the pressures in the pulmonary circulation are normally lower than the systemic circulation because the pulmonary vascular resistance (PVR) is lower than the systemic resistance (approximately one-sixth of systemic resistance). This is because the pulmonary vessel walls contain less elastic and muscular tissue than systemic vessels of corresponding caliber. Pulmonary arterioles contract rapidly in response to hypoxemia in the alveolus and to a lesser extent to hypoxemia in mixed venous blood. This hypoxic pulmonary vasoconstriction (HPV) is unique to the pulmonary circulation (systemic arterioles dilate in response to hypoxia) and permits regional matching of perfusion to ventilation.
Like all endothelium, the vascular luminal wall of the pulmonary capillaries is lined by glycocalyx, a microcilial layer that acts as a molecular sieve.12 This 0.1-micron layer prevents adhesion of platelets and leukocytes and is thought to trap larger molecules close to the endothelial membrane and locally increase the oncotic pressure. The glycocalyx covers the pores between endothelial cells and acts as a molecular sieve to control fluid flux. A healthy glycocalyx is important to prevent edema formation in the lung. However, the glycocalyx is damaged by inflammation and ischemia-reperfusion and this may contribute to the increased flux of fluid into the pulmonary extracellular matrix in these conditions.
The air passages receive their blood supply from systemic bronchial arteries down to the level of the respiratory bronchioles. Only one-third of the bronchial circulation returns to the systemic venous system, the remainder drains into the pulmonary veins and this constitutes the largest portion of the normal extrapulmonary venoarterial shunt. This bronchial shunt is less than 1% of the cardiac output in healthy individuals but may increase to 10% in bronchiectasis, emphysema, and some congenital cardiac conditions.
Thorax and Muscles of Respiration
The lungs are contained within the thorax. The bony thorax is composed of the 12 ribs, the sternum anteriorly and the thoracic vertebral column posteriorly. The caudal end of the thorax is formed by the diaphragm and the cranial end of the thorax is the thoracic inlet, within the ring formed by the first ribs, containing the trachea, esophagus, and the neurovascular supply to the head and arms. Bulk movement of air into and out of the lungs occurs as a result of changes in intrathoracic pressure created by rhythmic changes in the volume of the thorax. Expansion of the chest cavity occurs when three respiratory muscle groups work in concert. The diaphragm, intercostal muscles, and the accessory muscles (sternocleidomastoids, scalenes) are controlled by the respiratory centers of the brain to contract in a rhythmic pattern designed to match ventilation to gas exchange requirements. The abdominal musculature (rectus abdominis, external oblique, internal oblique, and transversus abdominis) can be recruited when more force is required for exhalation, although abdominal muscle tone may stabilize the rib cage during inspiration as well.1
Inspiration
The diaphragm is unique in that its muscle fibers radiate from a central tendinous structure to insert peripherally on the ventrolateral aspect of the first three lumbar vertebrae, the aponeurotic arcuate ligaments, the xiphoid process and the upper margins of the lower six ribs. Its motor innervation is solely from the right and left phrenic nerves, which originate from the 3rd, 4th, and 5th cervical spinal nerves. In the relaxed state, it forms a pronounced “dome” that closely apposes the chest wall for some distance before arching across. Contraction of the diaphragm causes a large caudal displacement of the central tendon resulting in a longitudinal expansion of the chest cavity. Simultaneously, its insertions on the costal margins cause the lower ribs to rise and the chest to widen. This diaphragmatic motion is responsible for the majority of quiet respiration. As the dome descends, it displaces the abdominal contents caudally. The fall in pleural pressure and accompanying lung expansion produce an increase in abdominal pressure and outward movement of the abdominal wall. The supine and Trendelenburg positions or surgical retractors can significantly interfere with this abdominal motion especially in the morbidly obese, necessitating controlled ventilation under anesthesia.
The intercostal muscles are thin sheet-like muscles with origins and insertions between the ribs. The internal intercostal muscles have their fibers oriented obliquely, caudally, and dorsally, from the rib above to the rib below. The external intercostal muscles have their fibers oriented obliquely, caudally, and ventrally, from the rib above to the rib below. All intercostals are innervated by the intercostal nerves running in the neurovascular bundle under the inferior lip of each rib. The contraction of the external intercostal muscles produces an inspiratory action by elevating the upper ribs to increase the anteroposterior dimensions of the chest in a “bucket-handle” motion. The lower ribs are also elevated by virtue of the force applied and their point of rotation to increase the transverse diameter of the thorax. The internal intercostals apply their force in such a direction as to rotate the ribs downward, decreasing the thoracic anteroposterior dimension to aid in active expiration (when required) and cough. In general, the intercostal muscles do not play a major role in quiet respiration but do in exercise or other conditions requiring high levels of ventilation.
The principal accessory respiratory muscles are the sternocleidomastoid and scalene muscles. The scalene muscles originate from the transverse processes of the 4th through the 8th cervical vertebrae and slope caudally to insert on the first two ribs. Their contraction during periods of high ventilatory demand, elevates and fixes the cephalad rib cage during inspiration. Similarly, the sternocleidomastoid muscles elevate the sternum and increase the longitudinal dimensions of the thorax.
Expiration
Expiration is a passive process in quiet breathing and is largely the response to relaxation of the inspiratory muscles and the balance of forces generated by the elastic recoil of the lungs and chest wall. When high levels of ventilation are required as in exercise or if airway resistance increases (as in exacerbations of asthma or COPD), the expiratory phase becomes an active process with forceful contraction of the rectus abdominis, the transverse abdominis, and the internal and external oblique muscles. The contraction of the abdominal musculature retracts the abdominal wall and pulls the lower ribs downward, which increases intraabdominal pressure and accelerates the cephalad displacement of the diaphragm during exhalation. The internal intercostal muscles depress the rib cage and provide a minor contribution to forced expiration. Innervation of the abdominal musculature is from thoracic nerves 7 through 12 and the 1st lumbar nerve.
Like most skeletal muscles, the diaphragm and intercostal muscles contain a heterogeneous mix of fiber types. The diaphragm has between 49% and 55% type I (slow-oxidative) fibers, the reminder a mix of the “faster high activity” types IIA and IIB fibers.13 The types of skeletal muscle fibers are distributed fairly evenly throughout the diaphragm. Of note, the respiratory muscles retain the ability to adapt to stress and training. This includes responses to lung pathology which might seem maladaptive. Emphysema is a good example. The diaphragm undergoes changes at the sarcomere level, physically “losing” contractile units as hyperinflation of the lungs leads to increasing thoracic dimensions and “flattening” of the diaphragm.14 Loss of sarcomeres in series with the central tendon may help to restore the mechanical advantage of the optimal length-tension relationship for the muscle.
Respiratory Mechanical Function
The basics of mechanical function of the respiratory system are the interaction of two opposing springs: the chest wall, which at rest is trying to expand, and the lungs, which at rest are trying to contract. (Fig. 24-14) The lungs and chest wall move together as a unit. This is made possible by the enclosed, air-tight thoracic cavity where the outer surface of the lungs and its visceral pleura are in close proximity to the parietal pleura covering the inner surface of the chest wall and the mediastinal structures. Changes in the intrathoracic volume are only possible because the inside of the lung is in continuity with the ambient atmosphere outside the thorax via the trachea and pharynx. The intimate contact between the layers of pleura is maintained by a negative intrapleural pressure generated in part by the intermolecular forces of the pleural fluid excluding gas from this space. This lubricating fluid allows freedom of the pleural layers to slide over one another but highly resists separation of the layers much like two panes of glass with a thin layer of water between them.

Normally, the intrapleural pressure is about −5 cm H2O when the respiratory system is at equilibrium. Because of the deforming effect of gravity on the lung parenchyma, there is a vertical gradient of intrapleural pressure. This gradient is largest in the seated or upright position (Fig. 24-15). The volume of gas contained in the lungs at this resting point is termed functional residual capacity (FRC). For a healthy young adult male, total lung capacity (TLC) will be approximately 6 to 6.5 L and FRC will be 2.5 to 3 L. The oxygen contained in the FRC (500 to 600 mL) is the only reservoir of oxygen in the body.

Pathologic conditions such as the introduction of air or blood into the intrapleural space can rapidly disrupt this lung–chest wall interaction, leading to a compromise in respiratory function but also interfere with cardiovascular function. Examples of disruption of the intrapleural space would be a pneumothorax, empyema, pleural effusion, or bronchopleural fistula.
Lung Volumes and Spirometry
By convention, the static and dynamic subdivisions of gas contained within the lung are given a common nomenclature of volumes and capacities (Table 24-1 and Fig. 24-16). Volumes are most commonly measured by spirometry (Figs. 24-17 and 24-18) and capacities are then calculated as the sum of specific volumes. Simple spirometry can give all of the volumes and capacities listed in Table 24-1 except FRC, TLC, and residual volume (RV), all of which require a separate measurement of RV. RV can be measured by wash-in or washout dilution calculations using a relatively insoluble gas such as nitrogen or helium and a closed breathing circuit. In modern pulmonary function labs, these laborious techniques have largely been replaced by whole-body plethysmography, which is both simpler and more accurate (Fig 24-19), which measures FRC and this can be used to calculate RV by subtraction of expiratory reserve volume (ERV) measured by spirometry.


Spirometry measurements are commonly reported as “observed” (or measured) and “predicted” (Fig. 24-20). Predictions are based on population statistical means, which take into account age, sex, and height. For example, an observed forced expiratory volume in 1 second (FEV1) of 1.0 L for an 85-year-old male, 152 cm in height (5-ft tall) is 85% predicted (within the normal range of 100% ± 20%) but and FEV1of 1.0 L for a 30-year-old male, 182 cm (6 ft) is 20% predicted, which would be consistent with severe end-stage lung disease. The FEV1, forced vital capacity (FVC), and their ratio (FEV1/FVC) are the most useful spirometry measurements for the anesthesiologist to assess the severity of a patient’s lung disease or to evaluate a patient’s operability for lung resection surgery.15

In addition, complete pulmonary function testing in the laboratory will commonly report measurements of volume ratios, flows, lung resistance, lung diffusion capacity for carbon monoxide (DLCO) and other measurements. The majority of these other values, although useful for distinguishing among different types and severities of pulmonary diseases in clinical chest medicine, are not commonly used in anesthesia. The exception is the DLCO which is a measurement of lung parenchymal function (i.e. alveolo-capillary gas transfer).
Closing Capacity and Closing Volume:
The key to understanding the complex changes which develop in the respiratory system during anesthesia is to appreciate the relationship between FRC and closing capacity (CC). CC is the sum of closing volume (CV) and RV. CV is the lung volume below which small airways begin to close (or at least cease to contribute expiratory gas) during expiration. Closure of small airways in the basal portions of the lung during deep expiration is a normal phenomenon due to the gravity-dependent increase in pleural pressure at the bases and due to the lack of parenchymal support in distal airways. CV and CC are not commonly measured in the pulmonary function lab. Measurement is either by a wash-in technique with a small bolus of an insoluble tracer gas such as 133Xe slowly inhaled then exhaled from RV (Fig. 24-21) or by nitrogen washout after inspiration of a breath of oxygen from RV. Normal values for CC in seated healthy young adults are 15% to 20% of vital capacity (VC).5 CC increases with age due to loss of structural parenchymal support tissue in the lung and an increase in RV. FRC increases slightly with age but the increase is greater for CC (Fig. 24-22).16 CC changes very slowly over time. However, FRC changes on a minute-to-minute basis as the mechanical advantage of the two springs (lung and chest wall) which determine it change. CC exceeds FRC in the supine position at age 45 and in the upright position by age 65. During anesthesia, a decrease in the elastic recoil of the chest wall due to the muscle-relaxing effects of almost all general anesthetics (with the possible exception of ketamine) and neuromuscular blockers causes FRC to decrease and it will often fall below CC.17 Similarly, an increase in elastic recoil of the lung due to fluid retention in the pulmonary parenchyma will lower the FRC. When an alveolar unit falls below its CC, even for a brief period during one respiratory cycle, the concentration of oxygen (PAO2) in that unit falls slightly. This results in the increase of venoarterial admixture (“shunt”; see the following text) and decrease in arterial oxygen tension (PaO2) seen in the elderly and during general anesthesia. When a region of the lung is kept below its CC, the loss in volume will eventually lead to atelectasis (Fig. 24-23) as the gas trapped in the alveoli is absorbed. A large part of the anesthesiologist’s job in the perioperative period is restoring the balance between FRC and CC. Because CC cannot be changed, this involves improving FRC by a variety of techniques to improve the mechanical advantage of the chest wall. These techniques may include ensuring adequate reversal of neuromuscular blockers, upright positioning, regional analgesia and possibly the use of positive end-expiratory pressure (PEEP) or continuous positive airway pressure (CPAP). The physiologic differences between PEEP and CPAP are subtle. However, by common usage, when positive pressure is applied during expiration to the airway of a patient who is having positive pressure ventilation, this applied airway pressure is referred to as PEEP. When a patient is breathing spontaneously, an applied airway pressure is referred to as CPAP.


Compliance
Compliance is the change in lung volume for a given change in airway pressure. It is the reciprocal of “elastance.” Monitoring changes in respiratory compliance is extremely important in ventilated patients as an early warning of changes in the lung or chest–abdominal wall complex that may negatively affect gas exchange. Compliance of the respiratory system (CRS) is measured as the change in lung volume (ΔV) divided by the change in airway pressure (ΔP), this represents the difference between alveolar pressure, at a given lung volume, and ambient (atmospheric) pressure.
CRS = ΔV/ΔP
The compliance of the respiratory system is dependent on the interaction of the compliance of the lung itself (CL) and the compliance of the chest wall (Ccw). These two springs act similar to series capacitors in an electrical system, that is, storing energy, and the reciprocal of respiratory compliance is the sum of the reciprocals of CL and Ccw:
1/CRS = 1/CL + 1/Ccw
CL is calculated as ΔV/ΔP, where ΔP = alveolar pressure − intrapleural (“transmural”) pressure
Ccw is calculated as ΔV/ΔP, where ΔP = intrapleural pressure − ambient pressure
Intrapleural pressure is not easy to measure directly in the clinical setting. Esophageal pressure, from a balloon manometer, is commonly used as an approximation of intrapleural pressure in respiratory research. As the respiratory system inflates, both the lung and chest will produce their own unique compliance curves (Fig. 24-24).

Factors affecting CL include the following:
1. Lung volume. Compliance is greatest at FRC and remains at this level until the lung inflates or deflates to approximately 15% of TLC above or below FRC, that is, the slope of CRS is the steepest in this range, which includes the range of normal tidal volume breathing. Compliance is related to the normal FRC for a given lung and can be corrected for normal lung volume as the “specific compliance” (compliance/FRC), which is relatively constant at all ages.
2. Surface tension of the alveoli. This is probably the major factor determining lung recoil and CL. A lung that is filled with water is actually more compliant than a normal lung because the air-fluid surface tension interaction is lost. Similarly, a lung that is depleted of surfactant is less compliant than normal. Without surfactant, the alveoli would be expected to behave like communicating bubbles and conform to the Laplace equation:
P = 2T/R
Where P is the gas pressure within a bubble, T is the surface tension of the wall, and R is the radius of the bubble. If the radius is decreased without a change in surface tension, the pressure will increase in the bubble and a small bubble will empty into a larger bubble (in the lung, this would lead to atelectasis). However, in the lung, surface tension decreases as the radius of the alveoli decreases and this opposes the collapse of smaller lung units. The exact mechanisms by which surfactant causes this effect are debated.18 It could be related to a tighter packing of surfactant molecules as the radius decreases or the formation of surfactant multilayers. Other factors which affect the CL include pulmonary blood volume and interstitial edema.
Factors affecting Ccw include posture, obesity, ossification of the costal cartilages, and scarring of the skin. The interaction of the compliances of these two springs produces the characteristic sigmoid pattern of the compliance curve of the respiratory system (see Fig. 24-24, solid line). At FRC, which is normally the relaxation volume of the respiratory system, the pull of the two springs in opposite directions balance one another. In a normal healthy individual, as the respiratory system inflates to 60% of TLC, the chest wall is aiding the muscles of respiration to inflate the lungs. However, as the lung inflates above this volume, the muscles of inspiration must work to distend both the lungs and the chest wall.
Dynamic compliance is the ΔV/ΔP of the respiratory system measured at the instant gas flow. In a ventilated patient, this ΔP will = peak airway pressure − PEEP. This reflects the normal behavior of the respiratory system but will include the effects of airway resistance and the normal hysteresis of the lung parenchyma (hysteresis in this context refers to the tendency of an elastic material to resist change of shape both during stretch and contraction). Dynamic compliance will be affected by both the frequency of respiration and the velocity of gas flow.
Static compliance is the ΔV/ΔP of the respiratory system measured at a point of no gas flow and when the pressure gradient has been allowed to equilibrate in the entire airway. This is difficult, but not impossible, to achieve in an awake subject by relaxing at end-inspiration against a closed airway. However, it is simple to measure in an anesthetized and paralyzed patient during ventilation in a volume-controlled mode (with a fixed inspiratory flow) by using an end-inspiratory pause. The ΔP for static compliance will = plateau airway pressure − PEEP.
Both static and dynamic compliances provide useful information for the anesthesiologist. The static compliance reflects more the actual distending pressure in the patient’s alveoli. The difference between the two reflects the effects of airway resistance. During pressure-control ventilation, with a decreasing inspiratory airflow pattern, there will not be a discernible difference in the peak or plateau in the airway pressure so distinguishing between static and dynamic compliance is clinically difficult (Fig. 24-25). This negative, that is, loss of monitoring, aspect of pressure–control ventilation is largely compensated by the ability of pressure–control ventilation to more uniformly distribute gas flow in patients with COPD who have large differences in regional compliance within the lung (see the following text).

The inflation and deflation limbs of the compliance curve of the respiratory system are different (Fig. 24-26). For dynamic compliance, this is due to both airway resistance and lung hysteresis. These curves combine to produce the familiar “pressure-volume loop” (or “PV” or “ΔV/ΔP” or “compliance” curve) of the lung displayed by many modern anesthetic machines and its shape is determined mainly by the dynamic compliance of the respiratory system. The gap between the expiratory and inspiratory limbs of the combined curve will widen as tidal volume and respiratory rate increase. It is possible to generate a ΔV/ΔP curve using static compliance if the lung is slowly inflated in a stepwise fashion. This curve will also show a gap between inspiration and expiration due mainly to lung hysteresis. This gap will be smaller than that for the dynamic ΔV/ΔP curve.19 An automated breath-by-breath calculation of compliance is displayed by the ventilation monitors of many modern anesthetic machines. It is difficult for these clinical monitors to measure at a true static “no flow” point at end-inspiration and therefore measured compliance changes may be truly due to increased tissue elastance (e.g., atelectasis or pulmonary edema) but may also be affected by changes in dynamic compliance (airway resistance), for example, bronchospasm or secretions.

Resistance
Respiratory system resistance is a complex and important topic. It is important because, in the perioperative period, complications such as bronchospasm or secretions in an endotracheal tube or partial circuit obstruction will present primarily as increased resistance. It is complex because there are many types of resistance that contribute to the overall resistance of the respiratory system. When anesthesiologists think of respiratory resistance, they are mainly thinking of the nonelastic resistance to gas flow and they are primarily thinking of frictional airflow resistance. Nonelastic resistance is a major component of the work of breathing and because it cannot be stored, it is lost and dissipated as heat. Nonelastic resistance also includes the resistance of lung and chest wall tissue to deformation and compression of intrathoracic gas. Elastic resistance is the recoil of the lung and chest wall, and because it is recovered during expiration, it does not contribute to the work of breathing.
Respiratory resistance (RRS) is calculated as the pressure gradient divided by the inspiratory flow. During a constant flow situation such as volume–control ventilation, this would be calculated from Figure 24-25 as:
RRS (cm H2O/L per second) = PPeak − PPlateau (cm H2O)/inspiratory gas flow (L per second)
However, normal spontaneous ventilation and pressure–control ventilation have variable flow rates and a mean gas-flow rate approximation is necessary to calculate respiratory resistance. Airflow resistance in normal healthy individuals breathing spontaneously is approximately 1 cm H2O/L per second. This can increase to 5 to 10 cm H2O/L per second in COPD and asthma.20 Breathing through an 8-mm internal diameter endotracheal tube at a flow of 1 L per second creates a resistance of approximately 5 cm H2O/L per second and this increases to 8 cm H2O/L per second for a 7-mm endotracheal tube.21
To quantitatively measure respiratory resistance in the operating room is not simple because it is difficult to separate respiratory system resistance from apparatus resistance. In the pulmonary function laboratory, this is done with plethysmography and a variety of flow-interrupter techniques. Fortunately, it is relatively simple to monitor changes in respiratory resistance in the operating room by following changes in dynamic compliance.
Gas flow during respiration is a mixture of turbulent and laminar flows and the turbulent/laminar interface moves in the air column during the respiratory cycle. Laminar flow occurs beyond the 11th generation airways. Turbulent flow in the larger conducting airways aids clearing of secretions by coughing. In a healthy person, frictional airflow resistance is mainly due to larger airways: mouth and pharynx 40%, larynx and large airways 40%, small airways (<3-mm diameter) contribute 20%.22 However, changes in airflow resistance are most commonly due to changes in the caliber of the small airways. Small airway caliber can be decreased by contraction of smooth muscle in the airway wall or by compression (due to reversal of the normal transluminal pressure gradient in the collapsible distal airways).
Airway resistance is inversely proportional to lung volume and increases exponentially as the lung deflates below FRC. The application of PEEP or CPAP to patients who have a decreased FRC will benefit their respiration not only by raising their FRC above CC but also by decreasing their respiratory resistance, and thus their work of breathing, at a higher lung volume.
An increase in resistance to inspiration is detected by the muscle spindles in the diaphragm and leads to an increased force of contraction. This spinal reflex is preserved during anesthesia. In the awake patient, this reflex is augmented by a conscious cortical response that also increases the force of inspiration.23 Increased expiratory resistance does not normally initiate a response if the resistance is <10 cm H2O. The FRC is increased passively by the increased resistance until the increased elastic recoil balances the increased work of expiration. However, the ensuing increased intrathoracic pressure may decrease venous return and cardiac output. Patients tolerate increased airway resistance by increasing the work of breathing and in the short term will usually maintain a normal arterial CO2 (PaCO2). Eventually, a major increase in airway resistance may lead to respiratory muscle fatigue and the PaCO2 will start to rise. An elevated PaCO2 in a patient with increased respiratory resistance who has a normal baseline PaCO2 is an ominous sign of impending respiratory failure.
The Equal Pressure Point
Expiratory respiratory resistance will normally be lower than inspiratory resistance because the lung is at a larger volume at all stages of expiration than inspiration (see Fig. 24-26). However, there are situations when expiratory resistance exceeds inspiratory resistance, these include the following: during a forced expiration (or cough) in a normal patient, during quiet breathing in some patients with severe emphysema (see the following text), and during forced expiration in some patients with an intrathoracic tracheal tumor or tracheobronchial compression from a mediastinal mass. In these instances, where expiratory resistance exceeds inspiratory resistance, the underlying cause is dynamic airway compression, which creates a moving flow-limiting narrowing in the airway called the equal pressure point (EPP). In Figure 24-27 at FRC before inspiration, (a) airway pressure throughout is zero (no-flow situation) because the intrapleural (transpulmonary) pressure is −5 cm H2O there is a net +5 cm H2O pressure distending the airways and alveoli. As inspiration begins, (b) intrapleural and alveolar pressure falls by 3 cm H2O and flow begins. Because of the pressure drop along the airway, the pressure will be negative in the airway but less than the alveolar pressure. This increases the distending pressure of the airways in this case from +5 to +6 cm H2O. At end-inspiration, (c) the distending pressure in the no-flow condition is +8 cm H2O and the pressure through the airway returns to zero. During quiet expiration, the recoil intrapleural pressure returns to −5 cm H2O and this creates a net pressure in the alveolus of +3 cm H2O, which diminishes proximally as air flows out the tracheobronchial tree. The downstream distending pressure falls along the airway (represented by +6 cm H2O in Fig. 24-27D). Because this is a dynamic process, due to tissue resistance, the airway caliber will normally be larger at a given point for the same distending pressure during expiration than during inspiration. In a no-flow situation, the same distending pressure will result in equivalent airway diameters. During a forced expiration, (e) the airway pressures increase [in this case by 24 cm H2O, resulting in a net intrapleural pressure of +16 cm H2O for same lung volume as (c)] and a gradient is created along the expiratory air column. At the point where the intrapleural pressure equals the air column distending pressure (+16 cm H2O), an EPP is created. The airway will narrow proximal to this point (+15) to the thoracic outlet (+14). This becomes the flow-limiting point of expiration and no amount of increased effort can increase the expiratory flow at a particular lung volume because the driving pressure is fixed by the difference between the alveolar and intrapleural pressures [8 cm H2O in (e)]. This EPP allows the creation of a point of gas-flow acceleration and turbulence in the expiratory air column during normal coughing that has a Bernoulli effect (decreased lateral pressure in a region of increased flow velocity) to detach secretions from the tracheobronchial walls. During forced expiration, as lung volumes decrease and airway pressures decrease, intrapleural pressures are maintained and the EPP will move distally in the airway.24

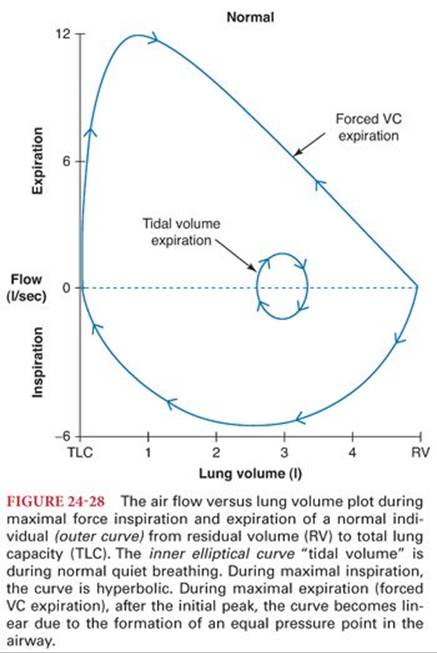
During a maximal respiratory effort, the EPP is responsible for the difference in the shapes of the expiratory versus inspiratory limbs of the flow-volume curve (Fig. 24-28). The linear portion of the expiratory flow, after the initial peak flow, is caused by the EPP. The peak flow is effort-dependent but the linear portion of the expiratory flow is effort-independent (i.e., no amount of increased expiratory effort at a given lung volume can increase the maximal flow rate at that volume). During quiet breathing, the inspiratory and expiratory limbs of the flow-volume curve are mirror images due to the absence of an EPP. In the range of lung volumes used during quiet breathing, both inspiratory and expiratory flow normally can be increased approximately threefold by maximal effort if needed.
Work of Breathing
Work is the product of force × distance or pressure × volume. Technically, work is calculated for a single event. However, the term work of breathing is commonly used to denote the ongoing energy expenditure required by the respiratory system. During normal quiet breathing, expiration is passive and does not require work. Half of the work of inspiration is stored in the deformation of the muscles of inspiration and the lung tissue. This potential energy provides the work necessary for expiration. The other half of the work of inspiration is dissipated as heat in overcoming the frictional forces of tissue and gas movement. The oxygen requirement for the work of breathing is less than 2% of the normal basal oxygen consumption (3 to 4 mL/kg per minute). In healthy individuals, the oxygen consumption of the muscles of respiration does not become important until rates of respiration approaching maximal minute ventilation (60 to 80 L per minute, i.e., 15 × basal ventilation) are reached. However, in patients with COPD, due to the mechanical inefficiency of the respiratory system, increasing the minute ventilation to 20 L per minute may increase the oxygen consumption of the muscles of respiration to levels of 200 mL per minute.25
The work performed against the elastic resistance of the lung and chest wall increases proportionally when breathing is slow and deep. Conversely, the work performed against air flow resistance increases when breathing is rapid and shallow. Each individual will have an optimal rate and tidal volume that minimizes the work of breathing depending on the compliance and resistance of their respiratory system. At rest, they will normally breathe at a rate that minimizes the oxygen consumption required for gas exchange. For normal adults, this usually corresponds to a resting respiratory rate of 15 to 16 breaths per minute. For patients with obstructive diseases, this rate will usually tend to be lower and higher for patients with restrictive lung diseases.26
Although the work of breathing is minimal for healthy individuals, it may represent a significant challenge for a patient with respiratory or cardiac failure who has diminished reserves. This always needs to be considered when weaning such a patient from mechanically assisted ventilation.
Respiratory Fatigue
Fatigue of the respiratory system may occur at any point from the central nervous system (CNS) to the muscles of respiration. The diaphragm is possibly the most fatigue-resistant skeletal muscle and can sustain resistive loads of up to 40% of maximal indefinitely. However, fatigue will occur with loads exceeding 40%. Because the oxygen supply requirement for the diaphragm is high in proportion to its mass, it is susceptible to hypoxia either due to decreased oxygen content of the arterial blood or due to decreased cardiac output.27 The diaphragm can be rested for a short period by mechanical ventilation but histologic evidence of muscle fiber atrophy can be seen after as little as 18 hours of mechanical ventilation and clinical evidence of weakness is seen within days.28 Ventilator-induced diaphragm dysfunction is characterized by atrophy of both type 1 and 2 fibers, with altered gene expression leading to an increase in proteolysis.29
Distribution of Ventilation
Initially, it is a difficult concept to grasp, but ventilation is preferentially distributed to the smaller alveoli close to the middle and lower portion of the lungs rather than to the larger alveoli in the more superior lung regions. This is because the lower alveoli are at a steeper portion of their compliance curve (see Fig. 24-15). The most frequent explanation for this nonuniformity is the effect of gravity on the lung parenchyma. In the upright posture, the greatest vertical height is attained by the lung. The tendency for the lung to retract away from the chest wall at its apex creates a more negative (subatmospheric) pleural pressure than the pleural pressure at the lower dependent portions of the lung where its weight reduces the magnitude of the negative pleural pressure. The gradient of pleural pressure from the lung apex to its base has been estimated at 0.4 cm H2O per each centimeter of vertical height. Obviously, one might expect less of a transpulmonary pressure gradient from nondependent to dependent portions of the lung when supine or prone as compared to the upright position. In the upright individual, during a spontaneous breath, inspired gas will tend to preferentially enter those open alveoli near the base of the lung which are the most compliant. As the breath continues, the gas will enter the more apical, less compliant alveoli and any previously atelectatic basilar alveoli as they become recruited by the traction exerted by the remainder of the expanding lung. Also, the rate of inspiration directly impacts the homogeneity of gas distribution. At high inspiratory rates, air is distributed more evenly throughout the lung than at very slow rates.30
Pulmonary Circulation
The lung circulation is composed of two sources of blood flow: the pulmonary circulation from the main pulmonary artery and the smaller bronchial circulation arising from the aorta. The pulmonary circulation dominates, by volume, and serves to deliver the mixed venous blood to the alveolar capillaries to facilitate gas exchange and to act as a large, low-resistance reservoir for the entire cardiac output from the right ventricle. The bronchial circulation serves to provide nutritional support to the airways and their associated pulmonary blood vessels.31 The bronchial circulation also provides a constant source of heat and moisture for warming and humidifying the inspired air.
Pulmonary Hemodynamics
Despite receiving all of the cardiac output from the right ventricle, the pulmonary vasculature maintains a relatively low pulmonary blood pressure. The normal adult mean pulmonary artery pressure (PPA) is 9 to 16 mm Hg with systolic PPA of 18 to 25 mm Hg. Several features enable the pulmonary circulation to maintain this high flow at such low pressures. First, the pulmonary vasculature is extremely thin-walled with far less arterial vascular smooth muscle than its systemic counterparts. The result is a highly compliant reservoir capable of accommodating an average 3.2 L/min/m2 blood flow at rest or six to eight times that flow during exercise. Second, the total PVR is quite low, on the order of less than 250 dynes·sec·cm−5. This minimizes the pressure work faced by the less robust right ventricle while still enabling the right ventricle to match the output of the left ventricle. PVR can change as a result of numerous factors, hypoxia, acidosis, mitral valve stenosis or regurgitation, left ventricular failure, primary pulmonary hypertension, or pulmonary emboli, to name just a few. PVR can be calculated using data from a pulmonary artery catheter as:
PVR = [(PPA − PAOP) / CO] × 79.9
where PAOP is the pulmonary artery catheter occlusion pressure, which is assumed to reflect the left atrial pressure, CO is cardiac output (L/min), and the factor, 79.9 converts from mm Hg/L per minute to units of absolute resistance (dynes·sec·cm−5).
Distribution of Perfusion
There is a gradient of distribution of perfusion of the lung that is similar but not identical to the gradient of distribution of ventilation, with increased perfusion of regions in the central and lower regions compared to the upper regions. This perfusion gradient depends in part on the architecture of the lung and the resistance of the pulmonary vessels, which varies with lung volume and is lowest in the regions of the lung closest to FRC (Fig. 24-29). Gravity, posture, and alveolar pressure will also have effects on the distribution of pulmonary blood flow.32

Matching of Ventilation and Perfusion
Within certain limits, the lung attempts to match ventilation to perfusion. However, the matching is never ideal because the ventilation and perfusion gradients are not identical (Fig. 24-30). This matching is closer during spontaneous ventilation than during positive pressure ventilation. With positive pressure ventilation, the effects of alveolar pressure are increased and pulmonary blood flow distribution becomes less homogeneous. This led to the concept of perfusion zones of the lung as described by West33 (Fig. 24-31A). In this concept, zone 1 (apical) is a region where alveolar pressure (PA) exceeds both pulmonary arteriolar pressure (PPA) and pulmonary venous pressure (PPV); hence, this ventilated lung region has no perfusion. In zone 2 (transitional), PPA exceeds PA, which exceeds PPV with partial limitation of pulmonary blood flow. In zone 3 (basilar), PPA > PPV > PA, so there is unrestricted pulmonary blood flow. In zone 4 (atelectatic), a region of lung collapse, PPA > pulmonary interstitial fluid pressure (PISF) > PPV > PA, so again there is a limitation of pulmonary blood flow depending on the tissue pressure in the region of collapse. Although West’s zones have been a useful concept to emphasize the effects of airway and alveolar pressure on pulmonary blood flow, these zones are an oversimplification. First, because alveolar pressure does not remain constant but varies throughout the respiratory cycle, more so during positive pressure than controlled ventilation. Thus, the boundaries between these zones are constantly moving. Also, it has been demonstrated by perfusion scanning that the distribution of blood flow in the lung is not actually in layers (like a cake) but in concentric spheres (like an onion) (Fig. 24-31B).


Dead Space
Like many concepts in respiratory physiology, dead space is crucially important in clinical practice and deceptively simple on the surface, but actually extremely complex. Any portion of an inspired breath, which does not enter gas exchanging lung units, is dead space (VD). Minute ventilation (VE) is the sum of alveolar ventilation (VA) and dead space ventilation (VD):
VE = VA + VD
Dead space can be subdivided into two primary components: physiologic dead space and apparatus dead space. Apparatus dead space will only apply to patients attached to a breathing circuit. Physiologic dead space is further subdivided into airway dead space and alveolar dead space (Fig. 24-32). The airway dead space is the portion of a breath which goes to the mouth, pharynx, and tracheobronchial tree, but does not enter the alveoli. Airway dead space is also called anatomic dead space by some authors but this latter is a confusing term. Alveolar dead space is the portion of a breath that enters alveoli which are ventilated but not perfused (i.e., West’s zone 1).

Airway dead space is relatively constant. However, it does vary directly with lung volume and bronchodilation increases airway dead space. As tidal volume (VT) decreases, the portion of each breath that is dead space (VD/VT) ratio will increase. Airway dead space will decrease slightly, at lower lung volumes, but not enough to compensate for the fall in VT. Airway dead space is decreased by endotracheal intubation, because much of the mouth and pharynx dead space is bypassed. However, the net effect on total dead space will depend on the additional equipment dead space of the circuit attached to the patient. For most correctly functioning modern anesthetic apparatus, equipment dead space is not clinically important.
A healthy person, breathing spontaneously, will have practically no alveolar dead space. Tidal volume breathing will usually result in a VD/VT ratio of approximately 0.3, entirely due to airway dead space. Alveolar dead space, however, becomes clinically important during positive pressure ventilation and in any condition of altered hemodynamics. Decreased cardiac output, pulmonary embolism, and changes in posture will all have clinically important effects on alveolar dead space, usually by increasing zone 1. These three components: apparatus, airway, and alveolar make up the total dead space.
Measurement of Dead Space
The measurement of dead space was described initially by Bohr.34 Mixed expired gas is collected and CO2 analyzed to give a mixed CO2 tension (PECO2) and the arterial blood gas (Paco2) sampled. The Bohr equation is:
VD/VT = (Paco2 − PECO2)/PaCO2
The derived VD/VT ratio can be applied to minute ventilation or to a single breath. In a healthy person breathing spontaneously, because the alveolar dead space is very small, the end-tidal CO2 tension (PETCO2) can be substituted for PaCO2 in the Bohr equation to measure dead space. In the ventilated patient, alveolar dead space is often clinically significant and the absolute number calculated for dead space with this calculation will be falsely low. Similarly, PETCO2 can be substituted for PECO2 to give an estimate of the alveolar dead space for a ventilated patient. This calculation is crude as an absolute measurement; however, the gradient PaCO2-PETCO2 is clinically an extremely useful trend. It is uncommon for airway dead space to change during the course of an anesthetic, so any increase in the PaCO2-PETCO2 gradient is most likely due to an increase in alveolar dead space. The PaCO2 is inversely related to the alveolar ventilation:
PaCO2 = (VCO2/VA) × K
Where VCO2 is the total body production of CO2 and VA is the alveolar ventilation, and K is a constant. Because the patient’s metabolic rate is usually constant during anesthesia (if body temperature is maintained), VCO2 is relatively constant. Changes of minute ventilation (tidal volume × respiratory rate) will usually cause a direct and inverse change in the PaCO2. However, this equation uses VA (alveolar ventilation) not minute ventilation. If the dead space increases (e.g., decreased cardiac output) and minute ventilation is unchanged, alveolar ventilation will decrease and PaCO2 will rise.
Ventilation monitoring during anesthesia includes monitoring of expired CO2. This is usually presented as time-based capnography. Volume-based capnography is similar but may allow for more accurate measurement of dead space and CO2 production (Fig. 24-33).35

Shunt
Shunt or venous admixture is the portion of the venous blood returned to the heart that passes to the arterial circulation without being exposed to normally ventilated lung units. There are two major subdivisions of shunt: extrapulmonary and pulmonary. Extrapulmonary shunt is venous blood that does not pass through the lungs. There are two normal sources of this shunt: the thebesian veins in the left heart and the bronchial circulation. These normally represent <1% of the total cardiac output. Abnormal types of extrapulmonary shunt include congenital cardiac defects with right-left communications.
Pulmonary shunt is venous blood passing through lung regions with decreased or no alveolar ventilation. Figure 24-32A is an illustration of this concept in which shunt and dead space seem to be unrelated. However, like so much in respiratory physiology, Figure 24-32 is an oversimplification. Shunt and dead space are the extremes of the continuum of ventilation and perfusion matching (Fig. 24-34). Shunt has a large effect on PaO2 but a limited effect on PaCO2. Shunt is the commonest cause of hypoxemia during anesthesia. Other causes are a low alveolar oxygen tension (e.g., hypoventilation or a low inspired O2concentration [FIO2]) or a decreased mixed venous oxygen content (e.g., low cardiac output) (Fig. 24-35). The fraction of total cardiac output (QT) that is shunt (QS) can be calculated from the arterial (CaO2), pulmonary capillary (Cc’O2) and mixed venous (pulmonary arterial) (CvO2) oxygen contents. Calculation of blood oxygen contents will be discussed as follows.
QS/QT = Cc’O2 − CaO2/Cc’O2 − CvO2

This can be remembered as the little step in oxygenation in Figure 24-35 (Cc’O2 − CaO2) divided by the big step in oxygenation (Cc’O2 − CvO2), so normally the shunt fraction (QS/QT) will be very small (<.05).

Alveolar–Arterial Oxygen Difference (A-aDO2)
Although the concept of shunt is extremely important and useful in anesthesia, it is uncommon to actually calculate the shunt fraction in patients. Similar to the calculation of the Pa-ETCO2 gradient as a monitor of changes in dead space, the gradient of alveolar (PAO2) to arterial oxygen (PaO2) tension (A-aDO2) can be used as a crude monitor of shunt. The A-aDO2 gradient is proportional to shunt but the absolute gradient increases as FIO2 increases. However, if FIO2 and PvO2 (i.e., cardiac output and temperature) remain relatively constant, the trend of the A-aDO2 is a reasonably reliable monitor of changes in shunt. The PAO2 is calculated from the theoretical “ideal” alveolar gas equation:
PAO2 = PIO2 − PaCO2/RQ
Because the volume of CO2 produced is normally less than the volume of O2 consumed, the PaCO2 cannot be substituted directly into the equation. In order to estimate the actual tension of oxygen in the ideal alveolus, the PaCO2is divided by the respiratory quotient (RQ).
RQ (CO2 production/O2 consumption) is a dimensionless number which varies according to which substance is being consumed for fuel by the body. For carbohydrates, the approximate RQ = 1.0; for proteins, 0.9 to 0.8; and for fats, 0.7. A mixed value for RQ of 0.8 is commonly used in this equation.
The inspired PO2 (PIO2) depends on the fractional concentration of inspired O2 (Fio2) and the barometric pressure (PB) minus the saturated pressure of water vapor in the alveolus (PH2O), which is 47 mm Hg:
PIO2 = FIO2 × (PB − PH2O)
So the combined alveolar gas equation becomes:
PAO2 = [FIO2 × (PB − PH2O)] − PaCO2/RQ
For a person breathing air (FIO2 = 0.21) at sea level (approximately PB = 760 mm Hg) with a PaCO2 of 40 mm Hg, the ideal alveolar PO2 calculation would be
PAO2 = [0.21 × (760 − 47)] − (40/0.8) = 100 mm Hg
This is a simplified version of the equation which does not compensate for differences in the inspired and expired tidal volumes but is clinically useful for rapid calculation of the A-aDO2.
Matching of Ventilation and Perfusion
Due to the combined effects of the architecture of the lung parenchyma and vasculature and gravity, there is a matching of ventilation and perfusion (VA/Q) in the lung. Typical resting values in an adult are 4 and 5 L per minute for alveolar ventilation and cardiac output for a VA/Q ratio of 0.8. As can be seen from Figure 24-34, this VA/Q matching is optimal in central lung regions but becomes unequal at the apex and base of the lung. Positive pressure ventilation, decreased cardiac output, atelectasis, and many disease states will further interfere with normal VA/Q matching.
Hypoxic Pulmonary Vasoconstriction
The lung has a unique reflex to try and minimize these perturbations in VA/Q matching. This reflex is HPV. The pulmonary arterioles are unique in that they will respond to regional hypoxemia by constricting.36 The arterioles in essentially all other tissues in the body vasodilate in response to hypoxemia. This reflex will tend to redirect blood flow from poorly or non-ventilated lung regions to better ventilated regions. The primary stimulus for HPV is alveolar hypoxia. HPV begins within seconds and is biphasic with most of the rapid-phase response complete within 20 minutes. A slower phase begins after approximately 40 minutes and continues to increase over many hours (Fig. 24-36).37 Of note, once the slow phase of HPV has started, the resolution of HPV will also be delayed. This has important implications for bilateral thoracic surgery cases involving sequential periods of alternating one-lung ventilation.

A low mixed venous PO2 (PvO2), and therefore low pulmonary artery PO2, will augment the HPV response to a hypoxic FIO2 but low PvO2 alone has no effect.38 As the size of the hypoxic lung segment increases, PVR increases, mixed venous oxygen tensions begin to fall, and the ability of HPV to shunt blood to the remaining well-ventilated lung becomes compromised. HPV remains intact despite chemical sympathectomy, bilateral vagotomy, and denervation of the carotid and aortic chemoreceptors.39 Bilateral lung transplant recipients retain their hypoxic pulmonary vasoconstrictive responses.40 HPV is augmented by conditions and chemicals which globally enhance PVR such as acidemia, hypercapnia, histamine, serotonin, and angiotensin II.
The actual cellular oxygen sensor for HPV has yet to be determined. Current research implicates the mitochondria of the pulmonary vascular smooth muscle cell as the main site. Numerous biochemical studies have indicated that selective interruption of the mitochondrial electron transport chain complexes can impair HPV. A unifying theme seems to be the hypoxia-induced change in the level of oxygen free radicals and hydrogen peroxide in the smooth muscle cell. These changes affect the release of calcium from the sarcoplasmic reticulum and the voltage-dependent membrane conductance to potassium resulting in depolarization and contraction of the smooth muscle, hence vasoconstriction.41 The response may involve decreased production of nitric oxide by the pulmonary epithelium and endothelium.42
Oxygen Transport
Oxygen diffuses into the plasma of the pulmonary capillary blood, driven by its concentration gradient from the alveolus. This oxygen is then taken up by partially desaturated hemoglobin (Hb) molecules in the red blood cells of mixed venous blood to form oxyhemoglobin. Due to the high affinity of Hb for oxygen, a large proportion (normally >98%) of the total oxygen in arterial blood is carried within the red blood cells as oxyhemoglobin. Less than 2% is circulated as dissolved oxygen. However, it is actually the tension of the oxygen dissolved in plasma (PaO2) that is measured in an arterial (or venous [PvO2]) blood gas sample. There is a dynamic equilibrium between the oxygen dissolved in plasma and that bound to Hb within the red blood cells. The quantity of oxygen dissolved in blood is directly proportional to its partial pressure. For each mm Hg of PO2, there is 0.003 mL of dissolved oxygen per 100 mL of blood. Thus, for a PaO2 of 100 mm Hg, there will be 0.3 mL of dissolved O2 in 100 mL of blood. This compares to approximately 20 mL of O2 bound to Hb in the red cells and is usually not of clinical importance. However, this dissolved oxygen can approach 1.5 mL with an FIO2 of 1.0 and can be clinically even more important in hyperbaric environments.
Normal adult hemoglobin (HbA) is a four-protein molecule with two α chains and two β chains. Each protein chain is attached to one heme unit (Fig. 24-37). Heme is an iron-porphyrin complex capable of reversible binding to one oxygen molecule at its ferrous (Fe++) atom. As each of the four heme units binds an oxygen molecule, it causes a change in the shape of the Hb molecule which, in turn, causes the other heme units to be more exposed. The result is that each successive oxygen molecule is bound less (or more) tightly and released more (or less) easily. So the release of oxygen by Hb as the PO2 in the surrounding plasma falls (and conversely the uptake of O2 by Hb as the PO2rises) is not in a linear correlation with PO2 but curvilinear producing the oxyhemoglobin saturation curve (or dissociation curve) (Fig. 24-38).

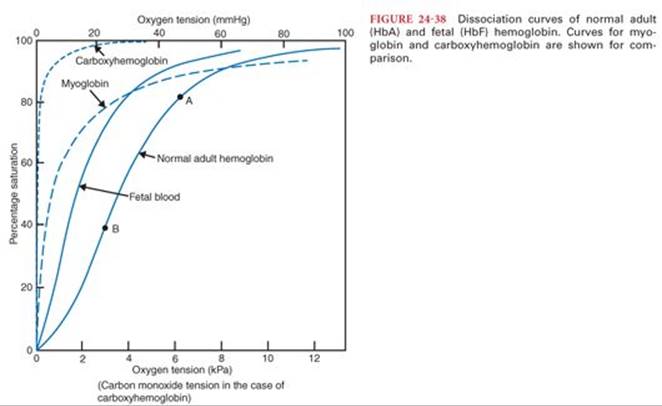
PO2 values of 40, 50, and 60 will correspond (approximately) to saturations of 70%, 80%, and 90%.
The oxygen content of blood can be calculated if the PaO2, the concentration of Hb in the blood, and the percent saturation of Hb is known. Pure HbO2 will contain 1.39 mL/g. The saturation of the Hb in a blood sample is measured spectrophotometrically by comparing the absorption of two different wavelengths of near infrared light; one wavelength at which oxyhemoglobin (HbO2) and deoxyhemoglobin have approximately the same absorbance (typically 940 nm) and one at which they differ widely (typically 660 nm). Pulse oximetry uses the same principle but corrects for the peak arterial phase of a capillary blood flow by subtracting for the baseline venous flow absorption. Modern rapid blood gas analyzers often estimate O2 saturation based on measured PO2 and standard oxyhemoglobin curves corrected for pH.
The content of oxygen in blood = dissolved O2 + O2 bound as HbO2
For 100 mL blood = (PO2 × 0.003) + (Hb concentration × saturation/100 × 1.39)
For a patient with a Hb of 15 g/dL a PO2 of 100 and saturation of 99% the blood, O2 content would be = (100 × 0.003) + (15 × 0.99 × 1.39) = 0.3 + 20.6 = 20.9 mL O2/100 mL blood. Mixed venous blood commonly has a saturation of approximately 70%, thus an O2 content of 15 mL/100 mL.
Shifts of the Oxyhemoglobin Desaturation Curve
There are multiple different normal and abnormal variants of the Hb molecule. Each of these different Hb molecules has a different oxyhemoglobin desaturation curve (see Fig. 24-38). By convention, to compare these curves, the PO2 at the point of 50% saturation (P50) is used as a reference. For HbA, the P50 is 26 mm Hg. Fetal hemoglobin (HbF) has 2 α chains and 2 γ chains. It is the major form of Hb present at birth and is replaced by HbA over the first 6 months of life. HbF has a P50 of 19 so it is “left-shifted” from HbA. Because its affinity for O2 is stronger than HbA, O2 is preferentially drawn from the mother’s blood to that of the fetus. Carboxyhemoglobin (COHb) is an abnormal Hb formed when carbon monoxide binds with heme. Carbon monoxide displaces O2 from heme and it shifts the oxyhemoglobin curve to the extreme left so that oxygen is not released to the tissues and cellular hypoxia results. The Fe++ atom in heme can be oxidized to Fe+++ by a variety of drugs and chemicals such as nitrates. This forms a type of Hb called methemoglobin and will not bind O2.
The normal HbA oxygen saturation curve shifts to the left or right secondary to a variety of physiologic changes. An increase in hydrogen ion (H+) concentration (i.e., a decrease in serum pH), an increase in body temperature (T) and an increase in 2,3-diphosphoglycerate (DPG) shift the curve to the right. 2,3-DPG is a compound normally present in red blood cells that tends to decrease the affinity of Hb for O2. It is increased by exposure to a low environmental O2 (e.g., at altitude) or in anemia. This can be remembered as DPG, H+, and T shift the Hb oxygen saturation curve to the right (riGHT). And their converses (decrease DPG, alkalosis, hypothermia) shift the curve to the left. In most situations of physiologic stress (i.e., hypercarbia, acidosis, etc.), it is advantageous to have the HbO2 curve shifted to the right and to increase oxygen unloading to the tissues.
There is normally no significant oxygen storage capacity in the body. This is unlike carbon dioxide, which has large stores in the body (see the following text). Oxygen is like rocket fuel and can be toxic to issues in excess over a prolonged period. An average-size adult’s oxygen consumption is approximately 250 mL per minute. The total content of oxygen in their blood will be approximately 700 to 800 mL and in their FRC 500 mL (breathing air). Tissue hypoxia will begin very quickly if the oxygen supply is cut off. Washing out the FRC with an FIO2 of 1.0 can potentially provide a reserve of 2,500 mL of O2, a supply adequate for several minutes of apnea.
Carbon Dioxide Transport
Carbon dioxide (CO2) is the main product of aerobic metabolism of proteins, fats, and carbohydrates. Carbon dioxide is moderately soluble in all body fluids (approximately 20 times more soluble than oxygen) and diffuses down its concentration gradient from its site of intracellular production into the capillary and venous blood. Similar to oxygen, the tension of dissolved CO2 in blood is the portion measured in blood gas analysis. As can been seen in Figure 24-39, CO2 transport is like an upside-down iceberg with the dissolved CO2 as the only visible portion. But, this is only a small proportion of the total CO2 in the blood. The majority of carbon dioxide is transformed to bicarbonate ion in the following reaction:
CO2 + H2O = H2CO3 = H+ + HCO3−

The first step of this reaction is slow in plasma but progresses rapidly in the presence of the enzyme carbonic anhydrase, which is present in red blood cells. The majority of CO2 in the blood follows this pathway and is transported in the blood as bicarbonate (HCO3−) after diffusion into red cells and enzymatic conversion (Fig. 24-40). A small portion of the CO2 is transported in the blood combined to Hb as carbamino compounds. Blood with lower oxyhemoglobin saturation (i.e., venous blood) is capable of carrying more CO2 than blood with well-saturated Hb (i.e., arterial). This is known as the Haldane effect. The Haldane effect is complicated and involves both increased carbamino-CO2 carrying by desaturated Hb and also increased buffering of intracellular H+ by deoxygenated Hb, which is less acidic than oxygenated Hb.

There are two effects that are involved in the physiology of gas transport in the blood. They can be remembered as:
1. Shifts of the OHb curve due to changes in H+, the Bohr effect: (bOHr)
2. Changes in CO2 transport due to changes in oxygen saturation, the Haldane effect (the other one)
Because the volume of CO2 in blood is large compared to the volume of O2, for changes of approximately equal volumes of gas in the blood, the PCO2 will change much less than the PO2. For example, the volume production of CO2 is approximately 0.8 of the oxygen consumption. However, the difference in PCO2 between venous and arterial blood is normally only 5 mm Hg, whereas the difference between arterial and venous PO2 is typically 60 mm Hg.
Respiratory Control
Central Nervous System
The stimulus for normal breathing is generated spontaneously by a combination of at least six groups of neurons in the medulla of the brainstem. Each neuronal group seems to be primarily responsible for one phase of the respiratory cycle: early inspiration, late inspiration, early expiration, etc. The function of these neuronal groups is primarily under the control of the central chemoreceptor area, also in the medulla. The central chemoreceptor increases or decreases minute ventilation according to the cerebral spinal fluid pH to maintain normocapnia43 (Fig. 24-41).

Dissolved CO2 in plasma diffuses easily across the blood–brain barrier into the cerebrospinal fluid (CSF) where it interacts with H2O to form H+ and HCO3−. The H+ concentration in the CSF is the primary controller for normal minute ventilation. H+ and HCO3− in plasma cross the blood–brain barrier very slowly. The brainstem central chemoreceptor is acutely sensitive to changes in pH. Normally, an awake individual’s PaCO2 will vary less than 3 mm Hg. If the PaO2 is normal, minute ventilation will increase 2 to 3 L per minute for each 1 mm Hg increase in PaCO2 to restore arterial and CSF pH to normal levels. Ventilation will increase in a linear fashion as PaCO2 rises until a maximal stimulation somewhere over a PaCO2 of 100 mm Hg is reached or until the respiratory mechanics will no longer permit an increase in minute ventilation. At levels over 100 mm Hg, dissolved CO2 in the CSF begins to exert a narcotic effect on the CNS.
The central chemoreceptor is acutely sensitive to CNS depressants. Opioids, sedatives, and most general anesthetics decrease the respiratory response to hypercapnia.
Peripheral Chemoreceptors
The peripheral chemoreceptors are located primarily in the carotid bodies at the bifurcation of the carotid arteries and also in aortic bodies above and below the aortic arch. These receptors respond primarily to changes in PaO2.44They function as a backup system and in the normal individual do not have a primary role in control of ventilation. The innervation of the carotid bodies is via the glossopharyngeal nerve (CN IX) and the aortic bodies via the vagus nerve (CN X). Although there is some tonic activity from these peripheral chemoreceptors, they do not normally stimulate ventilation until the PaO2 falls to below a threshold of approximately 70 to 80 mm Hg. This threshold will be lowered in individuals who are adapted to altitude and in some chronic respiratory or congenital hypoxic cardiac diseases. The nerve stimulus from the peripheral chemoreceptors has two complementary actions to increase ventilation. Primarily, there is a direct effect on the medullary respiratory neurons. Secondarily, there is an effect to increase the sensitivity to the stimulus of the central chemoreceptor to CSF pH (dashed line A in Fig. 24-41). The peripheral chemoreceptors also are sensitive to changes in arterial pH and PaCO2, and acidosis will increase the hypoxic drive (dashed line B in Fig. 24-41). The hypoxic drive due to the peripheral chemoreceptors is decreased by volatile anesthetics, even in very low concentrations such as 0.1 minimum alveolar concentration (MAC), which are often present immediately after recovery from general anesthesia.45 Although the hypercapnic response is also blunted in a dose-dependent fashion by volatile anesthetics, the response to hypoxemia is even more profoundly blocked.
Because of the combined effects of residual opioids on the central chemoreceptors and the blunting of hypoxic drive by trace amounts of volatile anesthetics, it is a common practice to initially administer supplemental oxygen to patients in the recovery room after general anesthesia then to follow the oxygen saturation using pulse oximetry as the supplemental oxygen is decreased prior to discharge. In the absence of shunt, with supplemental oxygen to raise the FIO2 to 0.4, a patient’s minute ventilation can fall temporarily to one-third of its normal value without significant hypoxemia (however, the PaCO2 will rise and the pH will fall).
Other Neural Connections to the Medullary Respiratory Centers
The entire airway from the mucosal lining of the nose and mouth to the distal bronchi has both afferent and efferent neural connections to the central respiratory neurons. These connections are responsible for many of the normal respiratory reflexes such as the phasic inspiratory dilation of the upper airway during inspiration to maintain patency of the supra-glottic airway. This reflex activity is easily obtunded by CNS sedatives and anesthetics and is responsible for much of the upper airway obstruction seen during anesthesia and compounds the airway obstruction in patients with obstructive sleep apnea (OSA). Irritants in the airway trigger cough and sneeze reflexes via these neuronal connections.
The lung has stretch receptors that, in the nonsedated state, respond to regional changes in compliance associated with atelectasis by triggering a recruitment maneuver such as a sigh or a yawn (if you are yawning as you read this, hopefully it is to recruit your lungs and not because the content is boring). Passive stretching of the lungs can result in either inhibition of inspiration (Herring-Breuer reflex) or gasping (Heads reflex) depending on the clinical context.
The pulmonary capillaries are densely innervated by unmyelinated nerves (C fibers). This innervation is not important during normal ventilation but may be responsible for causing a sensation of dyspnea when the capillaries become engorged during congestive heart failure.
Abnormal Breathing Patterns
Abnormal patterns of breathing are rare. There are several recognized abnormal patterns which involve dysfunction of the central chemoreceptors. Primary alveolar hypoventilation syndrome (Ondine’s curse) is a congenital insensitivity of the central chemoreceptor to changes in CSF pH. It results in apnea and hypoventilation, particularly during sleep. It can be treated with noninvasive ventilation and diaphragmatic pacing. Cheyne-Stokes respiration is a pattern of 10- to 20-second periods of apnea followed by periods of hyperventilation.46 It is seen in some patients with CNS damage or severe illness and also during adaptation to altitude. It is caused by a delayed response interval in the central chemoreceptor. Cheyne-Stokes is the most severe form of periodic breathing, which is seen to some degree in neonates and the elderly and during sleep at all ages.
Altered Physiologic Conditions
Anesthesia
Nunn47 showed that during anesthesia and spontaneous ventilation, gas exchange was altered by shunt and inhomogeneous V/Q ratios. He concluded from his observations that a normal range of PaO2 could be maintained if the alveolar PO2 (PAO2) was at least 200 mm Hg, which would require an FIO2 of at least 35%. Brismar and colleagues48 in 1985 demonstrated using computed tomography that within 5 minutes of the induction of anesthesia, dependent regions of the lung developed an increase in density consistent with atelectasis. It is now accepted that this occurs in dependent lung regions in approximately 90% of patients who undergo general anesthesia using a wide variety of agents. Epidural anesthesia may be the one modality that appears to cause very little atelectasis and no change in VA/Q matching or oxygenation.
The near universal finding of rapid lung collapse upon induction of anesthesia and the rapid reappearance after discontinuation of PEEP has led to the conclusion that atelectasis is due to compression of lung tissue rather than alveolar gas absorption behind occluded airways.49 The fluoroscopic study by Froese and Bryan50 of diaphragmatic motion of spontaneously breathing volunteers demonstrated that in the supine position the dependent portion of the diaphragm has the greatest displacement with each breath. Initiation of paralysis with neuromuscular blocking agents and positive pressure ventilation creates a reversal of this motion with the nondependent or superior aspect of the diaphragm undergoing the greatest displacement with each ventilated breath.50 Others have confirmed and extended these observations using computed tomography.51 It is now apparent that the geometry of the chest and diaphragm is altered under general anesthesia with relaxation of the chest wall and a marked cephalad displacement of the most dorsal portion of the diaphragm at end-expiration.
Absorption atelectasis can occur when the rate of gas uptake into the blood exceeds the rate of ventilation of the alveolus. The extreme condition is total occlusion of an airway which isolates the alveolar gas in the distal alveolar and respiratory airways. The gas pressure within this compartment initially is nearly at atmospheric pressure. However, given that mixed venous blood continues to perfuse this area, and the fact that the sum of the gas partial pressures within mixed venous blood is subatmospheric, gas uptake from the occluded compartment by blood continues and the alveoli collapses. Computer modeling has demonstrated that the rate of gas absorption from unventilated areas is dependent on the initial FIO2.52 However, in many clinical situations, the airway is not completely occluded but rather ventilation to an area becomes severely reduced. If the inspired VA/Q ratio of a respiratory unit is reduced, a point is reached where the rate at which inspired gas enters the alveolus is exactly balanced by the gas uptake into the blood. If VA/Q ratio drops below this critical equilibrium point, the volume of the alveolus declines and collapse ensues. Again, this process is augmented by the presence of a high PAO2 and a rapid rate of gas uptake.
Loss of alveolar surfactant may play a role in alveolar instability at low alveolar volumes and collapse. The rapidity of alveolar collapse following alveolar recruitment maneuvers and discontinuation of PEEP has suggested that atelectasis per se may interfere with surfactant production. Therefore, atelectatic regions of the lung may be predisposed to recurrence of collapse because of reduced levels of surfactant, increased alveolar surface tension and, the aforementioned mechanisms, all contributing to reduced alveolar volumes. The effects of anesthetic drugs on HPV and ventilation/perfusion matching will be considered in the next chapter on Respiratory Pharmacology.
Position
In the spontaneously breathing patient, awake or during anesthesia, the majority of gas exchange is due to caudal displacement of the diaphragm, which occurs primarily in the dorsal portions of the thoraces. During deep anesthesia and paralysis, the diaphragm becomes relatively flaccid. The weight of the abdominal contents pushes cranially on the dorsal diaphragm and during inspiration, with positive pressure ventilation, gas preferentially distributes to the now more compliant ventral portions of the lungs.53 The distribution of perfusion remains largely unchanged with predominance to the central and dependent portions of the lung. Thus, matching of ventilation/perfusion is decreased with induction of anesthesia and further decreased with paralysis and positive pressure ventilation. The addition of low levels of PEEP (<10 cm H2O, after recruitment) will usually ameliorate this mismatch by slightly overdistending ventral lung regions but moving dependent lung regions to a more compliant portion of their pressure-volume curve.
During anesthesia and positive pressure ventilation in the prone position, the majority of diaphragm displacement during inspiration will remain in the dorsal (now the nondependent) portions of the thoraces and ventilation will be more homogeneously distributed in the lungs compared to the supine position. Matching of ventilation to perfusion will usually be superior in the prone position when compared with the supine position. However, unlike the supine position, the addition of PEEP in the prone position may lead to deterioration in ventilation/perfusion matching.54 This applies to patients with normal lungs. This is unlike the situation in the patient with ARDS. In these patients in the supine position, pulmonary edema collects in the parenchyma of the dorsal portions of the lung. The combination of prone position and PEEP may lead to a more favorable matching of ventilation to perfusion, although this effect may be transient. The effects of the lateral position will be discussed in the “One-Lung Ventilation” section.
Obesity
The increased weight of the abdominal contents and chest wall impose a restrictive ventilatory pattern on the respiratory system with a decrease of all lung volumes but a preservation of the FEV1/FVC ratio.55This is primarily important to the anesthesiologist because of the fall in FRC, which leads to increased venoarterial shunt and a tendency to desaturate during induction and maintenance of anesthesia and in the postoperative period. The FRC of an awake mildly obese patient of body mass index (BMI) 30 kg/m2 will be 75% of predicted for a similar person but with a BMI of 20 and for a patient with a BMI >40 the FRC will be <66% predicted. Early studies of PEEP during anesthesia in obese patients showed mixed results in terms of improving oxygenation. This is due to the rapid development of atelectasis in these patients and the inability of PEEP, by itself, to correct atelectasis. As can be seen in Figure 24-42, the combination of a recruitment maneuver and 10 cm H2O PEEP can eliminate atelectasis in a morbidly obese patient. The challenge in respiratory management of the obese patient perioperatively is to minimize the fall in FRC. This can be done with a variety of methods including the use of regional anesthesia/analgesia, avoiding long-acting muscle relaxants, positioning, and the use of postoperative CPAP.
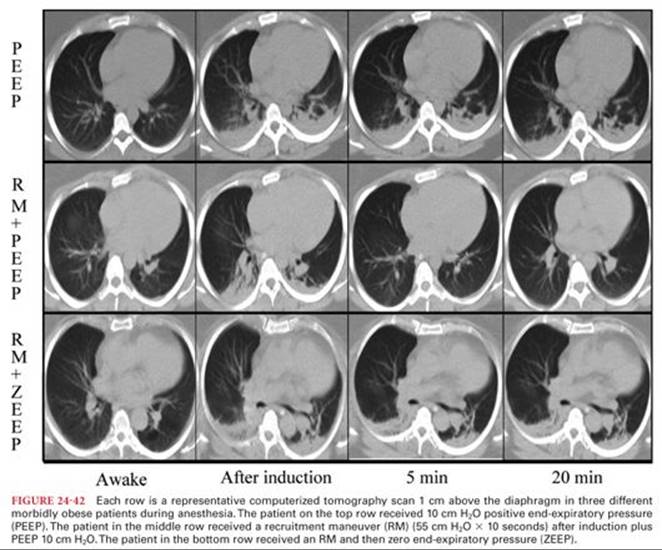
Sleep-Disordered Breathing
Approximately 20% of the population has disorders of respiration during sleep ranging from simple snoring to OSA. These disorders all involve variable degrees of upper airway obstruction and apnea during normal sleep. OSA is defined by more than five episodes per hour of apnea, each >10 seconds. It is often combined with periods of hypopnea in the sleep apnea hypopnea syndrome (SAHS). OSA may be exacerbated by fluid shifts to the upper body from the legs during sleep in patients with sedentary lifestyles.56 The disturbance of normal sleep leads to daytime somnolence and the periods of hypoxia may contribute to cardiovascular morbidity. Treatments may include weight loss, CPAP devices, and upper airway surgery.57 The obesity hypoventilation syndrome is a combination of obesity, hypoventilation, and severe OSA, which has been called the Pickwickian syndrome.58
Exercise
Normal oxygen consumption at rest is approximately 200 to 250 mL per minute (3 to 4 mL/kg per minute) for an adult; this is termed one metabolic equivalent (MET). Quick walking or climbing one flight of stairs requires 4 METs, bowling 8 METs, and competitive cross-country skiing 14 METs. Olympic rowers, skiers, and cyclists may exceed 80 mL/kg per minute oxygen consumption (20 METs).59 To achieve this increase in oxygen consumption requires matching increases in minute ventilation and cardiac output. At a certain point, the increases in ventilation and cardiac output will not be able to supply adequate oxygen to the tissues for aerobic metabolism and further increase in muscle activity will require anaerobic metabolism producing lactic acid. This is called the anaerobic threshold. It is most often the accumulation of lactate in tissues causing muscle dysfunction which limits prolonged exercise and not a limitation on minute ventilation or cardiac output. Exercise training raises the maximal oxygen consumption (VO2max), the anaerobic threshold, and the tolerance for lactic acidosis. Exercise testing is an established medical procedure to measure a patient’s VO2max or to distinguish between respiratory and cardiac limitations in exercise capacity. VO2max has been shown to be a useful preoperative test to identify patients at increased risk of complications from pulmonary resection surgery (preoperative VO2max <15 to 20 mL/kg per minute) but has not been as well validated for other types of surgical procedure.15 A useful estimate of a COPD patient’s VO2max can be made from the maximal distance they can walk in 6 minutes the “6-minute walk test” (6MWT). If the distance in meters is divided by 30, the result is an approximation of the VO2max (e.g., 6MWT distance = 450 m, VO2max = 450/30 = 15 mL/kg per minute).60
Altered Barometric Pressures
Altitude: The ambient PO2 decreases proportionally as the barometric pressure falls with increases in altitude. The PO2 is 149 mm Hg at sea level, 122 at 5,000 ft of elevation (e.g., Denver), and may be as low as 108 mm Hg in a commercial airliner pressurized to 8,000 ft (maximum permitted altitude-equivalent). For comparison, on the summit of Mount Everest, the PO2 is 47 mm Hg (63,000 ft). There are both acute and chronic adaptations to the hypoxia associated with altitude. Primarily, the rapid adaptation involves hyperventilation, driven by the peripheral chemoreceptors to decrease the alveolar PCO2 and thus increase the alveolar PAO2. The secondary alkalinization of blood and CSF returns to normal after several days at altitude as bicarbonate is excreted. The increased pulmonary pressures due to HPV triggered by hypoxia can lead to high altitude pulmonary edema. This can be treated with oxygen, diuretics, and pulmonary vasodilators. Increased cerebral blood flow due to hypoxia is opposed in part by the cerebral vasoconstriction due to hypocapnia but may lead to cerebral edema. Chronic acclimatization to altitude involves a variety of cellular and metabolic changes such as a resetting of the peripheral chemoreceptors and polycythemia.
Anesthesia at mild elevations is generally uncomplicated as long as oxygen saturation is monitored and adequate supplemental oxygen is provided. This can be a problem with nitrous oxide. Most modern commercial vaporizers deliver reasonably accurate dosages of volatile anesthetics at modest elevations (<6,000 ft). Pressure in the air-filled cuff of an endotracheal tube or laryngeal mask airway will increase and decrease significantly with changes in ambient pressure, which may be associated with medical air transport.61
Hyperbaric oxygen in medical practice is delivered in a chamber pressurized to 2 to 3 times atmospheric pressure (ATM) (i.e., 1,400 to 2,100 mm Hg). Treatments are given with a high FIO2, usually from a tight-fitting mask for several hours and repeated as required.62 Indications include gas embolism, decompression sickness, necrotizing soft tissue infections, and carbon monoxide poisoning. At high FIO2levels, above 2 ATM, hyperoxia may cause convulsions. Prolonged exposure to a high PAO2 causes pulmonary oxygen toxicity and a restrictive lung disease. A high PAO2 in the neonate can cause retrolental fibroplasias, damaging the retinal of the eye.
Age
Infants and children: The overall compliance of the respiratory system is low in newborns and increases until late adolescence. Alveoli at birth have a lower amount of elastin than adults and a decreased amount of surfactant leading to decreased lung compliance. However, the compliance of the chest wall in newborns and infants is very high due to the absence of ossification of cartilages. This predisposes infants to a significant fall in FRC during anesthesia. In the awake state, FRC is maintained above CC in infants by a rapid respiratory rate. The respiratory muscles of infants have a lower percentage of fatigue-resistant type I fibers and they are more prone to respiratory fatigue. All airways are proportionately smaller in infants than adults and airway resistance is higher, resulting in increased work of breathing at rest and particularly during upper or lower airway infections (e.g., croup). The narrowest portion of the upper airway is at the cricoid cartilage until age 5 years.63
Control of breathing in the newborn is unique. Hypoxia initially causes increased ventilation, as in the adult, but then leads to a decrease in ventilation.64 This is more exaggerated in preterm infants. Oxygen consumption is higher in newborns than adults (6 to 8 mL/kg/minute). HbF predominates at birth until 3 to 6 months of age. HbF hemoglobin has a low P50 (18 to 19 mm Hg), which increases oxygen loading in the placenta but decreases oxygen unloading in the tissues.
The elderly: changes in the respiratory system with age include decrease of muscle tone in the dilators of the pharynx, predisposing to upper airway obstruction during anesthesia.65 There is a loss of the pulmonary vascular bed, which results in an increase of PVR and a 30% increase in mean pulmonary artery pressures and an increase in the alveolar dead space. The lung parenchyma loses elastic support tissue resulting in an increase of lung compliance, but the chest wall increases in stiffness so the net effect is an overall decrease in respiratory system compliance. With the loss of structural support of peripheral airways, the CC increases significantly; this is the change which has major anesthetic implications. The fall of FRC below CC leads to increased venoarterial shunt and is responsible for the decrease in PaO2 with age. The mean PaO2 of healthy patients will decline to approximately 80 mm Hg at age 70, after which it remains stable. The responsiveness of both central and peripheral chemoreceptors to hypercarbia and hypoxemia decreases with age.
Chronic Respiratory Disease
Chronic respiratory disease is commonly divided into two major categories: obstructive and restrictive. In obstructive disease, the FEV1/FVC ratio is typically less than normal (<80%) with a decreased FEV1. Restrictive disease typically has a normal FEV1/FVC ratio and a decreased FEV1. There is some overlap, with some patients (e.g., cystic fibrosis) showing a mixed obstructive/restrictive pattern. Severity of these diseases can be graded according to the FEV1 as a percent of predicted values: mild, FEV1 >70%; moderate, 50% to 70%; severe, 30% to 50%; and very severe <30%.
COPD incorporates three disorders: emphysema, peripheral airways disease, and chronic bronchitis. Any individual patient may have one or all of these conditions, but the dominant clinical feature is impairment of expiratory airflow. Life expectancy may be less than 3 years in severe COPD patients >60 years of age. Mild COPD patients should not have significant dyspnea, hypoxemia, or hypercarbia and other causes should be considered if these are present.66
Some moderate and severe COPD patients have an elevated PaCO2 at rest. It is not possible to differentiate these “CO2 retainers” from nonretainers on the basis of history, physical examination, or spirometric pulmonary function testing. This CO2 retention seems to be related to an inability to maintain the increased work of respiration (Wresp) required to keep the PaCO2 normal in patients with mechanically inefficient pulmonary function and not primarily due to an alteration of respiratory control mechanisms. The PaCO2 rises in these patients when supplemental FIO2 is administered due to a relative decrease in alveolar ventilation and an increase in alveolar dead space and shunt by the redistribution of perfusion away from lung areas of relatively normal V/Q matching to areas of very low V/Q ratio because regional HPV is decreased and also due to the Haldane effect.67 However, supplemental oxygen must be administered to these patients postoperatively to prevent the hypoxemia associated with the unavoidable fall in FRC. The attendant rise in PaCO2 should be anticipated and monitored. To identify these patients preoperatively, all moderate or severe COPD patients need an arterial blood gas analysis. Also, it is important to know the patient’s baseline preoperative PaCO2 to guide weaning if mechanical ventilation becomes necessary in the postoperative period.
COPD patients desaturate more frequently and severely than normal patients during sleep.68 This is due to the rapid/shallow breathing pattern that occurs in all patients during REM sleep. In COPD patients breathing air, this causes a significant increase in the respiratory dead space/tidal volume (VD/VT) ratio and a fall in alveolar oxygen tension (PAO2) and PaO2. This is not the SAHS. There is no increased incidence of SAHS in COPD.
Right ventricular dysfunction occurs in up to 50% of moderate to severe COPD patients.69 The dysfunctional right ventricle is poorly tolerant to sudden increases in afterload such as the change from spontaneous to controlled ventilation. Right ventricular function becomes critical in maintaining cardiac output as the pulmonary artery pressure rises. The right ventricular ejection fraction does not increase with exercise in COPD patients as it does in normal patients. Chronic recurrent hypoxemia is the cause of the right ventricular dysfunction and the subsequent progression to cor pulmonale. Patients who have episodic hypoxemia in spite of normal lungs (e.g., central alveolar hypoventilation, SAHS) develop the same secondary cardiac problems as COPD patients. The only therapy which has been shown to improve long-term survival and decrease right heart strain in COPD is supplemental oxygen. COPD patients who have resting Pao2 less than 55 mm Hg should receive supplemental home oxygen and also those who desaturate to less than 44 mm Hg with exercise. The goal of supplemental oxygen is to maintain a PaO2 60 to 65 mm Hg. Compared to patients with chronic bronchitis, emphysematous COPD patients tend to have a decreased cardiac output and mixed venous oxygen tension while maintaining lower pulmonary artery pressures.
Many patients with moderate or severe COPD will develop cystic air spaces in the lung parenchyma known as bullae (Fig. 24-43). These bullae will often be asymptomatic unless they occupy more than 50% of the hemithorax, in which case the patient will present with findings of restrictive respiratory disease in addition to their obstructive disease. A bulla is a localized area of loss of structural support tissue in the lung with elastic recoil of surrounding parenchyma (Fig. 24-44).70 The pressure in a bulla is actually the mean pressure in the surrounding alveoli averaged over the respiratory cycle. This means that during normal spontaneous ventilation, the intra-bulla pressure is actually slightly negative in comparison to the surrounding parenchyma. However, whenever positive pressure ventilation is used, the pressure in a bulla will become positive in relation to the adjacent lung tissue and the bulla will expand with the attendant risk of rupture, tension pneumothorax, and bronchopleural fistula. Positive pressure ventilation can be used safely in patients with bullae provided the airway pressures are kept low and there is adequate expertise and equipment immediately available to insert a chest drain and obtain lung isolation if necessary. Due to the lower solubility of nitrogen in plasma compared to nitrous oxide, when a patient is converted from breathing air to breathing a mixture containing nitrous oxide during anesthesia, the nitrous oxide will diffuse into a bulla faster than the nitrogen can be absorbed and the bulla will increase in size with the attendant risk of rupture.


Severe COPD patients are often “flow-limited” even during tidal volume expiration at rest. Flow-limitation is present in normal patients only during a forced expiratory maneuver. Flow-limitation occurs when an EPP develops in the intrathoracic airways during expiration. During quiet expiration in the normal patient, the pressure in the lumen of the airways always exceeds the intrapleural pressure because of the upstream elastic recoil pressure, which is transmitted from the alveoli. The effect of this elastic recoil pressure diminishes as air flows downstream in the airway. With a forced expiration the intrapleural pressure may equal the intraluminal pressure at a certain point, the EPP, which then limits the expiratory flow (see Fig. 24-27). Then, any increase in expiratory effort will not produce an increase in flow at that given lung volume. Flow-limitation occurs particularly in emphysematous patients, who primarily have a problem with loss of lung elastic recoil and have marked dyspnea on exertion. Flow-limitation causes dyspnea because of stimulation of mechanoreceptors in the muscles of respiration, thoracic cage, and in the airway distal to the EPP. Any increase in the work of respiration will lead to increased dyspnea. This variable mechanical compression of airways by overinflated alveoli is the primary cause of the airflow obstruction in emphysema. Severely flow-limited patients are at risk for hemodynamic collapse with the application of positive pressure ventilation due to dynamic hyperinflation of the lungs. Even the modest positive airway pressures associated with manual ventilation with a bag/mask at induction can lead to hypotension because these patients have no increased resistance to inspiration but a marked obstruction of expiration. In some of these patients, this has contributed to the “Lazarus” syndrome in which patients have recovered from a cardiac arrest only after resuscitation and positive pressure ventilation were discontinued.71
Patients with severe COPD often breathe in a pattern that interrupts expiration before the alveolar pressure has fallen to atmospheric pressure. This incomplete expiration is due to a combination of factors which include flow-limitation, increased work of respiration and increased airway resistance. This interruption leads to an elevation of the end-expiratory lung volume above the FRC. This PEEP in the alveoli at rest has been termed auto-PEEP or intrinsic-PEEP. During spontaneous respiration, the intrapleural pressure will have to be decreased to a level which counteracts auto-PEEP before inspiratory flow can begin. Thus, COPD patients can have an increased inspiratory load added to their already increased expiratory load.
Auto-PEEP becomes even more important during mechanical ventilation. It is directly proportional to tidal volume and inversely proportional to expiratory time. The presence of auto-PEEP is not detected by the manometer of standard anesthesia ventilators. It can be measured by end-expiratory flow interruption, a feature available on most intensive care ventilators. Auto-PEEP has been found to develop in most COPD patients during one-lung anesthesia.72
Restrictive lung diseases are often part of a multisystemic disease process such as connective tissue disorders. In a minority of patients, there is no other systemic disease (i.e., idiopathic pulmonary fibrosis). Patients are often more debilitated by their underlying disease (e.g., rheumatoid arthritis) than their lung disease. Patients with mild to moderate restrictive lung disease are, in general, less of a problem for the anesthesiologist to manage intraoperatively (compared to COPD) and more of a problem postoperatively. Due to the decrease in FRC in restrictive disease, these patients tend to develop an increased shunt during anesthesia and postoperatively. Restoration of the FRC postoperatively is commonly a problem and the use of regional anesthesia/analgesia, short-acting opioids and muscle relaxants, and noninvasive ventilation are often of benefit in the patient with restrictive disease.
One-Lung Ventilation
One-lung ventilation (OLV) is performed during thoracic surgery to facilitate the surgical exposure in the chest. OLV is commonly obtained by placement of a double-lumen endobronchial tube or a bronchial blocker with a standard endotracheal tube. During OLV, the anesthesiologist has the unique and often conflicting goals of trying to maximize atelectasis in the nonventilated lung to improve surgical access while trying to avoid atelectasis in the ventilated lung (usually the dependent lung) to optimize gas exchange. The gas mixture in the nonventilated lung immediately before OLV has a significant effect on the speed of collapse of this lung.73 Because of its low blood-gas solubility, nitrogen (or an air-oxygen mixture) will delay collapse of this lung. This is particularly a problem at the start of minimally invasive thoracic surgery when surgical visualization in the operative hemithorax is limited and in patients with emphysema who have delayed collapse of the nonventilated lung due to decreased lung elastic recoil. It is important to thoroughly denitrogenate the operative lung, by ventilating with oxygen, immediately before it is allowed to collapse. Although nitrous oxide is even more effective than oxygen in speeding lung collapse (because of its solubility), it is not commonly used in thoracic anesthesia because many patients may have blebs or bullae. During the period of two-lung anesthesia before the start of OLV, atelectasis will develop in the dependent lung. It is useful to perform a recruitment maneuver to the dependent lung (similar to a Valsalva maneuver, holding the lung at an end-inspiratory pressure of 20 cm H2O for 15 to 20 seconds) immediately after the start of OLV to decrease this atelectasis. Recruitment is important to maintain Pao2 levels during subsequent OLV.74
A major concern that influences anesthetic management for thoracic surgery is the occurrence of hypoxemia during OLV. There is no universally acceptable figure for the safest lower limit of oxygen saturation during OLV. A saturation greater than or equal to 90% (PaO2 >60 mm Hg) is commonly accepted, and for brief periods, a saturation in the high 80s may be acceptable in patients without significant comorbidity. However, the lowest acceptable saturation will be higher in patients with organs at risk of hypoxia due to limited regional blood flow (e.g., coronary or cerebrovascular disease) and in patients with limited oxygen transport (e.g., anemia or decreased cardiopulmonary reserve). Previously, hypoxemia occurred frequently during OLV. Reports for the period 1950 to 1980 describe an incidence of hypoxemia (arterial saturation <90%) of 20% to 25%. Current reports describe an incidence of less than 5%. This improvement is most likely due to several factors: improved lung isolation techniques, such as routine fiberoptic bronchoscopy to prevent lobar obstruction from double-lumen tubes; improved anesthetic agents, which cause less inhibition of HPV; and better understanding of the pathophysiology of OLV.
The pathophysiology of OLV is complex and involves the body’s ability to redistribute pulmonary blood flow to the ventilated lung. Several factors aid and impede this redistribution and these are under the control of the anesthesiologist to a variable degree. These factors are illustrated in Figure 24-45. The anesthesiologist’s goal during OLV is to maximize PVR in the nonventilated lung while minimizing PVR in the ventilated lung. PVR is lowest at FRC and increases as lung volume rises or falls above or below FRC. The anesthesiologist’s aim, to optimize pulmonary blood flow redistribution during OLV, is to maintain the ventilated lung as close as possible to its FRC while facilitating collapse of the nonventilated lung to increase its PVR.75 Most thoracic surgery is performed in the lateral position. Patients having OLV in the lateral position have significantly better Pao2 levels than patients during OLV in the supine position due to a preferential distribution of blood flow to the dependent lung caused by gravitational forces.

Extracorporeal Ventilatory Support
Various devices to supplement or replace the gas exchange function of the lung have been available clinically for the past several decades. These devices have been associated with a high incidence of complications, particularly cerebral hemorrhage and infarction, and have met with questionable outcome results in several studies. However, gradual progress in the technology has seen a resurgence of use of these devices.76 Indications currently may include infant respiratory distress syndrome, adult respiratory distress syndrome, respiratory failure unresponsive to mechanical ventilation, and as a bridge to transplantation in end-stage lung diseases. During extracorporeal ventilation, less injurious mechanical ventilation strategies can be used on the native lungs with relatively normal FIO2 and tidal volumes to allow some regression of the disease process in the lungs.
The options for extracorporeal ventilatory support include venovenous membrane oxygenation, with an oxygenator and a pump, indicated in primary respiratory failure; venoarterial membrane oxygenation, for combined respiratory and cardiac failure; and pumpless interventional lung assist, with a passive arterial-venous membrane gas-exchange device, which is primarily used in failure of CO2 excretion with relatively maintained oxygenation.77
References
1. Jaeger JM. Blank RS. Essential anatomy and physiology of the respiratory system and pulmonary circulation. In: Slinger P, ed. Principles and Practice of Anesthesia for Thoracic Surgery. New York, NY: Springer; 2011:51–69.
2. Shorten GD, Opie NJ, Graziotti P, et al. Assessment of the upper airway in awake, sedated and anaesthetized patients using magnetic resonance imaging. Anaesth Intens Care. 1994;22:165–169.
3. Hudgel DW, Hendricks C. Palate and hypopharynx—sites of inspiratory narrowing of the upper airway during sleep. Am Rev Respir Dis. 1988;138:1542–1547.
4. Eikermann M, Grosse-Sundrup M, Zaremba S, et al. Ketamine activates breathing and abolishes the coupling between loss of consciousness and upper airway dilator muscle function. Anesthesiology. 2012;116:6–8.
5. Bartlett D. Respiratory function of the larynx. Physiol Rev. 1989;69: 33–57.
6. Gal TJ. Anatomy and physiology of the respiratory system and the pulmonary circulation. In: Kaplan JA, Slinger PD, eds. Thoracic Anesthesia. 3rd ed. Philadelphia, PA: Churchill Livingstone; 2003: 57–70.
7. Voynow JA, Rubin BK. Mucins, mucus, and sputum. Chest. 2009; 135:505–512.
8. Gonda I. Particle deposition in the human respiratory tract. In: Crystal RG, West JB, Weibel ER, et al, eds. The Lung: Scientific Foundations. 2nd ed. Philadelphia, PA: Lippincott-Raven; 1997:2289–2308.
9. Lumb AB, ed. Nunn’s Applied Respiratory Physiology, 7th ed. Edinburgh, United Kingdom: Churchill Livingstone Elsevier; 2010.
10. Burwell DR, Jones JG. The airways and anaesthesia. Anaesthesia. 1996;51:849–857.
11. Duggan M, Kavanagh B. Pulmonary atelectasis. Anesthesiology. 2005;102:838–854.
12. Chappell D, Jacob M, Hofman-Keifer K, et al. A rational approach to perioperative fluid management. Anesthesiology. 2008;109: 723–724.
13. McKenzie DK, Gandevia SC. Skeletal muscle properties: diaphragm and chest wall. In: Crystal RG, West JB, Weibel ER, et al, eds. The Lung: Scientific Foundations. 2nd ed. Philadelphia, PA: Lipincott-Raven; 1997:981–991.
14. Levine S, Kaiser L, Leferovich J, et al. Cellular adaptations in the diaphragm in chronic obstructive pulmonary disease. New Engl J Med. 1997;337:1799–1806.
15. Lim E, Baldwin D, Beckles M, et al. Guidelines on the radical management of patients with lung cancer. Thorax. 2010;65(suppl 3): iii1–iii27.
16. Sprung J, Gajic O, Warner DO. Age related alterations in respiratory function-anesthetic consideration. Can J Anaesth. 2006;53: 1244–1257.
17. Rothen HU, Sporre B, Engberg G, et al. Airway closure, atelectasis, and gas exchange during general anesthesia. Br J Anaesth. 1998;81:681–686.
18. Whitsett JA, Weaver TE. Hydrophobic surfactant proteins in lung function and disease. N Engl J Med. 2002;347:2141–2148.
19. Harris RS. Pressure-volume curves of the respiratory system. Respir Care. 2005;50:78–99.
20. Slats AM, Janssen K, van Schadewijk A, et al. Bronchial inflammation and responses to deep inspiration in asthma and chronic bronchitis. Am J Respir Crit Care Med. 2007;176:121–128.
21. Holst M, Striem J, Hedenstierna G. Errors in tracheal pressure recording in patients with a tracheostomy tube—a model study. Intensive Care Med. 1990;16:384–389.
22. Cotes JE, Chinn DJ, Miller MR. Lung Function. Physiology, Measurement and Application in Medicine. Oxford, United Kingdom: Blackwell Publishing; 2006.
23. Raux M, Starus C, Redolfi S, et al. Electroencephalographic evidence for pre-motor cortex activation during inspiratory loading in humans. J Physiol. 2007;578:569–578.
24. Ingram RH, McFadden ER. Localisation and mechanisms of airway responses. N Engl J Med. 1977;297:596–600.
25. Campbell EJM, Westlake EK, Cherniak RM. Simple methods of estimating oxygen consumption and the efficiency of the muscles of respiration. J Appl Physiol. 1957;11:303–308.
26. Lumb AB, ed. Nunn’s Applied Respiratory Physiology. 7th ed. Edinburgh, United Kingdom: Churchill Livingstone Elsevier; 2010.
27. Fujii Y, Toyooka H, Amaha K. Diaphragmatic fatigue and its recovery are influenced by cardiac output. J Anaesth. 1991;5:17–23.
28. Levine S, Nguyen T, Taylor N, et al. Rapid disuse atrophy of diaphragm fibers in mechanically ventilated humans. N Engl J Med. 2008;358:1327–1355.
29. Goligher EC, Ferguson ND, Kavanagh BP. Ventilator induced diaphragm dysfunction. Anesthesiology. 2012;117:560–567.
30. Bake B, Wood L, Murphy B, et al. Effect of inspiratory flow rate on regional distribution of inspired gas. J Appl Physiol. 1974;37: 8–17.
31. Widdicombe J. Anatomy and physiology of the airway circulation. Am Rev Respir Dis. 1992;146:S3–S7.
32. Clark AR, Tawhai MH, Hoffman EA, et al. The interdependent contributions of gravitational and structural features to perfusion distribution in a multiscale model of the pulmonary circulation. J Appl Physiol. 2011;110:943–955.
33. West J, Dollery C, Naimark A. Distribution of blood flow in isolated lung; relation to vascular and alveolar pressures. J Appl Physiol. 1964;19:713–724.
34. Bohr C. Uber die lugenathmung. Skand Arch Physiol. 1891;2:236.
35. Tusman G, Sipmann S, Bohm SH. Rationale of dead space measurement by volumetric capnography. Anesth Analg. 2012;114:866–874.
36. Sylvester JT, Shimoda LA, Aaronson PI, et al. Hypoxic pulmonary vasoconstriction. Physiol Rev. 2012;92:367–520.
37. Talbot NP, Balanos GM, Dorrington KL, et al. Two temporal components within the human pulmonary vascular response to 2h of isocapnic hypoxia. J Appl Physiol. 2005;98:1125–1139.
38. Domino KB, Wetstein L, Glasser SA, et al. Influence of mixed venous oxygen tension (PvO2) on blood flow to atelectatic lung. Anesthesiology. 1983;59:428–434.
39. Lejeune P, Vachiaery JL, Leeman M, et al. Absence of parasympathetic control of pulmonary vascular pressure-flow plots in hyperoxic and hypoxic dogs. Respir Physiol. 1989;78:123–133.
40. Robins ED, Theodore J, Burke CM, et al. Hypoxic vasoconstriction persists in the human transplanted lung. Clin Sci. 1987;72:283–287.
41. Evans AM, Dipp M. Hypoxic pulmonary vasoconstriction: cyclic adenosine diphosphate-ribose, smooth muscle Ca2+ stores and the endothelium. Respir Physiol Neurobiol. 2002;132:3–15.
42. Yamamoto Y, Nakano H, Ide H, et al. Role of airway nitric oxide on the regulation of pulmonary circulation by carbon dioxide. J Appl Physiol. 2001;91:1121–1130.
43. Gourine AV. On the peripheral and central chemoreception and control of breathing: an emerging role for ATP. J Physiol. 2005; 568:715–724.
44. Lopez-Barneo J, Ortega-Saenz P, Pardal R, et al. Carotid body oxygen sensing. Eur Respir J. 2008;32:1386–1398.
45. Knill RL, Manninen PH, Clement JL. Ventilation and chemoreflexes during enflurane sedation and anaesthesia in man. Can Anaesth Soc J. 1979;26:353–360.
46. Lorenzi-Filho G, Genta PR. A new straw in the genesis of Cheyne-Stokes respiration. Chest. 2008,134:7–9.
47. Nunn JF. Factors influencing the arterial oxygen tension during halothane anaesthesia with spontaneous respiration. Br J Anaesth. 1964;36:327–324.
48. Brismar B, Hedenstierna G, Lundquist H, et al. Pulmonary densities during anesthesia with muscular relaxation—a proposal of atelectasis. Anesthesiology. 1985;62:422–428.
49. Magnusson L, Spahn DR. New concepts of atelectasis during general anaesthesia. Brit J Anaesth. 2003;91:61–72.
50. Froese AB, Bryan AC. Effects of anesthesia and paralysis on diaphragmatic mechanics in man. Anesthesiology. 1974;41:242–255.
51. Reber A, Nylund U, Hedenstierna G. Position and shape of the diaphragm: implications for atelectasis formation. Anaesthesia. 1998;53:1054–1061.
52. Joyce CJ, Baker AB, Kennedy RR. Gas uptake from an unventilated area of the lung: computer model of absorption atelectasis. J Appl Physiol. 1993;74:1107–1116.
53. Gattinoni L, Caironi P. Prone positioning beyond physiology. Anesthesiology. 2010;113:1262–1264.
54. Petersson J, Ax M, Frey J, et al. Positive end-expiratory pressure redistributes regional blood flow and ventilation differently in supine and prone humans. Anesthesiology. 2010;113:1361–1369.
55. Jones RL, Nzekwu M-MU. The effects of body mass index on lung volumes. Chest. 2006;130:827–833.
56. Redolfi S, Yumino D, Ruttanaumpawan P. Relationship between overnight rostral fluid shift and obstructive sleep apnea in nonobese men. Am J Resp Crit Care Med. 2009;179:241–246.
57. Horner RL, Bradley TD. Update in sleep and control of ventilation 2008. Am J Resp Crit Care Med. 2009;179:528–532.
58. Mokhlesi B, Tulaimat A. Recent advances in the obesity hypoventilation syndrome. Chest. 2007;132:1322–1336.
59. Ainsworth BE, Haskell WL, Leon AS, et al. Compendium of physical activities: classification of energy costs of human physical activities. Med Sci Sports Exerc. 1993;25:71–80.
60. Carter R, Holiday DB, Stocks J, et al. predicting oxygen uptake for men and women with moderate to severe chronic obstructive pulmonary disease. Arch Phys Med Rehab. 2003;64:328–332.
61. Leissner KB, Mahmood FU. Physiology and pathophysiology at high altitude: considerations for the anesthesiologist. J Anesth. 2009;23: 534–553.
62. Tibbles PM, Eisenberg JS. Hyperbaric-oxygen therapy. N Engl J Med. 1993;334:1642–1648.
63. McNeice WL, Dierdorf SF. The pediatric airway. Semin Pediatr Surg. 2004;13:152–159.
64. Rigatto H, Brady J, Verduzco R. Chemoreceptor reflexes in preterm infants. Pediatrics. 1975:55:604–610.
65. Zaugg M, Lucchinetti E. Respiratory function in the elderly. Anesthesiol Clin North America. 2000;18:47–58.
66. American Thoracic Society. Standards for the diagnosis and care of patients with chronic obstructive pulmonary disease. Am J Respir Crit Care Med. 1995;152:s77–s121.
67. Simpson SQ. Oxygen-induced acute hypercapnia in chronic obstructive pulmonary disease: what’s the problem? Crit Care Med. 2002;30:258–259.
68. Douglas NJ, Flenley DC. Breathing during sleep in patients with obstructive lung disease. Am Rev Respir Dis. 1990;141:1055–1057.
69. Schulman DS, Mathony RA. The right ventricle in pulmonary disease. Cardiol Clin. 1992;10:111–120.
70. Morgan MDL, Edwards CW, Morris J, et al. Origin and behavior of emphysematous bullae. Thorax. 1989;44:533–537.
71. Ben-David B, Stonebraker VC, Hershman R, et al. Survival after failed intraoperative resuscitation: a case of “Lazarus syndrome.” Anesth Analg. 2001;92:690–695.
72. Slinger P, Hickey D. The interaction applied PEEP and auto-PEEP during one-lung ventilation. J Cardiothorac Vasc Anesth. 1998;12: 133–138.
73. Ko R, Kruger M, McRae K, et al. The use of air in the inspired gas mixture during two-lung ventilation delays lung collapse during one-lung ventilation. Anesth Analg. 2009;108:1092–1097.
74. Unzueta C, Tusman G, Suarez-Sipman F, et al. Alveolar recruitment improves ventilation during thoracic surgery: a randomized controlled trial. Br J Anaesth. 2012;108:517–524.
75. Slinger PD, Kruger M, McRae K, et al. The relation of the static compliance curve and PEEP to oxygenation during one-lung ventilation. Anesthesiology. 2001;95:1096–1102.
76. Peek GJ, Mugford M, Tiruvoipati R, et al. CESAR trial collaboration. Efficacy and economic assessment of conventional ventilatory support versus extracorporeal membrane oxygenation for severe adult respiratory failure (CESAR): a multicentre randomised controlled trial. Lancet. 2009;374:1351–1363.
77. Von Dossow-Hanfstingl V, Deja M, Zwisser B, et al. Post-operative management: extra-corporeal ventilatory therapy. In: Slinger P, ed. Principles and Practice of Anesthesia for Thoracic Surgery. New York, NY: Springer; 2011:647.