
Objectives
The student, through understanding normal cardiac function, diagnoses and appreciates the consequences of common cardiac abnormalities:
● Detects common cardiac arrhythmias from the electrocardiogram, identifies their physiological bases, and describes their physiological consequences.
● Lists 4 common cardiac valve abnormalities for the left side of the heart and describes the alterations in intracardiac and arterial pressures, flow patterns, and heart sounds that accompany them.
● dentifies the consequences of similar valve abnormalities for the right side of the heart.
Recall that effective, efficient ventricular pumping action depends on proper cardiac function in 5 basic aspects. This chapter focuses on the abnormalities in 3 of these aspects: (1) abnormal cardiac excitation and rhythmicity, (2) valvular stenosis (inadequate valve opening), and (3) valvular insufficiency (incomplete valve closure). Discussion of abnormalities in myocardial force production and cardiac filling is presented in Chapter 11. The material presented here is an introduction to the more common cardiac electrical and cardiac valve dysfunctions, with an emphasis on the primary physiological consequences of these abnormal situations.
Electrical abnormalities and arrhythmias
Many cardiac excitation problems can be diagnosed from the information in a single lead of an electrocardiogram. The lead II electrocardiogram traces at the top of Figures 5-1 and 5-2 are identified as normal sinus rhythms based on the following characteristics: (1) the frequency of QRS complexes is approximately 1/s, indicating a normal beating rate; (2) the shape of the QRS complex is normal for lead II and its duration is less than 120 ms, indicating rapid depolarization of the ventricles via normal conduction pathways; (3) each QRS complex is preceded by a P wave of proper configuration, indicating sinoatrial (SA) nodal origin of the excitation; (4) the PR interval is less than 200 ms, indicating proper conduction delay of the impulse propagation through the atrioventricular (AV) node; (5) the QT interval is less than half of the R- to-R interval, indicating normal ventricular repolarization; and (6) there are no extra P waves, indicating that no AV nodal conduction block is present. The subsequent electrocardiographic tracings in Figures 5-1 and 5-2 represent irregularities commonly found in clinical practice.
Examination of each of these traces with the above characteristics in mind will aid in the differential diagnosis.
The physiological consequences of abnormal excitation and conduction in the heart depend on whether the electrical abnormality evokes a tachycardia, which will limit the time for cardiac filling between beats; evokes a bradycardia, which is inadequate to support sufficient cardiac output; or decreases the coordination of myocyte contraction, which will reduce stroke volume.
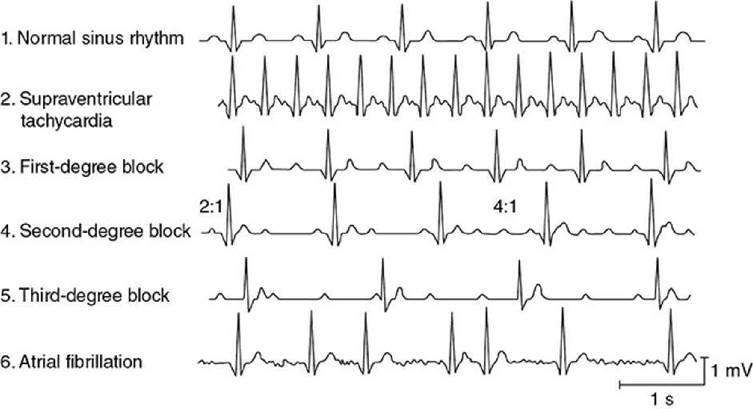
Figure 5-1. Supraventricular arrhythmias.
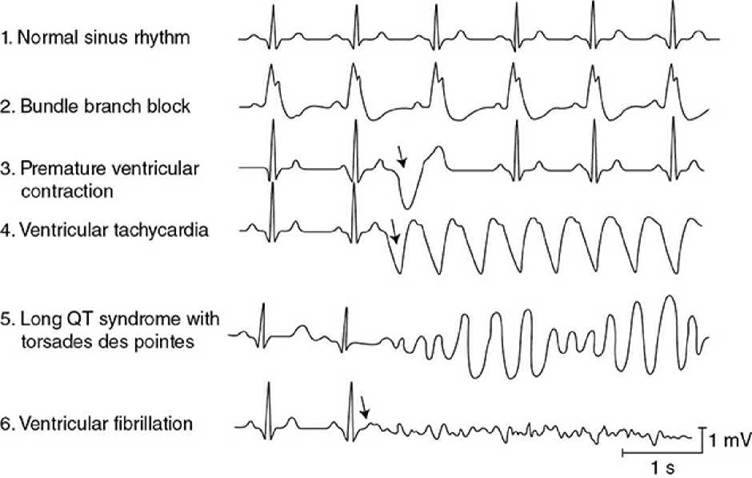
Figure 5-2. Ventricular arrhythmias.
Supraventricular Abnormalities
Traces 2 through 6 below the normal trace in Figure 5-1 represent typical supraventricular arrhythmias (i.e., originating in the atria or AV node). Supraventricular tachycardia (shown in trace 2 in Figure 5-1 and sometimes called paroxysmal atrial tachycardia) occurs when the atria are abnormally excited and drive the ventricles at a very rapid rate. These paroxysms often begin abruptly, last for a few minutes to a few hours, and then, just as abruptly, disappear and the heart rate reverts to normal. QRS complexes appear normal (albeit frequent) with simple paroxysmal atrial tachycardia because the ventricular conduction pathways operate normally. The P and T waves may be superimposed because of the high heart rate. Low blood pressure and dizziness may accompany bouts of this arrhythmia because the extremely high heart rate does not allow sufficient diastolic time for ventricular filling.
There are 2 mechanisms that may account for supraventricular tachycardia. First, an atrial region, often outside the SA node, may become irritable (perhaps because of local interruption in blood flow) and begin to fire rapidly to take over the pacemaker function. Such an abnormal pacemaker region is called an ectopic focus. Alternatively, atrial conduction may become altered so that a single wave of excitation does not die out but continually travels around some abnormal atrial conduction loop. In this case, the continual activity in the conduction loop may drive the atria and AV node at a very high frequency. This self-sustaining process is called a reentry phenomenon and is illustrated in Figure 5-3. This situation may develop as a result of abnormal repolarization and altered refractory periods in local areas of the myocardium. Atrial flutter is a special form of tachycardia of atrial origin in which a large reentrant pathway drives the atria at very fast rates (250-300 beats/min) and normal refractory periods of AV nodal tissue are overwhelmed. Thus, ventricular rate is often some fixed ratio of the atrial rate (2:1, 4:1) with frequencies often 150 to 220 beats/min. The electrocardiogram often shows a sawtooth pattern of merged P waves with intermittent normal QRS complexes.
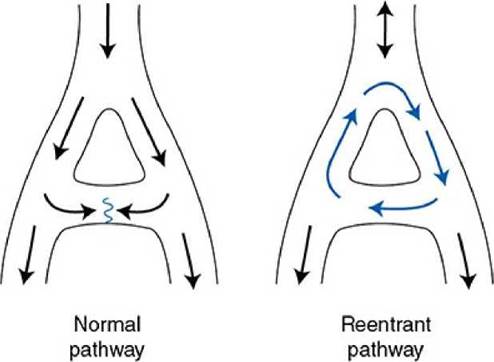
Figure 5-3. Normal and reentrant (circus) cardiac excitation pathways.
Conduction blocks occur at the AV node and generally represent impaired conduction through this tissue. In a first-degree heart block (trace 3 in Figure 5-1), the only electrical abnormality is unusually slow conduction through the AV node. This condition is detected by an abnormally long PR interval (>0.2 s). Otherwise, the electrocardiogram may be completely normal. At normal heart rates, the physiological effects of the first-degree block are inconsequential. The danger, however, is that the slow conduction may deteriorate to an actual interruption of conduction.
A second-degree heart block (trace 4 in Figure 5-1) is said to exist when some, but not all, atrial impulses are transmitted through the AV node to the ventricle. Impulses are blocked in the AV node if the cells of the region are still in a refractory period from a previous excitation. In this situation, the primary problem is a slower-than-normal conduction through the AV nodal region and thus the second-degree block is aggravated by high atrial rates. In the second-degree block, some, but not all, P waves are accompanied by corresponding QRS complexes and T waves. Atrial rate is often faster than ventricular rate by a certain ratio (e.g., 2:1, 3:1, and 4:1). This condition may not represent a serious clinical problem as long as the ventricular rate is adequate to meet the pumping needs.
In a third-degree heart block (trace 5 in Figure 5-1), no impulses are transmitted through the AV node. In this event, some area in the ventricles —often in the common bundle or bundle branches near the exit of the AV node—assumes the pacemaker role for the ventricular tissue. Atrial rate and ventricular rate are completely independent, and P waves and QRS complexes are totally dissociated in the electrocardiogram. Ventricular rate is very likely to be slower than normal (bradycardia) and is often slow enough to impair cardiac output.
Atrial fibrillation (trace 6 in Figure 5-1) is characterized by a complete loss of the normally close synchrony of the excitation and resting phases between individual atrial cells. Cells in different areas of the atria depolarize, repolarize, and are excited again randomly. Consequently, no P waves appear in the electrocardiogram, although there may be rapid, irregular, small waves apparent throughout diastole. The ventricular rate is often very irregular in atrial fibrillation because impulses enter the AV node from the atria at unpredictable times. Fibrillation is a self-sustaining process. The mechanisms behind it are not well understood, but impulses are thought to progress repeatedly around irregular conduction pathways (sometimes called circus pathways, which imply a reentry phenomenon as described earlier and in Figure 5-3). However, because atrial contraction often plays a minor role in ventricular filling in resting individuals, atrial fibrillation may be tolerated by some patients as long as ventricular rate is sufficient to maintain the cardiac output. 1
Atrial flutter also represents a breakdown of the normal atrial conduction pathways but is less chaotic with much of the atrial tissue being re-excited in sync with a single rapidly reverberating circus pathway. The ECG often will look like the second-degree AV nodal block with a very rapid atrial rate (4:1 or more).
Ventricular Abnormalities
Traces 2 through 6 below the normal trace in Figure 5-2 show typical ventricular electrical abnormalities. Conduction blocks called bundle branch blocks or hemiblocks (trace 2 in Figure 5-2) can occur in either of the branches of the Purkinje system of the intraventricular septum, often as a result of a myocardial infarction. Ventricular depolarization is less synchronous than normal in the half of the heart with the nonfunctional Purkinje system. This results in a widening of the QRS complex (>0.12 s) because a longer time is required for ventricular depolarization to be completed. The direct physiological effects of bundle branch blocks are usually inconsequential.
Premature ventricular contractions (PVCs) (trace 3 in Figure 5-2) are caused by action potentials initiated by and propagated away from an ectopic focus in the ventricle. As a result, the ventricle depolarizes and contracts before it normally would. A PVC is often followed by a missed beat (called a compensatory pause) because the ventricular cells are still refractory when the next normal impulse emerges from the SA node. The highly abnormal ventricular depolarization pattern of a PVC produces the large-amplitude, long-duration deflections on the electrocardiogram. The shapes of the electrocardiographic records of these extra beats are highly variable and depend on the ectopic site of their origin and the depolarization pathways involved. The volume of blood ejected by the premature beat itself is smaller than normal, whereas the stroke volume of the beat following the compensatory pause is larger than normal. This is partly due to the differences in filling times and partly to an inherent phenomenon of the cardiac muscle called postextrasystolic potentiation. Single PVCs occur occasionally in most individuals and, although sometimes alarming to the individual experiencing them, are not dangerous. Frequent occurrence of PVCs, however, may be a signal of possible myocardial damage or perfusion problems.
Ventricular tachycardia (trace 4 in Figure 5-2) occurs when the ventricles are driven at high rates, usually by impulses originating from a ventricular ectopic focus. Ventricular tachycardia is a very serious condition. Not only is diastolic filling time limited by the rapid rate, but also the abnormal excitation pathways make ventricular contraction less synchronous and therefore less effective than normal. In addition, ventricular tachycardia often precedes ventricular fibrillation.
Prolonged QT intervals (the left side of trace 5 in Figure 5-2) are a result of delayed ventricular myocyte repolarization, which may be due to inappropriate opening of sodium channels or prolonged closure of potassium channels during the action potential plateau phase. Although the normal QT interval varies with heart rate, it is normally less than 40% of the cardiac cycle length (except at very high heart rates). Long QT syndrome is identified when the QT interval is greater than 50% of the cycle duration. It may be genetic in origin (mutations influencing various ion channels involved with cardiac excitability), may be acquired from several electrolyte disturbances (low blood levels of Ca2 +, Mg 2 +, or K +), or may be induced by several pharmacological agents (including some antiarrhythmic drugs). The prolongation of the myocyte refractory period, which accompanies the long QT syndrome, extends the vulnerable period during which extra stimuli can evoke tachycardia or fibrillation. Patients with long QT syndrome are predisposed to a particularly dangerous type of ventricular tachycardia called torsades de pointes (“twisting of points,” as shown on the right side of trace 5 in Figure 5-2). This differs from the ordinary ventricular tachycardia in that the ventricular electrical complexes cyclically vary in amplitude around the baseline and can deteriorate rapidly into ventricular fibrillation.
In ventricular fibrillation (trace 6 in Figure 5-2), various areas of the ventricle are excited and contract asynchronously. The mechanisms are similar to those in atrial fibrillation. The ventricle is especially susceptible to fibrillation whenever a premature excitation occurs at the end of the T wave of the previous excitation, that is, when most ventricular cells are in the “hyperexcitable” or “vulnerable” period of their electrical cycle. In addition, because some cells are repolarized and some are still refractory, circus pathways can be triggered easily at this time. Because no pumping action occurs with ventricular fibrillation, the situation is fatal unless quickly corrected by cardiac conversion. During conversion, the artificial application of large currents to the entire heart (via paddle electrodes applied across the chest) may be effective in depolarizing all heart cells simultaneously, thus allowing a normal excitation pathway to be reestablished.
Myocardial ischemia can also cause changes in the basic ECG pattern. In addition to potential alterations in cardiac excitation and conduction described above, chronic inadequate coronary flow to the subendocardium may cause T wave inversion, and ST segment depression. A more severe interruption of coronary flow causing a transmural infarct will usually result in ST segment elevation.
Cardiac valve abnormalities
Pumping action of the heart is impaired when the valves do not function properly. Abnormal heart sounds, which often accompany cardiac valvular defects, are called murmurs. These sounds are caused by abnormal pressure gradients and turbulent blood flow patterns that occur during the cardiac cycle. A number of techniques, ranging from simple auscultation (listening to the heart sounds) to echocardiography or cardiac catheterization, are used to obtain information about the nature and extent of these valvular malfunctions.
In general, when a valve does not open fully (i.e., is stenotic), the chamber upstream of the valve has to develop more pressure during its systolic phase to achieve a given flow through the valve. This increase in “pressure” work will induce hypertrophy of cardiac muscle cells and thickening of the walls of that chamber. When a valve does not close completely (i.e., is insufficient), the regurgitant blood flow represents an additional volume that must be ejected in order to get sufficient forward flow out of the ventricle into the tissues. This increase in “volume” work often leads to chamber dilation but not to an increase in wall thickness. 2
A second generality about valve abnormalities is that whenever there is an elevation in the atrial pressure as a result of AV valve stenosis or regurgitation, this will result in higher pressures in the upstream capillary beds. If capillary hydrostatic pressures are elevated, tissue edema will ensue with consequences on the function of those upstream organs.
A brief overview of 4 of the common valve defects influencing left ventricular function is given in Figure 5-4. Note that similar stenotic and regurgitant abnormalities can occur in right ventricular valves with similar consequences on right ventricular function.
Aortic Stenosis
Some characteristics of aortic stenosis are shown in Figure 5-4A.
Normally, the aortic valve opens widely and offers a pathway of very low resistance through which blood leaves the left ventricle. If this opening is narrowed (stenotic), resistance to flow through the valve increases. A significant pressure difference between the left ventricle and the aorta may be required to eject blood through a stenotic aortic valve. As shown in Figure 5-4A, intraventricular pressures may rise to very high levels during systole, while aortic pressure rises more slowly than normal to a systolic value that is subnormal. Pulse pressure is usually low with aortic stenosis. High intraventricular pressure development is a strong stimulus for cardiac muscle cell hypertrophy, and an increase in left ventricular muscle mass invariably accompanies aortic stenosis. This tends to produce a leftward deviation of the electrical axis. (The mean electrical axis will fall in the upper right-hand quadrant as shown in Figure 4-6.) Blood being ejected through the narrowed orifice may reach very high velocities, and turbulent flow may occur as blood enters the aorta. This abnormal turbulent flow can be heard as a systolic (or ejection) murmur with a properly placed stethoscope. The primary physiological consequence of aortic stenosis is a high ventricular afterload that is caused by restriction of the outflow tract. This imposes an increased pressure workload on the left ventricle.
Mitral Stenosis
Some characteristics of mitral stenosis are shown in Figure 5-4B. A pressure difference of more than a few millimeters of mercury across the mitral valve during diastole is distinctly abnormal and indicates that this valve is stenotic. The high resistance mandates an elevated pressure difference to achieve normal flow across the valve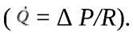 Consequently, as shown in Figure 5-4B, left atrial pressure is elevated with mitral stenosis. The high left atrial workload may induce hypertrophy of the left atrial muscle. Elevated left atrial pressure is reflected back into the pulmonary bed and, if high enough, causes pulmonary congestion and “shortness of breath.” A diastolic murmur associated with turbulent flow through the stenotic mitral valve can often be heard. The primary physiological consequences of mitral stenosis are elevations in left atrial pressure and pulmonary capillary pressure. The latter can cause pulmonary edema and interference with normal gas exchange in the lungs (leading to shortness of breath).
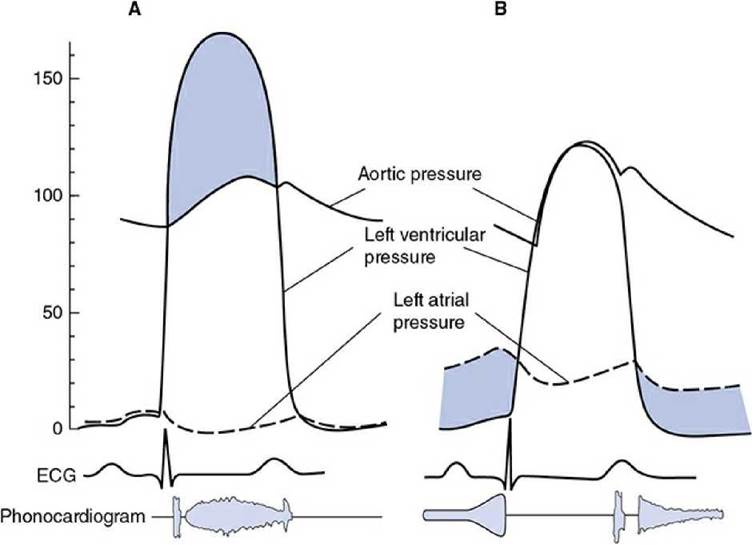
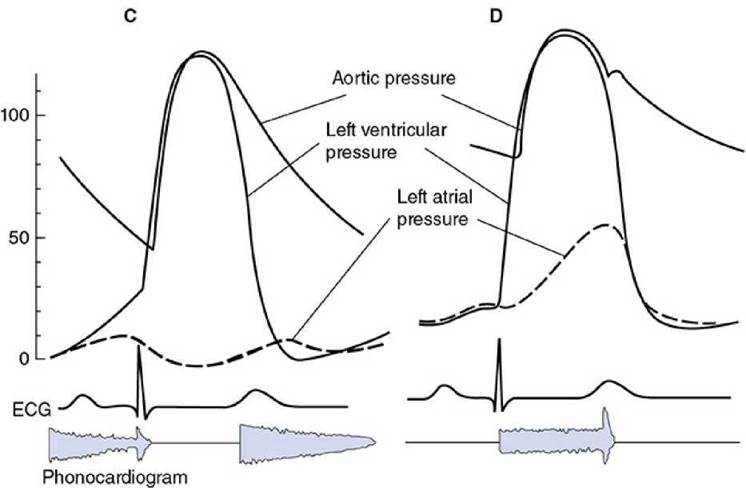
Figure 5—4. Characteristics of left ventricular valve abnormalities: ( A) aortic stenosis, ( B) mitral stenosis, ( C) aortic regurgitation (insufficiency), and ( D) mitral insufficiency.
Aortic Insufficiency
Typical characteristics of aortic regurgitation (also known as insufficiency or incompetence) are shown in Figure 5-4C. When the leaflets of the aortic valve do not provide an adequate seal, blood regurgitates from the aorta back into the left ventricle during the diastolic period. Aortic pressure falls faster and further than normal during diastole, which causes a low diastolic pressure and a large pulse pressure. In addition, ventricular end-diastolic volume and pressure are higher than normal because of the extra blood that reenters the chamber through the incompetent aortic valve during diastole. Turbulent flow of the blood reentering the left ventricle during early diastole produces a characteristic diastolic murmur. Often the aortic valve is altered so that it is both stenotic and insufficient. In these instances, both a systolic and a diastolic murmur are present. The primary physiological consequences of aortic insufficiency are reduction in forward flow out to the tissues (if the insufficiency is severe) and increase in the volume workload of the left ventricle.
Mitral Regurgitation
Typical characteristics of mitral regurgitation (insufficiency, incompetence) are shown in Figure 5-4D. When the mitral valve is insufficient, some blood regurgitates from the left ventricle into the left atrium during systole. A systolic murmur may accompany this abnormal flow pattern. Left atrial pressure is raised to abnormally high levels, and left ventricular end-diastolic volume and pressure increase. Mitral valve prolapse is the most common form of mitral insufficiency in which the valve leaflets evert into the left atrium during systole. The primary physiological consequences of mitral regurgitation are somewhat similar to aortic insufficiency in that forward flow out of the left ventricle into the aorta may be compromised (if the insufficiency is severe) and there is an increase in the volume workload of the left ventricle. In addition, the elevated left atrial pressure can also lead to pulmonary effects with shortness of breath.
Perspectives
It might be useful for the student to be reminded that the heart is “simply” a pulsatile pressure-generating pump producing one-way flow through a closed hydraulic system. There are many ways that this pump can fail, and the information in this chapter just touches on the critical role of the excitation process (which sets the “speed” of the pump) and the valves (that assure forward flow). Many of the physiological consequences of abnormalities in these processes (i.e., inadequate output and lowered pressure) are easily predicted from a basic consideration of fluid dynamics.
Key concepts
Cardiac arrhythmias can often be detected and diagnosed from a single electrocardiographic lead.
Physiological consequences of abnormal excitation and conduction in the heart depend on whether the electrical abnormality limits the time for adequate cardiac filling or decreases the coordination of myocyte contractions resulting in inadequate pressure development and ejection.
Supraventricular arrhythmias are a result of abnormal action potential initiation at the SA node or altered propagation characteristics through the atrial tissue and the AV node.
Tachycardias may originate either in the atria or in the ventricles and are a result of increased pacemaker automaticity, of spontaneously firing ectopic foci, or of continuous circular pathways setting up a reentrant circuit.
Abnormal conduction through the AV node results in conduction blocks which may result in bradycardia.
Abnormal conduction pathways in the Purkinje system or in the ventricular tissue result in significant QRS alterations.
Ventricular tachycardia and ventricular fibrillation represent severe abnormalities that are incompatible with effective cardiac pumping.
Failure of cardiac valves to open fully (stenosis) can result in elevated upstream chamber pressure and abnormal pressure gradients, congestion in upstream vascular beds, chamber wall hypertrophy, turbulent forward flow across the valve, and murmurs during systole or diastole.
Failure of cardiac valves to close completely (insufficiency, incompetence, regurgitation) can result in large stroke volumes, abnormal pressure pulses, congestion in upstream vascular beds, turbulent backward flow across the valve, and murmurs during systole or diastole.
Study questions
5-1. You hear a systolic murmur that seems to be coming from the right side of the heart.
a. Which valve condition(s) might be the cause of this abnormal sound?
b. A finding of a right electrical axis deviation might support which of your possible diagnoses?
c. Would you expect your patient to have pulmonary congestion?
5-2. Which of the following arrhythmias might result in a reduced stroke volume?
a. paroxysmal atrial tachycardia
b. ventricular tachycardia
c. atrial fibrillation
d. ventricular fibrillation
e. third-degree heart block
5-3. Describe the primary pressure abnormalities across the cardiac valve that are associated with
a. aortic stenosis
b. mitral stenosis
5-4. You notice an abnormally large pulsation of your patient’s jugular vein, which occurs at about the same time as heart sound, S1. What is your diagnosis?
5-5. What alteration in jugular venous pulsations might accompany third-degree heart block?
5-6. Given the following data, name the abnormal valve, predict the type of murmur that might be detected, and whether pulmonary congestion might be present. Calculate the resistance to flow across this valve.
Aortic pressures (systolic/diastolic) = 150/100 mm Hg
Left ventricular pressures (systolic/diastolic) = 150/2 mm Hg
Left atrial pressures (systolic/diastolic) = 50/32 mm Hg Heart rate = 60 beats/min
Stroke volume = 50 mL/beat
5-7. Your 75-year-old male patient is alert with complaints of general fatigue. His heart rate = 90 beats/min and arterial pressure = 180/50 mm Hg. A diastolic murmur is present. There are no ECG abnormalities identified and mean electrical axis = 10 degrees. Cardiac catheterization indicates that LVpressure = 180/20 mm Hg and left atrial pressure = 10/3 mm Hg (as peak systolic/end- diastolic). What abnormality is most consistent with these findings?
5-8. Evaluation of your patient’s electrocardiogram shows that P waves occur at a regular rate of 90/min and QRS complexes occur at a regular rate of 37/min. Which of the following is the most likely diagnosis?
a. supraventricular tachycardia
b. first-degree heart block
c. second-degree heart block
d. third-degree heart block
e. bundle branch block
5-9. An otherwise healthy, vigorous 74-year-old woman comes to your office with complaints of having recent episodes of intermittent dizziness and weakness associated with a feeling of fluttering and/or pounding in her chest. Her blood pressure is 135/88 mm Hg and her overall pulse rate is about 80 beats per minute with an irregularly irregular rhythm (i.e., no discernable pattern). What is the most likely diagnosis? What will you do next?
1 A real danger with atrial fibrillation lies in the tendency for blood to form clots in the atria in the absence of the normal vigorous coordinated atrial contraction. These clots can fragment and move out of the heart to lodge in small arteries throughout the systemic circulation. These emboli can have devastating effects on critical organ function. Consequently, anticoagulant therapy is strongly recommended for patients in atrial fibrillation.
2 A useful analogy is to compare the hypertrophied skeletal muscles of the weightlifter (doing isometric or pressure work) to the nonhypertrophied but well-toned skeletal muscles of the longdistance runner (doing isotonic or shortening work).