
Gregory G. Bashian and Curtis M. Rimmerman
The electrocardiogram (ECG) is an essential diagnostic test. In many ways, it is an ideal diagnostic modality because it is noninvasive, is readily performed without discomfort or potential patient injury, is inexpensive, and its results are immediately available. Most important, it provides a diagnostic window of cardiovascular surveillance for a multitude of cardiac pathophysiologic problems, including valvular, myocardial, pericardial, and ischemic heart disease. The ECG’s diagnostic utility is critically dependent on its accurate interpretation. This chapter addresses the diagnostic possibilities encountered in routine ECG interpretation, including a broad collection of clinical examples. A clinical history, detailed interpretation, and diagnostic summary are included for each tracing. A detailed review of this chapter will provide comprehensive preparation for the Cardiovascular Medicine Subspecialty Board Examination.
BOARD PREPARATION
To receive a passing score on the Cardiovascular Medicine Subspecialty Board Examination, the examinee must also receive a passing score on the ECG subsection. To best prepare for the ECG section, familiarization with the scoring sheet is essential. The scoring sheet is sent to each examinee before the test date, with diagnoses grouped systematically for easy reference. In preparation, understanding and being able to recognize each diagnosis is a “foolproof” preemptive approach.
A RECOMMENDED APPROACH TO ELECTROCARDIOGRAM INTERPRETATION
To ensure accurate and consistent ECG interpretation, a systematic approach is required. ECG interpretation is not an exercise in pattern recognition. To the contrary, employing a methodical strategy based on a thorough knowledge of the cardiac conduction sequence, cardiac anatomy, cardiac physiology, and cardiac pathophysiology can be applied to all ECGs, regardless of the findings.
One systematic approach to each ECG is to ascertain the following in this recommended order:
1. Assess the standardization and identify the recorded leads accurately.
2. Determine the atrial and ventricular rates and rhythms.
3. Determine the P-wave and QRS-complex axes.
4. Measure all cardiac intervals.
5. Determine if cardiac chamber enlargement or hypertrophy is present.
6. Assess the P-wave, QRS-complex, and T-wave morphologies.
7. Draw conclusions and correlate clinically.
Cardiac pathology is manifest differently on the surface ECG, depending on which lead is interrogated. Each lead provides an “electrical window of opportunity” and, by this virtue, offers a unique electrical perspective. The experienced electrocardiographer amalgamates these different windows into a mental three-dimensional electrical assessment, drawing accurate conclusions pertaining to conduction system and structural heart disease. For example, precordial lead V1 predominantly overlies the right ventricle, explaining why right ventricular cardiac electrical events are best observed in this lead. Likewise, precordial lead V6 overlies the left ventricle. This lead optimally represents left ventricular cardiac electrical events.
Assess the Standardization and Identify the Recorded Leads Accurately
Standard ECG graph paper consists of 1-mm × 1-mm boxes divided by narrow lines, which are separated by bold lines into larger, 5-mm × 5-mm boxes. At standard speed (25 mm/s), each small box in the horizontal axis represents 0.040 second (40 milliseconds) of time and each large box represents 0.200 second (200 milliseconds). At standard calibration (1 mV/10 mm), each vertical small box represents 0.1 mV and each vertical large box represents 0.5 mV. One must be very careful to inspect the standardization square wave (1 mV in amplitude) at the left of each ECG to determine the calibration of the ECG. ECGs with particularly high or low voltages are often recorded at half standard or twice standard, respectively. In these cases, the 1-mV square wave possesses an amplitude of either 5 or 20 mm. This distinction is important because it will affect the interpretation of all other voltage criteria. All further references to amplitude in this chapter are under the assumption of the default or preset standardization (1 mV/10 mm).
Determine the Atrial and Ventricular Rates and Rhythms
The first step in determining the rate and rhythm is to identify atrial activity. If P waves are present, it is important to measure the P wave to P wave interval (P–P interval). This determines the rate of atrial depolarization. To estimate quickly either an atrial or ventricular rate on a standard 12-lead ECG, one can count the number of 5-mm boxes in an interval and divide 300 by that number. For example, if there are four boxes between P waves, the rate is 300 divided by 4, or 75 complexes per minute.
Once the atrial activity and rate are identified, the P-wave frontal plane axis should be ascertained. A normal P-wave axis (i.e., -0 to 75 degrees) typically reflects a sinus node P-wave origin. A simple way of determining a normal P-wave axis is to confirm a positive P-wave vector in leads I, II, III, and aVF. An abnormal P-wave axis supports an ectopic or non–sinus node P-wave origin.
Several possible atrial and junctional rhythms are listed below. They are grouped by cardiac rhythm origin and subsequently subcategorized by atrial rate. Distinguishing features are italicized for emphasis.
Rhythms of Sinus Nodal and Atrial Origin
Normal Sinus Rhythm A normal sinus rhythm (NSR) is defined as a regular atrial depolarization rate between 60 and 100 per minute of sinus node origin, as demonstrated by a positive P-wave vector in leads I, II, III, and aVF.
Sinus Bradycardia Sinus bradycardia is characterized by a regular atrial depolarization rate <60 per minute of sinus node origin, as demonstrated by a positive P-wave vector in leads I, II, III, and aVF. (This is similar to NSR, except the rate is slower.)
Sinus Tachycardia Sinus tachycardia is characterized by a regular atrial depolarization rate ≥100 per minute of sinus node origin, as demonstrated by a positive P-wave vector in leads I, II, III, and aVF. (This is similar to NSR, except the rate is faster.)
Sinus Arrhythmia Sinus arrhythmia is characterized by an irregular atrial depolarization rate between 60 and 100 per minute of sinus node origin, as demonstrated by a positive P-wave vector in leads I, II, III, and aVF. (This is similar to NSR, except there is irregularity in the P–P interval >160 milliseconds.)
Sinus Arrest or Pause Sinus arrest or pause is characterized by a pause of >2.0 seconds without identifiable atrial activity. This may be caused by frank sinus arrest or may be simply a sinus pause secondary to:
 Nonconducted premature atrial contraction (PAC), in which case, a P wave can be seen deforming the preceding T wave
Sinoatrial block (SA block), which, like atrioventricular (AV) nodal block, has several forms
First-degree SA block involves a fixed delay between the depolarizing SA node and the depolarization exiting the node and propagating as a P wave. Because the delay is fixed, this delay cannot be detected on the surface ECG.
Second-degree SA block has two varieties. In Type I (Wenckebach) SA block, there is a progressive delay between SA nodal depolarization and exit of the impulse to the atrium. This is manifest as a progressive shortening of the P–P interval until there is a pause, reflecting an SA node impulse that was blocked from exiting the node. In Type II SA block, there is a constant P–P interval with intermittent pauses. These pauses also represent an SA node impulse that was blocked from exiting the node. However, in this case, the duration of the pause is a multiple of the basic P–P interval.
Third-degree SA block demonstrates no P-wave activity, as no impulses exit the sinus node. On the surface ECG, this is indistinguishable from sinus arrest, in which there is no sinus node activity.
Sinus Node Reentrant Rhythm Sinus node reentrant rhythm is characterized by a reentrant circuit involving the sinus node and perisinus nodal tissues. Given the sinus origin, the P-wave morphology and axis are normal and indistinguishable from a normal sinus P wave. The rate is regular at a rate of 60 to 100 per minute. (This is very similar to NSR, except characterized by abrupt onset and termination.)
Sinus Node Reentrant Tachycardia Sinus node reentrant tachycardia is characterized by a reentrant circuit involving the sinus node and perisinus nodal tissues. Given the sinus origin, the P-wave morphology and axis are normal and indistinguishable from a normal sinus P wave. The rate is regular at a rate of ≥100 per minute. (This is very similar to sinus tachycardia, except characterized by abrupt onset and termination.)
Ectopic Atrial Rhythm Ectopic atrial rhythm is characterized by a regular atrial depolarization at a rate of 60 to 100 per minute from a single nonsinus origin, as reflected by an abnormal P-wave axis. The PR interval may be shortened, particularly in the presence of a low ectopic atrial origin, closer to the AV node with a reduced intra-atrial conduction time. In the presence of slowed atrial conduction, the PR interval may be normal or even prolonged.
Ectopic Atrial Bradycardia Ectopic atrial bradycardia is characterized by a regular atrial depolarization at a rate of ≤60 per minute from a single nonsinus origin, as reflected by an abnormal P-wave axis. (This is similar to an ectopic atrial rhythm, except slower.)
Atrial Tachycardia Atrial tachycardia is characterized by a regular, automatic tachycardia from a single, ectopic atrial focus typically with an atrial rate of 180 to 240 per minute. The ventricular rate may be regular or irregular, depending on the AV conduction ratio. The P-wave axis is abnormal, given the ectopic atrial focus. (This is similar to an ectopic atrial rhythm, except faster.)
Wandering Atrial Pacemaker A wandering atrial pacemaker (WAP) has a rate of 60 to 100 per minute from multiple ectopic atrial foci, as evidenced by at least three different P-wave morphologies on the 12-lead ECG, possessing variable P–P, PR, and R–R intervals. Be careful not to confuse this dysrhythmia with atrial fibrillation (AF). Unlike AF, discrete P waves are identifiable.
Multifocal Atrial Tachycardia Multifocal atrial tachycardia (MAT) is characterized by a rate of >100 per minute with a P wave preceding each QRS complex from multiple atrial ectopic foci, as evidenced by at least three different P-wave morphologies on the 12-lead ECG possessing variable P–P, PR, and R–R intervals. The ventricular response is irregularly irregular, given the unpredictable timing of the atrial depolarization and variable AV conduction. Nonconducted atrial complexes during the ventricular absolute refractory period are also often present. Be careful not to confuse this dysrhythmia with AF. Unlike AF, discrete P waves are identifiable. (This is similar to WAP, but the atrial rate is faster.)
Atrial Fibrillation AF is characterized by a rapid, irregular, and disorganized atrial depolarization rate of 400 to 600 per minute devoid of identifiable discrete P waves, instead characterized by fibrillatory waves.
In the absence of fixed AV block, the ventricular response to AF is irregularly irregular. Be careful not to confuse this dysrhythmia with WAP or MAT. The key is the lack of identifiable P waves.
Atrial Flutter Atrial flutter (AFL) is characterized by a rapid, regular atrial depolarization rate of 250 to 350 per minute, representing an intra-atrial reentrant circuit. The atrial waves are termed “flutter waves” and often demonstrate a “saw-toothed” appearance, best seen in leads V1, II, III, and aVF.
Although the atrial rate is regular, the ventricular response rate may be either regular or irregular, depending on the presence of fixed versus variable AV conduction. Common AV conduction ratios are 2:1 and 4:1.
Rhythms of Atrioventricular Nodal and Junctional Origin
Atrioventricular Nodal Reentrant Tachycardia Atrioventricular nodal reentrant tachycardia (AVNRT) is a micro-reentrant dysrhythmia that depends on the presence of two separate AV nodal pathways. Slowed conduction is present in one pathway and unidirectional conduction block is present in the second pathway. This is a regular rhythm with a typical ventricular rate of 140 to 200 per minute, with abrupt onset and termination. Its onset is often initiated by premature atrial complexes (PACs). Atrial activity typically consists of inverted or retrograde P waves occurring before, during, or after the QRS complex, best identified in lead V1. The QRS complex may be conducted normally or aberrantly.
Atrioventricular Reentrant Tachycardia Atrioventricular reentrant tachycardia (AVRT) is a macro-reentrant circuit that consists of an AV nodal pathway and an accessory pathway. This dysrhythmia may conduct antegrade down the AV nodal pathway with retrograde conduction through the accessory pathway (orthodromic AVRT), or antegrade down the accessory pathway with retrograde conduction up the AV nodal pathway (antidromic AVRT). As opposed to AVNRT, the P wave is always present after the QRS complex. With antidromic AVRT, the QRS complex, by definition, is aberrantly conducted (wide).
Junctional Premature Complexes Junctional premature complexes are premature QRS complexes of AV nodal origin that may have resultant retrograde P waves (a negative P-wave vector in leads II, III, and aVF) occurring immediately before (with a short PR interval), during, or after the QRS complex.
AV Junctional Bradycardia AV junctional bradycardia is characterized by QRS complexes of AV nodal origin that occur at a regular rate of <60 per minute. These represent a subsidiary pacemaker and may have resultant retrograde P waves (negative P-wave vector in leads II, III, and aVF) that occur immediately before (with a short PR interval), during, or after the QRS complex.
Accelerated AV Junctional Rhythm Accelerated AV junctional rhythm is characterized by QRS complexes of AV nodal origin that occur at a regular rate of 60 to 100 per minute. These represent a subsidiary pacemaker and may have resultant retrograde P waves (negative P-wave vector in leads II, III, and aVF) that occur immediately before (with a short PR interval), during, or after the QRS complex. (This dysrhythmia is similar to AV junctional bradycardia, except faster.)
AV Junctional Tachycardia AV junctional tachycardia is characterized by QRS complexes of AV nodal origin that occur at a regular rate of typically 100 to 200 per minute. This dysrhythmia emanates from the AV junction and serves as a dominant cardiac pacemaker with an inappropriately rapid rate. Retrograde P waves may be identified (negative P-wave vector in leads II, III, and aVF) that occur immediately before (with a short PR interval), during, or after the QRS complex. (This dysrhythmia is similar to AV junctional rhythm, except faster.)
Rhythms of Ventricular Origin
Idioventricular Rhythm Idioventricular rhythm is a regular escape rhythm of ventricular origin that possesses a typically widened QRS complex (>100 milliseconds) at a rate of <60 per minute. This is often seen in cases of high-degree AV block, in which the ventricle serves as a subsidiary pacemaker.
Ventricular Parasystole Ventricular parasystole is an independent, automatic ventricular rhythm that emanates from a single ventricular focus characterized by a widened QRS complex with regular discharge and ventricular depolarization. Because the rhythm is independent and not suppressible, ventricular parasystole is characterized by varying coupling intervals and unchanged interectopic R—R intervals. Fusion complexes can be observed when the parasystolic focus discharges simultaneously with native ventricular depolarization. When the ventricle is absolutely refractory, the parasystolic focus is not recorded on the surface ECG, but its discharge remains unabated.
Accelerated Idioventricular Rhythm Accelerated idioventricular rhythm (AIVR) is a regular rhythm of ventricular origin that typically has a widened QRS complex at a rate of 60 to 100 per minute. It is often seen in cases of high-degree AV block, in which the ventricle serves as a subsidiary pacemaker plus in cases of coronary artery reperfusion. (AIVR is similar to idioventricular rhythm, except faster.)
Ventricular Tachycardia Ventricular tachycardia (VT) is a sustained cardiac rhythm of ventricular origin that occurs at a typical rate of 140 to 240 per minute. In differentiating this from supraventricular tachycardia with aberrant conduction, the following features suggest VT:
AV dissociation
Fusion or capture complexes
Wide QRS (≥140 milliseconds if right bundle branch block [RBBB] morphology; ≥160 milliseconds if left bundle branch block [LBBB] morphology)
Left-axis QRS complex deviation
Concordance of the precordial-lead QRS complexes
QRS morphologies similar to those of PVCs on the current or previous ECG
Tachyarrhythmia initiated by a PVC
If RBBB morphology, possessing an RSr′ pattern (as opposed to an rSr′ pattern)
Polymorphic Ventricular Tachycardia Polymorphic VT is a paroxysmal form of VT with a nonconstant R—R interval, a ventricular rate of 200 to 300 per minute, QRS complexes of alternating polarity, and a changing QRS amplitude that often resembles a sine-wave pattern (torsades de pointes). It is often associated with a prolonged QT interval at arrhythmia initiation.
Ventricular Fibrillation Ventricular fibrillation (VF) is a terminal cardiac rhythm with chaotic ventricular activity that lacks organized ventricular depolarization.
Determine the P-Wave and QRS-Complex Axes
A normal P-wave axis varies from 0 to 75 degrees but is usually between 45 and 60 degrees. P waves with a normal axis are upright in leads I, II, III, and aVF and inverted in lead aVR. An abnormal P-wave axis should prompt the interpreter to consider non-sinus nodal rhythms, dextrocardia, or limb lead reversal, among other causes.
To ascertain th frontal-plane axis of the QRS complex, the QRS-complex vector is assessed in each of the limb leads. A recommended approach is to search for the limb lead in which the QRS complex is isoelectric (i.e., the area of positivity under the R wave is equal to the area of negativity above the Q and S waves). The QRS-complex frontal-plane axis will be perpendicular to the isoelectric lead, thus narrowing down the axis to one of two possibilities (90 degrees clockwise or 90 degrees counterclockwise of the isoelectric lead’s axis). Next, one examines a limb lead whose vector is close to one of the two possible axes. Based on whether the QRS is grossly positive or negative in that lead, one can deduce which of the two possible axes is correct.
An alternative approach is as follows:
1. Assess the QRS complex vector in leads I and aVF. If both are positive, the QRS complex is between 0 and +90 degrees and is therefore normal.
2. If the QRS-complex vector is positive in lead I and negative in aVF, assess the QRS-complex vector in lead II. If it is positive in lead II, the QRS-complex axis is between -30 and 0 degrees and is leftward but still not pathologically deviated. If the QRS complex is negative in lead II, then the QRS-complex axis is between -90 and -30 degrees, and therefore abnormal left-axis QRS-complex deviation is present.
3. If the QRS-complex vector is negative in lead I and positive in lead aVF, abnormal right-axis QRS-complex deviation is present.
4. If the QRS-complex vector is negative in both leads I and aVF, the QRS-complex axis is profoundly deviated to between -90 and -180 degrees.
Measure All Cardiac Intervals
PR Interval
A normal PR interval is between 120 and 200 milliseconds. This represents the interval between P-wave onset and QRS-complex onset. The PR interval represents intra-atrial and AV nodal conduction time. A short PR interval (<120 milliseconds) is suggestive of facile intra-atrial or AV conduction and may represent ventricular preexcitation. A prolonged PR interval (>200 milliseconds) reflects delayed intra-atrial or AV conduction. In the setting of a varying PR interval, conduction block or AV dissociation may be present.
R–R Interval
The R–R interval is inversely proportional to the rate of ventricular depolarization. If AV conduction is normal, the ventricular rate should equal the atrial rate.
Atrioventricular Block
First-Degree AV Block First-degree AV block occurs when the PR interval is prolonged (>200 milliseconds), and each P wave is followed by a QRS complex. Typically the PR interval is constant.
Second-Degree AV Block, Mobitz Type I (Wenckebach) Second-degree AV block, Mobitz Type I (Wenckebach) is characterized by progressive prolongation of the PR interval, terminating with a P wave followed by a nonconducted QRScomplex. Normal antegrade conduction resumes with a repetitive progressive prolongation of the PR interval with each cardiac depolarization, resuming the cycle. This results in a “grouped beating” pattern. In its most common form, the R-R interval shortens from beat to beat (not including the interval in which a P wave is not conducted). This typically represents conduction block within the AV node, superior to the bundle of His.
Second-Degree AV Block, Mobitz Type II Second-degree AV block, Mobitz Type II is characterized by regular P waves followed by intermittent nonconducted QRS complexes in the absence of atrial premature complexes. The resulting R-R interval spanning the nonconducted complex is exactly double the conducted R-R intervals. This typically represents AV conduction block below the bundle of His and has a high propensity to progress to more advanced forms of AV block.
Note that when there is AV block with a ratio of 2:1, one cannot definitively distinguish between Mobitz Type I and Type II. Longer rhythm strips, maneuvers, and intracardiac recordings may be necessary. A widened QRS complex supports Mobitz Type II but lacks certainty.
Third-Degree AV Block (Complete Heart Block) Third-degree AV block (complete heart block) is characterized by independent atrial and ventricular activity with an atrial rate that is faster than the ventricular rate.PR intervals vary with dissociation of the P waves from the QRS complexes. Typically the ventricular rhythm is either a junctional (narrow complex) or ventricular (wide complex) rhythm. (Note this should be distinguished from AV dissociation, which is also characterized by independent atrial and ventricular activity, but the ventricular rate is faster than the atrial rate.)
QRS Complex Interval
The QRS complex interval is best measured in the limb leads from the onset of the R wave (or Q wave if present) to the offset of the S wave. A normal QRS duration is <100 milliseconds.
If the QRS duration is between 100 and < 120 milliseconds, the morphology should be further inspected for features of one or more of the following:
1. Incomplete RBBB: QRS complex duration 100 to 120 milliseconds, with a RBBB morphology with an R′-wave duration of ≥30 milliseconds (rsR′ in V1; terminal S-wave slowing in leads I, aVL, and V6).
2. Left anterior fascicular block (LAFB):
 QRS duration <120 milliseconds
Significant left-axis deviation (-45 to -90 degrees)
Positive QRS-complex vector in lead I, negative QRS-complex vectors in the inferior leads (II, III, aVF)
Absence of other causes of left-axis deviation, such as an inferior myocardial infarction or ostium primum atrial septal defect (ASD)
3. Left posterior fascicular block (LPFB): Early activation along the anterior fascicles produces a small r wave in leads I and aVL, and small q waves inferiorly. Mid and late forces in the direction of the posterior fascicles produce tall R waves inferiorly, deep S waves in I and aVL, and QRS-complex right-axis deviation.
QRS duration <120 milliseconds
Right axis (>120 degrees)
Absence of other clinical causes of right-axis QRS-complex deviation, such as pulmonary hypertension or right ventricular hypertrophy (RVH)
rS QRS-complex pattern in leads I and aVL
qR QRS-complex pattern in the inferior leads
If the QRS complex duration is >120 milliseconds, the morphology should be further inspected for the following features:
1. Right bundle branch block: The early depolarization vectors in RBBB are similar to normal depolarization reflecting left ventricular electrical events, producing early septal q waves in leads I, aVL, V5, and V6, plus an early RS pattern in leads V1 and V2. Given the right bundle branch conduction block, an unopposed QRS-complex vector representing delayed and slowed right ventricular depolarization is identified. These unopposed delayed left-to-right depolarization forces produce the characteristic broad second R′ wave in leads V1 and V2, plus the deep broad S waves in leads I, aVL, V5, and V6.
QRS duration ≥120 milliseconds
rsr′, rsR′, or rSR′ in lead V1 ± lead V2
Broad (>40 milliseconds) S wave in leads I and V6
T-wave inversion and down-sloping ST depression often seen in leads V1 and V2
2. Left bundle branch block: LBBB represents an altered left ventricular depolarization sequence. The right ventricle is depolarized in a timely manner via the right bundle branch. The left ventricle is depolarized after right ventricular depolarization via slowed right-to-left interventricular septal conduction. Because left ventricular depolarization initially transpires via the terminal branches of the left-sided conduction system, left ventricular depolarization occurs via an altered sequence with a prolonged QRS-complex duration.
QRS-complex duration ≥120 milliseconds
Broad and notched and/or slurred R wave in leads aVL, V5, and V6
Absent septal Q waves in leads I, avl, V5, and V6
3. Intraventricular conduction delay:
QRS complex duration >100 milliseconds
Indeterminate morphology not satisfying the criteria for either RBBB or LBBB
QT Interval
The QT interval demonstrates heart rate interdependence. The QT interval is directly proportional to the R-R interval. The QT interval shortens as heart rate increases. To account for this variability with heart rate, the corrected QT interval (QTc) is calculated, in which the QT interval is divided by the square root of the R-R interval. Normative tables for heart rate and gender are available. A normal QTc is typically <440 milliseconds. A less cumbersome approximation involves measuring the QT interval directly (typically in lead II). If this is >50% of the R-R interval, this supports QT-interval prolongation. In this circumstance, calculating a QTc interval is appropriate.
Differential diagnosis of a prolonged QT interval includes the following:
Congenital (idiopathic, Jervell-Lange-Nielsen syndrome, Romano-Ward syndrome)
Medications (psychotropics, antiarrhythmics, antimicrobials, etc.)
Metabolic disorders (hypocalcemia, hypokalemia, hypothyroidism, hypomagnesemia, etc.)
The morphology of QT-interval prolongation in hypocalcemia deserves special mention. Typically, hypocalcemia produces prolongation and straightening of the QT interval as a result of prolongation of the ST segment, without frank widening of the T wave.
Neurogenic, such as an intracranial hemorrhage
Ischemia
Determine If Cardiac Chamber Enlargement or Hypertrophy Is Present
If a patient is in sinus rhythm, the atria can be evaluated by analyzing the P-wave morphology in leads II, V1, and V2. Given the superior right atrial location of the sinus node, right atrial depolarization precedes left atrial depolarization. Therefore, right atrial depolarization is best represented in the first half of the surface ECG P wave. In lead II, if a bimodal P wave is present, the first peak represents right atrial depolarization and the second peak represents left atrial depolarization. In leads V1 and V2, the P wave is typically biphasic. The early portion is upright, representing right atrial depolarization toward leads V1 and V2, with the negative latter half representing left atrial depolarization, away from these leads.
Right Atrial Abnormality
Delayed activation of the right atrium due to hypertrophy, dilation, or intrinsically slowed conduction can result in the summation of right and left atrial depolarization. This typically produces a tall peaked P wave (≥2.5 to 3 mm) in lead II.
Left Atrial Abnormality
Delayed activation of the left atrium due to hypertrophy, dilation, or intrinsically slowed conduction can result in a broadening (>110 milliseconds) and notching of the P wave in lead II, or a deeper inverted phase of the P wave in leads V1 and V2:
Negative terminal phase of P wave in lead V1 or V2 ≥ 40 milliseconds in duration and ≥1 mm in amplitude, or
Biphasic P wave in lead II with peak-to-peak interval of ≥40 milliseconds (This is not very sensitive, but is quite specific.)
Right Ventricular Hypertrophy
In RVH, there is a dominance of the right ventricular forces, which produce prominent R waves in the right precordial leads and deeper S waves in the left precordial leads. RVH is suggested by one or more of the following:
Right-axis QRS-complex deviation (>+90 degrees)
R:S ratio in lead V1 > 1
R wave in V1 ≥ 7 mm
R:S ratio in V6 < 1
ST-T-wave “strain” pattern in right precordial leads supported by asymmetric T-wave inversion
Right atrial abnormality in the absence of:
Posterior-wall myocardial infarction
Wolff-Parkinson-White (WPW) syndrome
Counterclockwise rotation
Dextrocardia
RBBB
Left Ventricular Hypertrophy
Several criteria have been described and validated for the diagnosis of left ventricular hypertrophy (LVH) by electrocardiography.
1. Sokolow and Lyon: Amplitude of the S wave in lead V1 + amplitude of the R wave in V5 or V6 (whichever is the tallest) ≥35 mm
2. Cornell: Amplitude of the R wave in aVL + amplitude of the S wave in V3 >28 mm for men, or >20 mm for women
3. Romhilt-Estes: This is a scoring system in which a total score of 4 indicates “likely LVH,” and a score of ≥5 indicates “definite LVH.”
Voltage criteria = 3 points:
Amplitude of limb lead R wave or S wave ≥20 mm or
Amplitude of S wave in V1 or V2 ≥ 30 mm or
Amplitude of R wave in V5 or V6 ≥ 30 mm
ST-T-wave changes typical of strain (in which the ST segment and T-wave vector is shifted in a direction opposite to that of the QRS complex vector) = 3 points (only 1 point if the patient is taking digitalis)
Left atrial abnormality = 3 points:
Terminal portion of P wave in V1 ≥ 40 milliseconds in duration and ≥1 mm in amplitude
Left-axis deviation = 2 points:
Axis ≥ -30 degrees
QRS duration = 1 point:
Duration ≥90 milliseconds
Intrinsicoid deflection = 1 point:
Duration of interval from the beginning of the QRS complex to the peak of the R wave in V5 or V6 ≥ 50 milliseconds
Combined or Biventricular Hypertrophy
Combined ventricular hypertrophy is suggested by any of the following:
ECG meets criteria for isolated RVH and LVH. This is the most reliable criterion.
Precordial leads demonstrate LVH by voltage, but there is right-axis deviation (>+90 degrees) in the frontal plane.
Precordial leads demonstrate LVH, with limb leads demonstrating right atrial abnormality.
Assess the P-Wave, QRS-Complex, and T-Wave Morphologies
Once the cardiac rate, rhythm, axes, intervals, and chambers have been assessed, one should proceed with the identification of various morphologies that suggest pathologic states. There have been virtually innumerable descriptions of various morphologic criteria for a broad spectrum of pathologic states, but here we discuss those that are most common and/or most important.
ECG Abnormalities and Corresponding Differential Diagnoses
Incorrect Lead Placement or Lead Fracture Incorrect lead placement or lead fracture is most commonly identified in the limb leads, with a negative P-wave vector in leads I and aVL and normal precordial R-wave progression.
Low Voltage Low voltage in limb leads is defined as a QRS-complex amplitude of <5 mm in each of the standard limb leads (I, II, and III). Low voltage of all leads is defined as low voltage in the limb leads plus a QRS-complex amplitude of <10 mm in each of the precordial leads.
Low voltage on the ECG may be of primary myocardial origin or secondary to high-impedance tissue conduction. Differential diagnosis possibilities include the following:
Cardiomyopathy (infiltrative or restrictive)
Pericardial effusion
Pleural effusion
Anasarca
Obesity
Myxedema
Chronic obstructive pulmonary disease
Q Waves Q waves represent an initial negative QRS-complex vector. Pathologic Q waves are present if they are ≥1 mm (0.1 mV) in depth and ≥40 milliseconds in duration.
Q waves are most commonly associated with a myocardial infarction. To diagnose a myocardial infarction, Q waves must be identified in two contiguous leads:
Inferior leads—II, III, and aVF
Anteroseptal leads—V2 and V3
Anterior leads—V2, V3, and V4
Lateral leads—V5 and V6
High lateral leads—I and aVL
Posterior leads V1 and V2 (R-wave amplitude greater than S-wave amplitude)
Contiguous regions on an ECG include the following:
Inferior, posterior, and lateral
Anteroseptal, anterior, and lateral
Lateral and high lateral
Other etiologies of Q waves include:
“Septal” Q waves (small Q waves as a result of the septal left-to-right depolarization vector)—leads I, aVL, V5, and V6
Hypertrophic cardiomyopathy—any lead
LAFB—leads I and aVL
WPW syndrome—any lead
ST-Segment Elevation ST-segment elevation refers to elevation of the segment between the terminal aspect of the QRS complex and the T-wave onset. This elevation is relative to the isoelectric comparative TP segment located between the end of the T wave and the start of the P wave.
Causes of ST-segment elevation include the following:
Acute myocardial injury: convex upward ST-segment elevation in at least two contiguous ECG leads
Coronary spasm (Prinzmetal angina): similar morphology to acute myocardial injury, with the distinction that the ST-segment elevation is typically transient
Pericarditis: diffuse concave upward ST-segment elevation not confined to contiguous ECG leads
Left ventricular aneurysm: most often seen in the right precordial leads, with convex upward ST-segment elevation overlying an infarct zone, with ST-segment elevation persisting for months to years after the initial myocardial infarction
LBBB: typically discordant from the QRS-complex vector
Early repolarization: manifest as J-point elevation with normal ST segments, best seen in the lateral precordial leads
Brugada syndrome: ST-segment elevation in the right precordial leads with a pattern of right ventricular conduction delay
Hypothermia: Osborne waves
ST-Segment Depression The most common causes of ST-segment depression are the following:
Myocardial ischemia or non-ST-segment elevation myocardial infarction (NSTEMI): Horizontal or down-sloping ST-segment depression demonstrates the greatest specificity for myocardial ischemia. Positive cardiac biomarkers distinguish ischemia versus infarction.
Ventricular hypertrophy: Down-sloping asymmetric ST-segment depression and T-wave inversion is often present in both LVH and RVH.
Peaked T Waves The most common causes of peaked, positive T waves are the following:
Hyperkalemia
Hyperacute phase of myocardial infarction
Acute transient ischemia (Prinzmetal angina)
U Waves U waves are seen immediately following the T wave. They are best observed in leads V2, V3, and V4 and are typically up to one quarter the amplitude of the T wave. Prominent U waves are ≥1.5 mm (≥0.15 mV) in amplitude.
Prominent U waves are commonly observed in the presence of:
Hypokalemia
Bradyarrhythmias
Drugs
Pathologic States and Corresponding ECG Abnormalities
Myocardial Injury and Infarction
Acute myocardial infarction: Q waves and ST-segment elevation. Reciprocal ST-segment depression is often observed but is not necessary.
Recent myocardial infarction: Q waves with ischemic T-wave changes, often inverted; the ST segments are typically no longer elevated.
Age-indeterminate myocardial infarction: persistent Q waves devoid of ST-segment elevation or ischemic T-wave changes
Acute myocardial injury: regional ST-segment elevation without Q waves
Acute Pericarditis Acute pericarditis is characterized by diffuse ST-segment elevation and/or PR-segment depression. Lead aVR classically demonstrates PR-segment elevation and is highly specific.
Diffuse ST-segment elevation
Diffuse PR-segment depression with PR-segment elevation in lead aVR
T-wave inversions typically do not appear until ST-segment elevations have resolved.
Pericardial Effusion The ECG manifestations of pericardial effusions are a result of the increased impedance of the electrical signal through the pericardial fluid collection coupled with translational cardiac motion within the pericardium. These include:
Electrical alternans
voltage QRS complexes
Digitalis Effect
Most commonly manifests as ST-segment and T-wave changes
Concave depression/sagging of the ST segment (usually without frank J-point depression) seen best in leads V5 and V6
PR-interval prolongation
T-wave flattening with QT-interval shortening
Digitalis Toxicity Digitalis toxicity exerts its effects via a combination of an increase in myocardial automaticity plus suppression of sinus nodal and AV nodal pacemaker function. This manifests as a combination of conduction defects and arrhythmias including but not limited to:
Atrial tachycardia
Accelerated junctional rhythm
First-, second-, or third-degree AV block
Bidirectional ventricular tachycardia (VT with alternating right and LBBB morphology)
VF
Hyperkalemia
Tall, peaked, narrow-based T waves
PR-interval prolongation
Advanced conduction block
Atrial standstill or arrest
Widening of the QRS complex, which can progress to a “sine wave” pattern
VT or fibrillation
Hypokalemia
Prominent U waves, especially in leads V2, V3, and V4
ST-segment depression
Decreased T-wave amplitude
Increase in P-wave amplitude and duration
Hypercalcemia
Shortened QTc, predominantly via decreased ST-segment duration
Hypocalcemia
Prolonged QTc, predominantly via increased ST-segment duration and straightening without a significant increase in the T-wave duration
Sick Sinus Syndrome Sick sinus syndrome is characterized by combinations of the following:
Marked sinus bradycardia
Sinus arrest
Prolonged recovery time of the sinus node following PACs or atrial tachyarrhythmias
Alternating bradycardia and tachycardia
Acute Cor Pulmonale The following suggest acute cor pulmonale:
Sinus tachycardia
Anterior precordial T-wave inversion (leads V1 to V3)
Right atrial abnormality
Right-axis QRS-complex deviation
An S1, Q3, T3 QRS complex limb lead pattern
RBBB (may be transient)
Atrial Septal Defect, Secundum The following ECG findings are suggestive of a secundum ASD:
Right-axis QRS-complex deviation
Incomplete RBBB
RVH
Right atrial abnormality
PR-interval prolongation
Atrial Septal Defect, Primum The following ECG findings are suggestive of a primum ASD:
Left-axis QRS-complex deviation
PR-interval prolongation
Incomplete RBBB
Dextrocardia The following ECG findings suggest dextrocardia:
Precordial R-wave regression (R-wave amplitude decreases from V1 to V6)
Negative P-wave vector in leads I and aVL
WPW syndrome is suggested by the following ECG findings:
Shortened PR interval (<120 milliseconds)
Delta wave representing ventricular preexcitation (slurring of the initial portion of the QRS complex)
QRS complex may be wide, representing altered ventricular depolarization.
Hypertrophic Cardiomyopathy The following ECG criteria are suggestive of hypertrophic cardiomyopathy:
High-voltage QRS complex
Deep Q waves not ascribable to a specific coronary artery territory
ST-T-wave changes including deep T-wave inversions
Hypothermia The following ECG criteria are suggestive of hypothermia:
Osborne waves (elevated J point that is proportional to the degree of hypothermia)
Bradycardia
PR-interval, QRS-complex interval, and QT-interval prolongation
Myxedema The following ECG criteria are suggestive of myxedema:
Sinus bradycardia
PR-interval prolongation
Low-voltage QRS complexes
SUGGESTED READINGS
Rimmerman CM, Jain AK. Interactive electrocardiography. Philadelphia, PA: Lippincott Williams & Wilkins; 2001.
Surawicz B, Knilans TK, Chou T-C. Chou’s Electrocardiography in Clinical Practice: Adult and Pediatric. 5th ed. Philadelphia, PA: WB Saunders; 2001.
Topol EJ, Califf RM. Textbook of Cardiovascular Medicine. 2nd ed. Philadelphia, PA: Lippincott Williams & Wilkins; 2002.
ELECTROCARDIOGRAM CASE HISTORIES
ELECTROCARDIOGRAM #1

Clinical History
A 52-year-old man presents for a routine physical examination in the Preventive Medicine Department. His past medical history includes elevated triglycerides and a low HDL cholesterol value. He is otherwise in good health.
Electrocardiogram Interpretation
The cardiac rhythm is normal sinus rhythm with evidence of sinus arrhythmia best seen in the lead V1 rhythm strip. No pathologic Q waves are present, the ST segments are normal, and all cardiac intervals are normal. This represents a normal ECG and an example of sinus arrhythmia.
Commentary
Sinus arrhythmia is a common and normal finding as depicted on this ECG. The sinus rate increases with inspiration and decreases with expiration.
Keyword Diagnoses
NSR
Sinus arrhythmia
Normal ECG
ELECTROCARDIOGRAM #2

Clinical History
The patient is a 56-year-old man who underwent a cardiac transplant procedure 6 weeks prior to this ECG, secondary to an idiopathic nonischemic dilated cardiomyopathy and recurrent VT. His medications at the time of this ECG included digoxin, furosemide, lisinopril, potassium, and aspirin.
Electrocardiogram Interpretation
The cardiac rhythm is sinus tachycardia, in that the P waves demonstrate a normal axis with a constant P-P interval preceding each QRS complex at a regular rate >100 per minute. A second set of P waves is noted as a constant P-P interval at a slightly longer P-P interval compared to the conducted P waves. This represents the native atrium in this cardiac transplant patient, which is still depolarizing via the native sinus node. The donor P wave that immediately precedes each QRS complex demonstrates first-degree AV block. Diffuse nonspecific ST-T changes are present. QRS-complex frontal-plane right-axis deviation is present in that the QRS-complex vector is negative in lead I and positive in leads II, III, and aVF. Low-voltage QRS complexes are seen in the limb leads, in that each complex is <5 mm in amplitude. An rsR′ QRS-complex morphology is present in lead V1 with an overall normal QRS-complex duration supporting incomplete RBBB.
Commentary
The presence of dual functioning atria in a recent cardiac transplant patient is a common finding. The native atria gradually extinguish themselves and the donor atria become the dominant atrial pacemaker. The presence of incomplete RBBB in a post-cardiac transplant patient is also a common finding.
Keyword Diagnoses
Sinus tachycardia
First-degree AV block
Right-axis deviation
Incomplete RBBB
Nonspecific ST-T changes
Low-voltage QRS
Cardiac transplant
ELECTROCARDIOGRAM #3
Clinical History
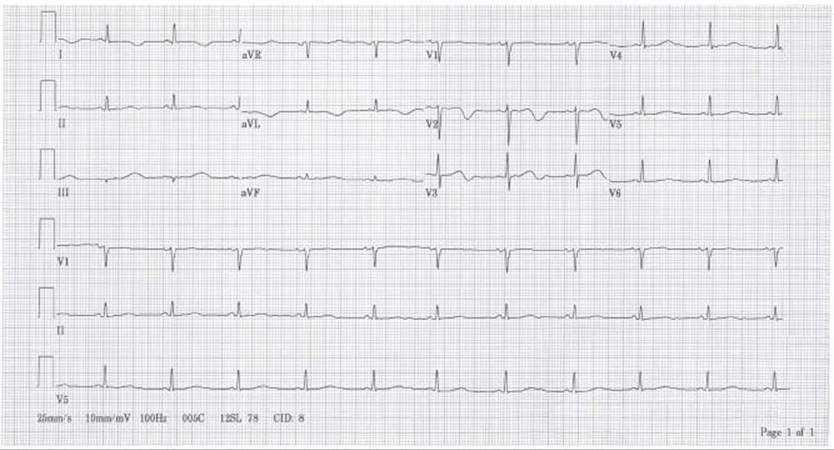
The patient is a 41-year-old man with myelodysplastic syndrome and insulin-requiring diabetes mellitus, who has been admitted for bone marrow transplantation. His serum potassium at the time of this ECG was 3.4 mEq/L.
Electrocardiogram Interpretation
This ECG emphasizes the necessary methodical approach to interpretation. The ECG demonstrates NSR. In assessing the intervals, it is most notable for a prolonged QT interval.
Commentary
This ECG demonstrates the common findings seen in hypokalemia. There is a prolongation of the QT interval, prominent U waves, and T-wave flattening.
Keyword Diagnoses
NSR
Prolonged QT interval
Nonspecific ST-T changes
U waves
Hypokalemia
ELECTROCARDIOGRAM #4

Clinical History
A 39-year-old woman, an unrestrained passenger in a motor vehicle accident, suffered an aortic transection distal to the left subclavian artery. This ECG was taken postoperatively, shortly after thoracic aorta repair.
Electrocardiogram Interpretation
The heart rate and cardiac rhythm are both normal. This represents NSR. This ECG is most notable for diffuse ST-segment elevation not confined to a particular coronary artery territory, which is most consistent with acute pericarditis. Lead aVR is helpful because there is elevation of the atrial repolarization segment. This segment is termed the PR segment and is located between the terminal aspect of the P wave and QRS-complex onset.
Commentary
When the PR segment is elevated in lead aVR, this serves as a specific sign for pericarditis. This may be the only ECG finding supporting pericarditis and remains an important marker to identify.
Keyword Diagnoses
NSR
Pericarditis
ELECTROCARDIOGRAM #5

Clinical History
A 62-year-old man is undergoing preoperative anesthesia clearance prior to planned rotator cuff repair. His past medical history is notable for hypertension but no known cardiac disease. His medications include verapamil.
Electrocardiogram Interpretation
NSR is present. The 3rd, 8th, and 11th QRS complexes are premature junctional complexes. A P wave does not precede the 3rd and 11th QRS complexes and demonstrates a similar QRS-complex morphology to the native QRS complex. This is otherwise a normal ECG.
Commentary
Premature junctional complexes are an otherwise normal finding. Frequently, retrograde P waves are seen in the presence of premature junctional complexes. An example of retrograde P waves is seen within the ST segment following the 3rd and 11th QRS complexes.
Keyword Diagnoses
NSR
Premature junctional complex
Normal ECG
Retrograde P waves
ELECTROCARDIOGRAM #6

Clinical History
A 59-year-old man with coronary artery disease status post remote percutaneous transluminal coronary angioplasty of the right coronary artery re-presents with chest discomfort. A myocardial infarction was excluded by cardiac enzymes and a subsequent stress test was normal. The patient was thought to be suffering from noncardiac musculoskeletal chest discomfort.
Electrocardiogram Interpretation
The cardiac rhythm demonstrates a regular bradycardia with retrograde P waves after each QRS complex. The P waves possess a negative vector in the inferior leads, as the atrial wave of depolarization is traveling superiorly, opposite the normal direction of conduction. The QRS complex is of normal duration. This represents a junctional bradycardia. The causes of this could be many, including sinus node disease, medication administration, increased vagal tone, atrial conduction system disease, myocardial ischemia, or valvular heart disease. Prominent positive U waves are present in leads V2 to V4.
Commentary
In this case, the R-R interval is constant with absent atrial activity prior to each QRS complex. Depending on the relative retrograde versus antegrade conduction rates, a retrograde P wave may occur before, within, or after the QRS complex. In this example, antegrade conduction from the AV junction to the ventricle is faster than retrograde conduction from the AV junction to the atrium and therefore explains the P wave occupying the proximal ST segment after the QRS complex.
Keyword Diagnoses
Junctional bradycardia
Retrograde P waves
U waves
ELECTROCARDIOGRAM #7

Clinical History
A 62-year-old man with severe three-vessel coronary artery disease has been referred for coronary artery bypass graft surgery. A recent cardiac catheterization demonstrated normal left ventricular systolic function without evidence of a prior myocardial infarction. Mediations at the time of this ECG included atenolol, gemfibrozil, and folic acid.
Electrocardiogram Interpretation
The cardiac rhythm is NSR with a positive QRS-complex vector in lead I and negative QRS-complex vectors in leads II, III, and aVF, consistent with left anterior hemiblock. Q waves are present in leads V2to V3, suggesting an anteroseptal myocardial infarction of indeterminate age. This is a difficult diagnosis in the setting of left anterior hemiblock, as the QRS-complex vector is now displaced inferiorly and posteriorly away from leads V2 and V3. This in fact may represent a Q wave based on axis deviation instead of a true myocardial infarction.
Commentary
Placing leads V2 and V3 one interspace lower and repeating the ECG may be helpful, as the new presence of an R wave would negate the possibility of a prior anteroseptal myocardial infarction. In this setting, an echocardiogram may be helpful to evaluate anteroseptal and septal wall motion. Thus, the correct interpretation of this ECG is NSR with left anterior hemiblock but cannot exclude a septal myocardial infarction of indeterminate age.
Keyword Diagnoses
NSR
Left anterior hemiblock
ELECTROCARDIOGRAM #8

Clinical History
A 46-year-old man who had a myocardial infarction 2 years before this ECG presented to the emergency room with a 6-hour history of acute severe substernal chest discomfort. The patient underwent emergency cardiac catheterization and percutaneous transluminal coronary angioplasty of a severe proximal left anterior descending coronary artery stenosis.
Electrocardiogram Interpretation
The cardiac rhythm is regular, with a normal P-wave axis denoting NSR. A leftward QRS-complex frontal-plane axis is present in the setting of a normal QRS-complex duration, fulfilling the criteria for left anterior hemiblock. Most striking on this ECG is the maximal 7-mm ST-segment elevation noted in leads V2 to V5, I, and aVL with Q-wave formation indicating an extensive acute anterolateral myocardial infarction. There is an ongoing acute myocardial injury pattern with terminal T-wave inversion representing an evolving acute infarction.
Commentary
This ECG is an example of an evolving extensive acute anterolateral myocardial infarction. There is concomitant injury and infarction occurring, as prominent Q waves are present with ST-segment elevation. Presumably the left anterior descending obstruction is proximal to the first septal perforator branch, as ST-segment elevation is present in lead V1.
Keyword Diagnoses
NSR
Left anterior hemiblock
Anterolateral myocardial infarction, acute
Acute myocardial injury
ELECTROCARDIOGRAM #9

Clinical History
A 47-year-old man presented to an outside medical facility with an ECG consistent with an acute inferior myocardial infarction. He received urgent thrombolytic therapy and was accepted in hospital transfer for cardiac catheterization. Comorbid conditions included long-term tobacco use and hypercholesterolemia. A cardiac catheterization demonstrated severe right coronary artery disease, which was treated with percutaneous coronary intervention.
Electrocardiogram Interpretation
Important findings on this ECG include sinus bradycardia with a prolonged PR interval, supporting first-degree AV block. Pathologic Q waves are present in leads III and aVF, with coved nonelevated ST segments and terminally negative T waves. This supports an inferior myocardial infarction, possibly recent. A tall R wave is noted in leads V1 and V2, and in the setting of an inferior myocardial infarction raises the high likelihood of a concomitant posterior myocardial infarction. This ECG is best characterized as sinus bradycardia, first-degree AV block, and a recent inferoposterior myocardial infarction.
Commentary
In the presence of an inferoposterior myocardial infarction, it is important to assess the lateral leads for Q-wave formation. On this ECG, the lateral leads are normal. Given the patient’s history of a right coronary artery myocardial infarction, by inference, it is likely that leads V5 and V6 are represented electrocardiographically by a left circumflex coronary artery.
Keyword Diagnoses
Sinus bradycardia
First-degree AV block
Inferoposterior myocardial infarction, recent
ELECTROCARDIOGRAM #10

Clinical History
A 47-year-old woman with dialysis-requiring renal failure secondary to long-standing hypertension has presented to the hospital with recent-onset shortness of breath. At the time of this ECG, her serum calcium level was 7.2 mg/dL and her serum potassium level was 6.4 mEq/L.
Electrocardiogram Interpretation
This ECG was obtained at half standardization. Therefore each complex is one half the voltage of a standard ECG. The atrial rate is 60 per minute, regular and of normal axis. This represents NSR. The QRS complexes are normal. A prolonged QT interval is present, and the ST segment is straightened as seen in patients with hypocalcemia. Peaked T waves, particularly notable in leads V4 to V6, are narrow based and symmetric, denoting hyperkalemia.
Commentary
This combination of findings is commonly seen in a chronic renal failure patient and reflects both hypocalcemia and hyperkalemia. The ECG may serve as the initial clinical clue to the presence of these electrolyte abnormalities. The patient also demonstrates increased QRS-complex voltage consistent with LVH. This is not diagnosed from this ECG, given the absence of secondary ST-T changes. Diagnosing LVH solely on the basis of increased QRS-complex voltage suffers from reduced specificity.
Keyword Diagnoses
Half standardization
NSR
Prolonged QT interval
Peaked T waves
Hypocalcemia
Hyperkalemia
ELECTROCARDIOGRAM #11

Clinical History
A 58-year-old man presented to the hospital with an acute chest pain syndrome. He underwent a diagnostic cardiac catheterization that demonstrated an acute occlusion of the left circumflex coronary artery.
Electrocardiogram Interpretation
NSR with sinus arrhythmia at a rate slightly >60 per minute is present. ST-segment depression is seen in lead III and less so in lead aVF. In this case, a search for an ECG explanation is important. ST-segment elevation is seen in leads I and aVL. This represents high lateral acute myocardial injury as seen in an early left circumflex territory acute high lateral myocardial infarction. The initial clue on this tracing is the pronounced reciprocal ST-segment depression best seen in lead III.
Commentary
Acute myocardial injury patterns can be subtle on an ECG. Oftentimes reciprocal changes are the first clue, as demonstrated here in lead III. The left circumflex coronary artery territory tends to be the most electrocardiographically silent. A careful search for subtle ST-segment elevation often localizes the abnormality to the high lateral leads.
Keyword Diagnoses
NSR
Sinus arrhythmia
High lateral myocardial infarction, acute
Acute myocardial injury
ELECTROCARDIOGRAM #12

Clinical History
A 74-year-old man presented to the hospital with suddenonset anterior chest discomfort and the accompanying ECG was obtained. An urgent cardiac catheterization was followed by a percutaneous transluminal coronary angioplasty to the right coronary artery, as acute thrombus was present. Medications at the time of this ECG included intravenous heparin, intravenous nitroglycerin, aspirin, and metoprolol.
Electrocardiogram Interpretation
NSR is present. Progressive PR-interval prolongation ensues, with an eventual nonconducted QRS complex. This represents a 7:6 second-degree Mobitz Type I (Wenckebach) AV block cycle. A 1.5-mm ST-segment elevation with Q waves is seen in the inferior leads, consistent with an acute inferior myocardial infarction. This explains the Wenckebach AV block, secondary to AV nodal ischemia during a period of acute myocardial injury. Lead V1 does not demonstrate evidence of ST-segment elevation that would suggest concomitant right ventricular myocardial injury. Reciprocal ST-segment depression is present in leads I and aVL.
Commentary
Second-degree Mobitz Type I Wenckebach AV block occurring in the setting of acute myocardial injury does not require temporary pacemaker placement. Close observation of the patient’s cardiac rhythm is warranted, as this patient subgroup can progress to more advanced forms of heart block.
Keyword Diagnoses
NSR
Second-degree Mobitz Type I Wenckebach AV block
Inferior myocardial infarction, acute
Acute myocardial injury
ELECTROCARDIOGRAM #13

Clinical History
The patient is a 50-year-old man with recently diagnosed multiple myeloma and a serum calcium level of 13.1 mg/dL.
Electrocardiogram Interpretation
This ECG demonstrates NSR. The QRS complexes are normal in both duration and morphology. The only identifiable abnormality is a short QT interval with a truncated ST segment. This is abnormal and represents an ECG marker of hypercalcemia.
Commentary
This ECG emphasizes the need to carefully assess the ECG intervals on each tracing. The routine ECG may be the only clinical marker of underlying serum electrolyte disturbances. It is important to identify these abnormalities, as prompt clinical treatment is frequently warranted.
Keyword Diagnoses
NSR
Short QT interval
Hypercalcemia
ELECTROCARDIOGRAM #14

Clinical History
A 74-year-old man with hypertrophic cardiomyopathy is being seen in follow-up in the Psychiatry Department for chronic depression. His cardiac medications include verapamil and atenolol.
Electrocardiogram Interpretation
The atrial rhythm is regular, at a rate <60 per minute with a normal P-wave axis. This satisfies the ECG criteria for sinus bradycardia. This ECG is obtained at half standardization. Despite this, prominent QRS-complex voltage is seen in the precordial leads and inferiorly. A tall R wave is present in leads V1 and V2. This suggests the presence of both LVH with secondary ST-T changes and RVH. This is an example of biventricular hypertrophy with secondary ST-T changes. Prominent Q waves are seen in this patient with hypertrophic cardiomyopathy reflecting septal depolarization.
Commentary
In this diagnostic setting, prominent septal Q waves are frequently present as seen on this ECG. It is important to distinguish Q waves secondary to septal depolarization from the possibility of an underlying age-indeterminate myocardial infarction. Oftentimes this is not possible and requires further adjunctive testing.
Keyword Diagnoses
Half standardization
Sinus bradycardia
Biventricular hypertrophy with secondary ST-T changes
Hypertrophic cardiomyopathy
ELECTROCARDIOGRAM #15

Clinical History
A 64-year-old man presented to an outside Emergency Room with an acute-onset chest discomfort syndrome and was accepted in urgent hospital transfer for cardiac catheterization. The patient received immediate thrombolytic therapy. A cardiac catheterization demonstrated a 100% distal occlusion of a saphenous vein graft to the right coronary artery, which was successfully angioplastied.
Electrocardiogram Interpretation
On this tracing, the atrial rhythm is best assessed in the lead V1 rhythm strip. Regular P waves occur at a rate of approximately 100 per minute, with a P wave preceding each QRS complex and a P wave following each QRS complex within the terminal aspect of the T wave. This represents NSR with 2:1 AV block. Inferior Q waves are present with J-point elevation, ST-segment elevation, and ST-segment straightening consistent with an acute inferior myocardial infarction and acute myocardial injury. Reciprocal ST-segment depression is seen in leads I, aVL, and V2 to V4. This conduction abnormality is a result of ischemia of the AV node due to the acute right coronary artery myocardial infarction. Small Q waves approximately 30 milliseconds in duration are present in leads V4 to V6. Associated ST-T changes are present. This suggests the possibility of an age-indeterminate anterolateral myocardial infarction. Clinical correlation with the patient’s history is necessary.
Commentary
It is not clear whether this cardiac rhythm is second-degree Mobitz Type I Wenckebach AV block or second-degree Mobitz Type II AV block. A longer recording with rhythm strip analysis would be helpful to evaluate for periods of Wenckebach AV block with varying conduction ratios. In the setting of 2:1 AV block and acute myocardial injury, temporary pacemaker placement is indicated, as this patient subgroup can proceed to complete heart block and hemodynamic deterioration.
Keyword Diagnoses
NSR
2:1 AV block
Inferior myocardial infarction, acute
Acute myocardial injury
ELECTROCARDIOGRAM #16

Clinical History
A 44-year-old man with severe peripheral vascular disease has been admitted for lower extremity revascularization surgery. He has known coronary artery disease and is status post myocardial infarction in the remote past, location unknown. His medications included insulin, carbamazepine, amitriptyline, and warfarin.
Electrocardiogram Interpretation
This ECG demonstrates a regular atrial rhythm supporting sinus tachycardia at a rate slightly >100 per minute. The P-wave vector is negative in both leads I and aVL. When the P wave demonstrates a dominant negativity in both leads I and aVL, the differential diagnosis includes misplaced limb leads and dextrocardia. Normal R-wave progression is seen in leads V2 to V6, which does not support a diagnosis of dextrocardia. Therefore this is an example of misplaced limb leads. The right arm and left arm leads have been reversed. Lead I is inverted. Leads AVR and AVL are reversed, as are leads II and III. Lead AVF is relatively unaffected. Despite this technical error, a dominant Q wave is seen in both leads II and aVF (representing leads III and aVF), possibly suggesting an age-indeterminate inferior myocardial infarction. This does not represent a high lateral myocardial infarction despite the presence of Q waves in leads I and aVL, as these are secondary to the misplaced limb leads.
Commentary
It is appropriate to repeat this tracing, checking limb lead placement more carefully, to document this patient’s ECG with normally placed leads.
Keyword Diagnoses
Sinus tachycardia
Misplaced limb leads
ELECTROCARDIOGRAM #17

Clinical History
A 22-year-old woman presents for evaluation of dysplastic nevi. She has known dextrocardia but is on no current medications.
Electrocardiogram Interpretation
This tracing demonstrates an abnormal P-wave axis with a negative P-wave vector in leads I and aVL. The differential diagnoses for this finding are misplaced limb leads versus dextrocardia. A prominent R wave is seen in lead V1, with R-wave regression as one proceeds from leads V2 to V6. A premature atrial complex is present.
Commentary
Recognizing the presence of dextrocardia is important, because normal ECGs can be interpreted as significantly abnormal. Upon first glance, the frontal-plane QRS-complex axis appears deviated extremely rightward, possibly even suggesting a high lateral myocardial infarction. The important diagnostic clue present on this ECG is the negative P-wave vector in leads I and aVL. This finding, together with R-wave regression seen in leads V2 to V6, confirms the presence of dextrocardia.
Keyword Diagnoses
NSR
Premature atrial complex
Dextrocardia
ELECTROCARDIOGRAM #18

Clinical History
A 37-year-old woman with WPW syndrome returned for a repeat evaluation in the setting of medication-induced fatigue and persistent palpitations. Her medications include propranolol. The patient subsequently underwent successful radiofrequency ablation of a right ventricular posteroseptal accessory pathway.
Electrocardiogram Interpretation
NSR is present. The PR interval is short, with a slurred upstroke to the QRS complex best seen in leads V1 to V3, I, and aVL, all supporting ventricular preexcitation and WPW syndrome. Inferior Q waves are present, denoting accessory pathway conduction and a pseudoinfarction pattern. This is not indicative of an inferior myocardial infarction.
Commentary
WPW syndrome is a common cause of a pseudoinfarction pattern. When the accessory pathway vector is directed opposite an ECG lead, this generates a negative deflection. The inferior Q waves on this ECG have a slurred downstroke with a shortened PR interval representing a delta wave.
Keyword Diagnoses
NSR
WPW syndrome
Pseudoinfarction pattern
ELECTROCARDIOGRAM #19

Clinical History
A 59-year-old woman presented with a chest discomfort syndrome and the above ECG. She subsequently underwent cardiac catheterization that demonstrated normal coronary arteries and global mild left ventricular systolic dysfunction. Neurology was consulted about the possibility of a subarachnoid hemorrhage, and this was excluded. Her past medical history includes hypertension.
Electrocardiogram Interpretation
The atrial rate is regular and slightly <60 per minute. The P-wave axis and morphology appear normal, supporting sinus bradycardia. Nonspecific ST-T changes in the form of diffuse T-wave inversion and a prolonged QT interval are present. This is seen in both profound myocardial ischemia and also central nervous system events such as a subarachnoid hemorrhage. Clinical correlation is important. If in fact this represents a myocardial origin, these ECG findings are most often found in severe subendocardial ischemia or infarction. This is also known as “eggshell” infarct, as a large portion of the subendocardium is infarcted, conferring a worse prognosis on this patient group.
Commentary
The findings on this ECG are most consistent with diffuse subendocardial myocardial ischemia or infarction versus a central nervous system event. Both possibilities were excluded in this patient. Given the mild global left ventricular systolic dysfunction, these findings may represent myocarditis or an early form of a cardiomyopathy in which the ECG demonstrates more pronounced findings. Serial cardiac imaging studies such as echocardiography would be important to evaluate for occult progression of her left ventricular systolic dysfunction.
Keyword Diagnoses
Sinus bradycardia
Nonspecific ST-T changes
Prolonged QT interval
Ischemia
Central nervous system event
ELECTROCARDIOGRAM #20

Clinical History
A 22-year-old woman has been admitted to the hospital for evaluation and treatment of schizophrenia. She is on no current medications.
Electrocardiogram Interpretation
This is a normal ECG. The cardiac rhythm is NSR, as the P wave axis in leads I, II, and III is normal and the atrial rate is approximately 70 per minute. T-wave inversion is present in leads V1 and V2. In a young patient, this is a normal finding and demonstrates a persistent juvenile T-wave pattern.
Commentary
It is important to recognize normal variants when interpreting ECGs. The persistent juvenile T-wave pattern is a normal variant and should not be confused with underlying cardiac pathology such as myocardial ischemia or a cardiomyopathy.
Keyword Diagnoses
NSR
Juvenile T-wave pattern
Normal ECG
ELECTROCARDIOGRAM #21

Clinical History
A 30-year-old African American man is being evaluated in the presurgical department prior to inguinal hernia repair. He has no known prior cardiac history. An echocardiogram was normal, without evidence of structural heart disease.
Electrocardiogram Interpretation
Regular P waves with a normal axis at a slightly varying rate of approximately 60 to 75 per minute indicate NSR and sinus arrhythmia. Nonspecific ST-T changes are present throughout the ECG. J-point elevation and ST-segment elevation are seen in leads V2 to V6, I, II, and aVF. This indicates the possibility of an acute myocardial injury pattern but does not support an individual coronary artery territory. The atrial repolarization segment in lead aVR is normal, without evidence to support pericarditis. This represents early repolarization.
Commentary
The ST-T changes on this ECG are not normal. However, in younger African American patients, nonspecific ST-T changes with this morphology can represent a normal variant. This was confirmed by the normal resting echocardiogram.
Keyword Diagnoses
NSR
Sinus arrhythmia
Normal ECG
Early repolarization
ELECTROCARDIOGRAM #22

Clinical History
A 65-year-old man with advanced coronary artery disease and resulting severe left ventricular systolic dysfunction is awaiting cardiac transplantation. This ECG was obtained while the patient was fully conscious and dependent on a left ventricular assist device. The patient underwent successful cardiac transplantation surgery.
Electrocardiogram Interpretation
The ECG baseline is chaotic, without discernible organized atrial or ventricular activity. This represents VF and is a terminal heart rhythm.
Commentary
This is a rare opportunity to obtain a recording of VF on a 12-lead ECG. There is a complete absence of organized cardiac electrical activity.
Keyword Diagnosis
VF
ELECTROCARDIOGRAM #23

Clinical History
A 19-year-old man was seen preoperatively, prior to intended ostium secundum ASD repair. A recent echocardiogram demonstrated a moderate-sized ostium secundum ASD with left-to-right shunt flow, a dilated right ventricle with normal right ventricular systolic function, and moderate pulmonary hypertension.
Electrocardiogram Interpretation
The cardiac rhythm is NSR, as a P wave of normal axis precedes each QRS complex. The QRS-complex frontal-plane axis demonstrates right-axis deviation, as the QRS-complex vector is negative in lead I and positive in leads II, III, and aVF. An rsR′ QRS-complex morphology is noted in lead V1. This represents an unusual pattern for right ventricular conduction delay, and in the setting of QRS-complex right-axis deviation raises the possibility of an ASD.
Commentary
The right ventricular conduction delay as seen in lead V1 is characteristic of an ASD. Unlike an ostium primum ASD, in which the QRS-complex frontal-plane axis is deviated leftward, in the setting of an ostium secundum ASD, the QRS-complex vector is normal or deviated rightward. In this circumstance, given the left-to-right interatrial shunt, the rightward deviation of the QRS-complex vector is secondary to the volume overload of the right ventricle.
Keyword Diagnoses
NSR
Right-axis deviation
Ostium secundum ASD
ELECTROCARDIOGRAM #24

Clinical History
A 62-year-old woman with fevers and chills of 2 days’ duration was admitted with suspected sepsis. Comorbid conditions include rheumatoid arthritis and chronic obstructive pulmonary disease.
Electrocardiogram Interpretation
A prominent baseline artifact consistent with electrical interference is present. This significantly compromises the ECG interpretation. Despite this technical difficulty, QRS complexes occur at regular intervals. Low-voltage QRS complexes are present in the limb leads, as no complex is >5 mm in amplitude. Given the baseline artifact, no identifiable atrial activity is present. The constant QRS-complex cycle length suggests NSR. ST-T-segment and T-wave flattening is suspected, consistent with nonspecific ST-T changes.
Commentary
The prominent baseline artifact merits a repeat examination, as this artifact interferes significantly with ECG interpretation.
Keyword Diagnoses
Baseline artifact
NSR
Low-voltage QRS—limb leads
Nonspecific ST-T changes
ELECTROCARDIOGRAM #25

Clinical History
A 76-year-old man with two prior coronary artery bypass graft surgeries and moderate left ventricular systolic dysfunction has returned for outpatient cardiology follow-up. The patient is being seen preoperatively prior to a planned carotid endarterectomy. His comorbid conditions include severe chronic obstructive pulmonary disease, paroxysmal AF, and chronic renal insufficiency. His medications included prednisone, digoxin, enalapril, furosemide, and warfarin.
Electrocardiogram Interpretation
A P wave precedes each QRS complex at a rate >100 per minute, supporting sinus tachycardia. The 6th, 8th, and 12th P waves are premature, reflecting PACs. The QRS complex is widened, with a complete LBBB morphology. An apparent pause occurs between the third and fourth QRS complexes. No P wave is identified, but the P-P interval is twice that of the intrinsic P-P interval. The sinus node discharges on time, but the depolarization wave is blocked from exiting the sinus node and depolarizing the atrium. This is known as sinus exit block. No identifiable atrial activity in the form of a P wave is seen. The next P wave occurs when expected, as the sinus node discharges without exit block transpiring.
Commentary
To diagnose the presence of sinus exit block, the R-R interval encompassing the sinus exit block should be twice the baseline R-R interval. This ECG also demonstrates significant conduction system disease, given the presence of complete LBBB. This is most likely secondary to the patient’s advanced ischemic heart disease.
Keyword Diagnoses
Sinus tachycardia
Premature atrial complex
Sinus exit block
Complete LBBB
ELECTROCARDIOGRAM #26

Clinical History
A 72-year-old man with advanced peripheral vascular disease has been admitted to the hospital for a semielective below-the-knee amputation. His past medical history includes chronic obstructive pulmonary disease, a remote myocardial infarction, and prior pacemaker placement. His medications include quinidine and digoxin.
Electrocardiogram Interpretation
The cardiac rhythm is NSR, as the P waves occur at regular intervals with a normal axis slightly >60 per minute. The PR interval is prolonged to 220 milliseconds, representing first-degree AV block. Left atrial abnormality is seen, as the P-wave morphology is terminally negative in lead V1 and bifid in lead II. Diffuse nonspecific ST-T changes are present. Most important, each lead demonstrates a prominent prolonged QT interval. Both the QT-interval prolongation and ST-segment scooping are secondary to the concomitant quinidine effect and digitalis effect.
Commentary
QT-interval prolongation in the setting of quinidine administration may represent quinidine toxicity and near-future proarrhythmia. Comparison with prior ECGs is important to confirm whether this is a new or preexisting finding.
Keyword Diagnoses
NSR
First-degree AV block
Left atrial abnormality
Prolonged QT interval
Nonspecific ST-T changes
Digitalis effect
Quinidine effect
ELECTROCARDIOGRAM #27
Clinical History
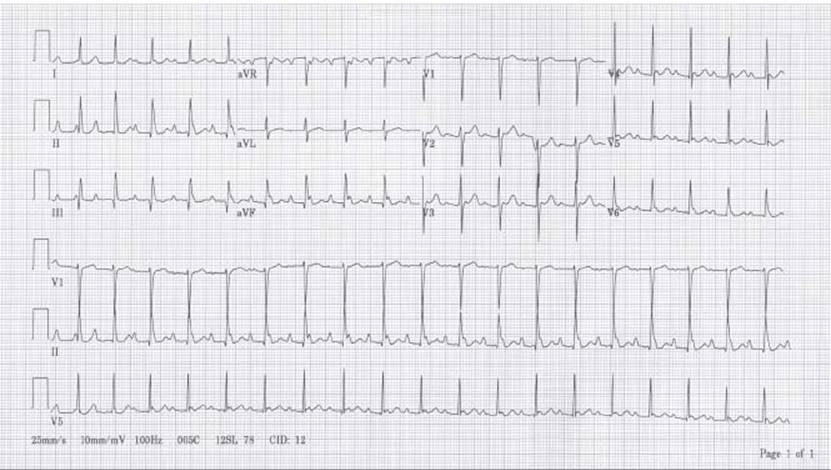
A 77-year-old woman status post an acute left middle cerebral artery occlusion and urokinase administration is now experiencing recurrent atrial arrhythmias. Medications at the time of this ECG included diltiazem, topical nitroglycerin, and isosorbide mononitrate. An echocardiogram performed during this hospitalization demonstrated moderate left atrial enlargement and normal left ventricular systolic function without evidence of a prior myocardial infarction.
Electrocardiogram Interpretation
This ECG demonstrates two P waves for each QRS complex, best seen in lead aVF. The second P wave occurs on the downslope of the S wave at the beginning of the ST segment. This represents ectopic atrial tachycardia with 2:1 AV conduction. There are small narrow inferior Q waves that are not of diagnostic significance.
Commentary
When interpreting ECGs that show arrhythmias, it is important to survey each lead, which may yield a subtle and different clue. For this tracing, regular atrial activity is seen best in the inferior leads. Other leads such as lead V1demonstrate nearly isoelectric atrial activity and suggest a junctional tachycardia. When a tachycardia is present, it is important to ascertain the shortest P-P interval and compare it to the R-R interval. Without this approach, 2:1 AV conduction may be overlooked.
Keyword Diagnoses
Ectopic atrial tachycardia
2:1 AV conduction
ELECTROCARDIOGRAM #28

Clinical History
A 66-year-old man status post recent coronary artery bypass graft surgery, paroxysmal AF, and a cerebrovascular accident has returned for a follow-up evaluation after his bypass surgery. Other comorbidities include hypertension, non-insulin-requiring diabetes mellitus, and hyperlipidemia.
Electrocardiogram Interpretation
NSR is present. The 9th P wave is premature, reflecting a premature atrial complex with a similar QRS-complex morphology. The QRS-complex duration is prolonged but <120 milliseconds. Lead V1demonstrates an Rsr′ QRS-complex pattern indicating an incomplete RBBB. Q waves of diagnostic duration are present in the inferior, lateral, and high lateral leads, indicating an inferolateral myocardial infarction of indeterminate age. R waves are prominent in leads V1 and V2, suggesting an age-indeterminate posterior myocardial infarction. This is likely one event and is best characterized collectively as an age-indeterminate inferoposterolateral myocardial infarction. Left atrial abnormality is seen in lead V1, as the terminal P-wave vector is negative.
Commentary
The most important findings on this ECG are the diagnostically wide Q waves present in leads I, aVL, and V5 and V6, consistent with an age-indeterminate lateral myocardial infarction. In the presence of a lateral myocardial infarction, it is important to identify other potential areas of infarction. Typically, lateral infarctions may extend both posteriorly and inferiorly. The inferior Q waves are of diminutive depth and of only 30 milliseconds duration. In the setting of prominent R waves in leads V1 and V2 and prominent lateral Q waves, these findings together suggest an associated inferoposterior myocardial infarction.
Keyword Diagnoses
NSR
Premature atrial complex
Left atrial abnormality
Incomplete RBBB
Inferoposterolateral myocardial infarction, age-indeterminate
ELECTROCARDIOGRAM #29

Clinical History
A 40-year-old man with a history of “an enlarged heart” since a young age is seeking a cardiac evaluation. A prior echocardiogram demonstrated evidence of Ebstein anomaly.
Electrocardiogram Interpretation
The cardiac rhythm is NSR. This PR interval is borderline prolonged. Right ventricular conduction delay is evidenced by complete RBBB. This is best seen in lead V1, with an rsr′ QRS complex, and also in leads I, aVL, and V6, with a widened QRS complex and terminal S wave indicative of right ventricular conduction delay. Leads V2 and V3 demonstrate primary T-wave changes, as depolarization and repolarization demonstrate similar polarity.
Commentary
Ebstein anomaly is characterized by apical right ventricular displacement of the tricuspid valve septal and/or posterior leaflets, resulting in “atrialization” of the right ventricle. Frequently, these patients suffer from tricuspid insufficiency, right ventricular systolic dysfunction, and resulting slowed right ventricular conduction as evidenced by complete RBBB and 1-degree AV block. These patients also frequently have one or more accessory pathways.
Keyword Diagnoses
NSR
Complete RBBB
Primary T-wave changes
Ebstein anomaly
ELECTROCARDIOGRAM #30

Clinical History
A 63-year-old man with an approximately 25-year history of hypertension presents to the hypertension clinic for further evaluation. He has noticed recent dyspnea upon exertion. Medications at the time of this tracing included lisinopril.
Electrocardiogram Interpretation
NSR is present, as each QRS complex is preceded by a P wave of normal axis. The P-wave morphology is abnormal, with a terminal negativity in lead V1 consistent with left atrial abnormality. In lead II, the P-wave amplitude is >3 mm, consistent with right atrial abnormality. Prominent precordial QRS-complex voltage is present, with asymmetric ST-T changes indicative of LVH with secondary ST-T changes. Negative U waves are seen in the lateral precordial leads, supporting the presence of LVH.
Commentary
This ECG satisfies many criteria for LVH. In addition to the prominent QRS-complex voltage and asymmetric T-wave inversion indicative of a strain pattern, a slightly prolonged QRS complex and prominent left atrial abnormality are also present. Negative U waves are readily seen. The differential diagnosis of negative U waves includes coronary artery disease and LVH. With the associated ECG findings, the negative U waves are secondary to LVH.
Keyword Diagnoses
NSR
Left atrial abnormality
Right atrial abnormality
LVH with secondary ST-T changes
Negative U waves
ELECTROCARDIOGRAM #31

Clinical History
A 47-year-old man with a history of aortic stenosis status post prior aortic valve replacement re-presents with perivalvular moderately severe aortic insufficiency and congestive heart failure. Comorbid conditions include insulin-requiring diabetes mellitus and a recently repaired rectal fistula. His medications included insulin, potassium, metolazone, metoprolol, captopril, and digoxin.
Electrocardiogram Interpretation
The ECG baseline demonstrates an absence of organized atrial activity. The ventricular response is irregularly irregular, representing AF. An intermittent complete RBBB pattern is seen at shorter R-R intervals. Note that the initiation of the complete RBBB occurs at a shorter R-R interval than does sustaining the complete RBBB. This is a typical finding in acceleration-dependent complete RBBB. With QRS-cycle length slowing, the complete RBBB transiently disappears. There is no evidence of a prior myocardial infarction. High lateral nonspecific ST-T changes are present.
Commentary
Acceleration-dependent complete RBBB is a common ECG finding. The right bundle branch has a longer refractory period than the left bundle branch, and therefore ratedependent right bundle branch conduction delay is a more common entity. This may precede permanent complete RBBB.
Keyword Diagnoses
AF
Acceleration-dependent complete RBBB
Nonspecific ST-T changes
ELECTROCARDIOGRAM #32

Clinical History
A 72-year-old woman with advanced AV block necessitating prior permanent pacemaker placement returns for pacemaker follow-up. Comorbid conditions include coronary artery disease, hypertension, and hyperlipidemia. Medications at the time of this ECG included metoprolol, aspirin, digoxin, and simvastatin.
Electrocardiogram Interpretation
The ECG baseline is devoid of discrete atrial activity. This represents AF. The QRS complexes occur at regular R-R intervals at a ventricular rate slightly >60 per minute. This is an unexpected finding in the presence of AF. This represents an accelerated junctional rhythm and AV dissociation. Presumed ventricular pacemaker deflections occur at regular intervals throughout the ECG with no relationship to the QRS complexes. This represents both pacemaker sensing failure and pacemaker capture failure. Lateral and high lateral nonspecific ST-T changes are demonstrated. The scooping of the ST segments supports the presence of digitalis effect.
Commentary
This ECG demonstrates abnormal pacemaker function, necessitating further evaluation. This may represent pacemaker lead dislodgement. In the presence of AF, it is important to evaluate the ECG for a second independent cardiac rhythm. The important clue on this tracing is the constant R-R interval. AV dissociation and an accelerated junctional rhythm both support the possible presence of digitalis toxicity, warranting further clinical investigation.
Keyword Diagnoses
AF
Accelerated junctional rhythm
AV dissociation
Ventricular pacemaker
Pacemaker sensing failure
Pacemaker capture failure
Nonspecific ST-T changes
Digitalis effect
ELECTROCARDIOGRAM #33

Clinical History
A 34-year-old woman with a history of an AV canal and ostium primum ASD status post surgical repair is readmitted for a cardiac evaluation. She is experiencing paroxysmal atria dysrhythmias and is on no current medications.
Electrocardiogram Interpretation
This patient is known to have ostium primum ASD. This ECG demonstrates a group of findings consistent with this diagnosis. The atrial rhythm is NSR. The PR interval is prolonged at 240 milliseconds, representing first-degree AV block. The P wave is terminally negative in lead V1 and broadened in lead II, suggesting left atrial abnormality. The QRS-complex axis is deviated leftward, satisfying the criteria for left-axis deviation, as the QRS-complex frontal-plane vector is positive in lead I and deeply negative in leads II, III, and aVF. An rsR′ QRS complex is seen in lead V1 with a normal QRS-complex duration, supporting incomplete RBBB.
Commentary
A narrow rsR′ QRS complex morphology in the presence of left-axis deviation and left atrial abnormality are a group of findings consistent with the diagnosis of an ostium primum ASD.
Keyword Diagnoses
NSR
First-degree AV block
Incomplete RBBB
Left atrial abnormality
Left-axis deviation
Ostium primum ASD
ELECTROCARDIOGRAM #34

Clinical History
A 38-year-old man presented with severe dyspnea of 1 week’s duration. An echocardiogram demonstrated a large pericardial effusion with evidence supporting cardiac tamponade. The patient underwent urgent surgical pericardial drainage.
Electrocardiogram Interpretation
The cardiac rhythm is sinus tachycardia, as the P waves are of normal axis and precede each QRS complex at an atrial rate slightly >100 per minute. The frontal-plane QRS-complex axis demonstrates right-axis deviation, as the QRS-complex vector is negative in lead I and positive in leads II, III, and aVF. There are diffuse low-voltage QRS complexes. Nonspecific ST-T changes are also seen. Alternation of the QRS-complex voltage, best seen in rhythm strip lead V1, is apparent. This alternation occurs with every other QRS complex and is termed electrical alternans. Electrical alternans is an ECG marker of a large pericardial effusion.
Commentary
The ECG findings of diffuse low-voltage QRS complexes and electrical alternans suggest the presence of a significant pericardial effusion and cardiac tamponade. The electrical alternans is secondary to the beat-to-beat variability of cardiac position. This is sometimes referred to as a “swinging heart.”
Keyword Diagnoses
Sinus tachycardia
Right-axis deviation
Nonspecific ST-T changes
Low-voltage QRS
Electrical alternans
Pericardial effusion
Cardiac tamponade
ELECTROCARDIOGRAM #35

Clinical History
A 69-year-old woman with a history of severe subaortic stenosis presented to the hospital with a several-day history of dyspnea consistent with congestive heart failure. A cardiac catheterization demonstrated a 100-mm Hg pressure gradient between the left ventricular outflow tract and the left ventricle. Her medications at the time of this ECG included diltiazem, furosemide, and doxazosin.
Electrocardiogram Interpretation
A P wave of normal axis precedes each QRS complex at a regular rate of approximately 110 per minute, reflecting sinus tachycardia. An rSR′ QRS complex is present in lead V1 with a QRS-complex duration of 140 milliseconds, consistent with complete RBBB. The P wave in lead V1 demonstrates a terminal negativity and is bifid in lead II, supporting left atrial abnormality. Down-sloping 3- to 4-mm ST-segment depression is present in leads V4 to V6, I, and II, consistent with myocardial ischemia and possibly an NSTEMI.
Commentary
Most often, myocardial ischemia is a bedside diagnosis and requires clinical correlation. In this case, the down-sloping ST-segment depression in the setting of a congestive heart failure exacerbation and subaortic stenosis most likely does represent myocardial ischemia. To confirm this suspicion, a follow-up tracing should be obtained after treatment, to demonstrate interval improvement and ST-T-change resolution.
Keyword Diagnoses
Sinus tachycardia
Complete RBBB
Left atrial abnormality
Myocardial ischemia
ELECTROCARDIOGRAM #36
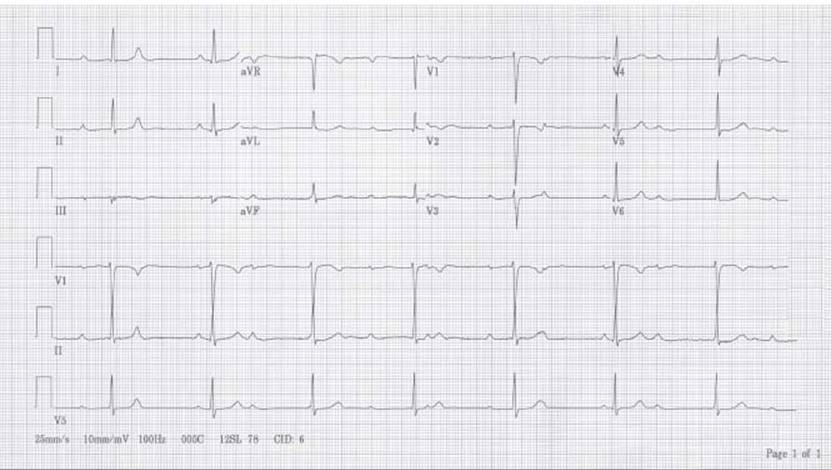
Clinical History
A 29-year-old woman who was 37 weeks pregnant was admitted to the hospital for close observation of pregnancy-induced hypertension. She has known complete heart block without cardiovascular symptoms requiring no specific treatment or evaluation other than periodic Holter monitoring.
Electrocardiogram Interpretation
On this tracing, the cardiac rhythm is best discerned in rhythm strip lead V1. P waves occur at regular intervals at an atrial rate of approximately 85 per minute. The P-wave axis as ascertained in leads I, II, and aVF is upright and normal. This suggests NSR. The PR interval varies and suggests a lack of association between the P waves and the QRS complexes. The QRS complexes are of normal duration and occur regularly at a rate of approximately 45 per minute. These findings collectively support NSR, junctional bradycardia, and complete heart block.
Commentary
The ECG criteria for complete heart block include two independent cardiac rhythms, lack of AV association, and a non-competing ventricular rhythm that is slower than the atrial rhythm.
Keyword Diagnoses
NSR
Junctional bradycardia
Complete heart block
ELECTROCARDIOGRAM #37

Clinical History
A 72-year-old man was admitted to the hospital for further evaluation of an erythematous and bullous eruptive rash. His past medical history includes hypertension and chronic obstructive pulmonary disease, for which he takes prednisone and numerous inhalers.
Electrocardiogram Interpretation
The ventricular rate is rapid, irregular, and >100 per minute, representing a tachycardia. Each QRS complex is preceded by a P wave of differing morphology and PR-interval duration. This represents MAT. Nonspecific ST-T changes are present in the lateral leads.
Commentary
MAT is a common dysrhythmia in patients with advanced chronic obstructive pulmonary disease. This dysrhythmia commonly demonstrates resistance to pharmacologic therapy and is best addressed by treating the underlying condition, in this case the chronic obstructive pulmonary disease.
Keyword Diagnoses
MAT
Nonspecific ST-T changes
ELECTROCARDIOGRAM #38

Clinical History
A 53-year-old man with diffuse coronary artery disease status post inferior and anterior myocardial infarctions 15 years prior to this ECG returns for routine cardiology follow-up. Subsequent to the myocardial infarctions, the patient underwent ventricular aneurysmectomy. He continued with symptoms of stable angina pectoris in the setting of mild mitral insufficiency and moderate left ventricular systolic dysfunction. His medications include digoxin, furosemide, and captopril.
Electrocardiogram Interpretation
On this tracing, with many findings, a systematic approach is necessary. Sinus bradycardia is present. The PR interval is prolonged, indicating first-degree AV block. The QRS-complex axis is deviated leftward secondary to diagnostic Q-wave formation in leads II, III, and aVF, supporting an age-indeterminate inferior myocardial infarction. Additional Q waves are noted in leads V2 to V4, representing an age-indeterminate anterior myocardial infarction. Premature complexes differing from the native QRS-complex morphology are seen without a preceding P wave. These are premature ventricular complexes (PVCs). The PR interval immediately following each PVC is prolonged and reflects retrograde concealed conduction of the PVC into the conduction system slowing antegrade conduction to the ventricle. Unlike most PVCs, there is no compensatory pause and therefore these are classified as interpolated PVCs.
Commentary
Frequently, ECGs demonstrate a myocardial infarction in two separate myocardial territories, as demonstrated on this tracing. The PVCs are of complete RBBB morphology and therefore are left ventricular in origin. They demonstrate prominent inferior and anterolateral Q waves, supporting the presence of both prior myocardial infarctions.
Keyword Diagnoses
Sinus bradycardia
First-degree AV block
Inferior myocardial infarction, age indeterminate
Anterior myocardial infarction, age indeterminate
Interpolated PVC Concealed conduction
ELECTROCARDIOGRAM #39

Clinical History
A 57-year-old woman with a history of adenocarcinoma of the rectum and a pulmonary embolism presented to the hospital urgently, secondary to severe shortness of breath and respiratory failure. Pulmonary angiography demonstrated evidence of both acute and subacute pulmonary emboli and severe pulmonary hypertension. The patient expired shortly after this ECG.
Electrocardiogram Interpretation
NSR is present. Frontal-plane QRS-complex right-axis deviation is noted, given the positive QRS-complex vector in leads II, III, and aVF and a negative QRS-complex vector in lead I. Incomplete RBBB is best seen in lead V1 with an rsR′ QRS-complex pattern. Also notable in lead V1 is a terminally negative P-wave vector suggesting left atrial abnormality. In lead II, the P wave is peaked and 3 mm in amplitude, supporting right atrial abnormality. Nonspecific ST-T changes are noted throughout the tracing. Given the incomplete RBBB, right atrial abnormality, and right-axis deviation, RVH with secondary ST-T changes merits consideration.
Commentary
This ECG is consistent with an acute pulmonary embolism. It demonstrates a dominant S wave in lead I and a Q wave with T-wave inversion in lead III. This is the so-called S1, Q3, T3 QRS-complex pattern described in the setting of an acute pulmonary embolism.
Keyword Diagnoses
NSR
Right-axis deviation
Incomplete RBBB
Left atrial abnormality
Right atrial abnormality
Nonspecific ST-T changes
Pulmonary embolism
ELECTROCARDIOGRAM #40

Clinical History
A 41-year-old man with a history of intravenous substance use, endocarditis, and prior mitral and tricuspid valve replacement re-presents with symptoms and signs of congestive heart failure. He has also noted recent-onset palpitations.
Electrocardiogram Interpretation
This ECG demonstrates a regular narrow QRS-complex tachycardia. P waves are possibly seen within the nadir of the ST segment in lead III. Determination of the exact cardiac rhythm is difficult and would require further testing in the form of an electrophysiology study. Therefore, this is best categorized as a supraventricular tachycardia. The QRS-complex frontal-plane axis demonstrates right-axis deviation, as the QRS-complex vector is negative in lead I, isoelectric in lead II, and positive in leads III and aVF A prominent rsR′ QRS complex of normal duration is seen in lead V1. In the presence of QRS-complex frontal-plane right-axis deviation, this represents RVH. Diffuse nonspecific ST-T changes are also present.
Commentary
This patient was known to have advanced tricuspid valvular heart disease, prosthetic valve mitral stenosis, pulmonary hypertension, and RVH. The atrial arrhythmias may be secondary to the cardiac valvular abnormality.
Keyword Diagnoses
Supraventricular tachycardia
Right-axis deviation
RVH
Nonspecific ST-T changes
ELECTROCARDIOGRAM #41

Clinical History
A 67-year-old woman with dialysis-requiring renal failure is recently postoperative after an exploratory laparotomy for an ischemic bowel. This patient became septic, hypotensive, and hyperkalemic. This ECG represents her terminal heart rhythm prior to expiring.
Electrocardiogram Interpretation
Sinus tachycardia is present. The PR interval is prolonged, representing first-degree AV block. The QRS complex is markedly prolonged, demonstrated by a nonspecific intraventricular conduction delay.
Commentary
In extreme forms of hyperkalemia, ventricular arrhythmias are common, as is profound widening and prolongation of all ECG intervals. The ST-segment elevation in leads V2 and V3 has been termed a dialyzable current of injury.
Keyword Diagnoses
Sinus tachycardia
First-degree AV block
Nonspecific intraventricular conduction delay
Hyperkalemia
ELECTROCARDIOGRAM #42

Clinical History
A 94-year-old woman was admitted to the hospital with acute-onset diarrhea and dehydration. She was noted to have lower-extremity swelling, and venous Doppler studies demonstrated an acute deep venous thrombosis. A subsequent ventilation perfusion scan was interpreted as high probability for an acute pulmonary embolism.
Electrocardiogram Interpretation
In the lead V1 rhythm strip, a P wave is seen preceding each QRS complex. A P wave is also noted immediately following each T wave. This demonstrates a regular P-P interval at an atrial rate of approximately 70 per minute, denoting NSR. The QRS complex is broadened, with an RSR′ QRS-complex pattern in lead V1, suggesting complete RBBB. The T wave is upright in lead V1, supporting primary T-wave changes. The QRS-complex frontal-plane axis is deviated leftward, with a positive QRS-complex vector in lead I and negative QRS-complex vectors in leads II, III, and aVF, consistent with left anterior hemiblock. Given the bifascicular block, the 2:1 AV block most likely represents second-degree Mobitz Type II AV block. Diffuse nonspecific ST-T wave changes are seen. Sinus arrhythmia is also documented. The P-P interval encompassing the QRS complexes is shorter than the P-P interval between the QRS complexes. This is more precisely termed ventriculophasic sinus arrhythmia. This has no known clinical significance.
Commentary
Given the bifascicular block and 2:1 AV block, this patient has advanced conduction system disease. It is not known if these findings were new in the setting of her suspected acute pulmonary embolism.
Keyword Diagnoses
NSR
2:1 AV block
Complete RBBB
Left anterior hemiblock
Nonspecific ST-T changes
Sinus arrhythmia
ELECTROCARDIOGRAM #43

Clinical History
A 61-year-old man was seen in cardiology outpatient follow-up after an acute inferior myocardial infarction 3 years prior to this ECG. This was followed by urgent right coronary artery percutaneous transluminal coronary angioplasty. He feels well, with infrequent episodes of angina pectoris. His medications include metoprolol, aspirin, nicotinic acid, simvastatin, and vitamins.
Electrocardiogram Interpretation
The atrial rhythm is most easily identified in the lead V1 rhythm strip and lead aVF. In these leads, P waves are seen to precede each QRS complex at a rate of approximately 85 per minute, representing NSR. The 2nd, 3rd, 8th, 9th, 10th, and 11th QRS complexes are wide, with a complete left bundle branch configuration. This represents an AIVR. The native QRS complex is abnormal, with a wide Q wave present in leads III and aVF indicating an age-indeterminate inferior myocardial infarction. The first QRS complex is intermediate between the native QRS complex and the AIVR complex and represents a ventricular fusion complex. P-wave activity is seen during the AIVR as a downward deflection within the proximal ST segment of the third QRS complex noted best in leads II, III, and V1. This supports simultaneous atrial activity and AV dissociation.
Commentary
This patient also had a history of syncope following his myocardial infarction. An electrophysiology study demonstrated readily inducible sustained monomorphic VT, and he underwent subsequent defibrillator placement.
Keyword Diagnoses
NSR
AIVR
Fusion complex
Inferior myocardial infarction, age indeterminate
AV dissociation
ELECTROCARDIOGRAM #44

Clinical History
A 72-year-old man with recently diagnosed myasthenia gravis was admitted for rehabilitation. His past medical history includes diabetes mellitus, chronic obstructive pulmonary disease, recurrent AF, and coronary artery disease.
Electrocardiogram Interpretation
On this ECG, the atrial rhythm is best discerned in lead aVL. This demonstrates a P wave preceding and immediately following a diminutive QRS complex. This represents AFL with 2:1 AV conduction. Another possibility is a rapid ectopic atrial tachycardia. Diffuse nonspecific ST-T changes are present, as are frequent PVCs. The frequent PVCs occur at a constant interectopic interval with a differing coupling interval to the immediately preceding QRS complex. There is evidence of ventricular fusion complexes between the native QRS complex and a PVC. These features together confirm the presence of ventricular parasystole.
Commentary
This is an unusual tracing, as the atrial rhythm is best discerned in lead aVL. This underscores the importance of a systematic evaluation of each ECG lead, particularly in the setting of an atrial dysrhythmia. The P wave immediately following the QRS complex is best seen in lead aVL and allows for the accurate diagnosis of this atrial dysrhythmia. When frequent PVCs are present, it is also important to evaluate for the presence of ventricular parasystole. Ventricular parasystole is an independent automatic dysrhythmia that discharges at a constant rate from the same ventricular focus.
Keyword Diagnoses
AFL
2:1 AV conduction
PVC
Nonspecific ST-T changes
Ventricular parasystole
Fusion complex
ELECTROCARDIOGRAM #45

Clinical History
A 49-year-old man with recurrent idiopathic left VT was referred for radiofrequency ablation. A recent echocardiogram demonstrated normal left ventricular systolic function without evidence of a prior myocardial infarction. His medications include verapamil, sotalol, simvastatin, and aspirin.
Electrocardiogram Interpretation
This ECG demonstrates a regular wide QRS-complex tachycardia at a rate of approximately 175 per minute. This tachycardia demonstrates a complete RBBB morphology with a qR QRS-complex pattern in lead V1 and terminal S-wave slowing in leads V1 and V6. The QRS-complex frontal-plane axis is deviated far leftward, is prolonged, and has a qR QRS-complex pattern in lead V1, suggestive of VT. In the center of the tracing, best seen in leads V1 and aVF, a more narrow QRS complex occurs. This is a sinus capture complex and lends greater support to the diagnosis of VT. In lead aVF, within the sinus capture QRS complex, a prominent Q wave is seen with ST-segment elevation, suggestive of an acute inferior myocardial infarction. Periodic P waves are seen throughout the tracing, suggesting an independent atrial rhythm and AV dissociation. The precise atrial rhythm diagnosis is not discernible on this tracing. Wandering baseline artifact is also seen.
Commentary
This ECG contains important features supporting the presence of VT. When assessing a wide complex tachycardia, each of these features should be specifically sought. They include AV dissociation in the presence of an independent atrial rhythm and sinus capture complexes. Not seen on this ECG but often present in the setting of VT are ventricular fusion complexes. The apparent Q wave occurring in lead aVF remains unexplained, given the patient’s normal heart function and normal regional wall motion on echocardiography.
Keyword Diagnoses
VT
Sinus capture complex
AV dissociation
Inferior myocardial infarction, acute
Baseline artifact
ELECTROCARDIOGRAM #46

Clinical History
A 48-year-old woman presented with severe hypertrophic cardiomyopathy and pronounced symptoms of exertional dyspnea and presyncope immediately status post-percutaneous alcohol ablation of her first septal perforator branch of the left anterior descending coronary artery. The patient was resting comfortably in the intensive care unit.
Electrocardiogram Interpretation
The cardiac rhythm is NSR, as the P-wave vector is upright in leads I, II, III, and aVF. The atrial rate is regular and slightly >60 per minute. Approximately 2 mm of ST-segment elevation is seen in lead V1, and 1 mm of ST-segment elevation is present in lead V2. Reciprocal ST-segment depression is seen inferiorly and laterally. This represents an acute septal myocardial infarction and acute myocardial injury.
Commentary
The ST-segment elevation in leads V1 and V2 reflects the proximal septal iatrogenic myocardial infarction created by the alcohol injection. This is a pure proximal septal myocardial injury pattern reflected electrocardiographically. The purpose of this procedure is to infarct the proximal interventricular septum and therefore reduce the degree of left ventricular outflow tract obstruction, avoiding otherwise necessary cardiac surgery.
Keyword Diagnoses
NSR
Septal myocardial infarction, acute
Acute myocardial injury
ELECTROCARDIOGRAM #47

Clinical History
A 48-year-old woman presented with severe hypertrophic cardiomyopathy and pronounced symptoms of exertional dyspnea and presyncope immediately status postpercutaneous alcohol ablation of her first septal perforator branch of the left anterior descending coronary artery. The patient was resting comfortably in the intensive care unit.
Electrocardiogram Interpretation
The cardiac rhythm is sinus bradycardia with a normal P-wave axis slightly <60 minute. An RsR′ QRS complex is seen in lead V1 with terminal S-wave slowing in leads I, aVL, and V5 and V6, consistent with complete RBBB. The QRS-complex frontal-plane axis is deviated far rightward, as the QRS-complex vector is negative in lead I and positive in leads III and aVF. Prominent ST-segment elevation of at least 2 mm is seen in leads V1 and V2, consistent with an acute septal myocardial infarction and an acute myocardial injury pattern. Diffuse reciprocal ST-segment depression is present.
Commentary
This ECG was obtained several hours after ECG #46 and reflects the same patient. This demonstrates similar findings as tracing #46, with the exception of a newly developed complete RBBB and extreme QRS-complex frontal-plane right-axis deviation. The finding of new extreme right-axis QRS-complex deviation reflects left posterior hemiblock. This is an example of a bifascicular block. Inferior Q waves are more prominent on this tracing compared to tracing #46 and reflect the left posterior hemiblock and not the interval development of an inferior myocardial infarction.
Keyword Diagnoses
Sinus bradycardia
Septal myocardial infarction, acute
Complete RBBB
Left posterior hemiblock
Acute myocardial injury
ELECTROCARDIOGRAM #48

Clinical History
A 51-year-old woman with metastatic breast carcinoma is undergoing bone marrow transplantation. Her serum potassium level at the time of this ECG was 2.9 mEq/L.
Electrocardiogram Interpretation
The extreme left-hand portion of this ECG demonstrates upright P waves in leads I, II, and III, suggesting NSR. A prolonged QT interval is present, with nonspecific ST-T changes. The first QRS complex is reflective of NSR and a native QRS complex. This is followed by a PVC, and a disorganized wide QRS-complex tachycardia ensues. The wide QRS-complex tachycardia has a changing or rotating axis consistent with torsades de pointes. A fine baseline artifact is present.
Commentary
Torsades de pointes is a potentially fatal ventricular arrhythmia, in this instance triggered by extreme hypokalemia. It is also seen in the presence of antiarrhythmic therapy initiation. It is characterized as a wide QRS-complex VT with a varying QRS-complex axis as depicted on this ECG. Prompt correction of any underlying metabolic disturbance and withdrawal of potentially contributing medications is essential.
Keyword Diagnoses
NSR
Prolonged QT interval
Torsades de pointes
Baseline artifact
Nonspecific ST-T changes
Hypokalemia
ELECTROCARDIOGRAM #49
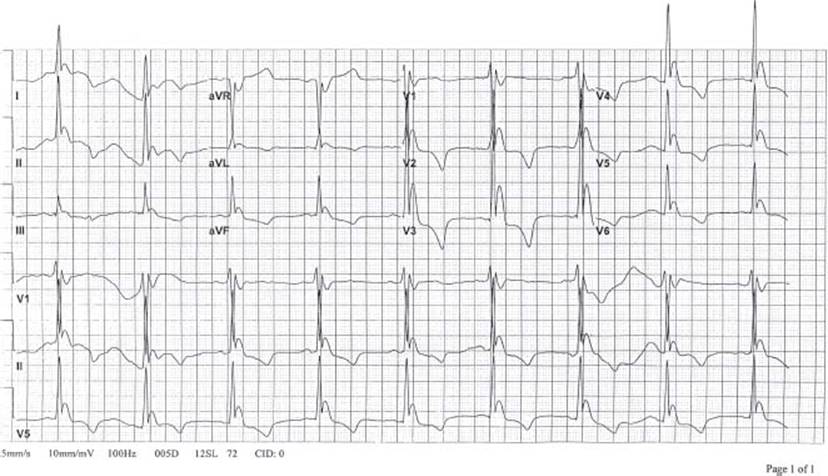
Clinical History
A 42-year-old man was found unconscious under a bridge and brought to the Emergency Department by ambulance.
Electrocardiogram Interpretation
Sinus bradycardia is present, as the atrial rate is regular at approximately 50 beats per minute. Baseline artifact, especially in leads I and II, is noted. The QRS complex is significantly widened, with a terminal QRS-complex delay, evident in all leads. Diffuse nonspecific ST-T changes denoting abnormal repolarization are also seen. This is an example of profound hypothermia and Osborne waves. The Osborne or “J” waves represent the terminal QRS-complex conduction delay.
Commentary
Hypothermia is a medical emergency. This ECG is a classic example. The etiology of the Osborne wave is not completely clear but is related to slow cardiac conduction. Atrial arrhythmias and PR-interval prolongation are often identified. Osborne waves are named for the person who first identified them and their relationship to hypothermia.
Keyword Diagnoses
Sinus bradycardia
Baseline artifact
Osborne wave
Hypothermia