
INTRODUCTION
Echocardiography is a technique of generating images of the heart with the help of ultrasound (like skiagraphy is performed with X-rays). Echocardiography has become an integral part of clinical examination with its bedside mobility and utility. Practice of echocardiography mandates the following steps:
• Understanding of ultrasound physics
• Knowledge of the instrumentation
• Acquisition skills
• Interpretative skills
• Sound knowledge of cardiovascular anatomy and physiologies
• Adequate knowledge of common cardiac pathology
• Reporting, storage and retrieval skills.
Ultrasound behaves very differently when it passes
through any tissue. Many of the objects and artifacts seen in ultrasound images are due to the physical properties of ultrasonic beams, such as reflection, refraction, diffraction and attenuation. Indeed, physical artifacts are an important element in clinical diagnosis (Fig. 1.1). Appreciating the phenomena created by ultrasound may greatly benefit the patient in terms of increased accuracy of interpretation and diagnosis. The ultrasound wave created for sending through the tissues is called incident wave. This is the wave whose behavior is changed by the tissue.

Fig. 1.1 : Behavior of the sound waves. Sound wave after striking a surface gets reflected as well as transmitted into the other medium in a different direction (refracted). Total internal reflection without transmission occurs if it strikes the interface at 90°.
ULTRASOUND PHYSICS
Sound
Sound is a form of mechanical energy that consists ofwaves of compression and decompression of the transmitting medium, travelling at a fixed velocity (Figs 1.2 and 1.3).
Sound is an example of longitudinal waves oscillating back and forth in the direction the sound travels, thus consisting of successive zones of compression

Fig. 1.2: Alternating compression and rarefaction of a medium as sound passes through it.

Fig. 1.3 : Sound as an oscillating wave of mechanical energy. Compression is accompanied by high pressure and rarefaction by low pressure.

Fig. 1.4 : The concept of pulsed ultrasound. If an interface is closure to the source of ultrasound, more pulses will be received per second resulting in better resolution.
(high pressure) and rarefaction (low pressure). The medium particles, however, show both longitudinal and transverse oscillations.
Longitudinal oscillations: the oscillating particles of the medium are displaced parallel to the direction of motion (direction of energy transfer).
Transverse oscillations: The oscillating particles of the medium are displaced in a direction perpendicular to the motion of the wave.
Ultrasound: Sound waves with a frequency of 20000 c/s (20 KHz) are labeled ultrasound. Ultrasound used in medical diagnosis has a frequency of 1-10 MHz.1-3 These are beyond the capacity of human ear to perceive.
Why Use Ultrasound in Medicine?
With higher frequencies (shorter wavelengths), the sound tends to move more in straight lines like electromagnetic beams and is reflected like light beams. It is reflected by much smaller objects (because of shorter wavelengths) and hence gives good spatial resolution. If the wavelength of the sound is smaller than the object, no noticeable diffraction occurs.
wavelength = speed/frequency
Frequency: The frequency of an ultrasound wave consists of the number of cycles or pressure changes that occur in one second (Fig. 1.2). the units are cycles per second or hertz (Hz). Frequency is determined by the sound source only and not by the medium in which the sound is travelling.
Propagation speed: Propagation speed is the rate at which sound can travel through a medium and is typically considered 1,540 m/s for soft tissue. the speed is determined solely by the medium characteristics like density and stiffness. Speed is inversely proportional to density and incompressibility.
Pulsed ultrasound: Pulsed ultrasound describes a means of emitting ultrasound waves from a source. To achieve the depth of resolution required for clinical uses, pulsed beams are used. Typically, the pulses are a millisecond or so long and several thousands are emitted per second (Fig. 1. 4).
Ultrasound interaction with tissue: As a beam of ultrasound travels through a material, various things happen to it. A reflection of the beam is called an echo, a critical concept in all diagnostic imaging (Fig. 1.5).

Fig. 1.5 : The concept of an echo.
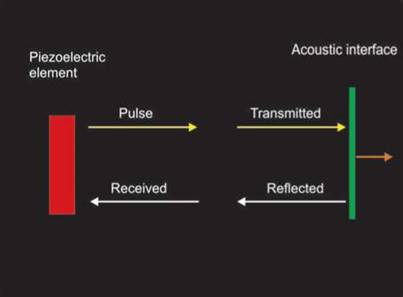
Fig. 1.6 : Soft tissue acoustic interface producing some reflection and more transmission. If a medium has high acoustic impedance, stronger reflection will occur.
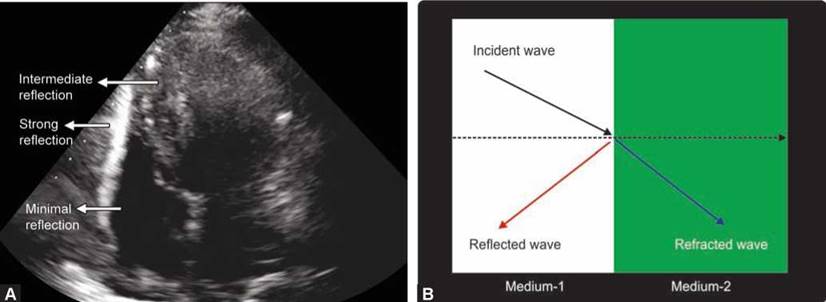
Figs 1.7A and B: (A) Tissue interfaces with variable acoustic impedance. Higher impedance produces brighter echo due to more reflection of ultrasound; (B) Refraction: Bending of the sound wave as it enters another medium. Refraction is associated with decreasing speed and wavelength.
The production and detection of echoes form the basis of the technique that is used in all diagnostic instruments. A reflection occurs at the boundary between two materials provided that acoustic impedance of the materials is different. This acoustic impedance is a product of the density and propagation speed.
If two materials have the same acoustic impedance, their boundary will not produce an echo. If the difference in acoustic impedance is small, a weak echo will be produced and most of the ultrasound will carry on through the second medium. If the difference in acoustic impedance is large, however, a strong echo will be produced. If the difference in acoustic impedance is very large, all the ultrasound will be totally reflected. Typically in soft tissues, the amplitude of an echo produced at a boundary is only a small percentage of the incident amplitudes (Fig. 1.6).
Strong reflections or echoes show on the ultrasound image as white and weaker reflections as gray (Figs 1.7A and B).
A sound wave will undergo certain behaviors when it encounters a tissue interface. Possible behaviors include:
• Reflection off the tissue interface
• Diffraction around the interface
• Transmission (accompanied by refraction) into the interface or new medium (Fig. 1.8)


Reflection of sound waves off of surfaces can lead to one of two phenomena—an echo or a reverberation.
The reception of multiple reflections off of the interface causes reverberations—the prolonging of a sound (Figs 1.9 and 1.10).
Angle of incidence: If a beam of ultrasound strikes the boundary at right angle, it will be reflected parallel to the transmitting beam and shall produce stronger echo (Fig. 1.11). If it strikes a boundary obliquely, the interactions are more complex than for normal incidence (Fig. 1.12). The echo will return from the boundary at an angle equal to the angle of incidence. The transmitted beam will be deviated from a straight line by an amount that depends on the difference in the velocity of ultrasound at either side of the boundary. This process is known as refraction (Figs 1.1 and 1.7).
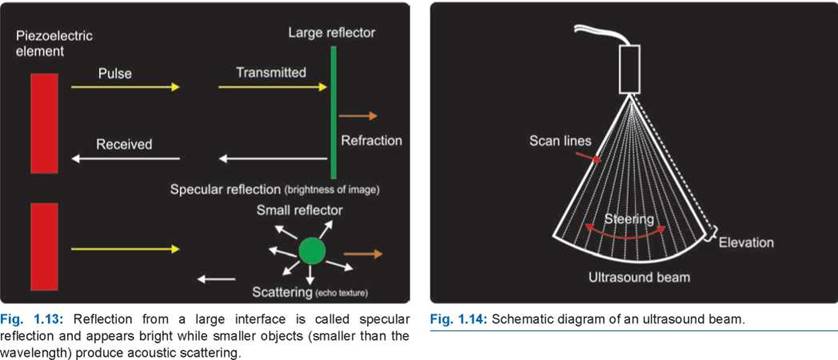
Reflection is of two types (Fig. 1.13):
1. Specular reflection: is from a large tissue interface (smooth boundary between media) and produces bright echoes. These signals are intense and angle dependent:
2. Acoustic scattering, occurs from smaller objects. Scattering is responsible for tissue texture. the signals are less intense and less angle dependent. These provide tissue signature to the image.
As sound waves travel through a medium (e.g. tissue or blood), the intensity weakens or attenuates. The degree of attenuation is expressed in decibels (dB). Absorption represents a conversion of sound energy to another form of energy and is the major reason for attenuation. Attenuation is greater for high-frequency sounds, which result in higher absorption and more scatter. Attenuation coefficient is smallest for the fat and maximum for lungs. Bones also have very high attenuation coefficient.
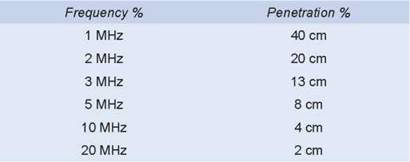
Depth to which an ultrasound beam travels into a tissue is called penetration. Besides the tissue characteristic, penetration is largely dependent upon the frequency of the ultrasound being applied:
ultrasound beam
the sound beam is the confined, directional beam of ultrasound travelling as a longitudinal wave from the transducer face into the propagation medium. Ultrasound beams are made of scan lines. ttese have length (azimuth) along their long axis and width (elevation) along their short axis. Beam width should be as narrow as possible to prevent beam width artifacts and which can be achieved by using lens. Ultrasound beams are either steered mechanically or electrically. Both rapidly sweep sound waves through tissues (Fig. 1.14).
Image formation requires an ultrasound machine with appropriate transducers and display, using a cathode-ray tube or a flat panel.
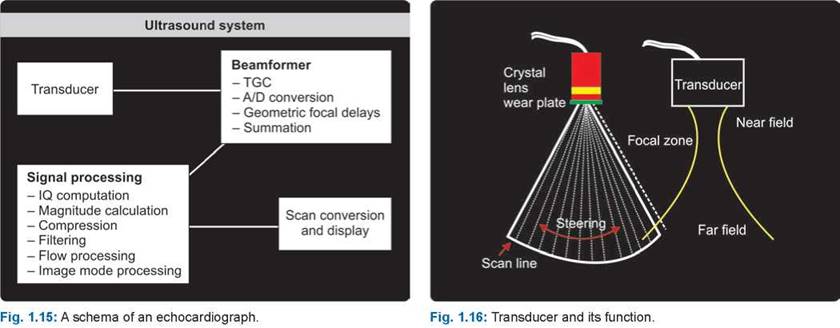

A basic echocardiography machine has the following parts (Fig. 1.15):
• Transducer probe: Probe that sends and receives the sound waves
• Central processing unit (CPU): Computer that does all of the calculations and contains the electrical power supplies for itself and the transducer probe
• Transducer pulse controls: Changes the amplitude, frequency and duration of the pulses emitted from the transducer probe
• Display: Displays the image from the ultrasound data processed by the CPU
• Keyboard/cursor: Inputs data and takes measurements from the display
• Disk storage device (hard, floppy, CD): Stores the acquired data.
A transducer is a device that converts one form of energy into another form.
• The transducer probe makes the sound waves and receives the echoes. It is the mouth and ears of the ultrasound machine (Fig. 1.16).
• Ultrasound transducers, or probes, can be categorized based on their frequency range, low frequency versus high frequency; and the shape of the probe, curved versus linear or sector. Linear probes are mostly used for vascular examination while sector probes are used for cardiac examination (Fig. 1.17).
• Linear array probes are high-frequency probes. High- frequency probes have less tissue penetration but good near-field image resolution.
• Curved array probes are low-frequency probes and used mainly for abdominal examination.
• Low-frequency probes have greater tissue penetration; however, resolution is compromised (Fig. 1.18).
• Ultrasound transducers have a housing that contains inside piezoelectric element.
• Main component of a transducer is a piezoelectric element that generates ultrasound waves as it gets deformed by the applied electrical energy. As returning ultrasound beam deforms it again, it generates electricity, which is used to create an image (Fig. 1.19).
• Most transducers in use nowadays have synthetic piezoelectrical ceramics, polymers, composites, crystals and so forth, with defined electromechanical coupling and acoustic impedance.

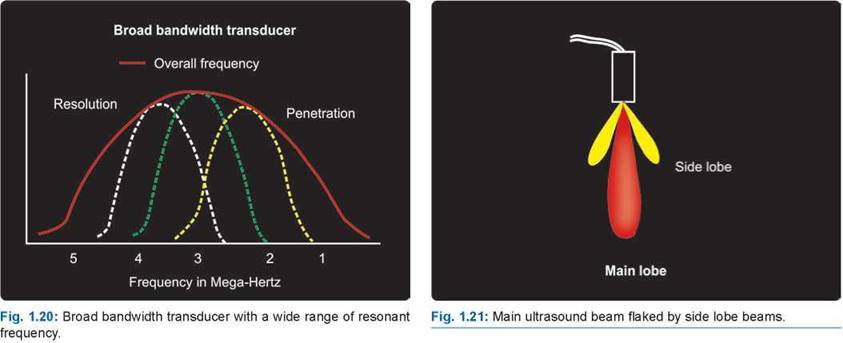
• the new generations of piezoelectric elements have broad bandwidth for optimal resolution and penetration (Fig. 1.20).
• Nominal frequency of a transducer depends upon its resonance frequency.
• Damping and electrical energy modulation generate a wide range of frequencies (broad bandwidth) around the nominal frequency.
• Frequency of a transducer depends upon electrical pulse frequency.
• the piezoelectric element has a very high acoustic impedance and works like a reflective surface but material surrounding it works as a dump.
• the multielement transducer generates a main ultrasound beam that produces diagnostic images and accessory beams (side lobes; Fig. 1.21).
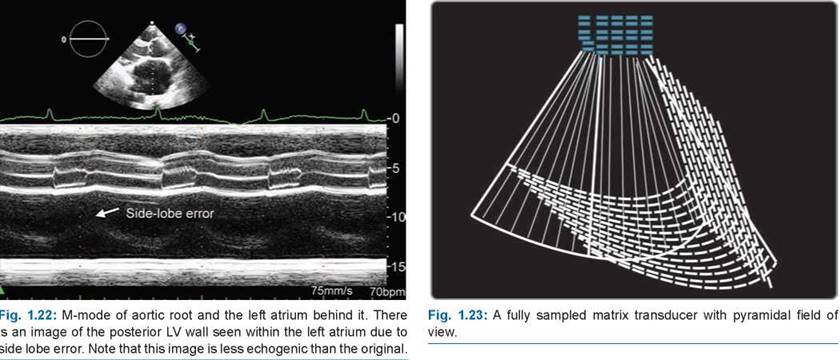
Side-lobe beams can produce side-lobe artifacts, which need to be recognized (Fig. 1.22). Side-lobes may be minimized by driving the elements at variable voltages in a process called apodization.
• Most transducers have a focal point. Up to the focal point, there is near field and beyond that there is far field. Far field has increased distance between scan lines and hence lower resolution.
• Currently, most transducers are fully sampled matrix array transducers with thousands of elements [compared to 64-256 elements in two-dimensional (2D) probes] that provide a thick ultrasound beam (Fig. 1.23).
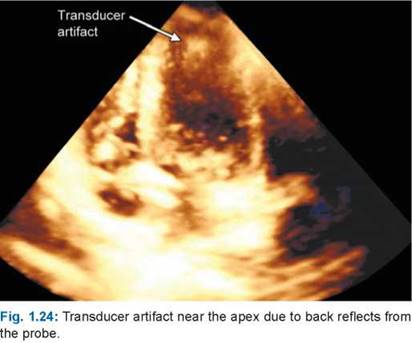
• The probe also has a sound absorbing substance, to eliminate back reflections from the probe itself; and an acoustic lens, to help focus the emitted sound waves. Despite these, there can be back reflects from the transducer producing transducer artifacts (Fig. 1.24).
• The shape of the probe determines its field of view, and the frequency of emitted sound waves determines how deep the sound waves penetrate and the resolution of the image.
• Transducers of high frequency have thin piezoelectric elements that generate pulses of short wavelength.
• Beam-forming (link) is a general processing technique used to control the directionality of the reception or transmission of a signal on a transducer array. Developments in transducer technology have resulted
in a reduced transducer footprint, improved side-lobe suppression, increased sensitivity and penetration, and the implementation of harmonic capabilities that can be used for both gray-scale and contrast imaging.
A conventional 2D phased array transducer is composed of multiple piezoelectric elements that are electrically isolated from each other and arranged in a single row. Individual ultrasound wave fronts are generated by firing individual elements in a specific sequence with a delay in phase with respect to the transmit initiation time. Each element adds and subtracts pulses to generate a single ultrasound wave with a specific direction that constitutes a radially propagating scan line. The linear array can be steered in two dimensions [vertical (axial) and lateral (azimuthal)], while resolution in the Z-axis (elevation) is fixed by the thickness of the image slice, which, in turn, is related to the vertical dimension of piezoelectric elements.
Three-dimensional echocardiography (3DE) matrix- array transducers are composed of 3,000-9,000 independent piezoelectric elements with operating frequencies ranging from 2 to 4 MHz and 5 to 7 MHz for transthoracic echocardiography (TTE) and transesophageal echocar- diographic (TEE), respectively. These piezoelectric elements are arranged in a matrix configuration within the transducer to steer the ultrasound beam electronically.

the transducer to steer the ultrasound beam electronically. the electronically controlled phasic firing of the elements in that matrix generates a scan line that propagates radially and can be steered both laterally (azimuth) and in the elevation to acquire a volumetric pyramid of data (Fig. 1.25).
Multiple-Time Reception and Parallel Processing of reflected Beam
Basic imaging by ultrasound uses the amplitude information in the reflected signal. One pulse is emitted, the reflected signal, however, is sampled more or less continuously (99% time is for receiving). As the velocity of sound in tissue is fairly constant, the time between
the emission of a pulse and the reception of a reflected signal is dependent on the distance; that is, the depth of the reflecting structure. The reflected pulses are thus sampled at multiple time intervals (multiple range gating), corresponding to multiple depths, and displayed in the image as depth. Parallel processing for multiple simultaneous reception of reflected waves improves the temporal resolution (Fig. 1.26). This parallel processing could be in ratio of 1:16 or more.
It is the parameter of an ultrasound imaging system that characterizes its ability to detect closely spaced interfaces and displays the echoes from those interfaces as distinct and separate objects. If resolution is better, clarity of the image is improved. Resolution is of two types:
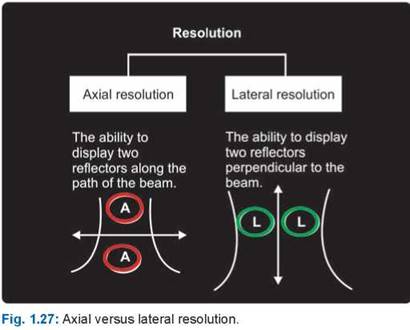
Axial resolution: Is the minimum required reflector separation along the direction of propagation required to produce separate reflections. Good axial resolution is achieved with short spatial pulse lengths. Short spatial pulse lengths are a result of higher frequency and higher damped transducers. Therefore, the higher the frequency, the better is the resolution (Fig. 1.27). Axial resolution is also called longitudinal or azimuthal resolution.
Lateral resolution: Is the minimum reflector separation perpendicular to the direction of propagation required to produce separate reflections. Good lateral resolution is achieved with narrow acoustic beams. Wider beams typically diverge further in the far field and any ultrasound beam diverges at greater depth, decreasing lateral resolution.

Therefore, lateral resolution is best at shallow depths and worse with deeper imaging.
Temporal resolution: is the ability to detect that an object has moved over time. For the purposes of medical ultrasound, temporal resolution is synonymous with frame rate. Typical frame rates in echo imaging systems are 30-100 Hz. The temporal resolution or frame rate = 1/ (time to scan 1 frame). The time to scan one frame is equal to the pulse repetition period number of scan lines per frame.
Common means of improving frame rate include:
• Narrowing the imaging sector, which decreases the time it takes to scan one frame
• Decreasing the depth, which decreases the pulse repetitive frequency
• Decreasing the line density, which requires fewer lines to scan one frame
• Turning off multifocus, which decreases the number of pulses needed per line.
Within transducers, there is a FOCUS that concentrates the sound beam into a smaller beam area than would exist otherwise. This area of focus is where one obtains the best images. The focus is on the monitor, on the vertical millimeter scale. So when positioning anatomy, make sure it is in the region of the focus, so best images may be obtained.
It is defined as the peak rarefactional pressure (negative
pressure) divided by the square root of the ultrasound
frequency. The used range varies from 0.05 to 1.9.
technique of Image Acquisition
• At the start of an echocardiography examination, the appropriate transducer is selected according to the type of examination and patient's body habitus.
• A higher frequency transducer provides better resolution, but it has a shallower depth of penetration. For the pediatric population, the transducer frequency is usually 5-7.5 MHz, but for adults the transducer frequency at the start of an examination is usually 2-2.5 MHz.
• In fundamental imaging, echocardiographic images are created when the transducer receives reflected beams of the same frequency as the transmitted beam, but the interface between tissue and blood can be delineated better with the reception of harmonic frequencies.
• When the only reflected frequency received to create the ultrasound image is equal to a multiple of the transmitted frequency, the technique is called harmonic imaging. Myocardial tissues are able to generate harmonic frequencies, and harmonic imaging improves the delineation of the endocardial border (tissue harmonic imaging). As a result, harmonic imaging is usually the imaging modality of choice (Fig. 1.28).
• A limitation of harmonic imaging in routine 2D echocardiography is the increased sparkling quality to the ultrasound image and the increased thickness of the endocardial border (Fig. 1.29).
• The following should be shown on the screen: The patient's identification, blood pressure at the time of the examination, and an electrocardiographic tracing.
• The examination of an adult patient usually begins with a depth of 20-25 cm and a wide sector (90°). This also gives an idea about any unusual extracardiac structures. After the initial view, adjust the field depth to use the entire screen to demonstrate the intended cardiovascular images.
• A zoom or regional expansion selection (RES) function should be used frequently to visualize a region of interest. The zoomed image is also better for


making measurements, with less intraobserver and interobserver variability (Fig. 1.30).
• When quantitative measurements are made, review the acquired image in a cine loop format to identify a frame at a specific timing of a cardiac cycle. Examples are a midsystolic frame to measure the diameter of the left ventricular outflow tract, an end-systolic frame to measure the size of the left atrium and an end-diastolic frame to measure the wall thickness of the left ventricle.
Specific areas need to be imaged and it may be necessary to decrease the sector size, which will improve temporal
resolution by increasing the frame rate. The gain of the image is controlled by overall gain and regional gain [by time gain compensation (TGC)].
Hyperechoic areas have a great amount of energy from returning echoes and are seen as white.
Hypoechoic areas have less energy from returning echoes and are seen as gray.
Anechoic areas without returning echoes are seen as black.
The received ultrasound signal can be amplified by increasing the gain. Decreased gain yields a black image and details are masked, while increased gain yields a whiter image.
TGC will change the gain factor so that equally reflective structures will be displayed with the same brightness regardless of their depth (Fig. 1.31).
TGC allows amplification of ultrasound beams from deeper depths because different amplitudes of ultrasound signals are produced when received from different depths. More TGC is required for higher frequency transducers, which create more attenuation.
Returning ultrasound waves are referred to as signal, while background artifact is referred to as noise. Increasing the gain increases the signal-to-noise ratio.
Reduces the differences between the smallest and largest amplitudes of ultrasound images by reducing the total range without altering the signal ratio.
The probe cannot produce a pulse that travels purely in one direction. Pulses also travel off at specific angles. These side lobes are relatively weak and so normally do little to degrade the image. Their effect is only normally seen faintly superimposed in fluid filled areas that are anechoic and so do not obscure the weak side lobe reflections. The exception is when a side lobe strikes a particularly strong reflector at 90°. In this case, the reflector can appear within the image.
Partial volume: The slice that makes up the ultrasound image is 3 dimensional. This typically means that fluid filled areas, where they are very small or adjacent to soft tissue will not appear anechoic (black) as would be expected, but often contain low level echoes which can be mistaken for debris or even soft tissue.
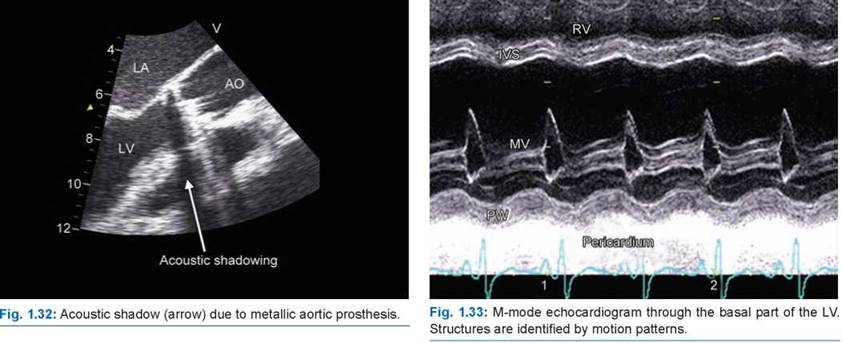
Tissues with high attenuation coefficients like bone or prosthesis do not allow passage of ultrasound waves. Therefore any structure lying behind tissue with a high attenuation coefficient cannot be imaged and will be seen as an anechoic region (Fig. 1.32).
Reflected ultrasound waves (echoes) are detected, filtered and amplified electronically by the system and displayed on the cathode ray tube in the following manner.4-6
A-mode and M-mode image: Sending and receiving an ultrasound wave along a single line generates an A-mode (amplitude-mode) or an M-mode image. In amplitude mode (A-mode), reflected sound signal is displayed as a vertical spike (voltage amplitude).
In brightness mode (B mode), the amplitude spike is replaced by a dot. The dot has a location, certain brightness and also motion. Dots of a structure or interface have similar brightness and motion, which can be displayed in two axes: vertical and horizontal. If there are dots along a single scan line, it is called M-mode echocardiography. If dots are along multiple scan lines that are steered in a predetermined fashion, the morphology of the structure can be identified when dots are arranged in a plane and this is called cross-sectional or 2D echocardiography.
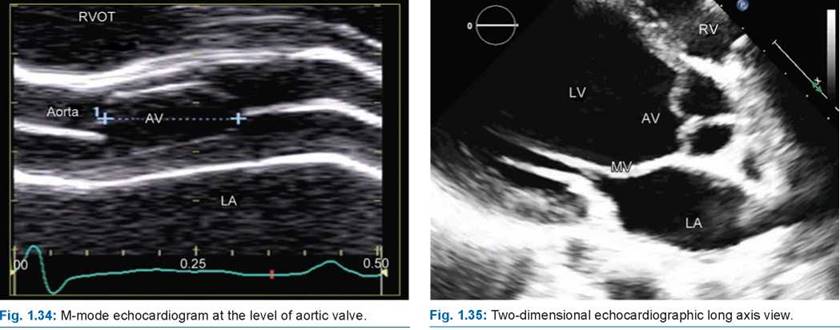
“Motion imaging mode (M-mode) is a gray-scale display of amplitude from each depth along a single scan line over time with a high temporal resolution” (Figs 1.33 and 1.34).
2D image is a gray-scale display of amplitude (dots) from each depth along several scan lines created by steering the ultrasound beam in an imaging plane. This provides a real-time tomographic view in the form of a thin slice with spatial resolution at the cost of temporal resolution (Figs 1.35 and 1.36).


These slices are of less than 1 mm each and can be sagittal, coronal, transverse or oblique.7
3D image is a colorized-display of amplitude over depth from several imaging planes in a pyramidal volume as if tomographic slices in various X, Y and Z planes have been stitched together (Figs 1.37 and 1.38).
Real-time 3D images are obtained by matrix array transducers (Fig. 1.39).
Transducers have markings of resonant frequency type of element array and a light dot or line to indicate reference or plane of display. The location of transducer while examining the heart is called a window. Following are the conventional windows:

• Parasternal (anterior chest wall on either side of sternum between second and 4th intercostal spaces)
• Apical (over palpable apex)
• Subcostal (below xiphisternum)
• Suprasternal (above manubrium sterni in suprasternal notch)
• Transesophageal
• Epicardial (during open heart surgery)
• Intracardiac
Axis: is the plane in which the ultrasound beam travels through the heart:
Long axis: When the ultrasound beam travels longitudinally through the heart (Fig. 1.40).
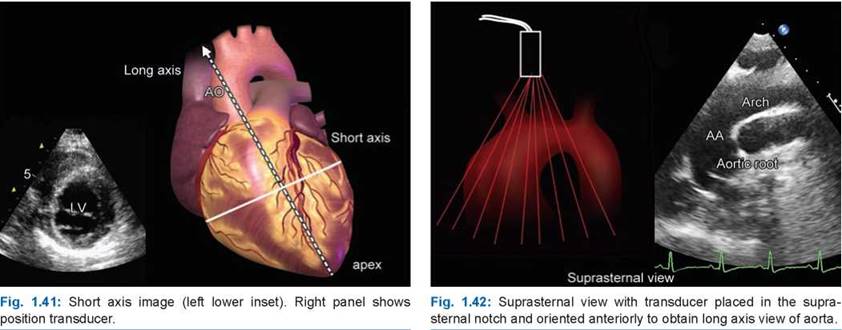
Short axis: Short axis image is obtained when the ultrasound beam travels perpendicular to the long axis of the heart (Fig. 1.41).
Views: are window-specific images like apical four- chamber view or parasternal long axis (PLAX) view or suprasternal view (Fig. 1.42).
Sequence of an Echocardiographic Examination
Sequence of an echocardiographic examination is different in adults and children with suspected congenital heart disease. In infants and children, the primary window is subcostal followed by suprasternal with a little use of parasternal views. In adults, the following sequence of windows for examination, is usually followed (Fig. 1.43):
• Left parasternal window
• Apical window
• Subcostal window


• Suprasternal window
• Right parasternal window
To obtain an image, it is common to rotate, tilt or move the transducer in different directions to get the best possible views.
In this view, ultrasound beam goes through the long axis of the heart. The transducer is placed in the left second to fourth intercostal space close to the sternum. The view and the structures that it shows are depicted in Figure 1.44.
In the left parasternal view, tilting the transducer superiorly and laterally will show the right ventricular outflow tract and the pulmonary artery in the long axis view (Fig. 1.45).
From the PLAX view, the transducer is rotated counterclockwise to right angle and tilted up and down to obtain short axis views at various levels (Figs 1.46 to 1.48).

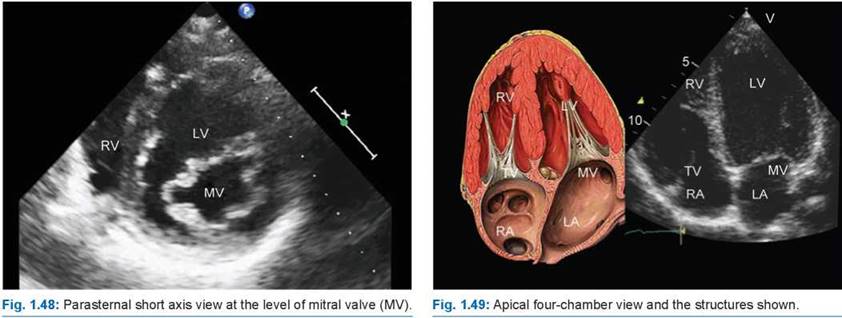
the transducer is placed at the palpable apex or just below and 4 views can be obtained by rotating and tilting it.
1. Apical four-chamber view
2. Apical two-chamber view
3. Apical long axis view
4. Apical five-chamber view.
Apical four-chamber view is obtained when the transducer is placed at the apex and the reference point toward the right shoulder (Fig. 1.49).
When the transducer from the apical four-chamber position is rotated anticlockwise, apical two-chamber view can be obtained (Fig. 1.50).
Rotating the transducer clockwise from the apical four-chamber position shows apical long axis view (Fig. 1.51).
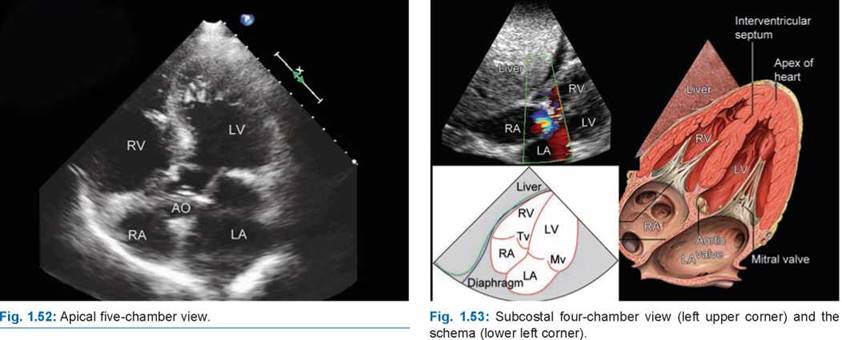
With inferior tilt of the transducer from the apical four- chamber view, an apical five-chamber view can be shown (Fig. 1.52).
By placing the transducer in subxiphoid position, subcostal views can be obtained both like that from parasternal and apical windows. The transducer needs to be rotated or tilted. Most standard views like the four- chamber view (Fig. 1.53) or the short axis views can also be obtained from a subcostal transducer position.

The subcostal view can be very helpful in patients with bad image quality or in patients with suspected pericardial effusion.
To obtain the subcostal four-chamber view, place the transducer over the center of the epigastrium and tilt it downward from the suprasternal notch to the left shoulder of the patient. The image produced will be similar to the apical four-chamber view. The short-axis subcostal view, however, is similar to the parasternal view and is ideal for studying the right side of the heart.
Subcostal four-chamber view is obtained by pointing the reference point of the transducer toward the left shoulder with some inferior tilt to the base of probe. By rotating the transducer, a series of short axis can be obtained (Fig. 1.54).
Main structures examined by subcostal views besides the cardiac chambers are:
• Inferior vena cava
• Hepatic veins
• Azygous and anomalous pulmonary veins
• Abdominal aorta and its branches
The four cardiac chambers, the right ventricular outflow tract, the aorta, and the vena cava can be visualized in the subcostal view. Sometimes, it is also possible to visualize a portion of the abdominal aorta. Pointing the transducer toward the right side of the patient would result in a good view of showing the liver and suprahepatic veins as well as a transverse cross-section of the inferior vena cava (Fig. 1.55).


Suprasternal views (Fig. 1.56) are routinely used in children and adult patients to study:
• Ascending aorta; arch and its branches; descending thoracic aorta
• Coarctation of aorta
• Patent ducts arteriosus
• Right and left superior vena cavae
• Azygous veins
• Supracardiac variety of anomalous pulmonary venous drainage
• Pulmonary artery bifurcation
Transesophageal Echocardiographic Views
the technique of TEE permits visualization of heart without the acoustic interference imposed by the chest wall, ribs and the lungs. ttis is achieved by introduction of
a thin-walled probe with tip-mounted multielement 2D or matrix-array 3D (5-10 MHz) transducer into the esophagus or the gastric fundus using topical local anesthesia in fasting state with or without mild sedation (Fig. 1.57). Its distinct advantages over transthoracic echocardiography (TTE) are:
• Improved quality with better spatial resolution due to no acoustic barrier and high-frequency probes
• Better visualization of the THE blind spots like the left atrial appendage, thoracic aorta, pulmonary veins and so forth
• Can be used to monitor patients during invasive interventional procedures without risk of contamination or interference
Its drawbacks are:
• Semi-invasive and hence needs intensive monitoring
• Novel imaging planes need greater technical skills to interpret
• Not possible in uncooperative patients or those with esophageal stricture, cervical arthritis, gastric ulcer and so forth.
Probe movements (entire probe moves):
• Advance or withdraw
• Turn right or left
Knob movements (only probe tip moves):
• Flex right or left
• Anteflex or retroflex
Transducer movements (probe stays still):
• Rotate angle forward (0-180°)
• Rotate angle back (180-0°).
• Transverse (0°)
• Longitudinal (90°)
• Omniplane (0-180°).
• High esophageal view
• Midesophageal view
• Transgastric views.
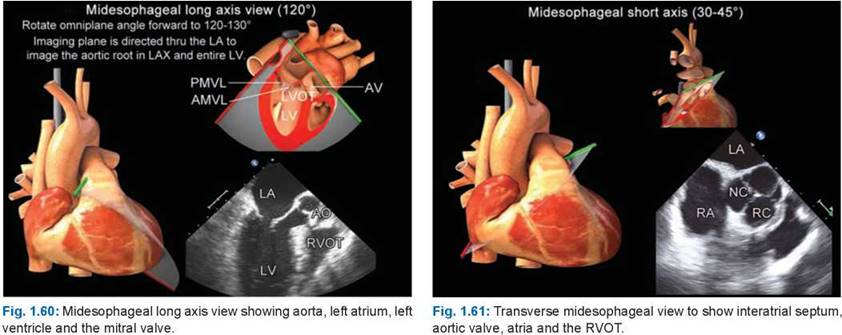
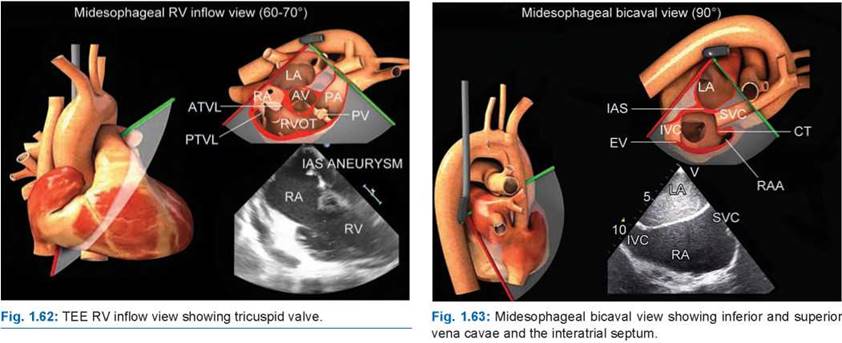
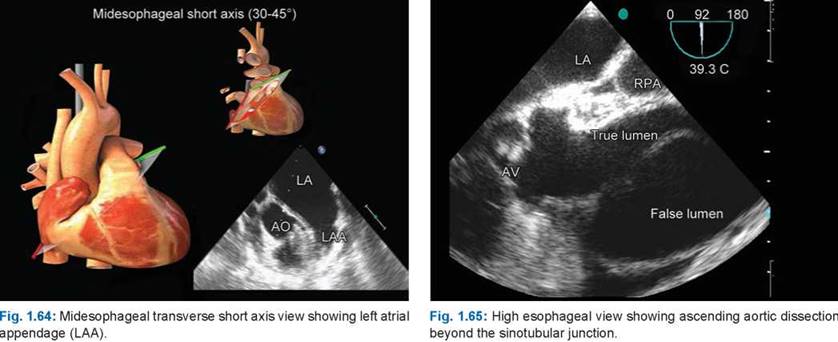
Following are the most common views obtained during TEE and the structures that are shown according to the standard imaging protocols8-9 (Figs 1.58 to 1.64):
High esophageal views are for visualizing the great vessels (Fig. 1.65) while the transgastric views are used to study the detailed anatomy of the mitral and aortic valves including continuous wave (CW) interrogation of the left ventricular outflow tract.
Details of TEE examinations are shown in respective chapters.


references
1. Edelman SK (Ed). Understanding Ultrasound Physics: Fundamentals and Exam Review, 2nd ed. Woodlands, TX: ESP; 1994.
2. McGahan JP, Goldberg BB. Diagnostic Ultrasound, Volume 1. New York, NY: Informa Healthcare; 2007.
3. Kremkau FW (Ed). Diagnostic Ultrasound: Principles and Instruments, 6th ed. Philadelphia, PA: W. B. Saunders;2002.
4. Sites BD, Brull R, Chan VWS, et al. Artifacts and pitfall errors associated with ultrasound-guided regional anesthesia. Part I: understanding the basic principles of ultrasound physics and machine operations. Reg Anesth. 2007;32(5):412-8.
5. Edler I, Hertz CH. The use of ultrasonic reflectoscope for the continuous recording of the movements of heart walls. 1954. Clin Physiol Funct Imaging. 2004;24:118-36.
6. Joyner CR Jr, Reid JM. Applications of ultrasound in cardiology and cardiovascular physiology. Prog Cardiovasc Dis. 1963;5:482-97.
7. Tajik AJ, Seward JB, Hagler DJ, et al. Two-dimensional real-time ultrasonic imaging of the heart and great vessels: technique, image orientation, structure identification, and validation. Mayo Clin Proc. 1978;53:271-03.
8. Seward JB, Khandheria BK, Oh JK, et al. Transesophageal echocardiography: technique, anatomic correlations, implementation, and clinical applications. Mayo Clin Proc. 1988;63:649-80.
9. Lang RM, Badano LP, Tsang W, et al. EAE/ASE recommendations for image acquisition and display using threedimensional echocardiography. Eur Heart J Cardiovasc Imaging. 2012;13:1-46.