
INTRODUCTION
Hemodynamics can be defined as the physical factors that govern blood flow. These are the same physical factors that govern the flow of any fluid, and are based on a fundamental law of physics. Pressure, flow and resistance are all fundamental elements of fluid mechanics. The relationship between these parameters clearly defines the behavior of the blood in the heart and vessels of the human body. Disturbance in flow, intracardiac pressure and resistance all provide useful information in health and disease, which can be used to diagnose severity of valvular stenosis and regurgitation, shunt calculations, assess the integrity of pulmonary circulation, monitor therapy and long-term follow-up of asymptomatic patients with altered pressure-flow dynamics due to structure heart disease. The valves ensure that blood flows in a single pathway through the heart by opening and closing in a particular time sequence during the cardiac cycle and this mechanism may not be true even in normal conditions. How much of this “valve mechanism” is abnormal can be studied by Doppler hemodynamics. Thus, hemodynamics is an important part of cardiovascular physiology dealing with the forces the pump (the heart) has to develop to circulate blood through the cardiovascular system in normodynamics and otherwise.
Echocardiography has replaced invasive cardiac catheterization for various hemodynamic assessments: cardiac output, valvular pressure gradients, dynamic LV outflow tract gradient, right heart pressures, constrictive pericarditis and vascular resistance.
HEMODYNAMIC EVALUATION
1. Hemodynamics: Is an important part of cardiovascular physiology dealing with the forces the pump (the heart) has to develop to circulate blood through the cardiovascular system. Both normotension and normodynamic state (blood flow within normal range) must be part of the therapeutic goal.1
2. Flow: Blood in the circulatory system moves from one point to another driven by a pressure difference at the two points. It can be expressed as total flow volume in one cardiac cycle either in systole or diastole or flow rate (flow/time). Speed with which it moves and the direction are expressed as velocity. Velocity of flow can be obtained by using Doppler echocardiography.2 Flow is a product of velocity and area of flow (Fig. 2.1).
3. Velocity: Velocity basically is the rate of change of the position of an object with time. For blood, it denotes the speed and direction of flow (cm/s).
4. Acceleration: Rate of change in velocity is called acceleration (cm/s2).
5. Force: is a product of mass and acceleration. As the mass is constant, force and acceleration can be used interchangeably.
6. Pressure: Force per unit area is called the pressure.


Flow can be laminar or turbulent. Laminar flow runs in parallel streamlines, while the turbulent flow is chaotic. It is difficult to apply laws of physics on turbulent flow. Estimation of flow using various laws of physics assumes that the flow is in streamline (Figs 2.2 and 2.3).
Turbulence and its extent are defined by the Reynolds number.
□ doppler principle for estimating velocity
If speed of sound through a medium is known or presumed, velocity of flow in it can be determined by the change in frequency of the moving objects (red blood cells) when compared to the transmitting frequency (Fig. 2.4).
In practice, speed of sound is presumed to be 1,540 m/s, and angle of insonification is kept as close to zero as possible so that no angle calculation or correction is required. Angle correction has been given up except while studying vascular flow. If frequency shift is positive (received frequency > transmitted frequency), velocity is positive toward the transducer and vice versa.
Types of Doppler are:
1. Pulsed wave Doppler
2. Continuous wave Doppler
3. Color Doppler
4. Tissue Doppler
5. Power Doppler

PW uses a single crystal that sends and receives sound beam signals.
• The crystal emits a short burst of ultrasound at a certain frequency [pulse repetition frequency (PRF)].
• After a certain interval determined by the depth of interest, it samples the backscatter signals.
• The maximal frequency shift that can be determined is half the PRF or Nyquist limit.
• If the velocity exceeds the Nyquist limit, aliasing occurs—Doppler spectrum gets cut off at the Nyquist
frequency and the rest is recorded in the opposite direction.
CW uses two piezoelectric crystals—one continuously transmits and another continuously receives.
• Useful for high velocities, not limited by the PRF or Nyquist phenomenon
• To get high velocities, one can use the nonimaging transducer.
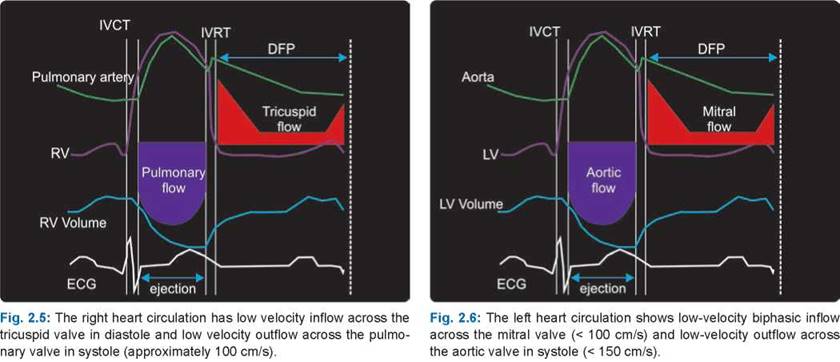
The normally functioning valves ensure that blood flows in a single pathway through the heart by opening and closing in a particular time sequence during the cardiac cycle and adequate flow is maintained at low- flow velocity and driving pressure because valves offer very little resistance (Figs 2.5 and 2.6). This type of flow is obtained by PW Doppler.
For estimation of mean flow, velocity needs to be multiplied by time to obtain velocity-time integral (VTI). VTI is also known as stroke distance.2 Stroke distance when multiplied by cross-sectional area (CSA), provides volume (Fig. 2.7).
VTI is used to estimate:
• Stroke volume (SV) and cardiac output
• Regurgitant volumes and regurgitant fractions
• Qp:Qs (ratio of left-to-right shunt or pulmonary blood flow to systemic flow ratio).
Qp:Qs is calculated after obtaining the right ventricular stroke volume [right ventricular outflow tract


(RVOT)-VTI x RVOT area], the left ventricular stroke volume [left ventricular outflow tract (LVOT)-VTI x LVOT area] and then getting their ratio. In subjects with no intracardiac shunts or valvular regurgitation, Qp = Qs. Absolute left-to-right shunt can be calculated by multiplying stroke volume difference by heart rate when the right ventricular stroke volume is definitely more than the left ventricular (LV) stroke volume.
Cardiac output (CO) is calculated as: CO = SV x heart rate (L/min).
Normal stroke volume is 45 ± 5 mL/M2. Low flow is labeled when stroke volume is < 35 mL/M2.
OHM'S LAW OF FLUIDS (THE HAGEN-POISEUILLE EQUATION)
the Ohm's law when applied to fluids suggests that Driving pressure (AP) = Flow (Q) x resistance (R)
In relating Ohm's law to fluid flow,3 the voltage difference is the pressure difference (AP; sometimes called driving pressure, perfusion pressure or pressure gradient). For the flow of blood in a chamber or across it, the AP is the pressure difference between any two points along a given length. There is a linear and proportionate relationship between flow and driving pressure. ttis linear relationship, however, is not followed when pathological conditions lead to turbulent flow because turbulence decreases the flow at any given driving pressure. Because flow and resistance are reciprocally related, an increase in resistance decreases flow at any given AP (Fig. 2.8). Also, at any given flow along a blood vessel or across a heart valve, an increase in resistance increases the AP.
the resistance (R) is the resistance to flow that is related in large part to the size of the valve opening or any other orifice.
Driving pressure or AP can be obtained in the heart using the modified Bernoulli's equation.4 Resistance is the ratio of pressure difference/flow (in Wood units or dynes.cm.s-5).
There is an approximate relationship between narrowed valve area and mean gradients (Figs 2.9 and 2.10).

THE BERNOULLI'S EQUATION
Doppler echocardiography takes advantage of the acceleration of flow across a restrictive orifice, and the relationship defined by the Bernoulli's equation between velocity and pressure, to assess gradients.
Increase in speed of fluid occurs simultaneously with a decrease in pressure or potential energy (convective flow), provided there are minimal frictional forces. Within a fluid flowing horizontally, the highest speed occurs where pressure is the lowest, and the lowest speed occurs where pressure is the highest (Fig. 2.11).
It is an approximate relation between pressure, velocity and elevation, and is valid in regions of steady, incompressible flow where net frictional forces are negligible. The Bernoulli's equation can not be applied to normal transvalvular flows because accelerative flow is more than the convective flow.
The Bernoulli's principle is derived from the principle of conservation of energy. This states that, in a steady flow, the sum of all forms of mechanical energy in a fluid along a streamline is the same at all points on that streamline. This requires that the sum of kinetic energy and potential energy remain constant. Thus, an increase in the speed of the fluid occurs proportionately with an increase in both its dynamic pressure and kinetic energy, and a decrease in its static pressure and potential energy (Fig. 2.12).
• Doppler echo measures blood-flow velocities, which can be converted to pressure gradients by the Bernoulli's equation.
• In most clinical situations, flow acceleration and viscous friction components of the equation can be ignored.
• Flow velocity proximal to a fixed orifice (v1) is much lower than the peak; so this can be ignored as well.
• Pressure gradient (AP) across a fixed orifice can then be calculated with the simplified Bernoulli's equation. Simplified Bernoulli's equation:
AP = 4v2
Caveats for the Bernoulli's Equation
• Proximal velocity may not be negligible.
• There may be multiple sites across the pathway of flow, where relationship of kinetic energy to potential energy changes.
• Frictional forces may not be negligible.
• Flow may not always be in streamlines.
• Accelerative forces may be significant depending upon the shape of the orifice through which the flow exits.
CONTINUITY EQUATION
One of the fundamental principles used in the analysis of uniform flow is known as the Continuity of Flow.5
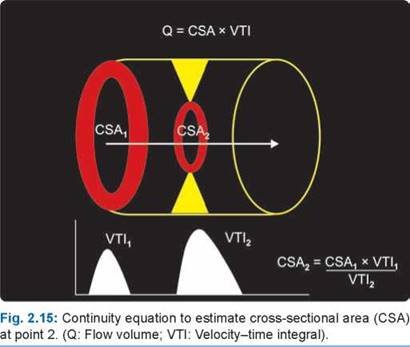
This principle is derived from the fact that mass is always conserved in fluid systems regardless of the pathway complexity or direction of flow.
If steady flow exists in a channel and the principle of conservation of mass is applied to the system, there exists a continuity of flow, defined as follows: the mean velocities at all cross sections having equal areas are then equal, and if the areas are not equal, the velocities are inversely proportional to the areas of the respective cross sections (Fig. 2.13).

thus, if the flow is constant in a reach of channel, the product of the area and velocity will be the same for any two cross sections within that reach. This is expressed in the continuity equation (Fig. 2.14).
If the velocities (or velocity-time integrals) at two points are estimated by the Doppler equation and area of one point is known, the area at the other point can be calculated by the equation of continuity (Fig. 2.15).
Continuity equation is most commonly used to estimate effective orifice area (EOA) in aortic valve stenosis. Although it is generally reliable, caveats exist.6-8
Doppler gradients can overestimate the severity of aortic stenosis in five circumstances, three of which involve errors in measurement.
• Contamination by mitral regurgitation signal
• Dynamic LV obstruction
• Use of angle correction
• High flow states
• Pressure recovery
Limitations of Continuity Equation
While the continuity principle is a fundamental principle of hydrodynamics, the available data for application in a given case have a number of error sources and limitations.
• Pre-stenotic CSA. For the LVOT, it is assumed that its shape is circular and its area can be calculated as nr2 or 0.785 x D2 (D is the diameter in the parasternal long-axis view and r is the radius or D/2).

This is not strictly true, since the outflow tract is in fact elliptical in cross-section, and the parasternal long-axis view shows neither the largest nor the smallest ellipse diameter (Fig. 2.16).
• Furthermore, the true outflow tract diameter is often underestimated if a tangential long-axis cut of the outflow tract is recorded, leading to underestimation of the diameter, radius and ultimately aortic valve area. This is generally regarded as the most important error source in the application of the continuity equation.
• A possible alternative to the full continuity equation, therefore, is the “velocity ratio" which is the ratio of peak velocities or velocity-time integrals in the outflow tract and across the stenosis.
• Pre-stenotic flow velocity and VTI. The flow field in the outflow tract, although laminar, is not homogeneous and blood flows faster at the septal (anterior) side than at the posterior side of the outflow tract (see Fig. 2.2).
• Moreover, velocities by Doppler are often recorded at an angle between flow direction and echo beam, leading to underestimation of velocities.
• Furthermore, in atrial fibrillation, different heart cycle lengths and different preceding heart cycles make it difficult to find equivalent heart cycles for the acquisition of peak velocities or velocity-time integrals in the outflow tract and across the stenotic valve.
• If the maximal velocity across the stenotic orifice is missed by CW Doppler, the continuity equation will produce erroneous results. The continuity equation, therefore, by no means can correct for a suboptimal Doppler interrogation of the aortic valve.
Viscous effects cause lower velocities at the edges of the vena contracta (VC) at low-flow rates, resulting in a parabolic profile. At higher-flow states, inertial forces overcome viscous drag, causing a flatter profile. Effective orifice area itself varies with flow rate as well, with the smallest areas seen at moderate-flow states. These flow- dependent factors lead to flow-rate-dependent errors in the Doppler continuity equation.
The continuity equation calculates an “effective” orifice area, which by definition is smaller than the “geometric” or “anatomic” orifice area (Fig. 2.17).
Effective orifice area (EOA) is determined using echocardiography, Doppler and the continuity equation, and is a reflection of the minimal CSA of the outflow jet (the vena contracta). EOA is calculated as the product of the CSA of the LV outflow tract (from its diameter, measured in the parasternal long-axis view) and the LV outflow tract velocity-time integral (using PW Doppler from an apical window), divided by the AV velocity-time integral (using CW Doppler [CWD] from an apical, right parasternal or suprasternal window). Unlike gradients, EOA provides an accurate assessment of stenosis severity independent of flow in most hemodynamic states.
The ratio between geometric orifice area (GOA) and EOA, the “coefficient of contraction”, is somewhat
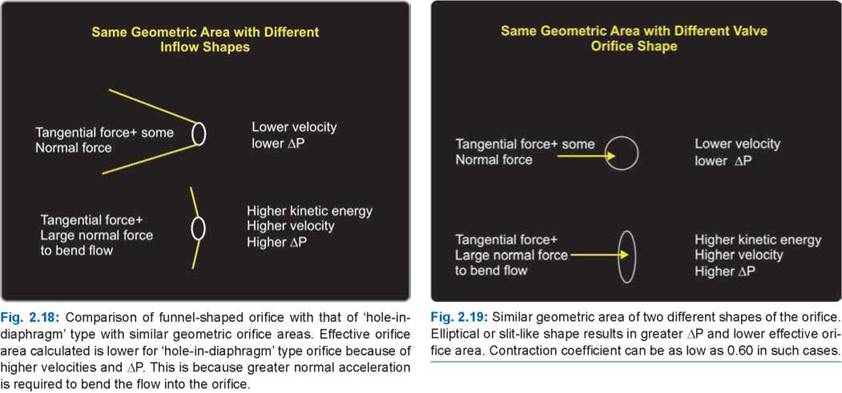

variable, depending on geometrical features (e.g. smooth or abrupt inlet, Figs 2.18 and 2.19) and also on flow rate, at least if the latter is low.9 Furthermore, since blood is a viscous fluid, inaccuracies arise from ignoring the boundary layer of the fluid in motion.
Eccentric jets exiting from a narrow orifice also have narrower VC and higher ДР (Fig. 2.20). ttis is because of the greater force required to bend the flow.
the EOA and the corresponding pressure gradients are deleteriously affected by increasing jet eccentricity. For the same anatomical size and flow rate, valve morphologies producing eccentric jets have greater energy losses than those that produce concentric jets.10
the distance from the VC to the site of pressure recovery also increases with jet eccentricity.10 Full pressure recovery only occurs when the jet fully expands to fill the aorta, that is, at the most distal reattachment site (Fig. 2.21).
It is the point in a fluid stream where the diameter of the stream is the least, and fluid velocity is at its maximum, such as in the case of a stream issuing out of a narrowed valve.11 the reason for this phenomenon is that fluid streamlines cannot abruptly change direction (Figs 2.22 and 2.23).
The converging streamlines follow a smooth path, which results in the narrowing of the jet (seen by Doppler color flow mapping).
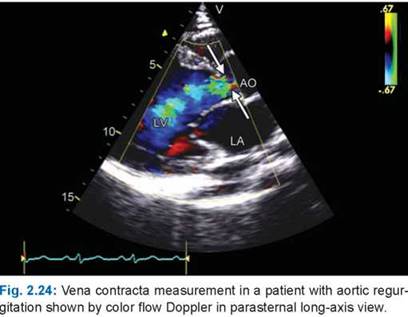
Measurement of the VC is useful as it describes the smallest area of the blood flow jet as it exits a valve. This corresponds to the EOA calculated for valves using the continuity equation (Figs 2.23 and 2.24).
Measurement of diameter of VC is useful in assessing the severity of valvular regurgitations. It is ideally measured in parasternal long-axis views for mitral and aortic regurgitation (AR).12 Regurgitation is mild if VC < 3 mm and it is severe if VC is > 6 mm.13
Even though the measurement of the VC is less dependent on technical factors, small errors in measurement can by multiplied due to the relatively small values of the VC width.

Beyond the VC, the fluid expands, and the velocity and pressure change once again. By measuring the difference in fluid pressure between the normal section and at the VC, the volumetric and mass flow rates can also be obtained from Bernoulli's equation.
It is preferable to use a zoom mode to optimize visualization of the VC and facilitate its measurement. The color flow sector should also be as narrow as possible, with the least depth, to maximize lateral and temporal resolution.
The largest diameter of a clearly defined VC is measured if possible in two orthogonal planes.
• Simple measure of orifice area
• Valuable in eccentric jets as well
• Not dependent on pulse repetitive frequency
• No correction for angle or convergence walls
• Not affected by other valve involvement
• If the orifice is fixed, then the size of the VC is independent of driving pressure and flow rate.
• Not affected by loading conditions.
• No temporal information
• May need biplane or triplane measurement to get it right in case of eccentric orifices
• Multiple jets are a problem
• Small errors can make a big difference

• In dynamic regurgitant orifice, vena contracta may change with hemodynamics or during the cardiac cycle.
• The convergence zone is flatter with higher aliasing velocities and become more elliptical with lower aliasing velocities. the aliasing velocity is set between 20 and 40 cm/s.
• Another limitation regards variation in the regurgitant orifice during the cardiac cycle. ttis is particularly important in mitral valve prolapse, where the regurgitation is often confined to the latter half of systole. The precise location of the regurgitant orifice can be difficult to judge, which may cause an error in the measurement of the proximal isovelocity surface area (PISA) radius.
Pressure recovery occurs because of re-expansion of flow downstream from the VC of the stenotic jet (Fig. 2.25). When blood moves through a narrow orifice, pressure or potential energy is converted to kinetic energy to drive flow across the orifice. Just beyond the orifice (beyond VC), the streamlines diverge to attach to the wall and reconvert some kinetic energy into pressure energy, resulting in greater pressure drop at the VC, which recovers to some extent as the jet expands fully. ttis difference in maximum pressure loss to net pressure loss is called pressure recovery (Fig. 2.26).
the pressure recovery phenomenon can be responsible for Doppler gradients that are substantially higher and valve area that is substantially lower than those determined invasively.
Key Points
• At the VC, velocity is a maximum and pressure is a minimum. Beyond VC, pressure recovers to some extent.
• Geometry and turbulence are factors that influence pressure recovery.
• Pressure recovery is reduced by turbulence in the flow field because turbulent dissipation represents irrecoverable energy “loss’!
• ttere is increased pressure recovery in patients with eccentric orifices, eccentric jets, certain types of bileaflet prostheses and when the receiving chamber is narrow.
• the recovered gradient more accurately reflects the energy “loss” across the valve and, therefore, the left ventricular workload produced by the stenosis.
• Pressure recovery phenomenon can explain high gradients in seemingly normal prosthetic valves (Fig. 2.27) and certain native orificial narrowings (Figs 2.28 and 2.29).
Clinical significance of pressure recovery phenomenon is more in patients with mild or moderate aortic stenosis, who show very high transaortic gradients due to pressure recovery. In these patients, energy loss index can be estimated by measuring aortic diameter (and hence area) at sinotubular junction and using it along with valve area calculated by the continuity equation (Fig. 2.30).

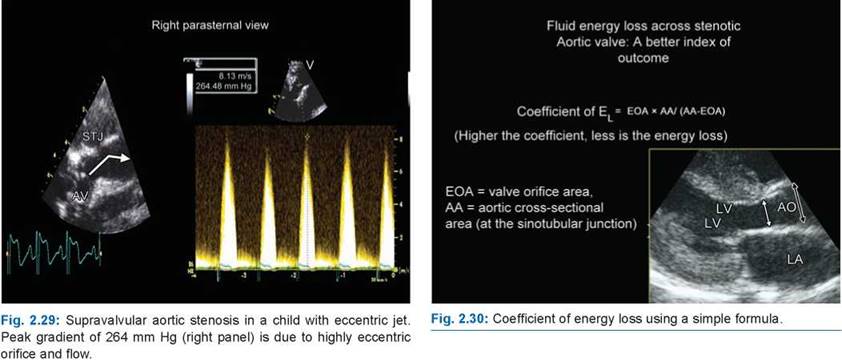
An energy loss index of < 0.5 cm2/M2 indicates severe stenosis.14
This Doppler hemodynamic index applies to aortic valve stenosis. It is used to obtain information about the hemodynamic load created by a narrowed orifice. It is a ratio of cuff systolic blood pressure + mean gradient divided by stroke volume index. A ratio > 4.5 to 5.0 suggests higher hemodynamic burden and bad prognosis.15
PROXIMAL ISOVELOCITY SURFACE AREA AND VOLUMETRIC MEASUREMENTS * * •
Proximal isovelocity surface area is a Doppler phenomenon to estimate orifice area.1618
• The PISA method is derived from the hydrodynamic principle, which states that as blood approaches a narrow orifice, its velocity increases forming concentric, roughly hemispheric shells of increasing velocity and decreasing surface area (Fig. 2.31).

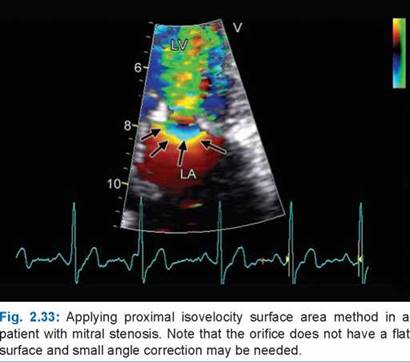
• Color flow mapping offers the ability to image one of these hemispheres that corresponds to the Nyquist limit of the instrument (Figs 2.32 and 2.33).
• If a Nyquist limit can be chosen at which the flow convergence has a hemispheric shape, flow rate (mL/s) through the orifice is calculated as the product of the surface area of the hemisphere (2nR2 or 6.28 x radius2) and the aliasing velocity (Va) as 2nR2 x Va.
• Assuming that the maximal PISA radius occurs at the time of peak flow and peak velocity, the maximal EOA is derived as: EOA = (6.28R2 x Va)/V , where V is the peak velocity of the jet by CWD.
• the transiting volume/beat can be estimated as EOA multiplied by the velocity-time integral of the jet. Since the PISA calculation provides an instantaneous peak flow rate, EOA by this approach is the maximal EOA and may be slightly larger than EOA calculated by other methods. If it is a regurgitant jet, EOA represents regurgitant orifice area.
• Measurement of PISA by color flow mapping requires adjustment of the aliasing velocity such that a well- defined hemisphere is shown. This is generally done by shifting the baseline toward the direction of flow or by lowering the Nyquist limit, or both.
• If the base of the hemisphere is not a flat surface (180°), then correction for wall constraint should be performed, multiplying by the ratio of the angle formed by the walls adjacent to the regurgitant orifice and 180° (Fig. 2.33).
• It is more accurate for central jets than for eccentric jets.
• the formula is applicable to a circular orifice. However, in real life, the orifices are more often elliptical or irregular (Figs 2.34 and 2.35).
• If the image resolution allows the flow convergence to be seen well (using zoom mode), and a Nyquist limit can be chosen at which the flow convergence has a hemispheric shape, it is easy to identify the aliasing line of the hemisphere. However, it can be difficult to judge the precise location of the orifice and the flow convergence shape.


• Any error introduced is squared, which can markedly affect the resulting flow rate and ERO.
• In patients with normal blood pressure and mitral regurgitation, a simplified formula can be used if aliasing velocity is brought to 40 cm/s by shifting the baseline.19 the formula gives ERO or regurgitant orifice area by R2/2, where R is the radius of the hemisphere (Fig. 2.36).
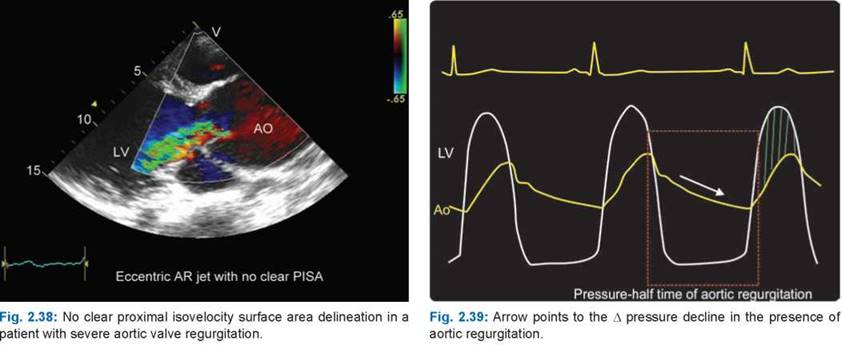
PISA method is much easier to apply in transesophageal echocardiography images than in transthoracic images (Fig. 2.37). Scroll function must be used to define a cardiac cycle, wherein PISA is seen the best. In about 10% of the cases, PISA can not be defined although VC can be easily measured (Fig. 2.38).
An ERO > 30 mm2 (> 40 mm2 for mitral) or regurgitant volume > 60 mL indicates severe mitral or aortic regurgitation.
Across any narrow orifice through which blood flows driven by the perfusion pressure, the AP declines slowly (Fig. 2.39).
Pressure half-time (PHT) is defined as the time needed for the peak transvalvular pressure gradient to fall to its half value, in milliseconds. According to the Bernoulli's equation, when pressure is halved, velocity is equal to peak transvalvular velocity divided by the square root of 2.20
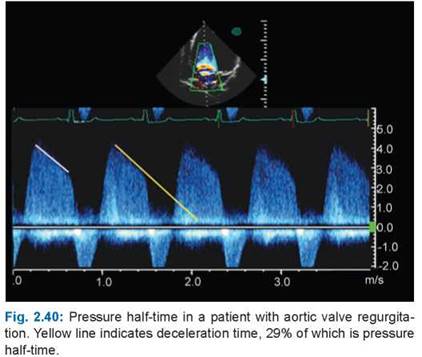
Thus, PHT is the time for the peak velocity to reach 0.707 of its initial value (Fig. 2.40). The faster the gradient falls, the easier the passage of blood through a valve, and vice versa. Thus, high transvalvular PHT indicates a narrowed valve area, while low PHT indicates a wide valve area.
Original studies of PHT, initially using catheterization and then Doppler data, were performed in 1968 and showed a good correlation between atrioventricular PHT and effective mitral valve area, relatively insensitive to changes in heart rate or cardiac output.21 PHT is always proportionally related to deceleration time (DT).
PHT = 0.29 x DT
PHT is usually obtained from transmitral and transaortic or transpulmonary valve CWD signals to assess the severity of mitral valve stenosis and aortic/pulmonary valve regurgitation.22
The decline of the velocity of diastolic transmitral blood flow is inversely proportional to mitral valve area (MVA), and MVA is derived using the empirical formula23 MVA (cm2) = 220/ PHT in milliseconds PHT is calculated automatically by tracing the deceleration slope of the E-wave of transmitral flow, obtained with CWD echocardiography. In patients with atrial fibrillation, PHT is best measured from a recording with an adequate diastolic filling period or averaging different cardiac cycles (Figs 2.41 and 2.42).
If the deceleration slope is bimodal (rapid initial decline in early diastole followed by slower fall in middiastole), the second (mid-diastolic) slope should be used.
Limitations of Pressure Half-Time in Mitral Stenosis
1. PHT depends not only on EOA but also net atrioventricular compliance. Reduced LV compliance (as in aortic stenosis or aortic regurgitation) can shorten PHT even in the presence of severe mitral stenosis (Fig. 2.43).
Net left-sided atrioventricular compliance can be obtained by a formula using EOA by the continuity equation and the mitral deceleration slope as shown in Figure 2.43.


Sometimes in long-standing mitral stenosis, net left atrioventricular compliance increases due to enlarged left atrium, resulting in longer PHT even in the presence of mild mitral stenosis* 2 3 4 5 (Fig. 2.44).
2. PHT can not be obtained accurately in the presence of faster heart rates.
3. PHT method is not valid immediately after percutaneous mitral valvotomy.
4. PHT method can not be applied to prosthetic mitral valves.
the rate of deceleration of the diastolic regurgitant jet and the derived PHT reflect both the degree of regurgitation and the ventricular diastolic pressure. As the degree of AR increases, the aortic diastolic pressure decreases and the LV end-diastolic pressure increases. the late diastolic jet velocity is thus reduced and the PHT, shortened. A PHT of < 200 milliseconds is consistent with severe AR, whereas a value of > 500 milliseconds suggests mild AR (Figs 2.45 and 2.46). ttese cut-off values can also be used in case of prosthetic aortic valve regurgitation.22


the PHT is influenced by chamber compliance in addition to chamber pressures. For a given severity of AR, PHT is shortened with increasing left ventricular diastolic pressure, vasodilator therapy and in patients with a dilated compliant aorta, or increased in chronic AR. Thus, this parameter serves only as a complementary finding for the assessment of AR severity.
Pulmonary Regurgitation
Pulmonary PHT < 100 milliseconds is a good indicator of hemodynamically significant regurgitation (Fig. 2.47). ttis measure is highly reproducible and easily accessible.24
Tricuspid Stenosis
Although there are similarities between mitral and tricuspid stenosis, the PHT method has not been as extensively validated for the calculation of tricuspid valve area. However, as a general rule, a PHT > 190 milliseconds is frequently associated with significant stenosis.
LV PP/PT
This is an index that is used clinically to characterize the contractile ability of the heart. It is believed that maximum dP/dt is a reasonable index of the initial velocity of myocardial contraction.24 The maximum left ventricular dP/dt, which is normally about 1,600 mm Hg/s, tends to be < 1,200 mm Hg/s in patients with disorders of the left ventricular myocardium. It is obtained from CW signal of MR. dP/dt is 32/time taken by velocity to decrease from one m/s to 3 m/s (Fig. 2.48).
ESTIMATION OF PULMONARY ARTERY PRESSURES ANP PULMONARY VASCULAR RESISTANCE
The tricuspid regurgitant jet is generally used to estimate RV systolic pressure via the Bernoulli's equation (4v2, where v is the maximum velocity of the tricuspid valve regurgitant jet25-27 (Figs 2.49 and 2.50). An estimated right atrial pressure (based on collapsibility of the inferior vena cava best visualized in the subcostal window) is added to the peak systolic pressure gradient of the tricuspid regurgitant flow to obtain RV systolic pressure [which approximates pulmonary artery (PA) systolic pressure in the absence of pulmonary valve stenosis and RV outflow tract obstruction].


Although mean PAP can be estimated by measuring the early diastolic velocity of the pulmonary insufficiency jet, the correlation with invasive measures is weak because of difficulty in accurately visualizing the velocity regurgitant profile at the pulmonary valve.
• TR velocity reflects systolic pressure difference between RV and RA (Figs 2.49 and 2.50).
4 peak TR velocity2 = RVSP - RA RVSP = 4 peak TR velocity2 + RA
• In the absence of RVOT obstruction, RVSP = PASP.
• Doppler measurement by CW closely approximates pressures measured by simultaneous RA and RV pressure tracings.
There is a close negative correlation between invasive pulmonary vascular resistance (PVR) and VTI of the RV outflow. Similarly, there is a positive correlation between peak gradient of the TR velocity and the pulmonary vascular resistance.28 A ratio of TR AP/RVOTyTI is a noninvasive index of PVR (in Wood units). Others have suggested a ratio of TR velocitymax/RVOTVTI as a reliable measure of PVR (divide by 10 to get approximate Wood units, velocity in cm/s). The index has high sensitivity but relatively modest specificity.29,30
Of the echocardiographic methods used to assess PVR, equations using the ratio TR velocitymax/RVOTVTI remain the simplest and the most widely used.
• This ratio does not work effectively at very high PVR.
• Specificity is low.
• Instead of RVOTvti, LVOTvti can be used with similar predictability.
• Another index of systolic PA pressure/(HR x (RVOTvti) provides useful estimations of PVR.
• An acceleration time (AT) of pulmonary flow Doppler spectrum < 80 msec has been used as an index of high PVR (> 3 Wood units) (Fig. 2.51).
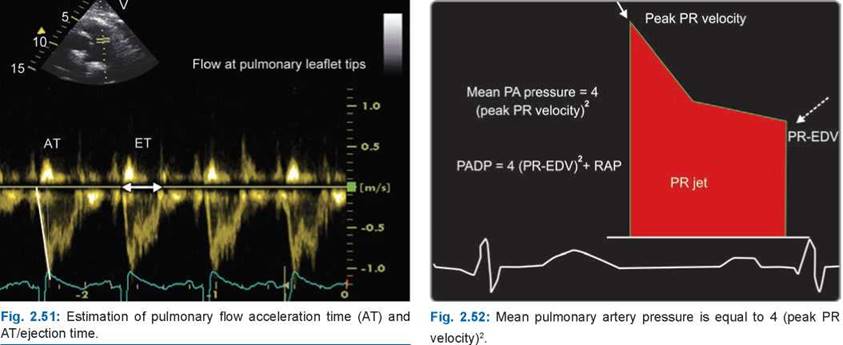
the sensitivity and specificity of PA AT and AT/ejection time for detecting right ventricular systolic pressure > 2 SD above normal are high.25,31
• Right atrial pressure can be estimated either from inferior vena cava size and its respiratory variation or by right heart E/e.
• Doppler assessment of PA pressures may be unfeasible or may lead to overestimation or underestimation of pulmonary pressures in up to 40% of individual patients.
• Correlations between the spectral Doppler measures of right ventricular outflow systolic time intervals and invasively measured pulmonary artery pressures appear to be at least as strong as those between TR velocities and invasively measured pulmonary pressures.
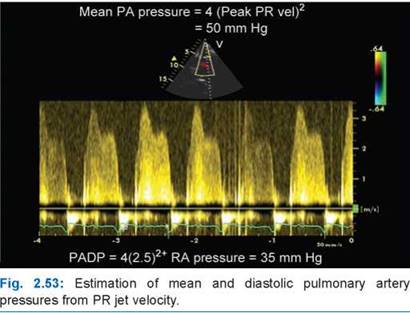
Estimating Mean Pulmonary Artery Pressure (Figs 2.52 and 2.53)
• Mean gradient method (adding the right ventricular- right atrial mean systolic gradient to the right atrial pressure)
• Chemla equation (0.61 x systolic PA pressure + 2 mm Hg) Syyed equation (0.65 x systolic PA pressure + 0.55 mm Hg) Masuyama method (4 x PR peak velocity2)
ttere are conflicting data about reliability of correlation between RV systolic pressure estimated by Doppler echocardiography and pulmonary pressures measured via right heart catheterization. When PA pressures are estimated via echocardiography, they more often are higher than the pressures measured directly by catheterization, and although it is clear that Doppler echocardiography cannot be recommended at this time for use as the gold standard for diagnosis of pulmonary hypertension, it remains an excellent screening modality.
1. Oh JK. Echocardiography as a noninvasive Swan-Ganz catheter. Circulation. 2005;111:3192-4.
2. Quinones MA, Otto CM, Stoddard M, Waggoner A, Zoghbi WA; Doppler Quantification Task Force of the Nomenclature and Standards Committee of the American Society of Echocardiography. Recommendations for quantification of Doppler echocardiography: a report from the Doppler Quantification Task Force of the Nomenclature and Standards Committee of the American Society of Echocardiography. J Am Soc Echocardiogr. 2002;15(2):167-84.
3. Pfitzner J. Poiseuille and his law. Anaesthesia. 1976;31(2): 273-5.
4. Baumann R, Schwaneberg R. Interpretation of Bernoulli's Equation. the Physics Teacher 1994;32:478-88.
5. Flachskampf FA, Weyman AE, Guerrero JL, et al. Influence of orifice geometry and flow rate on effective valve area: an in vitro study. J Am Coll Cardiol. 1990;15(5):1173-80.
6. VanAuker MD, Hla A, Meisner JS, et al. Simultaneous Dop- pler/catheter measurements of pressure gradients in aortic valve disease: a correction to the Bernoulli equation based on velocity decay in the stenotic jet. J Heart Valve Dis. 2000;9(2):291-8.
7. Baumgartner H, Schima H, Tulzer G, et al. Effect of stenosis geometry on the Doppler-catheter gradient relation in vitro: a manifestation of pressure recovery. J Am Coll Cardiol. 1993;21(4):1018-25.
8. Niederberger J, Schima H, Maurer G, et al. Importance of pressure recovery for the assessment of aortic stenosis by Doppler ultrasound. Role of aortic size, aortic valve area, and direction of the stenotic jet in vitro. Circulation. 1996;94(8):1934-40.
9. Kadem L, Rieu R, Dumesnil JG, et al. Flow-dependent changes in Doppler-derived aortic valve effective orifice area are real and not due to artifact. J Am Coll Cardiol. 2006;47(1):131-7.
10. VanAuker MD, Chandra M, Shirani J, et al. Jet eccentricity: a misleading source of agreement between Doppler/catheter pressure gradients in aortic stenosis. J Am Soc Echocardi- ogr. 2001;14(9):853-62.
11. Quere JP, Tribouilloy C, Enriquez-Sarano M. Vena contracta width measurement: theoretic basis and usefulness in the assessment of valvular regurgitation severity. Curr Cardiol Rep. 2003;5(2):110-5.
12. Hall SA, Brickner ME, Willett DL, et al. Assessment of mitral regurgitation severity by Doppler color flow mapping of the vena contracta. Circulation. 1997;95(3):636-42.
13. Zoghbi WA, Enriquez-Sarano M, Foster E, et al.; American Society of Echocardiography. Recommendations for evaluation of the severity of native valvular regurgitation with two-dimensional and Doppler echocardiography. J Am Soc Echocardiogr. 2003;16(7):777-802.
14. Garcia D, Pibarot P, Dumesnil JG, et al. Assessment of aortic valve stenosis severity: A new index based on the energy loss concept. Circulation. 2000;101(7):765-71.
15. Hachicha Z, Dumesnil JG, Pibarot P. Usefulness of the valvu- loarterial impedance to predict adverse outcome in asymptomatic aortic stenosis. J Am Coll Cardiol. 2009;54(11): 1003-11.
16. Enriquez-Sarano M, Miller FA Jr, Hayes SN, et al. Effective mitral regurgitant orifice area: clinical use and pitfalls of the proximal isovelocity surface area method. J Am Coll Cardiol. 1995;25(3):703-9.
17. Utsonomiya T, Ogawa T, Doshi R, et al. Doppler color flow “proximal isovelocity surface area" method for estimating volume flow rate: effects of orifice shape and machine factors. J Am Coll Cardiol. 1991;17(5):1103-11.
18. Schwammenthal E, Chen C, Benning F, et al. Dynamics of mitral regurgitant flow and orifice area. Physiologic application of the proximal flow convergence method: clinical data and experimetal testing. Circulation. 1994; 90(1): 307-22.
19. Zoghbi WA, Enriquez-Sarano M, Foster E, et al.; American Society of Echocardiography. Recommendations for evaluation of the severity of native valvular regurgitation with two-dimensional and Doppler echocardiography. J Am Soc Echocardiogr. 2003;16(7):777-802.
20. Thomas JD, Weyman AE. Doppler mitral pressure halftime: a clinical tool in search of theoretical justification. J Am Coll Cardiol. 1987;10(4):923-9.
21. Libanoff AJ, Rodbard S. Atrioventricular pressure half-time. Measure of mitral valve orifice area. Circulation. 1968;38(1): 144-50.
22. Lancellotti P, Tribouilloy C, Hagendorff A, et al.; European Association of Echocardiography. European Association of Echocardiography recommendations for the assessment of valvular regurgitation. Part 1: aortic and pulmonary regurgitation (native valve disease). Eur J Echocardiogr. 2010; 11(3):223-44.
23. Baumgartner H, Hung J, Bermejo J, et al.; EAE/ASE. Echo- cardiographic assessment of valve stenosis: EAE/ASE recommendations for clinical practice. Eur J Echocardiogr. 2009;10(1):1-25.
24. Chung N, Nishimura RA, Holmes DR Jr, Tajik AJ. Measurement of left ventricular dp/dt by simultaneous Doppler echocardiography and cardiac catheterization. J Am Soc Echocardiogr. 1992;5(2):147-52.
25. Rudski LG, Lai WW, Afilalo J, et al. Guidelines for the echo- cardiographic assessment of the right heart in adults: a report from the American Society of Echocardiography endorsed by the European Association of Echocardiography, a registered branch of the European Society of Cardiology, and the Canadian Society of Echocardiography. J Am Soc Echocardiogr. 2010;23(7):685-713; quiz 786.
26. Currie PJ, Seward JB, Chan KL, et al. Continuous wave Doppler determination of right ventricular pressure: a simultaneous Doppler-catheterization study in 127 patients. J Am Coll Cardiol. 1985;6(4):750-6.
27. Berger M, Haimowitz A, Van Tosh A, et al. Quantitative assessment of pulmonary hypertension in patients with tricuspid regurgitation using continuous wave Doppler ultrasound. J Am Coll Cardiol. 1985;6(2):359-65.
28. Abbas AE, Fortuin FD, Schiller NB, et al. A simple method for noninvasive estimation of pulmonary vascular resistance. J Am Coll Cardiol. 2003;41(6):1021-7.
29. Haddad F, Zamanian R, Beraud AS, et al. A novel non-invasive method of estimating pulmonary vascular resistance in patients with pulmonary arterial hypertension. J Am Soc Echocardiogr. 2009;22(5):523-9.
30. Nakatani S, Kyotani S, Kanzaki H, et al. Noninvasive estimation of pulmonary vascular resistance by Doppler echocardiography in patients with pulmonary arterial hypertension. Am J cardiol. 2009;103:872-6.
31. Tossavainen E, Soderberg S, Gronlund C, et al. Pulmonary artery acceleration time in identifying pulmonary hypertension patients with raised pulmonary vascular resistance. Eur Heart J Cardiovasc Imaging. 2013;14(9):890-7.