INTRODUCTION
Objective quantification of the heart muscle segmental function is needed in clinical and preclinical arena. Heart muscle is arranged as a syncytium with viscoelastic character and changes its size and shape with every phase of cardiac cycle. It is incompressible and has a definite architecture. It is an almost synchronous generator of bidirectional force for suction and ejection. Cohesive and sequential integration of motion and deformation optimizes filling and ejection, the two of its fundamental functions. To some extent, it follows the laws governing material deformation. The deformation parameters can be assessed by echocardiography and can be applied to clinical conditions to get information, which is otherwise not available from images and intracardiac flow. Myocardial deformation is the complex resultant of intrinsic contractile forces and extrinsic loading forces applied to tissue with varying elastic properties. Deformation parameters provide incremental and unique information of the heart muscle. There is a progressively greater use of these data in clinical practice, although a lot still needs to be learned. Detection of subclinical systolic and/or diastolic dysfunction has significant use in clinical medicine. The areas inwhich deformation imagingis finding utility include heart failure, systolic and diastolic function, stress echocardiography, myocardial fibrosis, viability, ischemia, intraventricular dyssynchrony, monitoring cardiotoxic drug therapy, heart transplant rejection, and so on. The understanding of architecture (form) and its
deformation (function) provides important insights into pathogenesis, therapy and prognosis. Its superiority over tissue Doppler imaging (TDI) lies in providing functional information in multidimensional format without angle- dependency. Although not yet sufficiently proven for routine clinical use, two-dimensional/three-dimensional (2D/3D) strain methods offer the long-term potential for more complete, accurate and reproducible assessment of myocardial function.
MYOCARDIAL DEFORMATION
Sarcomere is the fundamental unit of contraction in the heart muscle. Each sarcomere is attached to at least 15 other sarcomeres. Following electromechanical activation, the myocardium deforms during systole due to sarcomere shortening.1 Sarcomeric unidirectional shortening results in multidirectional change in size and shape of the tissue and this is called myocardial deformation (Fig. 14.1).
• With the onset of systole, there is sarcomere shortening resulting in reduction of intracavitary size and myocardium deformation2 (Fig. 14.2).
• Since the myocardial tissue is almost incompressible, the volume of ventricular wall and the myocardial mass remain constant in every phase of cardiac cycle.
• The deformation occurs in three dimensions that are expressed along three ventricular coordinates: a longitudinal and circumferential shortening and a radial thickening (Figs 14.3 to 14.6) (Table 14.1).

Fig. 14.1: Diagram showing a sarcomere, which is a unit of contraction.

Fig. 14.2: Graphical description of deformation (strain). Strain is spatial derivation of displacement.

Fig. 14.3: Depiction of three co-ordinates of deformation. Deformation in three different planes occurring simultaneously are X-Xo/X, Y-Yo/Y and Z-ZO/Z.

Fig. 14.4: Graphic diagram showing a single myofiber and its length during diastole (L) and at end-systole (L0). Percentage longitudinal shortening is strain and rate of shortening is strain rate.
The ventricular myocardium simultaneously shortens in the longitudinal and circumferential planes and thickens in the radial plane, with reciprocal changes in diastole.
• the fourth form of deformation is rotation, which is the angular motion at two ends of the ventricle and the difference between the two, is twist or torsion. Rotation or torsion are indicators of shear strain (Figs 14.7A and B).
• the deformation is calculated based on the relative change of the length of myocardial fibers during cardiac cycle3,4 and is expressed in a unidimensional parameter termed strain (e) (Figs 14.8A and B).
The local end-systolic strain value reflects the regional ejection fraction (EF) and the global left ventricle (LV) end-systolic strain reflects the overall systolic function3 (Fig. 14.9).
The cardiac deformation can also be represented graphically with high temporal resolution when obtained by Doppler method (Fig. 14.10). S-wave represents the negative deflection occurring during systole with the peak negative deflection representing maximal longitudinal myocardial shortening (or peak systolic strain). With the start of diastole, the myocardial fibers start regaining their original length. Graphically, it is represented in three phases:

Fig. 14.5: Graphical description of myofiber width (short-axis diameter) during diastole (R) and during end-systole (R0). Radial strain is the percentage increase in width.

Fig. 14.6: Simultaneous graphical depiction of three vectors of the heart muscle motion.
(R: Radial; C: Circumferential; L: Longitudinal).


(1) the early, or rapid filling phase (E-wave) followed by (2) a plateau phase, or diastasis and finally (3) atrial filling (A-wave).
• The speed at which the myocardial deformation occurs is the strain rate (SR) and is expressed as unit/s. SR depicts the change in strain over a period of time3-4 (Fig. 14.10).
• Two-dimensional strain imaging requires high quality gray-scale images5 with frame rate exceeding 50 frames/s (usually 50-100 frames/s). Doppler- derived deformation has much greater temporal resolution because of imaging at about 200 frames/s.6
• To obviate through plane motion, 3D strain estimation has been developed for which the minimum frame rate is 25 frames/s.7 Multibeat acquisition is the preferred way to achieve these frame rates.
• Deformation parameters can be estimated by multiple methods (Table 14.2). But fundamental knowledge is method-independent.
• Deformation during active contraction is an interaction between contractility (developed force) and the load. Deformation is not a measure of pure contractility.8
• Active contraction occurs only during very early part of systole, but deformation keeps occurring throughout systole and a little beyond.3
• The strain and SR subtracts motion due to the effects of neighboring segments.
• Strain and its rate values are deformation per length and do not need to be corrected for heart size.9
• Deformation parameters depict volume changes of the pressure-volume loop and hence do not provide complete information about the cardiac function.
• Strain in three dimensions is interrelated, so strain in one direction is representative of regional deformation in more than one direction.10
• Two basic facts to be remembered are: apex is stationary and the outer boundary of the heart is unchangeable (constant). Action is at the base and within the walls and the boundary is invariate (the heart has constant volume and outer boundary (Fig. 14.11).
• Isometric function can not be defined by deformation parameters. However, isometric strain wave-forms have clinical applications.
• Peak velocity and SR are early-systolic measures, and more closely related to contractility (dP/dt) during active contraction, while displacement and strain

Figs 14.7A and B: Myocardial twist. During systole, base rotates clockwise, while the apex rotates counterclockwise when viewed from the apex.

Figs 14.8A and B: Arrangement of myocardial fibers in systole (A) and in diastole (B). The muscle fibers descend longitudinally from the base in the subendocardium and make a figure of ‘8' near the apex before starting the ascent subepicardially (helical configuration).

Fig. 14.9: Longitudinal strain of the basal and midanterior interventricular septum by speckle tracking method (two-dimensional strain) in a subject with anterior myocardial infarction. There is hardly any strain during systole, but there is post-systolic strain (shortening).

Fig. 14.10: Strain rate over a fixed segment derived from tissue Doppler method. Lower panel shows various waveforms at a frame rate of approximately 200/s.

Fig. 14.11: Depiction of the cavity without walls in diastole and systole. It is the cavity that gets smaller in systole without any change in outer contour (not shown). As the outer contour is constant, longitudinal shortening is coupled with radial thickening and circumferential shortening.

Fig. 14.12: Diagram showing peaks of strain rate and longitudinal strain with regard to aortic valve closure (AVC). Note early peaking of strain rate.
are end-systolic measures related to the total stroke volume and EF.
• Normal myocardium shows the highest SR in the first third of the ejection period, whereas the maximal deformation mostly occurs at aortic valve closure (AVC) (Fig. 14.12).
• Deformation: It is the change in the metric properties of a continuous body. If after a displacement of the continuum, there is a relative displacement between particles, a deformation has occurred.
• Elasticity: It describes materials that return to their resting shape after the force is removed.
• Viscoelastic: A viscoclastic material can be simply modeled as an elastic component coupled with a viscous component, which acts as a damper that delays the stress-strain response (time-dependent stress-strain relationship). The healthy myocardium has viscoelasticity (hysteresis on contraction and relaxation).
• Strain: Strain is a normalized measure of deformation representing the displacement between particles in the body relative to a reference length. Strain is dimensionless and is usually expressed as a decimal fraction, a percentage or in parts per notation. Strain measures how much a given deformation differs locally from a rigid body deformation. Thus, strain is a tensor quantity (Fig. 14.2).
• Meaning of strain: Tissue strain is a surrogate for tissue stiffness. Low tissue strain corresponds to high tissue stiffness and vice versa. Tissue stiffness corresponds to ischemia, fibrosis, muscle fiber disarray, infiltration, and so on.
• Components of strain: the amount of stretch or compression along line elements or fibers is the normal strain, and the amount of distortion associated with the sliding of plane layers over each other is the shear strain (Fig. 14.13), within a deforming body (Table 14.3). Area Strain is the combined


Fig. 14.13: Diagram showing complex motion of a natural acoustic reflector in different planes during a single cardiac cycle. Length and direction of the arrow denotes the quantum of displacement. It is tracked by sum-of-absolute differences algorithm.

Fig. 14.14: Circumferential-radial shear strain at the apex. Note that this shear strain is greater at the subepicardial region compared to subendocardial region leading to apical counterclockwise rotation. Right panel: angle represents the shear strain.
longitudinal-circumferential normal strain in a given area and measured by 3D imaging.
Intramural displacement of a natural tissue reflector ('speckle' or a group of 30-40 pixels called kernel) located in an area of interest on a gray-scale image is measured using a phase-sensitive correlation-based speckle tracking approach (Figs 14.14 to 14.16). It is also called 2D strain imaging. Essentially, it is automatic tracking of interference patterns from conventional gray-scale B-mode images during the cardiac cycle.11
• Typical global longitudinal strain of the LV is -15% to -25% (Table 14.4). This is based upon the assumption that normal mitral annulus systolic excursion is 11-20 mm and the normal length of the base-to-apex LV is 8-9.5 cm.
• Longitudinal strain increases from base to apex in proportion to the wall stress (Figs 14.16 and 14.17). However, this is not a consistent or universally resolved fact.
• Abnormality of the longitudinal strain is the earliest sign of myocardial disease including ischemia.12
• Differences in wall stress due to differing wall curvatures between longitudinal, radial and circumferential axes (by Laplace Law) may possibly explain the more frequently observed abnormal systolic longitudinal strain.
• The high sensitivity of longitudinal strain to detect functional impairment due to subtle ischemia or early dysfunction could be also explained by the predominant longitudinal orientation of subendocardial fibers, which are more susceptible to ischemia.
• Longitudinal strain decreases with age, with increasing wall thickness and obesity.13 Strain is relatively independent of maturational changes, lending it as a tool for cardiac evaluation across differing ages in pediatric subjects.

Fig. 14.15: Longitudinal strain estimation in apical four-chamber view by acoustic speckle tracking in a normal control. Longitudinal strain of the speckles within the region of interest (outlined) is depicted as an average of six segments (-30%).

Fig. 14.16: Two-dimensional longitudinal strain in a modified apical long axis. Note base-to-apex gradient of the anterior septum (-18, -31, -41) and the posterior wall (-21, -25, -37).
• Speckle-derived strain values are lower than those derived by the Doppler method, because the latter has higher temporal resolution. It is also possible because there is greater noise in tissue Doppler method near the peak values.
• In early stage of disease, radial function acts as a compensatory phenomenon to the decrease in longitudinal deformation to maintain a normal LVEF. Therefore, reduced global longitudinal strain with normal EF is a subtle sign of dysfunction.
• Different tracking algorithms potentially produce different results. Inter-vendor differences could be significant.14-17 ttis is the major limitation for prime time use.
Circumferential and radial strains represent orthogonal strains of the myocardium and are obtained from short- axis images (Fig. 14.18). ttese are affected late in a disease process when the latter becomes transmural. ttree principal strains are interrelated and convey similar information about volume deformation.18
• Circumferential strain does not reflect circumferential fiber contraction. There would be circumferential shortening even without circumferential fibers.
• Circumferential strain is mainly the inward movement of midwall circumference as the wall thickens (Fig. 14.19).
• The regional circumferential strain may be affected in different ways, depending on the degree of transmural involvement. Subendocardial infarct affects the midwall circumferential fibers to a very small extent, if any, with little or no effect on circumferential force.
• Endocardial circumferential shortening is greater than midwall circumferential shortening, which is greater than epicardial circumferential shortening. Mean circumferential strain must be taken to mean midwall circumferential shortening.
• Circumferential function plays a pivotal role in maintaining LV structure and tensile strength.
• Subepicardial organization of collagen structure seems to differ from that in the midwall and subendocardial regions accounting for the transmural strain gradients.
• Circumferential-longitudinal shear, also known as torsion, has been shown to depend strongly on the transmural variation of the helix angle.
• In patients with early systolic dysfunction or heart failure with normal EF, longitudinal strain is reduced, while circumferential strain remains normal or gets enhanced.
Radial Strain (Transmural Strain)
Radial strain means wall thickening, but there are no myocardial fibers going in the radial direction (Fig. 14.20). Wall thickening is a function ofwall shortening to maintain normal muscle volume, as the heart muscle is incompressible. Increased 'radial function' (meaning wall thickening) as compensation for decreased longitudinal

Fig. 14.17: Right ventricular longitudinal strain by acoustic speckle tracking within the region of interest in apical four-chamber view in a normal person. Note that the right ventricle free wall has greater longitudinal strain compared to the interventricular septum.

Fig. 14.18: Vectors of orthogonal strains in short-axis direction.
function actually does not exist, it seems to be a theoretical impossibility.
Clinically, radial strain (time-to-peak strain) has been used to detect intraventricular dyssynchrony19 (Fig. 14.21).
velocity vector imaging
Velocity vector imaging (VVI) is an echocardiographic method that is based on speckle tracking.17 In gray-scale images, interference by backscattered ultrasound from neighboring structures results in a random, speckled pattern. ttis gives each small area a unique pattern that remains relatively constant from one frame to the next. With the optimized pattern-matching algorithm, VVI can accurately track these speckles frame by frame, and by reconstructing the deformation and motion, the motion of

Fig. 14.19: Short-axis view is used to extract circumferential strain, which like longitudinal strain is normally negative and nearly of the same value. Fixed reference point is kept in the center of the cavity from where relative shortening and lengthening in circumferential axis are measured.

Fig. 14.20: Short axis at various levels is used to extract radial strain, which normally is a positive quantity in systole (thickening) with reference point at the center of the cavity.

Fig. 14.21: Left panel shows radial strain waveforms in a patient with heart failure but no intraventricular dyssynchrony. Right panel shows marked dispersion in time-to-peak radial strain indicating presence of intraventricular dyssynchrony. An anteroposterior segmental peak radial strain delay > 130 milliseconds is suggestive of significant intraventricular dyssynchrony.19

Fig. 14.22: Longitudinal strain estimation in four-chamber view by velocity vector imaging. In early systole, different velocity vectors are depicted.
flow and tissue can be analyzed. VVI is more precise, selfupdating, faster and gives simultaneous information about regional and global EF. The algorithm works as follows:
• For each pixel in the image, angle-independent velocity estimation is performed by selecting a search pattern around that pixel in one frame and looking for a matching pattern in a search region around that pixel of the following frame.
• The search pattern is placed at different positions in the search region, and the similarity is measured for the overlapping area.
• The position where the highest similarity is found determines the in-plane frame-to-frame displacement relative to its initial position.
• A fine grid is automatically positioned within the selected region of interest (ROI) with an intergrid point distance of variable size (Fig. 14.22).
• For each frame, the position of each grid point is updated on the basis of the underlying velocity vector.
• The deformation of the grid follows the deformation of the underlying myocardium.
• Drifting is compensated for by forcing all grid points to return to their initial positions at the end of the heart cycle (Fig. 14.23).
• Various strains can be estimated from the distance changes between grid points as a function of time91320 (Fig. 14.24).
• Layer-specific strains can be obtained by placing grids in the subendocardium, midwall and subepicardial region. However, this is an area of research with no clear clinical application.
HOW TO PERFORM TWO-DIMENSIONAL STRAIN IMAGING?
• Two-dimensional images of apical four- and two- chamber views, as well as the apical long-axis view and the LV parasternal short-axis view (at base, mid and apex) are recorded.

Fig. 14.23: Velocity vectors shown at end-diastole in apical four- chamber view.

Fig. 14.24: Velocity vectors seen in short axis of the left ventricle showing circumferential strain. Velocity vectors also suggest possibility of clockwise rotation.

Fig. 14.25: Point-and-click method to extract longitudinal strain curves in apical views. Marking three points on the endocardium (left panel) generates the region of interest (ROI), which can be manually adjusted and strain values can be derived after accepting the ROI.
• Three consecutive cardiac cycle loops are recorded at end expiration.
• Images are recorded with an acoustic method that provides information frame by frame. the frame rate is kept between 50 frames and 100 frames/s. By reducing imaging depth and insonation angle without reducing spatial resolution, frame rate can be optimized.
• the imaging sector is optimized to complete visualization of the structure under consideration.
• the 17-segment LV model of the American Society of Echocardiography is used to analyze regional cardiac function.21
• the long-axis ventricular walls are divided into three levels: base, middle and apical.
• Using a point-click approach, a number of points are placed along the endocardium or the middle layer of myocardium. The software automatically traces epicardium.
• the number of points is decided depending on the radian of the endocardium.
• In apical views, three points are placed—medial edge of the mitral annulus, lateral edge of the mitral annulus and the apical endocardium (Fig. 14.25).
• the correct tracking of border zones is visually controlled and manually corrected.
• Peak positive or peak negative strain is extracted from each strain curve. Strain curves and numbers are obtained by off-line analysis.
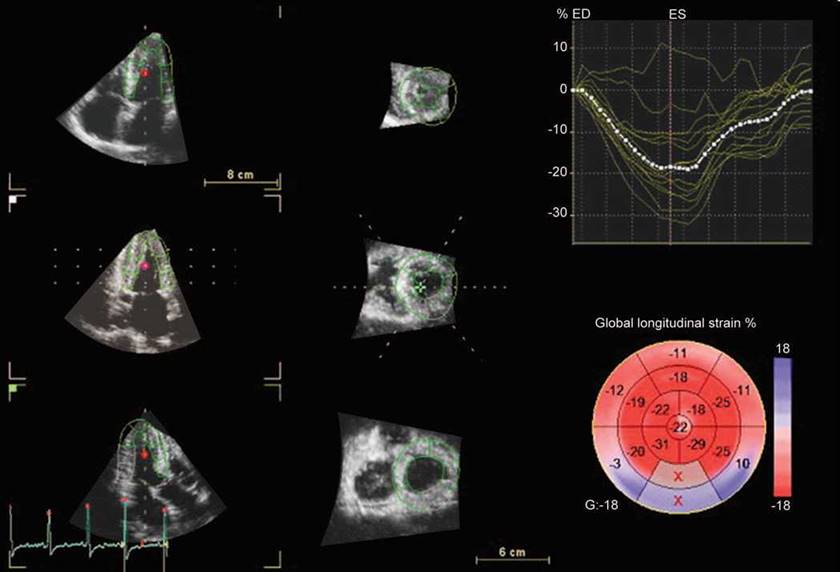
Fig. 14.26: Three-dimensional strain by acoustic speckle tracking. Bull's eye map is marked ‘X' in boxes for mid and basal posterior segments because of unacceptable image quality.
• In the VVI analysis, a relatively static reference point is placed at the apical location in the long-axis view and at the center of the ventricle in the short-axis view.
• Segments for which no adequate image quality can be obtained are rejected by the software and excluded from the analysis (Fig. 14.26).
• the ROI is defined by tracing the endocardium in a still frame (default at end systole).
• the ROI width is set to match the myocardial thickness. ttis has to be performed manually most often.
• Bull's eye map depiction is possible for all types of strain, time-to-peak strain and extracted post-systolic strain (Figs 14.27 and 14.28).
• ttree-dimensional strain is less time-consuming and provides global longitudinal, radial, circumferential and area strain from a single pyramidal volume by just tracking the endocardium in systole and diastole.22
• It is crucial that the tracking algorithm is able to track the tissue correctly. Factors that affect the tracking
accuracy include image quality, frame rate and line density.22
effects of ischemia on regional deformation metrics
• Acute ischemia induces systolic thinning, decreases systolic deformation and increases post-systolic thickening (PST). ttese changes are directly related to perfusion.23
• With acute total vessel occlusion, systolic deformation is totally ablated and replaced by systolic lengthening (paradoxical strain).
• An acute increase in afterload exaggerates the effects on deformation induced by ischemia, whereas an increase in preload diminishes it.24
• Reperfusion restores deformation to near-normal, but some early systolic lengthening and PST remain present in the early phase as a result of stunning.

Fig. 14.27: Bull's eye map showing longitudinal strain in 17-segment model in a normal subject.

Fig. 14.28: Bull's eye map of longitudinal strain in a patient with hypertrophic cardiomyopathy and resting intraventricular gradient of 64 mm Hg. Note significantly decreased strain in anterior septum and anterior wall.
• Late systolic thinning can also occur during ischemia just before the start of PST.25
• Strain shows a biphasic response to physiological stress and decreases at peak stress due to lower stroke volume as a consequence of higher heart rates.3,26
EARLY SYSTOLIC LONGITuDINAL LENGTHENING (PARADOXICAL LONGITuDINAL SYSTOLIC STRAIN)
During isovolumic contraction, there may be a brief systolic lengthening due to contraction of basal circumferential fibers and this is a normal phenomenon (Fig. 14.29).
During the isovolumic contraction phase, segments with reduced rate of force development might demonstrate significant and prolonged systolic lengthening (Fig. 14.30).
• This is possible because of reversible dysfunction as in ischemia, late activation of the segment due to

Fig. 14.29: Two-dimensional longitudinal strain of the right ventricle. Note waves (arrow) of longitudinal positive strain for a brief period.
conduction block or segmental fibrosis resisting the development of force.
• Duration of early systolic lengthening may provide incremental value over peak systolic longitudinal strain for the identification of patients with significant systolic dysfunction.27
• Duration of early systolic lengthening has been shown to be a strong and independent predictor of significant coronery artery disease (CAD).
post-systolic longitudinal SHORTENING
• Post-systolic shortening (PSS) means that the segment continues shortening after the AVC, often after a short relaxation giving one or two peaks a systolic and a
post-systolic, or a single peak after AVC as shown in Figure 14.31.
• the definition of shortening as post-systolic is dependent on the location ofAVC, which can be done by TDI.
• A small amount of PSS may be present in up to one-third of normal segments but not more than 3%.
• Pathological strain is concomitant with reduced systolic strain and higher post-systolic strain (in magnitude) as well as later peak PSS.
• PSS and post-systolic thickening are to some degree equivalent, due to the incompressibility.
• Presence of PSS is mainly a measure of inhomogeneity of force development, due to differences in activation, load or contractility, and not as specific marker of ischemia.

Fig. 14.30: Two-dimensional longitudinal strain in a patient with idiopathic dilated cardiomyopathy in apical four-chamber view. Arrow points to paradoxical positive strain for nearly half of systole in all the segments.

Fig. 14.31: Left panel shows longitudinal strain from apicoseptal segment and the right panel from the basal and midlateral wall. Note markedly reduced end-systolic strain and significant post-systolic strain in the right panel. The patient had critical stenosis of the left circumflex artery.
• The new concept of 'mechanical dispersion,' meaning unequal duration of the shortening phase, seems to be due to variable amount of PSS within the ventricle.
• Presence of PSS may give asynchrony between walls.
• Presence of PSS in a segment leads to a delay in the onset of segmental lengthening compared to the normal segments, so the finding is equivalent to the delayed compression/expansion crossover.
• PSS is mainly the reduced, but prolonged contraction of a segment due to ischemia and/or relative load increase in the early diastolic interaction with normally relaxing segments.
• Stretch recoil is a mechanism for PSS, especially in segments that do not show systolic shortening. Therefore, PSS is not always suggestive of viability or ischemia.
• The degree of this thickening is expressed as the post-systolic index (i.e. post-systolic increment divided by systolic strain).
• Post-systolic motion is reported in > 30% of myocardial segments in normal subjects, but can be identified as pathological if there is a concomitant reduction of systolic strain, especially if the PST is marked (e.g. index > 25-35%).
• PST or PSS presence actually implies that tissue elasticity is preserved, which means that no important, irreversible fibrosis is present.
• PST can also occur in normal myocardium, especially with increased afterload (aortic stenosis, hypertension), myocardial storage diseases and abnormal activation.28
Holosystolic stretching in longitudinal or circumferential plane is an extension of the early systolic lengthening found in diseased states, especially in scarred tissue, dilated cardiomyopathy (indicative of dyssynchrony (Fig. 14.32) and in left bundle branch block (septal holosystolic stretch).

Fig. 14.32: Holosystolic longitudinal stretch with post-systolic shortening in apical four-chamber view in a child with dilated cardiomyopathy.
the right ventricle (RV) has complex geometry with mainly longitudinal/circumferential fiber orientation in the free wall and minimal radial function due to thin walls. Longitudinal deformation of the RV free wall provides assessment of systolic function (Figs 14.33 to 14.35), which does correlate with RVEF as well as strain estimate by sonomicrometry.29
• Apical views are used to obtain RV free wall longitudinal strain.
• RV free wall longitudinal strain is 5-10% more than the LV free wall.
• A base-to-apex gradient is also seen but is not a consistent finding.
• RV free wall deformation assessment is feasible in > 90% cases.
• ttere is a reasonably good correlation with tissue Doppler-derived strain.
• Global RV strain, however, has modest correlation with EF.
• Significant utility of RV free wall strain lies in assessment of ambiguous conditions like arrhythmogenic dysplasia, noncompaction, pulmonary embolism, Friedrich's ataxia, and so on.30
LEFT ATRIAL FuNCTION BY DEFORMATION Imaging
Deformation imaging is a good method for assessing reservoir function of the left atrium.31 The reservoir function (lengthening or increase in volume during ventricular systole) is coupled with longitudinal function of the LV (Figs 14.36 and 14.37). Reduced left atrial diastolic longitudinal strain is an indicator of left atrial dysfunction. However, many conditions are associated with predominant left atrial dysfunction with some decrease in LV longitudinal function.

Fig. 14.33: Right ventricle free wall longitudinal strain in a patient with type I pulmonary hypertension. Note markedly decreased end-systolic strain (-5%) and 50% post-systolic strain.

Fig. 14.34: Right ventricle free wall longitudinal strain in a case of suspected pulmonary embolism. Note early systolic positive strain (systolic stretching) with markedly reduced end-systolic (-4%) strain and also post-systolic strain.
It may provide incremental information about subclinical atrial pathology like likelihood of developing atrial fibrillation, left atrial thrombus, paroxysmal atrial fibrillation recurrence after ablation, and so on. It is still an investigational tool but with great promise (Fig. 14.37).
Marked decrease in reservoir function (either with reduced strain or paradoxical shortening) is commonly found in patients with heart failure with or without systolic dysfunction and is an indicator of left atrial dysfunction.
Understanding the mechanical behavior of the arterial wall and its spatial variations is essential for the study of vascular physiopathology. Although it is generally accepted that the aortic wall gets stiffer along its length, the spatial variations in the mechanical behavior of the
aorta are not well understood. Deformation imaging of the aorta aids in understanding the mechanical properties of aorta and may be a great tool in future (Fig. 14.38). The aortic circumferential strain can be measured with 2D strain echocardiography and is a new tool that can be used to directly and easily evaluate aortic stiffness.
Normative age-specific data are yet to be reported in adequate numbers. Also, through-plane motion remains a major handicap as of now.
DIMENSIONAL DEFORMATION IMAGING
Three-dimensional/four-dimensional (4D) strain is a postprocessing research tool that tracks inherent features in a 3D image called 'natural acoustic markers' from frame to frame in three dimensions over time (Fig. 14.39). ttree-dimensional strain uses a tracking algorithm based

Fig. 14.35: Comparison of tissue Doppler-derived strain at basal right ventricle free wall (-6%) and the basal septum (-36%) in the same patient as in Figure 14.34. Increased basal septal strain may be a compensatory phenomenon.

Fig. 14.36: Mid-septal left atrial longitudinal strain. Upper panel is a normal subject with a strain value of +42% (typically twice of left ventricle longitudinal strain). Middle panel shows a left atrial strain (+33%) of a patient with diastolic dysfunction with normal ejection fraction and lower panel shows left atrial strain (+3%) in a patient with diastolic heart failure with atrial fibrillation.
on frame-to-frame block matching performed in three dimensions. This involves successively searching for a match between 3D patterns found in one 3D frame and in the next. The 3D strain ROI is automatically generated in the end-systolic frame and is built up from an endocardial and an epicardial mesh. The epicardial mesh is automatically generated from the epicardial mesh used in the LV mass stage. A 4D mapping (three spatial dimensions + time) of myocardial SR would help to describe the mechanical properties of the myocardium.
• Three-dimensional strain performs tracking over time in three dimensions, which also means there is no out-of-plane motion issue.
• It is less time-consuming as it provides global deformation in a quick fashion.
• This method exclusively provides the area strain, which is a combination of longitudinal and circumferential strain. Area strain is superior to any single strain in detecting myocardial function.

Fig. 14.37: Left atrial longitudinal strain during ventricular systole (left panel) and the left ventricular longitudinal strain in four-chamber view in a patient with heart failure and normal ejection fraction. Reservoir function of the left atrium is markedly reduced (-6% longitudinal strain compared to > +40% in normal subjects).

Fig. 14.38: Circumferential strain of the ascending aorta in a subject with hypertension.
• If more than three segments are rejected because of poor tracking, global strain values will not be calculated.
• Radial strain is estimated from the area strain assuming that the segment has a constant volume. This way, it is more accurate than the 2D strain method.
• Strain values in 2D bull's eye map are the peak systolic values, including positive peaks, while in 3D strain it is the strain values from the end-systolic frame that are used.
CLINICAL APPLICATIONS OF STRAIN AND STRAIN RATE IMAGING
Technical and vendor-related differences do not allow, at the moment, wide-spread clinical use of strain and SR imaging except, perhaps, the longitudinal strain, which is more robust and reproducible and has been used in various clinical situations.32,33 Following are the fields wherein strain/SR imaging has been used:
• In CAD to detect ischemia, viability, reperfusion, extent of transmural infarction.
• To detect subclinical systolic dysfunction in valvular heart disease like asymptomatic aortic stenosis, aortic regurgitation, mitral regurgitation,34 and so on.
• Detection of intraventricular dyssynchrony.
• Understanding diastolic dysfunction and heart failure with normal EF.
• Incremental value in prognosticating heart failure and ischemic heart disease.
• Detecting earliest evidence of cardiotoxicity of chemotherapeutic agents.
• Heart transplant rejection.
• Study of right ventricular function.
• Differentiating physiological hypertrophy from the pathological one.
• Predicting extent of myocardial fibrosis noninvasively.

Fig. 14.39: Three-dimensional (3D) radial strain in a normal subject. All 17-segment strain curves can be simultaneously shown with the average value (interrupted line) and Bull's eye map. The 3D data set is sliced to show three apical and three short-axis slices, allowing inspection of the tracking of each segment both in apical and short-axis directions.
• Two-dimensional/three-dimensional speckle tracking echocardiography is generally more smoothed and, therefore, less influenced by artifacts than TDI-derived strain but also less sensitive to detect small regions of pathology.
• Despite noise reduction by increased smoothing and despite an anticlutter filter, dropout is still problematic and stationary reverberations are sometimes still tracked or interfere with the frame-by-frame tracking, resulting in drift or incorrect calculation of strain and SR.
• A clear delineation of the endocardial border is also important for a reliable radial and transverse tracking. Since spatial resolution is lower in the transverse
direction, tracking perpendicular to the ultrasound beam becomes less robust.
• At present, the optimal frame rate for speckle tracking seems to be 50-70 frames/s, which is lower compared to TDI; this could result in undersampling, especially in patients with tachycardia.
• Rapid events during the cardiac cycle (e.g. isovolumic phases) may disappear all together, and peak SR and velocity values may be reduced due to under-sampling, especially in isovolumic phases and in early diastole.
• Higher frame rates could reduce the under-sampling problem, although this will result in a reduction of spatial resolution.
• Speckle tracking software uses a frame-by-frame approach to follow the myocardial movement and searches each consecutive frame for a speckle
pattern closely resembling and in close proximity to the reference frame. With a too-low frame rate, the speckle pattern could be outside the search area, again resulting in poor tracking. This can be obviated by 3D strain imaging.
• Optimal tracking of the ROI is not only dependent on optimal image quality, but also on the implemented tracking algorithm. Software programs designed for speckle tracking are relatively new and are subjected to periodical improvements. Different tracking algorithms potentially produce different results.
• Visualization of the myocardial wall needs to be optimal, with a clear delineation of myocardial tissue and extracardiac structures and avoidance of dropout since this will result in unacceptable ROI tracking and drift.
• The optimal balance between temporal and spatial resolution is achieved when adjusting the image sector slightly wider than the interrogated wall.
• Near-field clutter can be reduced with the implementation of dual-focus imaging when artifacts are prominent.
• For parasternal recordings (for radial and circumferential function on the short axis), small angle recordings are not possible; all myocardial segments need to be in the image field.
• For any recording, it should be kept in mind that all myocardial segments need to be visualized optimal, since poor tracking of any segment often affects tracking of the adjacent segments.
• Inaccurate results are obtained near boundaries between different kinds of tissues and this may limit the window size for cross-correlation.
REFERENCES
1. Takayama Y, Kosta KD, Covell JW. Contribution of laminar myofiber architecture to load-dependent changes in mechanics of LV myocardium. Am J Physiol. 2002;282: H510-20.
2. Urheim S, Edvardsen T, Torp H, et al. Myocardial strain by Doppler echocardiography. Validation of a new method to quantify regional myocardial function. Circulation. 2000;102(10):1158-64.
3. Weidemann F, Jamal F, Sutherland GR, et al. Myocardial function defined by strain rate and strain during alterations in inotropic states and heart rate. Am J Physiol Heart Circ Physiol. 2002;283(2):H792-9.
4. Greenberg NL, Firstenberg MS, Castro PL, et al. Doppler-
derived myocardial systolic strain rate is a strong index of left ventricular contractility. Circulation. 2002;105(1): 18.
99-105.
5. Leitman M, Lysyansky P, Sidenko S, et al. Two-dimensional strain-a novel software for real-time quantitative echocardiographic assessment of myocardial function. J Am Soc Echocardiogr. 2004;17(10):1021-9.
6. Heimdal A, Stoylen A, Torp H, et al. Real-time strain rate imaging of the left ventricle by ultrasound. J Am Soc Echocardiogr. 1998;11(11):1013-9.
7. Orderud F, Kiss G, Langeland S, et al. Combining edge detection with speckle-tracking for cardiac strain assessment in 3D echocardiography. IEEE Ultrasonics Symposium. 2008;1959-62.
8. Weidemann F, Jamal F, Motoki H, et al. Incremental prognostic value of assessing left ventricular myocardial mechanics in patients with chronic systolic heart failure. J Am Coll Cardiol. 2012;60:2074-81.
9. Kowalski M, Kukulski T, Jamal F, et al. Can natural strain and strain rate quantify regional myocardial deformation? A study in healthy subjects. Ultrasound Med Biol. 2001;27(8): 1087-97.
10. Azhari H, Weiss JL, Rogers WJ, et al. A noninvasive comparative study of myocardial strains in ischemic canine hearts using tagged MRI in 3-D. Am J Physiol. 1995;268 (5 Pt 2):H1918-26.
11. D'hooge J, Konofagou E, Jamal F, et al. Two-dimensional ultrasonic strain rate measurement of the human heart in vivo. IEEE Trans Ultrason Ferroelectr Freq Control. 2002; 49(2):281-6.
12. Herbots L. Description of deformation values in healthy volunteers and the influence of BMI, age and gender. In Herbots L (Ed). Quantification of Regional Myocardial Deformation: Normal Characteristics and Clinical Use in Ischaemic Heart Disease. Leuven: Leuven University Press; 2006. pp. 45-72.
13. Sun JP, Popovic ZB, Greenberg NL, et al. Noninvasive quantification of regional myocardial function using Doppler- derived velocity, displacement, strain rate, and strain in healthy volunteers: effects of aging. J Am Soc Echocardiogr. 2004;17(2):132-8.
14. Biaggi P, Carasso S, Garceau P, et al. Comparison of two different speckle tracking software systems: does the method matter? Echocardiography. 2011;28(5):539-47.
15. Tanaka H, Hara H, Saba S, et al. Prediction of response to cardiac resynchronization therapy by speckle tracking echocardiography using different software approaches. J Am Soc Echocardiogr. 2009;22(6):677-84.
16. Bansal M, Cho GY, Chan J, et al. Feasibility and accuracy of different techniques of two-dimensional speckle based strain and validation with harmonic phase magnetic resonance imaging. J Am Soc Echocardiogr. 2008;21(12): 1318-25.
17. Fine NM, Shah AA, Han IY, et al. Left and right ventricular strain and strain rate measurement in normal adults using velocity vector imaging: an assessment of reference values and intersystem agreement. Int J Cardiovasc Imaging. 2013;29(3):571-80.
Carasso S, Biaggi P, Rakowski H, et al. Velocity Vector Imaging: standard tissue-tracking results acquired in
normals-the VVI-STRAIN study. J Am Soc Echocardiogr. 2012; 25(5):543-52.
19. Gorcsan J 3rd, Oyenuga O, Habib PJ, et al. Relationship of echocardiographic dyssynchrony to long-term survival after cardiac resynchronization therapy. Circulation. 2010; 122(19):1910-8.
20. Kuznetsova T, Herbots L, Richart T, et al. Left ventricular strain and strain rate in a general population. Eur Heart J. 2008;29(16):2014-23.
21. Lang RM, Bierig M, Devereux RB, et al.; Chamber Quantification Writing Group; American Society of Echocardiography's Guidelines and Standards Committee; European Association of Echocardiography. Recommendations for chamber quantification: a report from the American Society of Echocardiography's Guidelines and Standards Committee and the Chamber Quantification Writing Group, developed in conjunction with the European Association of Echocardiography, a branch of the European Society of Cardiology. J Am Soc Echocardiogr. 2005;18(12):1440-63.
22. Yodwut C, Weinert L, Klas B, et al. Effects of frame rate on three-dimensional speckle-tracking-based measurements of myocardial deformation. J Am Soc Echocardiogr. 2012; 25(9):978-85.
23. Kukulski T, Jamal F, Herbots L, et al. Identification of acutely ischemic myocardium using ultrasonic strain measurements. A clinical study in patients undergoing coronary angioplasty. J Am Coll Cardiol. 2003;41(5):810-9.
24. Voigt JU, Lindenmeier G, Exner B, et al. Incidence and characteristics of segmental postsystolic longitudinal shortening in normal, acutely ischemic, and scarred myocardium. J Am Soc Echocardiogr. 2003;16(5):415-23.
25. Hanekom L, Jenkins C, Short L, et al. Accuracy of strain rate techniques for identification of viability at dobutamine stress echo. a follow-up study after revascularization. Circulation. 2005;112:3892-900.
26. Davidavicius G, Kowalski M, Williams RI, et al. Can regional strain and strain rate measurement be performed
during both dobutamine and exercise echocardiography, and do regional deformation responses differ with different forms of stress testing? J Am Soc Echocardiogr. 2003;16(4): 299-308.
27. Abraham TP, Belohlavek M, ttomson HL, et al. Time to onset of regional relaxation: feasibility, variability and utility of a novel index of regional myocardial function by strain rate imaging. J Am Coll Cardiol. 2002;39(9):1531-7.
28. Stoylen A, Sletvold O, Skjaerpe T. Post systolic shortening in nonobstructive hypertrophic cardiomyopathy with delayed emptying of the apex: a Doppler flow, tissue Doppler and strain rate imaging case study. Echocardiography. 2003;20(2):167-71.
29. Jamal F, Bergerot C, Argaud L,et al. Longitudinal strain quantitates regional right ventricular contractile function. Am J Physiol Heart Circ Physiol. 2003;285(6):H2842-7.
30. Weidemann F, Eyskens B, Mertens L, et al. Quantification of regional right and left ventricular function by ultrasonic strain rate and strain indexes in Friedreich's ataxia. Am J Cardiol. 2003;91(5):622-6.
31. Miyoshi H, Oishi Y, Mizuguchi Y, et al. Effect of an increase in left ventricular pressure overload on left atrial-left ventricular coupling in patients with hypertension: a twodimensional speckle tracking echocardiographic study. Echocardiography. 2013;30(6):658-66.
32. Reisner SA, Lysyansky P, Agmon Y, et al. Global longitudinal strain: a novel index of left ventricular systolic function. J Am Soc Echocardiogr. 2004;17(6):630-3.
33. Weidemann F, Dommke C, Bijnens B, et al. Defining the transmurality of a chronic myocardial infarction by ultrasonic strain-rate imaging: implications for identifying intramural viability: an experimental study. Circulation. 2003;107(6):883-8.
34. Lee R, Hanekom L, Marwick TH, et al. Prediction of subclinical left ventricular dysfunction with strain rate imaging in patients with asymptomatic severe mitral regurgitation. Am J Cardiol. 2004;94(10):1333-7.