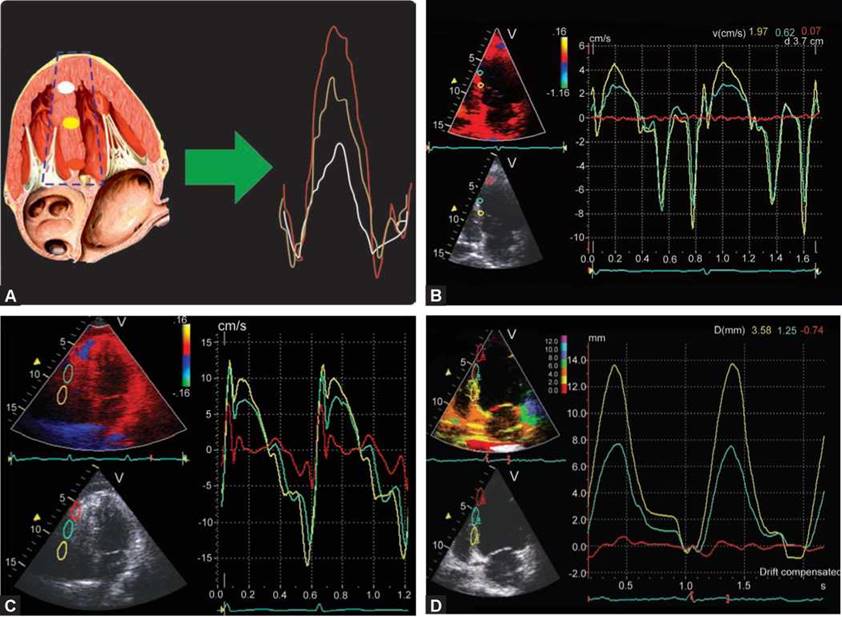
In 1842, an Austrian scientist, Christian Doppler, presented the concept of measuring distance of planets from the earth by using what is now called Doppler effect. A century later, at the University of Osaka, Japan, S. Satomura first applied these principles to measure the blood flow velocities in blood vessels. The pioneer of tissue Doppler imaging is Karl Isaaz, a French man, who was the first to realize the importance of clinical and diagnostic potentials of tissue Doppler imaging. He hypothesized that rate and direction of the heart tissue movement can be obtained by using the tissue Doppler with the assumption that the movement is parallel to the ultrasound beam and within the beam. Movements of myocardial walls include components of low velocity and short duration requiring a high sampling rate. Modifications to the filter settings on pulsed Doppler to image low-velocity, high- intensity myocardial signal rather than the high-velocity, low-intensity signal from blood flow allow tissue velocity estimation. Tissue velocities are nearly one-tenth of the intracardiac flow velocities. Measurement of myocardial tissue motion has created basis for detailed evaluation of systolic and diastolic cardiac function not only in terms of velocity, but also in terms of acceleration, displacement and deformation variables (Fig. 13.1).

Fig. 13.1: Concept of tissue Doppler echocardiography. Using a prespecified region for placement of sample volume, a Doppler spectrum is obtained as shown in the Figure depicting velocities in various phases of the cardiac cycle with preordained filter settings. Velocities toward the transducer are positive and away from the transducer are negative. Temporal resolution of various waves is due to high frame rates (> 100 frames/s).
LABELING OF TISSUE VELOCITY WAVEFORMS
• Two positive waves of myocardial shortening can be recorded in systole. The first positive wave (S1)

Figs 13.2A to D: (A) Tissue Doppler waveforms S1 and S2 are systolic velocities, while e' and a' are early and late diastolic velocities. There are small biphasic velocities in isovolumic phases, which are normally not named. S1 represents longitudinal component, while S2 denotes circumferential component of the systolic velocities. Conventionally, tissue velocities are labeled by lowercase letters; (B) Tissue Doppler waveforms of the actual tracing from the medial edge of the mitral annulus. There are two positive (systolic) and two negative (diastolic) waveforms; (C) Lateral edge mitral annular tissue velocity profile showing two distinct systolic waves (S and S2) in a healthy young control. It is the S1 that represents contraction of longitudinal fibers that is usually measured; (D) Color Doppler myocardial imaging. After acquisition of image containing velocity information, a sample volume of known length is placed (as here at basal inferior septum) and corresponding velocity spectrum is obtained (shown on the right side).
occurs as a result of the longitudinal shortening of the myocardial tissue during the phase of isometric contraction. The second wave (S2) occurs due to left ventricle (LV) shortening during LV ejection (Figs 13.2A to C). Two peak velocities in systolic ejection are commonly seen in free wall. These represent functional switch-over from subendocardial longitudinal fibers contraction to circumferential fibers shortening during ejection with a variable delay.
In healthy subjects, the shortening of the longitudinal fibers predominates over that of the circumferential fibers during early systole, whereas the shortening of the circumferential fibers predominate over that of longitudinal fibers in the ejection phase. However, their relative importance remains ill-defined and, therefore, both systolic waves should be measured and mentioned. However, whenever two waves are seen, it is not clear which one should be used. As S1 corresponds
to contraction of subendocardial longitudinal fibers, it is better to use it.
• Early diastolic velocity, which correlates with active relaxation, is labeled e' It is relatively much less load- dependent.
• Late diastolic velocity, which correlates with ventricular stiffness, is labeled as a!
• ttere is no consensus on labeling abnormal waves. However, l' wave is that recorded in diastasis.
• A recoil wave can usually be seen after high-velocity movements during isovolumic contraction, relaxation or after early diastolic filling, and occurs in a direction opposite to initial movement.
• the rate of LV pressure decline during isovolumic relaxation (IVR) becomes slower during the development of most forms of cardiovascular disease and also becomes slower during normal aging. Prominent and prolonged IVR phase can be often noticed in diseased states. It may be called 'IVR!
TERMS USED IN TISSUE DOPPLER IMAGING
Velocity: speed of motion with direction (positive or negative velocity).
Color velocity imaging shows red hue while shortening and blue while lengthening. Velocity is a vector physical quantity; both magnitude and direction are required to define it.
Displacement: A displacement is the shortest distance from the initial to the final position of a point. In ultrasound terms, it is time integral of velocity (velocity x time). Displacement imaging, also called tissue tracking, uses different hues for degree of displacement. TDI measures only linear displacement.
Strain rate: regional myocardial velocity gradient. Strain rate imaging (SRI) has several hues, for example, green color denotes no strain rate, while orange-red hue indicates negative strain rate; blue color indicates positive strain rate (color hues are reverse of tissue velocity imaging (TVI)].
Strain: Integral of strain rate and time over a fixed region measured in percent. Strain imaging has different hues, for example, white means no strain.
Acceleration: Rate of velocity over a region (velocity/ time). 'Deceleration' is called a 'negative acceleration'.
Momentum: Integral of mass and velocity, rarely used in TDI, although more common in flow Doppler studies.
Deformation: Change in shape and size of an elastic object when a force is applied. Strain and strain rate are examples of deformation imaging.
TDI or TVI: An imaging technique that provides qualitative and quantitative information about regional velocities using pulsed wave Doppler with good temporal resolution.
Spectral pulsed TDI is online velocity determination from a single point by placing a small sample volume. It has the advantage of online measurements of velocities and time intervals and an excellent temporal resolution (8 milliseconds).
Color Doppler myocardial imaging (CDMI): An imaging technique that provides qualitative or quantitative information about spatial velocities using fast Fournier algorithm of color flow mapping. Peak velocities measured by this technique are approximately 20-30% lower than that of TDI, because these are mean velocities rather than peak values (Fig. 13.2D).
Merely by turning on a knob, one can convert it to displacement imaging or deformation imaging or tissue synchronization imaging.
Curved anatomical M-mode TVI: High resolution semiquantitative technique to study regional tissue velocities and velocity-derived parameters. In M-mode tracing, the derivative of the position versus time graph of an object is equal to the velocity of the object.
TDI is an assessment of myocardial motion using Doppler ultrasound imaging, often with color coding. The fundamental units are velocity observed from the echocardiographic transducer as a frame of reference.
Most systems have TDI software, which automatically brings on tissue velocities once a sample volume is placed in that image after activating the software. TDI information is embedded in gray-scale images or the images are colored.
• Velocities are obtained from the selected sample volume (single or multiple point velocity in reference to the position of the transducer), which can be of variable dimension. A sample volume of 2-5 mm is optimum for spectral Doppler, while CDMI has a wide but well-defined area (6-12 mm) from where velocities can be obtained ex post facto.
• Tissue velocities are usually < 25 cm/s.
• A high sampling rate is essential for a proper rendering of TVI signals (but introduces noise)—too low frame

Fig. 13.3: Spectral pulsed wave tissue velocities from the medial edge of the mitral annulus. Velocities obtained from here are most stable and commonly used for serial studies. This is because angle of insonation is optimal.
rates result in underestimation (< 70 frames/s). To ensure the optimal signal-to-noise ratio, temporal filtering should be used with caution (usually 200 frames/s), governed by the awareness of the interplay between sampling rate and temporal filters.
• The influence of unfavorable insonation angle may affect tissue Doppler measurements resulting in underestimation of the true myocardial velocities.
• Default gain settings of 50% saturation should be used to measure velocities accurately. Overgaining results in overestimation of tissue velocities by approximately 20%. Intervendor settings differences also should be noted.
• In clinical practice, annular velocities are used most often because these are more reproducible (Fig. 13.3). Usually, septal or lateral edges of the mitral annulus are interrogated and can be used separately or by averaging the two. Multiple points of the annulus can also be used to enhance accuracy but are cumbersome and are not recommended. The results of averaging mitral annular velocities obtained from the four myocardial walls do not differ from the average of using velocities measured at the septal and lateral sites.
• Color Doppler myocardial velocities are obtained ex post facto and can be obtained from multiple sites either in M-mode or two-dimensional (2D) format (Figs 13.4 to 13.6).
Color Doppler obtained velocities are 20% to 30% lesser than the pulsed wave Doppler velocities but provide mean velocity estimation from several sites simultaneously.
Temporal resolution is maximum in M-mode tissue velocities, followed by pulsed wave TDI and then CDMI (Fig. 13.5B).
TDI is used for assessing regional longitudinal function. It is possible to obtain radial velocities, which are mostly used for pattern reading and understanding myocardial mechanics.
Systolic and early diastolic velocities decrease with aging and hence normal values are age-dependent when used in isolation.
Tissue velocities have a base-to-apex gradient and are usually nearly absent close to the apex. Typical annular tissue s' and e' velocities are > 8 cm/s in healthy subjects while a' is less than e!
Lateral annular velocities are higher than medial annular velocities (Fig. 13.6).
Tricuspid annular and right ventricular (RV) free wall velocities are usually higher than mitral annular and LV free wall velocities by approximately 20-30%.
Tissue velocities have greatest utility for estimating subclinical systolic and diastolic dysfunction and prognosis. All waves have implications. Even s' + e' have been used for prognosis. High temporal resolution provides information about the behavior of the tissue region over the entire cardiac cycle.
The isovolumic myocardial motion variables are of considerable clinical interest since they appear to be early markers of pathological phenomena like ischemia-induced disturbances in myocardial function. Post-systolic prominent positive velocities usually indicate nonspecific myocardial diseased state and are not specific to ischemia (Fig. 13.7). Occasionally, there is a negative wave between e' and a' during diastasis. This is called L'-wave. L'-wave is mostly seen when heart rate is slow and represents elevated diastolic pressures (Fig. 13.8).
TDI sometimes show phenomena that are of physiological significance but are not present in flow Doppler interrogation, for example, phasic or pancyclic temporal or velocity alternans suggestive of advanced myopathic process (Figs 13.9A and B). Accurate measurement of myocardial tissues velocities is of considerable clinical interest since it is accepted
Figs 13.4A to D: (A) Color Doppler myocardial imaging from interventricular septum. Note velocity spectrum derivation from multiple points in a single cardiac cycle. The tissue velocities decrease from base to apex; (B) Color Doppler myocardial imaging from interventricular septum. Note velocity spectrum derivation from multiple points in a single cardiac cycle. The tissue velocities decrease from base to apex; (C) Right ventricular free wall shows base-to-apex gradient of peak systolic velocities and diastolic velocities in a normal adult. (D) Color Doppler displacement imaging of the interventricular septum. Average displacement of a myocardial wall is approximately 8 mm with a base-to-apex gradient. Note that the apical segment (red curve) is nearly stationary while the basal segment moves a distance of 13.8 mm in systole.
that decreased peak systolic and early diastolic velocities indicate failing myocardial function. Attention should be paid to the site and size of sample volume, frames rates, gain and angle of insonification.
• Longitudinal systolic dysfunction (s' velocities) might be compensated by an increase of the radial function. tterefore, in early disease states, there is no correlation between systolic velocities and ej ection fraction and the two provide complimentary but different information.
• Before TDI measurements, it is wise to perform cardiac event marking defining aortic valve opening and closure and mitral valve opening and closure.
• Age, heart rate and LV dimensions account for between 20% and 70% of the variability seen in LV systolic and
diastolic velocities. Instead of relying upon normative data from literature, each center should develop its own normal values.
Mitral annular velocity measurement cannot be used in patients with severe mitral annular calcification, prosthetic ring or prosthetic mitral valve.
Apical segments cannot be assessed using TDI because of limited movement of the apex and unfavorable angle of incidence of apical myocardial motion with respect to the transducer position.
Although TDI has become synonymous with 'velocity measurement,' in many cases it is not the frequency shift (Doppler shift) of the received signal that is measured, but the phase shift (when the received signal

Figs 13.5A and B: (A) M-mode color Doppler myocardial imaging in the apical four-chamber view of the left ventricle. Bright orange or red color velocities are positive, while blue ones are negative. Note lack of any motion at the apex. Also note temporal heterogeneity of the septal wall in this 50-year-old female with hypertrophic cardiomyopathy due to myofiber disarray. The walls are traced by curved anatomical M-mode method; (B) M-mode Doppler myocardial imaging of the basal right ventricular free wall. Orange color are positive velocities, while blue are negative velocities. Note the excellent temporal resolution. Positive velocity after early diastolic wave is due to recoil and is normal.
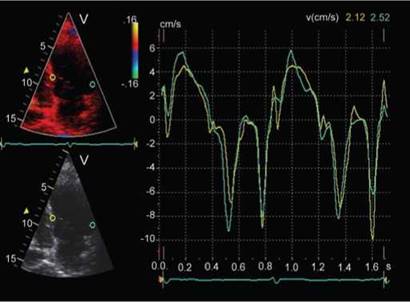
Fig. 13.6: Color Doppler myocardial velocities from basal septum compared to basal lateral wall. Note that the velocities from the lateral wall are higher.
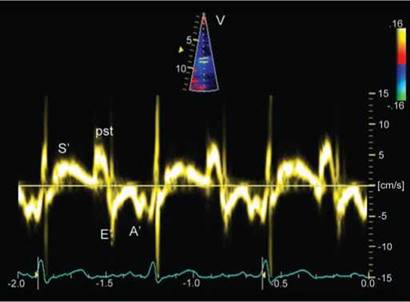
Fig. 13.7: Tissue Doppler imaging of medial mitral annulus showing prominent post-systolic positive wave (pst). A negative component of similar magnitude is present during isovolumic relaxation. Postsystolic wave indicates non-specific myopathic process but one induced by stress are specific for ischemia.
arrives). This is used to study cardiac asynchrony and cardiac phase-related myocardial performance index (isovolumic phase duration/ejection phase duration) and tissue alternans (Figs 13.9A and B).
MYOCARDIAL VELOCITIES IN SHORT AXIS
Myocardial velocities in the short axis are acquired from the posterior wall and the interventricular septum (Fig. 13.10). Short-axis TDI implies the possibility of
measuring a combination of longitudinal, radial and circumferential, rather than the pure circumferential motion.
• Posterior wall waves resemble the waveforms of the longitudinal plane with two systolic (S1 and S2) and three diastolic waves (IVR, E' and A').
• the motion of the interventricular septum is more complex as it is shared between the two ventricles. Moreover, there is a hinge point in the septum, proximal to which it moves away from the LV cavity in

Fig. 13.8: Tissue Doppler imaging of the lateral edge of the mitral annulus. Note prominent L'-wave at a heart rate of 61 beats/min. I'-wave is independent of E' or A' magnitude.
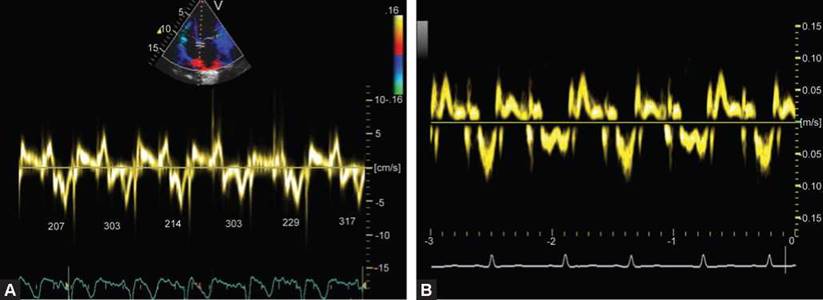
Figs 13.9A and B: (A) Tissue Doppler imaging of the medial edge of the mitral annulus. Note temporal alternans during diastole (tissue diastole in milliseconds is shown in each beat). Also note prominent post-systolic positive wave. Both alternans and positive isovolumic velocities are indicative of advanced myopathic process; (B) A 14-year-old female child with heart failure (idiopathic dilated cardiomyopathy). Tissue Doppler imaging at mitral annulus shows pan-cyclic Doppler alternans, which usually precedes flow alternans and is more specific than the latter. Note alternation of peak velocities as well as duration of each wave. There is fusion of e' and a' in alternate cardiac cycle due to shortened tissue diastole.
systole and toward the LV cavity in diastole. The part of the septum distal to it moves in the opposite direction.
• The tissue velocities in the later part of the septum shows two inward movements in systole, the first (S1) being due to isometric contraction, and the second (S2) due to ventricular ejection. S2 wave in short axis is bigger than in long axis.
• The diastolic waves show a biphasic wave in early diastole (e') and a wave of atrial contraction (a').
• The systolic and diastolic waves occur earlier in the septum as compared to the posterior wall and are consistent with the pattern of electrical activation of the septum. This information can be used to detect ventricular pre-excitation.
• The reason for the biphasic motion of the septum in early diastole is not known. It may be because of translational and/or RV influences (Fig. 13.11).
INTERNAL DEPENDENCY OF VELOCITIES
As systole is coupled with diastole, systolic velocities are related to diastolic tissue velocities. s' velocity denotes longitudinal systolic function, while e' denotes myocardial relaxation. a' is a reflection of ventricular stiffness.
• Systolic velocity (s') is positively correlated to the early diastolic velocity (e'). Increased longitudinal contraction is able to improve early diastolic LV filling through the effect of elastic recoil and vice versa.

Fig. 13.10: Myocardial tissue velocities from the posterior wall in short axis.
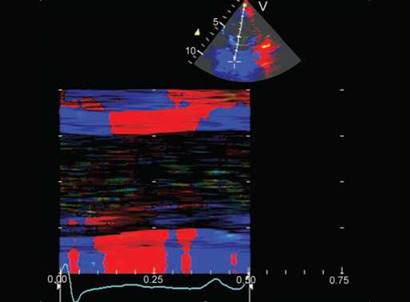
Fig. 13.11: M-mode depiction of the color-coded tissue velocities of the left ventricular short axis. Note the biphasic motion in the posterior wall in isovolumic phases. Of note is the bidirectional and bilayered pattern of contraction and relaxation in the interventricular septum.

Fig. 13.12: Septal annular pulsed wave Doppler tissue velocity pattern in an elderly subject. Both S' and E' are decreased (5-6 cm/s), while A' is increased (> 10 cm/s). This pattern indicates combined systolic and diastolic dysfunction.
• ttere is a negative correlation between early diastolic (E') and late diastolic (A') velocities except in end-stage disease, where both decrease (Fig. 13.12).
• tterefore, S' and A' are independent predictors of myocardial properties while e' is dependent upon S.
• E'/A' and S' are more robust parameters of abnormal physiology.
• Limited data exist on isovolumic phase velocities and their significance at rest. Stress-induced prominent post-systolic positive velocities may be specific markers of ischemia and correlate with extent of perfusion
defects. Prominent post-systolic velocities have also been called delayed longitudinal contractions.
• Regional myocardial tissue velocities, however, represent the net effect of the contractile and elastic properties of the area under investigation and traction and tethering effects from other regions. Tissue motion can be resolved by velocities but difference between active or passive motion can not be made out. For this, myocardial velocity gradient imaging (deformation imaging) is used.
• e'/a' ratio increases with increasing physiological stress and exercise in healthy subjects. Abnormal response could signify disease process or aging.
• e' is relatively independent of the effect of heart rate, preload and afterload but is affected by age.
Heart as an organ continues to surprise us. the intricate layout of muscle fibers from inside to outside, from right to left and from base to apex is designed for mechanical efficiency of extreme proportions at low energy consumption (Fig. 13.13). TVI is one of the techniques that has helped us in understanding this complexity. Heart is a complex mechanical organ that undergoes cyclic changes in multiple dimensions that ultimately effect a change in chamber volume that results in ejection of blood. In simple terms, it is called multidimensional motion or movement. Primary motion of heart muscle secondary to electromechanical coupling provides passive motion to blood. Movement of blood or flow has been studied
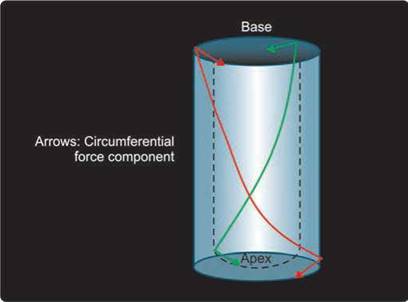
Fig. 13.13: Myo-architecture of the left ventricle from base to apex. Subendocardial fibers (green line) descend toward the apex and then make a figure of 8 as these ascend upwards as subepicardial fibers (red line). Arrows represent circumferential component of the motion, while other parts represent longitudinal motion.
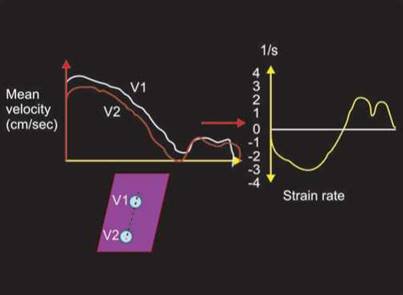
Fig. 13.14: Mean velocity gradient over a segment of fixed length obtained by color Doppler myocardial imaging yields strain rate curves as shown on the left side of the diagram. It is expressed as number/ second.
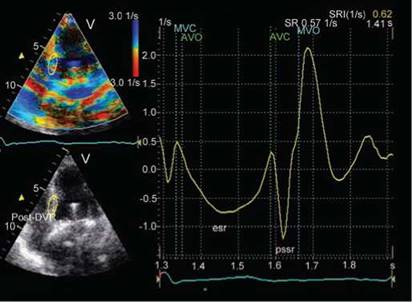
Fig. 13.15: Tissue Doppler-derived strain rate imaging of the basal septum in the apical four-chamber view over a fixed segment of 12 mm length. Systolic strain rates are negative (rate of longitudinal shortening, esr), while diastolic strain rates are positive (rate of diastolic lengthening). Note prominent post-systolic negative strain rate (pssr), which usually indicates diseased segment.
for long by use of the Doppler principle. Application of the Doppler principle to the heart tissue motion is called tissue Doppler echocardiography (TDI) or tissue velocity imaging. This requires a simple modification of the settings used for flow velocity studies. Regardless of imaging technique, the holy grail of heart motion or action called 'ejection fraction', which is a sum total of the heart motion, is unable to provide information on the
underlying myocardial mechanical activity. Also, ejection fraction reflects the sum contribution of several regions only during systole and does not provide information on regional function. Regional function assessed visually is subjective and prone to error. The most difficult part of regional function by conventional imaging method has been the study of diastolic function and isovolumic phase function with temporal and spatial evaluation. Focal estimation of the regional function has been the subject of much research. Tissue Doppler imaging (TDI) is one of the earliest such methods. Modifications to the filter settings on pulsed Doppler to image low-velocity, high- intensity myocardial signal rather than the high-velocity, low-intensity signal from blood flow allows segmental or regional assessment by ultrasound. The TDI method depicts myocardial motion (measured as tissue velocity) at specific locations in the heart. Tissue velocity indicates the rate at which a particular point in the myocardium moves toward or away from the transducer. Integration of velocity over time yields displacement or the absolute distance moved by that point. Although myocardial velocity curves can be constructed either online from spectral pulse TDI or offline from 2D color TDI, the latter approach is preferable, because multiple segments can be compared within the same heart beat. Further estimation of myocardial velocity gradient by TDI over a fixed region provides strain rate (rate of shortening or lengthening; Figs 13.14 and 13.15).

Fig. 13.16: Diagram depicting strain spectrum from mid-septum obtained by integrating myocardial velocity gradient and time over a fixed segment length. Strain is derived from color Doppler myocardial imaging.
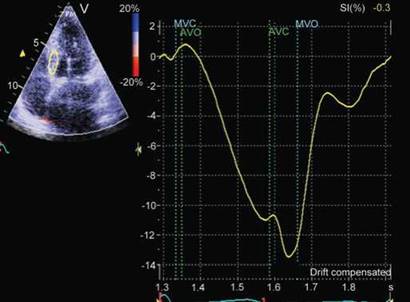
Fig. 13.17: Tissue Doppler imaging-derived strain spectrum from basal septum. Systolic strain is depicted in negative values (-11%). There is additional -3% post-systolic strain. Post-systolic strain has same significance as post-systolic velocity.
Time integral of the strain rate gives information about strain (amount of shortening, thickening or lengthening). Strain is dependent on preload, afterload, heart rate as well as state of contraction. It correlates best with dP/dt and to some extent with ejection fraction (Figs 13.16 and 13.17).
The validity of this approach for calculating strain has been confirmed by the use of sonomicrometry and tagged- magnetic resonance imaging as reference methods.
Tissue velocity per unit time provides regional myocardial acceleration. All these above mentioned parameters provide incremental assessment of the function of regional and global heart muscle in health and disease. TDI provided the greatest impetus to the study of these parameters based upon non-Doppler methods when limitations of TVI became obvious in certain situations. Despite its obvious limitations, angle dependency, inability to differentiate active versus passive motion and nondiagnostic information about radial or circumferential motion, it has found great utility in diagnosis, prognosis and guiding therapy of a large number of clinical conditions. Tissue velocity and strain data appear to be of optimal value if the images are acquired carefully, analysis is meticulous and the interpretation is judicious and balanced. In short, tissue velocity and strain echocardiography allow detailed interrogation of regional and global mechanics and offer substantial incremental information on myocardial function compared with conventional echocardiography.
Both techniques characterize fundamental concepts in
cardiac physiology and represent a paradigm shift in the
application of echocardiography in clinical practice.
TISSUE DOPPLER DATA PROCESSING FOR DEFORMATION IMAGING
• Strain rate is calculated with a sample volume distance of 8-12 mm.
• A 16-segment model of the left ventricle is used, i.e. each wall is subdivided into an apical, mid and basal segment.
• Strain rate curves are obtained from the center of the segment and velocity curves are obtained from the basal end.
• Wall motion is manually tracked to keep midwall position. ttree heart cycles are temporally averaged to improve the signal-to-noise ratio of the curves.
• Displacement and strain curves are calculated by integrating velocity and strain rate data, respectively, and are baseline-corrected.
• TVI and SRI curved M-modes can also be obtained from all walls.
• Timing of aortic and mitral valve opening (AVO, MVO) and closure (AVC, MVC) is derived from the echo recordings.
• TVI parameters are positive if the region of interest moves toward the transducer (for longitudinal velocities usually systole) and negative if it moves away

Fig. 13.18: Strain rate spectrum derived from basal lateral wall. Negative waveform during systole is integrated with time to obtain peak systolic strain. Note early diastolic strain rate, which is more than systolic strain rate and correlates with diastolic function.
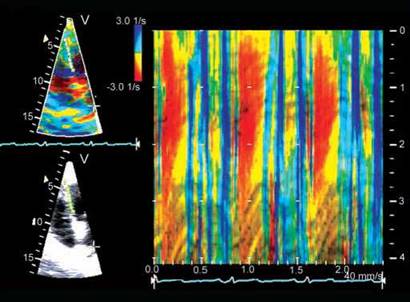
Fig. 13.19: Anatomical M-mode description of strain rate of the interventricular septum. Negative strain rate is shown red-orange, while blue color indicates positive strain rate. Green indicates no strain rate.
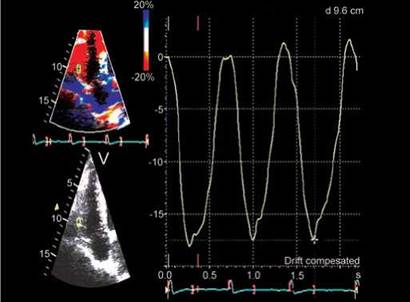
Fig. 13.20: Integration of strain rate with time to obtain strain of right ventricular free wall. Peak longitudinal strain is normally around -20% in left ventricular free wall and around -30% in right ventricular free wall (RVFW) and its peaks at end systole in health and in diastole in disease. Peak systolic strain of -17% of RVFW suggests RV dysfunction.
from it. SRI parameters are negative in shortening and positive in lengthening myocardium (Figs 13.18 to 13.20).
TDI has found clinical application in a large number of clinical situations. Of these, the important ones are listed below:
• Assessment of LV diastolic function and filling pressures
• Heart failure with normal ejection fraction (HFnEF)
• Assessment of early LV systolic dysfunction
• Constrictive pericarditis versus restrictive cardiomyopathy
• Physiological versus pathological hypertrophy
• Assessment of RV function
• Phenomenon of aging
• Study of exercise physiology
• Utility in stress echocardiography
• Study of atrial function
• Correlation with genomics in hypertrophic cardiomyopathy (HCM), Fabry disease, etcetera.
• Prognosis in various disease states
• Study of muscle mechanics
• Detection of intraventricular dyssynchrony
Left Ventricular Filling Pressure and Diastolic Function
The early diastolic velocity of the longitudinal motion of the mitral annulus (e') reflects the rate of myocardial relaxation (Fig. 13.21). In normal subjects, e' increases as transmitral gradient increases with exertion or increased preload, whereas in patients with impaired myocardial relaxation, e' is reduced at baseline and does not increase as much as in normal subjects with increased preload. Lateral annulus early diastolic velocity is usually higher than septal annulus e'. As e' increases with increasing transmitral gradient in healthy individuals, so that E/e' is similar at rest and with exercise (usually < 8).
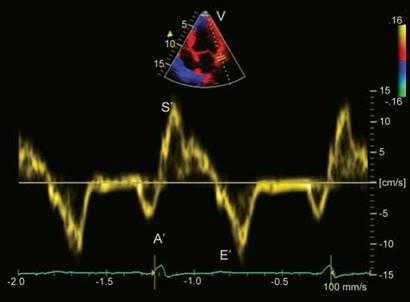
Fig. 13.21: Pulsed Doppler lateral edge mitral annular velocities in a 66-year-old subject with coronary artery disease. A ratio of e'/a' < 1 and e' 12 cm/s suggests normal left ventricular filling pressures and normal diastolic function.
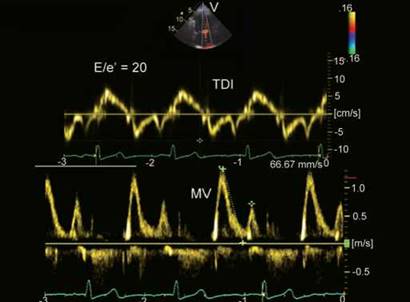
Fig. 13.22: Mitral annular velocities from medial edge (above) and transmitral pulsed wave Doppler flow pattern. Transmitral flow pattern can be normal or pseudonormal; however, reduced e' (7 cm/s) and E/e' ratio of 20 indicates Grade II diastolic dysfunction.

Fig. 13.23: Pulsed wave mitral flow Doppler (above) and medial mitral annular tissue velocities (below) in a 58-year-old hypertensive subject. E/e' is 10 and but e' < a' suggests presence of diastolic dysfunction.
Decreased e' is one of the earliest markers for diastolic dysfunction and is present in all stages of diastolic dysfunction. However, not everyone with impaired myocardial relaxation has physiologically significant diastolic dysfunction. Because e' velocity remains reduced and mitral E velocity increases with higher filling pressure, the ratio between transmitral E and e' (E/e') correlates well with LV filling pressure or pulmonary capillary wedge pressure (PCWP). the PCWP is > 20 mm Hg if E/e' is > 15 and normal if E/e' is < 8. Because PCWP has been shown to be a prognostic indicator in patients with heart failure (HF), it is reasonable to expect E/e' to be
a similarly powerful prognosticator in various cardiac diseases. However, e' is affected by adjacent wall motion abnormality.
Kasner et al. who have conducted extensive research correlating invasive versus noninvasive diastolic function using diastolic pressure-volume loops versus early diastolic tissue velocities have found e' and a' both to be robust and reliable methods of assessing diastolic dysfunction in health and disease. A combined data showing e' < a' and E' < 8 cm/s at lateral edge of mitral annulus correctly identifies 93% of the patients with invasively proven diastolic dysfunction.
the recent guidelines have included E/e' in grading of diastolic dysfunction and have made the following observations:
• Mitral annular septal E/e' > 15 and lateral E/e' > 12 are indicative of significant diastolic dysfunction (Fig. 13.22).
• An average (septal + lateral edge) E/e' > 13 can also be used as a marker of diastolic dysfunction.
• E/e' < 8 is indicative of normal diastolic function.
• E/e' of 9 to 14 is of borderline significance needing corroboration by other factors (Fig. 13.23).
• Overall, E/e' is the best predictor but does not have adequate discriminative power in isolation in predicting filling pressures.
TDI and Exercise Physiology: Heart Failure with Normal Ejection Fraction
Heart failure with normal ejection fraction is present in > 50% of all HF patients. the mortality and morbidity

Fig. 13.24: Lateral mitral annular velocities in a 33-year-old hypertensive female with dyspnea. e'lat (6 cm/s) and e'/a' (< 1) both are suggestive of heart failure with normal ejection fraction with nearly 93% accuracy.
of these patients may be quite elevated, and making the diagnosis accurately is important. the gold standard for assessing diastolic function remains the pressure- volume relationship, but it requires an invasive approach, ideally with a conductance catheter system. Doppler echocardiography and tissue Doppler imaging have been studied and validated in patients with systolic dysfunction and congestive HF and have been shown to be reliable in assessing filling pressures. Kasner et al. have shown TDI to be more accurate than conventional Doppler for detecting impaired diastolic function in patients with HFnEF.
• In general, the lateral annular velocities are more closely related to the LV relaxation and compliance indexes as determined by pressure-volume loop analysis than the septal annular velocities.
• TDI indexes e'lat and e'/a'lat correlate more closelywith LV stiffness than any conventional echocardiography index.
• Similarly, the dimensionless E/e' index shows the best correlation with indexes of diastolic parameters obtained by pressure-volume loop measurements.
• Patients with HFnEF and E/e'lat > 8 have significantly increased LV stiffness.
• Both E/e'lat > 8 and E'/a'lat < 1 detect HFnEF patients with diastolic abnormalities equally well, but e'/a'lat showed lower sensitivity, yielding more false-negative results than E/e'lat.
• Combination of E/e'lat and e'/a' can detect diastolic dysfunction in 93% of the patients with HFnEF (Fig. 13.24).
Garcia et al. and Meluzin et al. have demonstrated that the peak systolic mitral annular velocity (s') belongs to the most useful parameters for identifying HFnEF, having even a higher predictive value than the peak early diastolic mitral annular velocity (e'). the following potential predictors of HFnEF have been suggested by Meluzin et al.:
• Exercise s' < 10 cm/s with a sensitivity and specificity of 83%
• Exercise e' < 10 with a sensitivity of 60% and specificity of 87%
• Exercise E/e' > 9.5 cm/s with a sensitivity of 86% and specificity of 83%
• Rest E/e' > 8 cm/s with a sensitivity of 83% and specificity of 70%
• Rest s' < 8 cm/s with a sensitivity of 73% and specificity of 72%
Assessment of Left Ventricular Systolic Function
TDI s' wave represents contraction of longitudinal subendocardial fibers, which are most susceptible to any disease process and ischemia. Hence, reduced s' velocity is the earliest sign of LV systolic dysfunction.
Because the LV apex is stationary, simple M-mode measurement of mitral annulus excursion provides a useful and sensitive measure of ventricular function, which is rapidly affected by ischemia. the amplitude of long-axis motion during systole also correlates well with left ventricular ejection fraction (LVEF), which is also true for the right ventricle.
• Mitral and tricuspid annular systolic excursions have been measured by M-mode echocardiography to assess LV longitudinal function M-mode measurements of the mitral or tricuspid annulus amplitude are more laborious than measuring the peak systolic and diastolic velocities by TDI, and the time course of this movement is less readily obtained by M-mode.
• Peak myocardial systolic velocity averaged from six sites around the mitral annulus correlates well with LVEF, and a cut-off of > 7.5 cm/s had a sensitivity of 79% and a specificity of 88% in predicting normal global LV function.
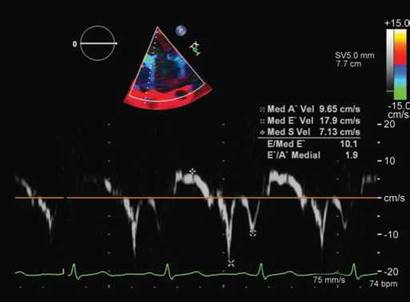
Fig. 13.25: Medial edge mitral annular velocities in a 64-year-old patient with asymptomatic severe mitral regurgitation. Note normal diastolic velocities but lower S' velocity suggestive of subclinical systolic dysfunction. There is paradoxically increased E' with decreased S'. This indicates that despite higher preload (increasing E'), left ventricular systolic function is depressed.

Fig. 13.26: Tissue Doppler imaging of lateral edge of the mitral annulus in a 42-year-old surgically proven case of constrictive pericarditis. Note prominent e' (> 26 cm/s) along with normal peak systolic velocity (14 cm/s). Accentuated e' is due to marked longitudinal expansion as transverse expansion is limited by the thick pericardial shell.
• Similar data with color Doppler myocardial velocities from four basal segments have defined a cut-off limit of 5 cm/s for ejection fraction of 50%.
• The peak systolic velocity is also a sensitive marker of mildly impaired LV systolic function, even in those with a normal LVEF or apparently preserved LV systolic function, such as 'diastolic heart failure,' or in diabetic subjects without overt heart disease.
• Reduced TDI velocities are present also in subjects with HCM mutations at a time of subclinical disease when cardiac hypertrophy is not present. Therefore, TDI can be used for early identification of HCM.
• In a group of asymptomatic patients with severe mitral regurgitation but normal ejection fraction, Agricola et al. showed that TDI of the lateral mitral annulus systolic velocity could predict those who would develop LVEF reduction after mitral valve surgery (Fig. 13.25). Similar observations have been made in patients with HF, post-transplant patients, etc.
• Peak annular or basal systolic velocities are strong predictors of outcome in several conditions. Wang et al. followed a cohort of 518 subjects (353 with cardiac disease and the rest normal) for 2 years after measuring the average mitral annular velocities from four sites (septal, lateral, anterior and inferior) from color-coded TDI. Cardiac mortality was significantly higher when both s' and e' were < 3 cm/s [hazard ratios (HRs) 7.5 and 5.3, respectively].
• There is a viewpoint that reduced s' (< 8 cm/s) itself in clinical syndrome of HF correctly characterizes cardiac origin of dyspnea regardless of ejection fraction or E/e'.
TDI in Constrictive Pericarditis and Restrictive Cardiomyopathy
Constrictive pericarditis presents like a syndrome of HF with essentially normal myocardial function except in advanced state wherein, subepicardial fibers may get involved. Pericardial constraint restricts transverse motion of the heart, but longitudinal motion is preserved. There is also some degree of RV dysfunction because of compression. However, it is the study of the left ventricle that gives clues about constriction in a patient with HF with normal LVEF but elevated filling pressures. In these patients, e' is preserved or even accentuated even though transmitral flow is restrictive (Fig. 13.26).
Therefore, E/e' ratio is normal in constrictive pericarditis while it is increased in other varieties of HF syndrome. This phenomenon has been labeled annulus paradoxus (Fig. 13.27). Several studies have reported that mitral annular e' > 8 cm/s can differentiate constrictive pericarditis from restrictive cardiomyopathy with a sensitivity and specificity of > 90%. A recent study has suggested an average of > 5.5 cm/s basal segment e' velocity to have 93% sensitivity in diagnosing constrictive pericarditis. In some patients with constriction, regional

Fig. 13.27: E/e' of 6 in a 42-year-old patient with surgically proven constrictive pericarditis. Normal E/e' in a subject with clinical syndrome of heart failure is called annulus paradoxus. Also respiratory variation in transmitral flow is noted.

Fig. 13.28: A 62-year-old male with idiopathic restrictive cardiomyopathy and atrial fibrillation. Upper panel shows transmitral Doppler flow, while the lower panel shows medial edge mitral annular velocities. Note markedly decreased e' (first of the two negative waveforms) and an E/e' of 35. Prominent biphasic waveform during isovolumic contraction shows a prominent negative component and a positive component before s'.
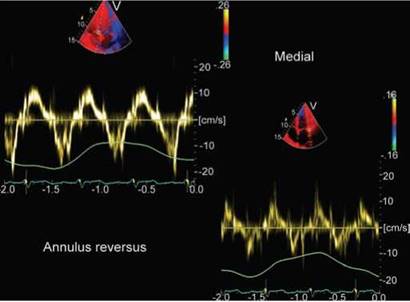
Fig. 13.29: Left and upper panel shows tissue velocities of the medial mitral annulus, while the right lower panel shows the lateral edge velocities, which are lower than at the medial edge (annulus reversus).
mitral annular velocities may be decreased because of concomitant myocardial disease, direct subepicardial and midmyocardial scarring, compromise of coronary arterial flow or pericardial calcification. It is, therefore, proposed that tissue Doppler imaging from more than one wall of the left ventricle would provide a more representative global measure of longitudinal LV mechanics.
Idiopathic restrictive cardiomyopathy as a clinical syndrome resembles constrictive pericarditis. However, e' is markedly reduced and annulus paradoxus is absent (Fig. 13.28).
Another tissue Doppler phenomenon mentioned in constrictive pericarditis is called 'annulus reversus'. Normally, septal edge mitral annular e' is lower than the lateral or free edge. In patients with constrictive pericarditis, the lateral wall gets tethered to the thick pericardium reducing its movements and hence e' recorded is lower on the lateral edge (Fig. 13.29).
Another tissue Doppler phenomenon observed in constrictive pericarditis is multiple diastolic polyphasic waveforms in the interventricular septum like diastolic fluttering observed during gray-scale imaging (Fig. 13.30). It has relatively high specificity for diagnosing constriction.
Significance of TDI in Right Ventricular Function
It is difficult to estimate right ventricular function because of its complex geometry. However, RV function has prognostic significance in coronary artery disease, pulmonary hypertension, congenital heart disease and in postoperative cases.
The primary function of the RV free wall is to move the atrioventricular valve ring toward the apex.
As compared with the evaluation of annular excursions, the Doppler tissue imaging approach is quicker, simpler and measurements can be made online within a very short time interval.
Tricuspid annular velocities may be widely used clinically because they can be obtained in nearly all patients, and systolic velocities are independent of age.

Fig. 13.30: Myocardial Doppler imaging of the interventricular septum in short axis in a patient with constrictive pericarditis. Note three positive waves during diastole. These can also be seen in radial velocities of the posterior wall.

Fig. 13.31: Pulsed wave tissue Doppler velocities from the free edge of the tricuspid annulus in a normal 40-year-old subject. Note the peak systolic velocity of 18 cm/s.
Fig. 13.32: Peak tricuspid annular systolic velocity of 7 cm/s in this patient of operated tetralogy of Fallot indicates presence of right ventricular dysfunction with an ejection fraction < 40%.
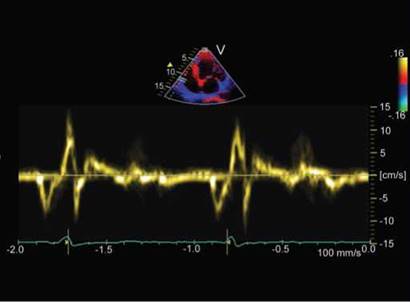
Fig. 13.33: A 66-year-old male with old inferior infarction and severe right ventricular dysfunction as shown by peak systolic velocity of 5 cm/s and early diastolic velocity of 2 cm/s. Largest biphasic velocity waveforms are during isovolumic contraction phase.
Tricuspid annular systolic velocities have found excellent correlation with mean pulmonary pressure and RV ejection fraction.
A cut-off value of peak tricuspid annular systolic velocity of 11.9 cm/s differentiates those with RV ejection fraction < 40% (Figs 13.31 to 13.33). Meluzin et al. reported that tricuspid annular systolic velocity offers obvious clinical benefit, enabling the prediction of RV dysfunction with a good sensitivity of 90% and a specificity
of 85% when a RV radionuclide ventriculographic ejection fraction of 45% was taken as cut-off limit.
As there is hardly any circumferential arrangement of fibers in the RV free wall, it is the s'2 velocity that represents systolic function during ejection (Fig. 13.32).
With onset of RV dysfunction, time-to-peak RV systolic velocity increases and marked separation of two systolic peaks can be a reasonable criterion of dysfunction but not as good as RV s' (Meluzin et al.) (Fig. 13.34).
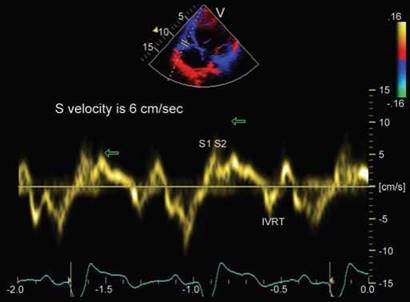
Fig. 13.34: Tricuspid annular tissue velocity profile in a 25-year-old female with hypoplastic right heart. Note separation of two systolic waveforms with systolic velocities of 6 cm/s and prominent biphasic isovolumic relaxation waveform.

Fig. 13.35: A 45-year-old farmer with unexplained left ventricular hypertrophy. s' > 12 cm/s and e' of 11 cm/s suggest that it is physiological hypertrophy with normally functioning longitudinal subendocardial fibers. The subject had global longitudinal strain of -30%.
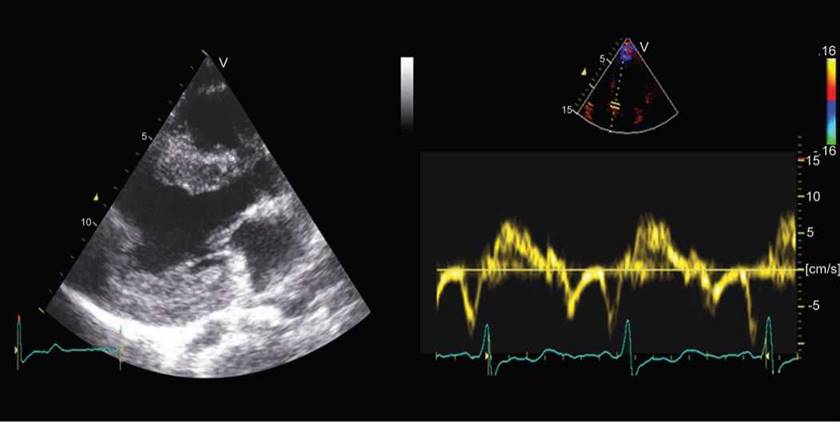
Fig. 13.36: Left panel is parasternal long-axis view showing markedly thick left ventricular walls in a 26-year-old asymptomatic woman who had closure of patent ductus arteriosus in early childhood. Medial mitral annular s' is 8 cm/s and e' is 6 cm/s suggesting pathological hypertrophy.
Physiological Versus Pathological Left Ventricular Hypertrophy
Distinguishing physiological adaptive LV hypertrophy (LVH) (Fig. 13.35) caused by exercise, as in athletes, from a pathological process, as in HCM (Fig. 13.36), is important. The key distinguishing feature of pathological versus physiological LVH is the presence of diastolic dysfunction.
Long-axis systolic and early diastolic velocities are decreased in patients with pathological hypertrophy but preserved in athletes.
• The best differentiation of pathological from physiological hypertrophy is provided by a mean systolic annular velocity < 9 cm/s (sensitivity 87%, specificity 97%).

Fig. 13.37: Conceptual tissue velocities in sarcomeric mutation- associated subclinical hypertrophic cardiomyopathy (HCM). An E' < 13 cm/s has been shown to have > 90% sensitivity and specificity.
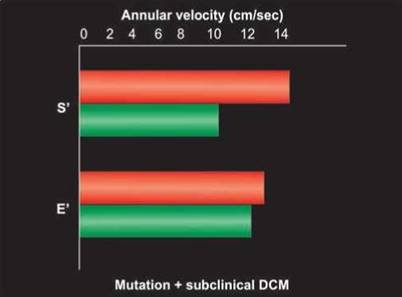
Fig. 13.38: Conceptual tissue velocities in (DCM) sarcomeric mutation -associated subclinical dilated cardiomyopathy. S' is significantly reduced but does not have enough predictive accuracy Source: Lakadwala et al. 2012.
• Mean early diastolic annular velocity < 9 cm/s has a sensitivity of 73% but specificity of 97% (Fig. 13.37).
• With increasing age, s' and e' velocities decrease and A' velocity increases. Hence, cut-off values for elderly people will be different. Aging and athletics both can cause LVH. No definite limits have been proposed for older subjects.
TDI in Inherited Cardiomyopathies
Sarcomeric mutations are responsible for familial cardiomyopathies that could be dilated, restrictive or hypertrophic varieties. Metrics of systolic and/or diastolic functions are reduced in carriers and subclinical disease. Distinct cellular pathways are triggered early in disease pathogenesis, based on how a mutation fundamentally alters sarcomere function. ttese pathways ultimately diverge to the development of HCM or dilated cardiomyopathy (DCM). Tissue velocities, strain rates and strain are reduced in cardiomyopathies and potentially could be used for preclinical detection of several inherited cardiomyopathies (Figs 13.34 and 13.35).
Systolic and diastolic velocities were significantly reduced in transgenic rabbits with HCM.
• Reduced systolic and diastolic velocities or reduced early diastolic velocities only have been demonstrated in patients with known mutations associated with HCM without ventricular hypertrophy.
• Mutation-positive carriers of DCM show reduced S' velocities with normal E' velocities (Fig. 13.38). ttis is
converse of what is seen in mutation-positive HCM carriers.
• Similarly, early diastolic strain rates are lower in HCM than in athletes or normal control subjects, and they are lower in restrictive than in normal or constrictive cardiomyopathy.
• Abnormal systolic and diastolic tissue velocities are reported in subclinical Fabry disease patients without ventricular hypertrophy. Systolic strain and strain rates improve after enzyme-replacement therapy in Fabry disease.
• Tissue velocities and strain rates are reduced in primary amyloidosis with and without evidence of cardiac involvement.
• Regional nonuniformity and paradoxical segmental strain in SRI is another way of detecting subclinical HCM (Fig. 13.39).
TDI in Detection of Intraventricular Dyssynchrony
Electromechanical delay is caused by delay of electrical propagation within the LV, resulting in mechanical dyssynchrony. During propagation of the electrical impulse in the LV, an area of functional electrical conduction delay usually occurs in the anterior wall. ttis results in a 'U-shaped' endocardial activation pattern that starts from the septum, curves around the apex and causes delayed activation of the LV free wall. These patients will have prolonged QRS duration, although this is not an
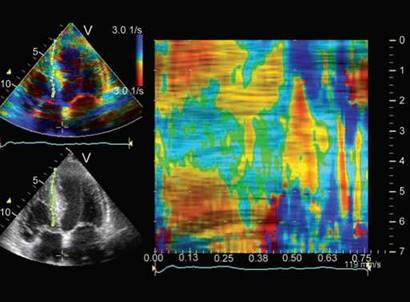
Fig. 13.39: Curved anatomical M-mode of strain rate imaging in an asymptomatic family member of a patient with hypertrophic cardiomyopathy. Note paradoxically positive strain rate in midseptum due to myofiber disarray coupled with negative strain rate in early diastole.

Fig. 13.40: Tissue synchronization imaging (a modification of TVI with colorization of graded delay in peak contraction). Peak velocity of the basal septum comes much earlier than that of lateral wall showing a septolateral delay of about 120 milliseconds during ejection phase.
exclusive phenomenon. In heart failure (HF) subjects, systolic dyssynchrony is potentially a marker for disease severity and may act as a prognosticator. Therefore, systolic dyssynchrony is now included as part of the HF assessment by echocardiography.
Echocardiography is the most widely used tool to assess mechanical dyssynchrony, and TDI has been found to be the most useful among different echocardiographic modalities. Although myocardial velocity curves can be constructed either online from spectral pulse TDI or offline from 2D color TDI, the latter approach is preferable, because multiple segments can be compared within the same heart beat (Fig. 13.40). To assess systolic dyssynchrony, the time-to-peak or onset of systolic velocity is measured from individual segments. In addition, other parameters of systolic dyssynchrony, such as strain dyssynchrony, can be derived from these raw data.
• Several reports have examined the significance of demonstrating mechanical dyssynchrony and its possible use in predicting response to cardiac resynchronization therapy (CRT).
• Almost all of these studies used TDI-based criteria to evaluate dyssynchrony and have generated a number of potential dyssynchrony indices.
• In general, these indices demonstrate either a time delay in mechanical activation between segments of the LV (septal to lateral wall delay in time-to-peak systolic tissue velocity) or substantial dispersion of mechanical activation (standard deviation of time-to- peak systolic tissue velocity).
A number of small, mostly single-center studies have suggested that a septal to lateral or opposing segment delay of 65 milliseconds predicts response to CRT. Similarly, a standard deviation of time-to-peak tissue velocity > 32 milliseconds of 12 basal and mid segments appears to predict response. Response in most studies was defined by clinical improvement and/ or presence of reverse remodeling as demonstrated by echocardiography.
In these small, nonrandomized, nonblinded and retrospective studies, the reported cut-off values appear to be superior to QRS duration and several other conventional echocardiographic parameters in predicting response to CRT.
These findings suggest that echo-derived parameters may be an efficient method of selecting patients for CRT.
More recently, however, two recent large, multicenter, prospective studies—Predictors of Response to CRT (PROSPECT) and Resynchronization Therapy in Narrow QRS Study (ReThinQ) used echocardiographic criteria to select patients for CRT and found no correlation between echo-based indices of mechanical dyssynchrony and CRT benefit, raising questions about the need for echocardiography in selecting patients for CRT. The relative value of TDI versus strain/strain rate in predicting response to resynchronization has not been fully resolved. Although these studies are limited by small numbers of patients, they provide no

Fig. 13.41: Measuring septolateral activation delay by color-coded Doppler imaging in a 70-year-old post-coronary artery bypass grafting patient with QRS duration of 140 milliseconds. Lack of dyssynchrony indicates that this patient is unlikely to improve with cardiac resynchronization therapy.
convincing evidence supporting the hypothesis that mechanical dyssynchrony predicts response to CRT.
• Tissue velocity signals are generally more robust than strain.
• However, in either parameter, it is not unusual to move the sample region minimally to find wide variations in signal quality with significant differences in amplitude and phase (timings), with obvious implications for its clinical implementation.
• With multiple lines of evidence to demonstrate its superiority in analysis of dyssynchrony, tissue velocity analysis can be used to select patients for CRT especially if standard criteria for CRT are not met or vice versa (Fig. 13.41).
Pulsed TDI traces may be challenging for timing measurements, because they often do not yield distinct peaks. Similarly, multiple systolic peaks in the TDI signal are often difficult to adjudicate. Although recommendations have been made that the earlier and larger of the peaks is the 'true' peak, this approach is not totally immune to error, because moving the sample often changes the amplitude and character of the peaks. the angle of insonation does influence timing of TDI events when angles exceed 20°.
ttere is controversy with regard to value of TVI versus strain imaging in detecting dyssynchrony. Yu et al. have not found it useful while Miyazaki et al. have shown better results with strain imaging. Time-to-peak strain was able
to differentiate patients with dyssynchrony better than TDI in Miyazaki's study. However, such data need further validation having come from small sample size.
Possibly a multifactor dyssynchrony score will likely emerge as the best predictor of response to CRT. This score will incorporate clinical factors, QRS duration and multiple imaging parameters. Imaging parameters may not be restricted to intraventricular dyssynchrony alone and may include flow Doppler and TDI measurements of interventricular dyssynchrony. Such an approach will likely reveal that the presence of myocardial dyssynchrony is a weighted component in this score and possibly a required substrate.
TDI in Coronary Artery Disease and Stress Echocardiography
Detection of myocardial ischemia by visual assessment of wall motion is fraught with variability and low reproducibility. Wall motion can be quantified by TDI or strain echocardiography, respectively.
• Low systolic tissue velocities correlate with angiographic or echocardiographic wall motion abnormality. Tissue velocities decrease with reduced regional perfusion, recover on reperfusion and differentiate between transmural and nontransmural infarction.
• Global systolic and diastolic performance by TDI (in terms of global s' and E/e') are negatively correlated to the number of vessels with significant stenoses.
• Both regional and global s' is significantly reduced in patients with three-vessels disease.
• Regional strain rates and strain are reduced in ischemia and infarction. Strain and strain rate identify infarcted segments and correlate with extent of transmural infarction and extent of ischemia (Figs 13.42 and 13.43).
• Strain and strain rate are less susceptible to cardiac translational motion and tethering. the term 'tethering' is used to describe the dragging of an akinetic basal segment toward the apex by normally functioning mid or apical segments. This theoretical advantage of strain/strain rate has been confirmed in the clinical setting.
• the stress response of TDI has been studied as an adjunct to wall motion scoring for the prediction of outcome in patients undergoing dobutamine stress echo. Color TVI and tissue tracking are performed in the basal and middle segments of the heart, the apex being ignored because tissue velocity in that

Fig. 13.42: Strain rate imaging in curved anatomical M-mode of the lateral wall at peak dobutamine dose during stress echocardiography. Note reduction and positivity of strain rate in mid and basal segments at heart rate of 148 beats/min, indicating ischemia.

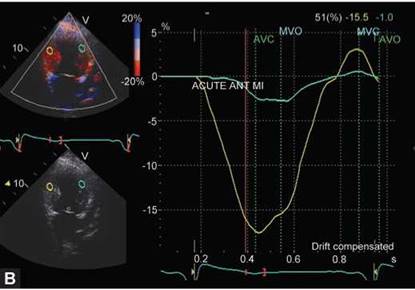

Figs 13.43A to C: Two-chamber view (2CV)-tissue Doppler imaging in a patient with acute anterior mycadial infarction (MI). Note markedly decreased peak systolic velocity (A); strain (B); and strain rate (C); of the mid-anterior wall along with delay in peaking of velocity and strain. Of note is that corresponding inferior wall segment shows reduced systolic velocity (2 cm/s, tethering effect) but nearly normal strain and strain rate (cut-off for abnormal strain is -13% and for strain rate -0.9 sec-1).
area is close to 0 (Fig. 13.44). Peak velocities derived from postprocessing of color images are averaged, to account for the contractile response not only in the area with abnormal wall motion but also the ability of remote segments to compensate.
• Typically, peak systolic velocities should increase > 2 cm/s in normal segments on exercise or during pharmacological stress. There should be increase or no change in early diastolic velocities. A decrease in e' on stress is suggestive of ischemia. However, at faster

Fig. 13.44: Response of basal septal segment to dobutamine stress. Peak velocity increases from 5 to 10 cm/s at heart rate of 144 beats/min, indicating normal response.
heart rates, early and late tissue velocities tend to fuse and make it difficult to assess e'.
• the average peak systolic velocity in patients with events is significantly lower than in those without events. Similarly, the average tissue displacement in patients with events is significantly lower than in those without events.
Post-systolic shortening evidenced either by TDI or strain imaging has been considered a marker of viability and ischemia when induced during stress. However, when present in resting state, its exact significance has not been clarified. Post-systolic strain and strain rate are sensitive indicators of myopathic or ischemic process, but specificity is modest.
PROGNOSTIC VALUE OF TDI IN DIVERSE CARDIAC DISORDERS
Tissue Doppler imaging is evolving as a useful echocardiographic tool for quantitative assessment of LV systolic and diastolic function. Recent studies have explored the prognostic role of TDI-derived parameters in major cardiac diseases, such as HF, acute myocardial infarction and hypertension. In these conditions, myocardial mitral annular or basal segmental (s') systolic and early diastolic (e') velocities have been shown to
predict mortality or cardiovascular events. In particular, those with reduced s' or e' values of < 3 cm/s have a very poor prognosis. In HF and after myocardial infarction, noninvasive assessment of LV diastolic pressure by transmitral to mitral annular early diastolic velocity ratio (E/e') is a strong prognosticator, especially when it is >
15. In addition, systolic intraventricular dyssynchrony measured by segmental analysis of myocardial velocities is another independent predictor of adverse clinical outcome in heart failure subjects, even when the QRS duration is normal. In HF patients who received CRT, the presence of systolic dyssynchrony at baseline is associated with favorable LV remodeling, which in turn predicts a favorable long-term clinical outcome. Finally, TDI and derived deformation parameters improve prognostic assessment during dobutamine stress echocardiography. A high mean systolic velocities value in the basal segments of patients with suspected coronary artery disease is associated with lower mortality rate or myocardial infarction and is superior to the wall motion score.
Tissue velocities of the interatrial septum atrial free wall and aorta are being studied in patients with aortic disorders and in atrial fibrillation. Study of aorta might help in understanding the physiology of aging, predilection for aortic aneurysms and so on. Atrial wall strain and strain
rate is being evaluated to detect who will maintain sinus rhythm following cardioversion in atrial fibrillation.
• A significant limitation of tissue Doppler imaging is marked angle dependency, more so than for other Doppler modalities. This is due to the fundamental difference between measurement of fluid velocities, where particles move freely, and tissue velocities in solid structures, where deformation in one direction is always associated with deformations in other directions to keep the mass of the structure constant.
• Other technical limitations include signal noise, signal drifting, spatial resolution, sample volume and tethering artifacts.
• Mitral annular velocities also can be reduced erroneously by mitral annular calcification, surgical rings or prosthetic valves.
• Regional myocardial tissue velocities represent the net effect of the contractile and elastic properties of the area under investigation and traction and tethering effects from other regions. Therefore, these do not necessarily represent intrinsic regional myocardial function.
• Because of cardiac motion and the lack of fixed reference points in the myocardium, it is not possible to maintain identical sampling points throughout the cardiac cycle. In this regard, the Doppler method is inferior to magnetic resonance tissue tagging.
• Strain rate signal derived by tissue Doppler has significant noise. This is mainly a result of random noise in the velocity signal, and this noise is magnified when differences are measured instead of absolute velocities.
Tissue velocity imaging has revolutionized the concept of parametric imaging in echocardiography. It offers the promise of an objective measure to quantify regional and global cardiac function through the assessment of myocardial velocity data. Besides definite clinical utility, there has been a phenomenal increase in our understanding of heart muscle mechanics, physical principles that it obeys and the complex geometric changes that accompany the heart motion.
In daily practice, tissue Doppler echocardiography (TDI or TVI) is used to estimate LV filling pressures, categorize diastolic dysfunction, identify patients with
HFnEF, differentiate constrictive pericarditis from restrictive cardiomyopathy, to prognosticate acute coronary syndrome, valvular heart disease, syndrome of HF, correlate exercise capacity and symptoms, differentiate physiological versus pathological hypertrophy, assess intraventricular dyssynchrony, regional and global systolic and diastolic properties, estimate of RV function and identify possible carriers of genetic cardiomyopathies like Fabry disease and HCM. Its role in adding incremental value to stress echocardiography, subclinical dysfunction evaluation, cardiac transplant rejection, cardiotoxicity of anticancer drugs, predicting occurrence and reversion of atrial fibrillation, predicting aortic catastrophies, and so on, although very encouraging, has not found many users. It was intuitively considered invaluable in detecting subclinical myocarditis, acute rheumatic fever, Chagas disease and localization of atrioventricular accessory pathways with manifest conduction, but could not find prime time readiness. In a similar manner, tissue-velocity-derived deformation parameters have not found prime time use despite making great inroads into the mysteries of muscle mechanics. Part of the problem lies in their emphasis on unidirectional information of a structure, which is essentially multidimensional. The other problems have been angle-dependency and low signal-to-noise ratio in deformation imaging, which has restricted its use to highly experienced operators rather than more democratic use. Validation studies did indicate its great potential. TDI-derived imaging paved the way for non-Doppler multidimensional deformation imaging, which is slowing gaining ground.
1. Agarwal R, Gosain P, Kirkpatrick JN, et al. Tissue Doppler imaging for diagnosis of coronary artery disease: a systematic review and meta-analysis. Cardiovasc Ultrasound. 2012;10(1):47. [Epub ahead of print].
2. Agricola E, Galderisi M, Oppizzi M, et al. Pulsed tissue Doppler imaging detects early myocardial dysfunction in asymptomatic patients with severe mitral regurgitation. Heart. 2004;90:406-10.
3. Alam M, Wardell J, Andersson E, et al. Effects of first myocardial infarction on left ventricular systolic and diastolic function with the use of mitral annular velocity determined by pulsed wave Doppler tissue imaging. J Am Soc Echocardiogr. 2000;13:343-52.
4. Armstrong G, Pasquet A, Fukamachi K, et al. Use of peak systolic strain as an index of regional left ventricular function: comparison with tissue Doppler velocity during dobutamine stress and myocardial ischemia. J Am Soc Echocardiogr. 2000;13:731-7.
5. Bax JJ, Abraham T, Barold SS, et al. Cardiac resynchronization therapy: part 1—issues before device implantation. J Am Coll Cardiol. 2005;46:2153-67.
6. Bax JJ, Bleeker GB, Marwick TH, et al. Left ventricular dyssynchrony predicts response and prognosis after cardiac resynchronization therapy. J Am Coll Cardiol. 2004;44: 1834-40.
7. Bhatia RS, Tu JV Lee DS, et al. Outcome of heart failure with preserved ejection fraction in a population-based study. N Engl J Med. 2006;355:260-9.
8. Bolognesi R, Tsialtas D, Barilli AL, et al. Detection of early abnormalities of left ventricular function by hemodynamic, echo-tissue Doppler imaging, and mitral Doppler flow techniques in patients with coronary artery disease and normal ejection fraction. J Am Soc Echocardiogr. 2001;14: 764-72.
9. Borlaug BA, Nishimura RA, Sorajja P, et al. Exercise hemodynamics enhance diagnosis of early heart failure with preserved ejection fraction. Circ Heart Fail. 2010;3: 588-95.
10. Borlaug BA, Olson TP, Lam CSP, et al. Global cardiovascular reserve dysfunction in heart failure with preserved ejection fraction. J Am Coll Cardiol. 2010;56:845-54.
11. Bruch CH, Gradaus R, Gunia S, et al. Doppler tissue analysis of mitral velocities: evidence for systolic abnormalities in patients with diastolic heart failure. J Am Soc Echocardiogr. 2003;16:1031-6.
12. Burgess MI, Jenkins C, Sharman JE, et al. Diastolic stress echocardiography: hemodynamic validation and clinical significance of estimation of left ventricular filling pressure with exercise. J Am Coll Cardiol. 2006;47:1891-900.
13. Chattopadhyay S, Alamgir MF, Nikitin NP, et al. Lack of diastolic reserve in patients with heart failure and normal ejection fraction. Circ Heart Fail. 2010;3:35-43.
14. Cho GY, Song JK, Park WJ, et al. Mechanical dyssynchrony assessed by tissue Doppler imaging is a powerful predictor of mortality in congestive heart failure with normal QRS duration. J Am Coll Cardiol. 2005;46:2237-43.
15. Dalen H, ttorstensen A, Vatten LJ, et al. Reference values and distribution of conventional echocardiographic Doppler measures and longitudinal tissue Doppler velocities in a population free from cardiovascular disease. Circ Cardiovasc Imaging. 2010;3(5):614-22.
16. Devereux RB, Alonso DR, Lutas EM, et al. Echocardio- graphic assessment of left ventricular hypertrophy: comparison to necropsy findings. Am J Cardiol. 1986;57:450-8.
17. Dokainish H, Sengupta R, Pillai M, et al. Assessment of left ventricular systolic function using echocardiography in patients with preserved ejection fraction and elevated diastolic pressures. Am J Cardiol. 2008;101:1766-71.
18. Dokainish H, Zoghbi WA, Lakkis NM, et al. Optimal noninvasive assessment of left ventricular filling pressures. A comparison of Tissue Doppler Echocardiography and B-Type natriuretic peptide in patients with pulmonary artery catheters. Circulation. 2004;109:2432-9.
19. Donovan CL, Armstrong WF, Bach DS. Quantitative Doppler tissue imaging of the left ventricular myocardium: validation in normal subjects. Am Heart J. 1995;130:100-4.
20. Doppler CJ. Ueber das farbige Licht der Doppelsterne und einiger anderer Gestirne des Himmels (About the coloured light of the binary stars and some other stars of the heavens). Abhandlungen der Konigl. Bohm. Gesells- chaft der Wissenschaften (V. Folge, Bd. 2, S. 465-482) [Proceedings of the Royal Bohemian Society of Sciences (Part V Vol 2)]; Prague: 1842 (Reissued 1903).
21. Edvardsen T, Aakhus S, Endresen K, et al. Acute regional myocardial ischemia identified by 2-dimensional multiregion tissue Doppler imaging technique. J Am Soc Echocardiogr. 2000;13:986-94.
22. Edvardsen T, Gerber BL, Garot J, et al. Quantitative assessment of intrinsic regional myocardial deformation by Doppler strain rate echocardiography in humans: validation against 3-dimensional tagged magnetic resonance imaging. Circulation. 2002;106:50-6.
23. Edvardsen T, Urheim S, Skulstad H, et al. Quantification of left ventricular systolig funktion by tissue Doppler echocardiography. Added value of measuring pre- and postejection velocities in ischemic myocardium. Circulation. 2002;105:2071-7.
24. Fang ZY, Leano R, Marwick TH. Relationship between longitudinal and radial contractility in subclinical diabetic heart disease. Clin Sci (Lond). 2004;106:53-60.
25. Firstenberg MS, Greenberg NL, Garcia MJ, et al. Relationship between ventricular contractility and early diastolic intraventricular pressure gradients: a diastolic link to systolic function. J Am Soc Echocardiogr. 2008;21:501-6.
26. Fukuda K, Oki T, Tabata T, et al. Regional left ventricular wall motion abnormalities in myocardial infarction and mitral annular descent velocities studied with pulsed tissue Doppler imaging. J Am Soc Echocardiogr. 1998;11:841-8.
27. Galiuto L, Ignone G, DeMaria AN. Contraction and relaxation velocities of the normal left ventricle using pulsed- wave tissue Doppler echocardiography. Am J Cardiol. 1998;81:609-14.
28. Garcia EH, Perna ER, Farias EF, et al. Reduced systolic performance by tissue Doppler in patients with preserved and abnormal ejection fraction: new insights in chronic heart failure. Int J Cardiol. 2006;108:181-8.
29. Garcia MJ, Rodriguez L, Ares M, et al. Myocardial wall velocity assessment by pulsed Doppler tissue imaging: characteristic findings in normal subjects. Am Heart J. 1996;132:648-56.
30. Garcia-Fernandez MA, Azevedo J, Moreno M, et al. Regional diastolic function in ischaemic heart disease using pulsed wave Doppler tissue imaging. Eur Heart J. 1999;20:496-505.
31. Gibson D, Mehmel H, Schwarz F, et al. Changes in left ventricular regional asynchrony after intracoronary thrombolysis in patients with impending myocardial infarction. Br Heart J. 1986;56:121-30.
32. Gibson DG, Doran JH, Traill TA, et al. Abnormal left ventricular wall movement during early systole in patients with angina pectoris. Br Heart J. 1978;40:758-66.
33. Gin PL, Wang WC, Yang SH, et al. Right heart function in systemic lupus erythematosus: insights from myocardial Doppler tissue imaging. J Am soc Echocardiogr. 2006;19:441-9.
34. Gondi S, Dokainish H. Right ventricular tissue Doppler and strain imaging: ready for clinical use? Echocardiography. 2007;245:522-32.
35. Gulati VK, Katz WE, Follansbee WP, et al. Mitral annular descent velocity by tissue Doppler echocardiography as an index of global left ventricular function. Am J Cardiol. 1996;77:979-84.
36. Gunnes S, Storaa C, Lind B, et al. Analysis of the effect of temporal filtering in myocardial tissue velocity imaging. J Am Soc Echocardiogr. 2004;17:1138-45.
37. Ha JW, Oh JK, Pellikka P, et al. Diastolic stress echocardiography: a novel noninvasive diagnostic test for diastolic dysfunction using supine bicycle exercise Doppler echocardiography. J Am Soc Echocardiogr. 2005;18:63-8.
38. Ha JW, Ommen SR, Tajik AJ, et al. Differentiation of constrictive pericarditis from restrictive cardiomyopathy using mitral annular velocity by tissue Doppler echocardiography. Am J Cardiol. 2004;94:316-9.
39. Hanekom L, Jenkins C, Jeffries L, et al. Incremental value of strain rate analysis as an adjunct to wall-motion scoring for assessment of myocardial viability by dobutamine echocardiography: a follow-up study after revascularization. Circulation. 2005;112:3892-900.
40. Hasegawa H, Little WC, Ohno M, et al. Diastolic mitral annular velocity during the development of heart failure. J Am Coll Cardiol. 2003;41:1590-7.
41. Heimdal A, Stylen A, Torp H, et al. Real-time strain rate imaging of the left ventricle by ultrasound. J Am Soc Echocardiogr. 1998;11:1013-9.
42. Hillis GS, Moller JE, Pellikka PA, et al. Noninvasive estimation of left ventricular filling pressure by E/E' is a powerful predictor of survival after acute myocardial infarction. J Am Coll Cardiol. 2004;43:360-7.
43. Ho CY, Sweitzer NK, McDonough B, et al. Assessment of diastolic function with Doppler tissue imaging to predict genotype in preclinical hypertrophic cardiomyopathy. Circulation. 2002;105:2992-7.
44. Hoffmann S, Mogelvang R, Olsen NT, et al. Tissue Doppler echocardiography reveals distinct patterns of impaired myocardial velocities in different degrees of coronary artery disease. Eur J Echocardiogr. 2010;11(6):544-9.
45. Holland DJ, Prasad SB, Marwick TH. Prognostic implications of left ventricular filling pressure with exercise. Circ Cardiovasc Imaging. 2010;3:149-56.
46. Isaaz K, Thompson A, Ethevenot G, et al. Doppler echo- cardiographic measurement of low velocity motion of left ventricular posterior wall. Am J Cardiol. 1989;64:66-75.
47. Isaaz K, Thompson A, Ethevenot G, et al. Doppler echocardiographic measurement of low velocity motion of the left ventricular posterior wall. Am J Cardiol. 1989;64:66-75.
48. Kamisago M, Sharma SD, DePalma SR, et al. Mutations in sarcomere protein genes as a cause of dilated cardiomyopathy. N Engl J Med. 2000;343:1688-96.
49. Kasner M, Westermann D, Steendijk P, et al. Utility of Doppler echocardiography and tissue Doppler imaging in the estimation of diastolic function in heart failure with
normal ejection fraction: a comparative Doppler-conduct- ance catheterization study. Circulation. 2007;116:637-47.
50. Kukulski T, Voigt JU, Wilkenshoff UM, et al. A comparison of regional myocardial velocity information derived by pulsed and colour Doppler techniques: an in vitro and in vivo study. Echocardiography. 2000;17:639-51.
51. Lam CSP, Roger VL, Rodeheffer RJ, et al. Pulmonary hypertension in heart failure with preserved ejection fraction. A community-based study. J Am Coll Cardiol. 2009;53:1119-26.
52. Lang RM, Bierig M, Devereux RB, et al. Recommendations for chamber quantification. Eur J Echocardiogr. 2006;7: 79-108.
53. Lind B, Nowak J, Dorph J, et al. Analysis of temporal requirements for myocardial tissue velocity imaging. Eur J Echocardiogr. 2002;3:214-9.
54. Lui EY, Steinman AH, Cobbold RS, et al. Human factors as a source of error in peak Doppler velocity measurement. J Vasc Surg. 2005;42:972-9.
55. Madler CF, Payne N, Wilkenshoff U, et al. Non-invasive diagnosis of coronary artery disease by quantitative stress echocardiography: optimal diagnostic models using offline tissue Doppler in the MYDISE study. Eur Heart J. 2003;24:1584-94.
56. Maeder MT, Thompson BR, Brunner-La Rocca HP, et al. Hemodynamic basis of exercise limitation in patients with heart failure and normal ejection fraction. J Am Coll Cardiol. 2010;56:855-63.
57. Marsan NA, Westenberg J, Ypenburg C, et al. Head-to-head comparison between tissue doppler imaging and velocity encoded magnetic resonance imaging for the measurement of myocardial velocities and the assessment of left ventricular dyssynchrony and diastolic function. Circulation. 2007;116:II-460.
58. Marwick TH, Case C, Leano R, et al. Use of tissue Doppler imaging to facilitate the prediction of events in patients with abnormal left ventricular function by dobutamine echocardiography. Am J Cardiol. 2004;93:142-6.
59. McCall R, Stoodley PW, Richards DA, et al. Restrictive cardiomyopathy versus constrictive pericarditis: making the distinction using tissue Doppler imaging. Eur J Echo- cardiogr. 2008;9:591-4.
60. McCulloch M, Zoghbi WA, Davis R, et al. Color tissue Doppler myocardial velocities consistently underestimate spectral tissue Doppler velocities: impact on calculation peak transmitral pulsed Doppler velocity/early diastolic tissue Doppler velocity (E/Ea'). J Am Soc Echocardiogr. 2006;19:744-8.
61. McCulloch M, Zoghbi WA, Davis R, et al. Colour tissue Doppler myocardial velocities consistently underestimate spectral tissue Doppler velocities: impact on calculation peak transmitral pulsed Doppler velocity/early diastolic tissue Doppler velocity (E/Ea). J Am Soc Echocardiogr. 2006;19:744-8.
62. McDicken WN, Sutherland GR, Moran CM, et al. Colour Doppler velocity imaging of the myocardium. Ultrasound Med Biol. 1992;18:651-4.
63. Meluzin J, Spinarova L, Hude P, et al. Left ventricular mechanics in idiopathic dilated cardiomyopathy: systolic- diastolic coupling and torsion. J Am Soc Echocardiogr. 2009;22:486-93.
64. Miyazaki C, Powell BD, Bruce CJ, et al. Comparison of echocardiographic dyssynchrony assessment by tissue velocity and strain imaging in subjects with or without systolic dysfunction and with or without left bundle-branch block. Circulation. 2008; 117:2617-25.
65. Mullens W, Borowski AG, Curtin RJ, et al. Tissue Doppler imaging in the estimation of intracardiac filling pressure in decompensated patients with advanced systolic heart failure. Circulation. 2009;119:62-70.
66. Nagueh SF, Appleton CP, Gillebert TC, et al. Recommendations for the evaluation of left ventricular diastolic function by echocardiography. J Am Soc Echocardiogr. 2009;22: 107-33.
67. Nagueh SF, Bachinski LL, Meyer D, et al. Tissue Doppler imaging consistently detects myocardial abnormalities in patients with hypertrophic cardiomyopathy and provides a novel means for an early diagnosis before and independently of hypertrophy. Circulation. 2001;104:128-30.
68. Nagueh SF, Middleton KJ, Kopelen HA, et al. Doppler tissue imaging: a noninvasive technique for evaluation of left ventricular relaxation and estimation of filling pressures. J Am Coll Cardiol. 1997;30(6):1527-33.
69. Nagueh SF, Sun H, Kopelen HA, et al. Hemodynamic determinants of the mitral annulus diastolic velocities by tissue Doppler. J Am Coll Cardiol. 2001;37:278-85.
70. Ng ACT, Delgado V Bertini M, et al. Findings from left ventricular strain and strain rate imaging in asymptomatic patients with type 2 diabetes mellitus. Am J Cardiol. 2009; 104:1398-1401.
71. Oki T, Tabata T, Mishiro Y, et al. Pulsed tissue Doppler imaging of left ventricular systolic and diastolic wall motion velocities to evaluate differences between long and short axes in healthy subjects. J Am Soc Echocardiogr. 1999;12:308-13.
72. Ommen S, Nishimura RA, Appleton CP, et al. Clinical utility of Doppler echocardiography and tissue Doppler imaging in the estimation of left ventricular filling pressures: a comparative simultaneous Doppler-catheteri- zation study. Circulation. 2000;102:1788-94.
73. Owan TE, Hodge DO, Herges RM, et al. Trends in prevalence and outcome of heart failure with preserved ejection fraction. N Engl J Med. 2006;355:251-9.
74. Pai RG, Bodenheimer MM, Pai SM, et al. Usefulness of systolic excursion of the mitral annulus as an index of left ventricular systolic function. Am J Cardiol. 1991;67:222-4.
75. Palka P, Lange A, Donnelly JE, et al. Differentiation between restrictive cardiomyopathy and constrictive pericarditis by early diastolic Doppler myocardial velocity gradient at the posterior wall. Circulation. 2000;102:655-62.
76. Palka P, Lange A, Fleming AD, et al. Doppler tissue imaging: myocardial wall motion velocities in normal subjects. J Am Soc Echocardiogr. 1995;8:659-68.
77. Palmes PP, Masuyama T, Yamamoto K, et al. Myocardial longitudinal motion by tissue velocity imaging in the evaluation of patients with myocardial infarction. J Am Soc Echocardiogr. 2000;13:818-26.
78. Pasquet A, Armstrong G, Beachler L, et al. Use of segmental tissue Doppler velocity to quantitate exercise echocardiography. J Am Soc Echocardiogr. 1999;12:901-12.
79. Paulus WJ, Tschope C, Sanderson JE, et al. How to diagnose diastolic heart failure: a consensus statement on the diagnosis of heart failure with normal left ventricular ej ection fraction by the Heart Failure and Echocardiography Associations of the European Society of Cardiology. Eur Heart J. 2007;28:2539-50.
80. Pavlopoulos H, Grapsa J, Stefanadi E, et al. Is it only diastolic dysfunction? Segmental relaxation patterns and longitudinal systolic deformation in systemic hypertension. Eur J Echocardiogr. 2008;9:741-7.
81. Penicka M, Bartunek J, Trakalova H, et al. Heart failure with preserved ejection fraction in outpatients with unexplained dyspnea. A pressure-volume loop analysis. J Am Coll Cardiol. 2010;55:1701-10.
82. Peteiro J, Pazos P, Bouzas A, et al. Assessment of diastolic function during exercise echocardiography: annulus mitral velocity or transmitral flow pattern? J Am Soc Echocardiogr. 2008;21:178-84.
83. Phan TT, Abozguia K, Shivu GN, et al. Heart failure with preserved ejection fraction is characterized by dynamic impairment of active relaxation and contraction of the left ventricle on exercise and associated with myocardial energy deficiency. J Am Coll Cardiol. 2009;54:402-9.
84. Pieroni M, Chimenti C, Ricci R, et al. Early detection of Fabry cardiomyopathy by tissue Doppler imaging. Circulation. 2003;107:1978-84.
85. Podolec P, Rubis P, Tomkiewicz-Pajak L, et al. Usefulness of the evaluation of left ventricular diastolic function changes during stress echocardiography in predicting exercise capacity in patients with ischemic heart failure. J Am Soc Echocardiogr. 2008;21:834-40.
86. Puwanant S, Priester TC, Mookadam F, et al. Right ventricular function in patients with preserved and reduced ejection fraction heart failure. Eur J Echocardiogr. 2009;10: 733-7.
87. Redfield MM, Jacobsen SJ, Burnett JC, et al. Burden of systolic and diastolic ventricular dysfunction in the community. J Am Med Assoc. 2003;289:194-202.
88. Richartz BM, Werner GS, Ferrari M, et al. Comparison of left ventricular systolic and diastolic function in patients with idiopathic dilated cardiomyopathy and mild heart failure versus those with severe heart failure. Am J Cardiol. 2002;90:390-4.
89. Rossi D, Pinna GD, La Rovere MT, et al. Prognostic significance of tissue-Doppler imaging in chronic heart failure patients on transplant waiting list: a comparative study with right heart catheterization Eur Heart J Cardiovasc Imaging. 2011;12:112-9.
90. Sanderson JE. Heart failure with a normal ejection fraction. Heart. 2007;93:155-8.
91. Satomura S. Ultrasonic Doppler method for the inspection of cardiac function. J Acoust Soc Am. 1957;29(11):1181-5.
92. Sengupta PP, Khandheria BK, Korinek J, et al. Biphasic tissue Doppler waveforms during isovolumic phases are associated with asynchronous deformation of subendocardial and subepicardial layers. J Appl Physiol. 2005;99:1104-11.
93. Sengupta PP, Khandheria BK, Narula J. Twist and untwist mechanics of the left ventricle. Heart Fail Clin. 2008;4: 315-24.
94. Sengupta PP, Krishnamoorthy VK, Abhayaratna WP, et al. Comparison of usefulness of tissue Doppler imaging versus brain natriuretic peptide for differentiation of constrictive pericardial disease from restrictive cardiomyopathy. Am J Cardiol. 2008;102:357-62.
95. Sengupta PP, Krishnamoorthy VK, Korinek J, et al. Left ventricular form and function revisited: applied translational science to cardiovascular ultrasound imaging. J Am Soc Echocardiogr. 2007;20:539-51.
96. Sengupta PP, Mehta V Arora R, et al. Quantification of regional nonuniformity and paradoxical intramural mechanics in hypertrophic cardiomyopathy by high frame rate ultrasound myocardial strain mapping. J Am Soc Echocardiogr. 2005;18:737-42.
97. Sengupta PP, Mohan JC, Mehta V, et al. Accuracy and pitfalls of early diastolic motion of the mitral annulus for diagnosing constrictive pericarditis by tissue Doppler imaging. Am J Cardiol. 2004;93:886-90.
98. Sengupta PP, Mohan JC, Pandian NG. Tissue Doppler echocardiography: principles and applications. Indian Heart J. 2002;54(4):368-88.
99. Sengupta PP, Tondato F, Khandheria BK, et al. Electromechanical activation sequence in normal heart. Heart Fail Clin. 2008;4:303-14.
100. Skaluba SJ, Litwin SE. Mechanisms of exercise intolerance. Insights from tissue Doppler imaging. Circulation. 2004;109:972-7.
101. Sohn DW, Chai IH, Lee DJ, et al. Assessment of mitral annulus velocity by Doppler tissue imaging in the evaluation of left ventricular diastolic function. J Am Coll Cardiol. 1997;30:474-80.
102. Sohn DW, Chai IH, Lee DJ, et al. Assessment of mitral annulus velocity by Doppler tissue imaging in the evaluation of left ventricular diastolic function. J Am Coll Cardiol. 1997;30:474-80.
103. Strotmann JM, Richter A, Kukulski T, et al. Doppler myocardial imaging in the assessment of regional myocardial function in longitudinal direction pre- and post-PTCA. Eur J Echocardiogr. 2001;2:178-86.
104. Sutherland GR, Bijnens B, McDicken WN. Tissue Doppler echocardiography: historical perspective and technological considerations. Echocardiography. 1999;16:445-53.
105. Sutherland GR, Stewart MJ, Groundstroem KW, et al. Color Doppler myocardial imaging: a new technique for the assessment of myocardial function. J Am Soc Echocardiogr. 1994;7:441-5.
106. Swain DP, Leutholtz BC. Exercise prescription. A case Study Approach to the ACSM Guidelines, 2nd edition. Human Kinetics; 2007: p.208.
107. Takamura T, Dohi K, Onishi K, et al. Left ventricular contraction-relaxation coupling in normal, hypertrophic, and failing myocardium quantified by speckle-tracking global strain and strain rate imaging. J Am Soc Echocardiogr. 2010; 23:747-54.
108. Tan YT, Wenzelburger F, Lee E, et al. The pathophysiology of heart failure with normal ejection fraction. Exercise echocardiography reveals complex abnormalities of both systolic and diastolic ventricular function involving torsion, untwist, and longitudinal motion. J Am Coll Cardiol. 2009;54:36-46.
109. Tanaka M, Fujiwara H, Onodera T, et al. Quantitative analysis of myocardial fibrosis in normals, hypertensive hearts, and hypertrophic cardiomyopathy. Br Heart J. 1986;55: 575-81.
110. Urheim S, Edvardsen T, Torp H, et al. Myocardial strain by Doppler echocardiography: validation of a new method to quantify regional myocardial function. Circulation. 2000;102:1158-64.
111. Vinereanu D, Florescu N, Sculthorpe N, et al. Differentiation between pathologic and physiologic left ventricular hypertrophy by tissue Doppler assessment of long-axis function in patients with hypertrophic cardiomyopathy or systemic hypertension and in athletes. Am J Cardiol. 2001;88(1): 53-8.
112. Vinereanu D, Khokhar A, Fraser AG. Reproducibility of pulsed wave tissue Doppler echocardiography. J Am Soc Echocardiogr. 1999;12:492-9.
113. Vinereanu D, Nicolaides E, Tweddel AC, et al. “Pure" diastolic dysfunction is associated with long-axis systolic dysfunction. Implications for the diagnosis and classification of heart failure. Eur J Heart Fail. 2005;7:820-8.
114. Voigt JU, Arnold MF, Karlsson M, et al. Assessment of regional longitudinal myocardial strain rate derived from Doppler myocardial imaging indices in normal and infarct- ed myocardium. J Am Soc Echocardiogr. 2000;13:588-98.
115. Waggoner AD, Bierig SM. Tissue Doppler imaging: a useful echocardiographic method for the cardiac sonographer to assess systolic and diastolic ventricular function. J Am Soc Echocardiogr. 2001;14:1143-52.
116. Wang M, Yip G, Yu CM, et al. Independent and incremental prognostic value of early mitral annulus velocity in patients with impaired left ventricular systolic function. J Am Coll Cardiol. 2005;45:272-7.
117. Wang M, Yip GW, Wang AY, et al. Peak early diastolic mitral annulus velocity by tissue Doppler imaging adds independent and incremental prognostic value. J Am Coll Cardiol. 2003;41:820-6.
118. Wang M, Yip GW, Wang AY, et al. Tissue Doppler imaging provides incremental prognostic value in patients with systemic hypertension and left ventricular hypertrophy. J Hypertens. 2005;23:183-91.
119. Weidemann F, Breunig F, Beer M, et al. Improvement of cardiac function during enzyme replacement therapy in patients with Fabry disease: a prospective strain rate imaging study. Circulation. 2003;108:1299-301.
120. Weidemann F, Herrmann S, Stork S, et al. Impact of myocardial fibrosis in patients with symptomatic severe aortic stenosis. Circulation. 2009;120:577-84.
121. Weidemann F, Kowalski M, D'Hooge J, et al. Doppler myocardial imaging: a new tool to assess regional inhomogeneity in cardiac function. Basic Res Cardiol. 2001;96:595-605.
122. Wierzbowska-DrabikK, Krzeminska-Pakula M,Chrzanowski L, et al. Age-dependency of classic and new parameters of diastolic function. Echocardiography. 2008;25:149-55.
123. Wilkenshoff UM, Sovany A, Wigstrom L, et al. Regional mean systolic myocardial velocity estimation by real-time colour Doppler myocardial imaging: a new technique for quantifying regional systolic function. J Am Soc Echocardiogr. 1998;11:683-92.
124. Yip G, Wang M, Zhang Y, et al. Ho PY, Sanderson JE. Left ventricular long axis function in diastolic heart failure is reduced in both diastole and systole: time for a redefinition? Heart. 2002;87:121-5.
125. Yu CM, Bleeker GB, Fung JW, et al. Left ventricular reverse remodeling but not clinical improvement predicts longterm survival after cardiac resynchronization therapy. Circulation. 2005;112:1580-6.
126. Yu CM, Jung JW, Zhang Q, et al. Tissue Doppler imaging is superior to strain rate imaging and postsystolic shortening on the prediction of reverse remodeling in both ischemic and nonischemic heart failure after cardiac resynchronization therapy. Circulation. 2004;110:66-73.
127. Yu CM, Lin H, Ho PC, et al. Assessment of left and right ventricular systolic and diastolic synchronicity in normal subjects by tissue Doppler echocardiography and the effects of age and heart rate. Echocardiography. 2003;20:19-27.
128. Yu CM, Lin H, Zhang Q, et al. High prevalence of left ventricular systolic and diastolic asynchrony in patients with congestive heart failure and normal QRS duration. Heart. 2003;89:54-60.