
Mitral valve regurgitation (MR) is the second commonest valvular lesion. Incidence is on the rise due to age-related degenerative valvulopathy and functional regurgitation secondary to ischemic heart disease and heart failure. MR could be as a result of structural valve pathology or due to involvement of the support system of the mitral valve (MV) complex. Echocardiography plays a pivotal role in diagnosis, assessing severity and mechanism of regurgitation, choice of therapy and follow-up of these patients. Clinical examination misses more than 50% cases of MR, and echocardiography remains the only bedside modality for its accurate diagnosis.
MV apparatus consists of (Fig. 4.1):
• Two leaflets
• Annulus
• Tendinous chords
• Papillary muscles
• Left atrial (LA) musculature adjacent to the valve ring
• Left ventricular (LV) musculature adjoining the origin of papillary muscles.
Complete closure (coaptation) and correct apposition (symmetrical overlap, usually a minimum of 4-5 mm) of both leaflets is essential in preventing regurgitation.

Moving units of the atrioventricular valves are described as leaflets. The normal MV has two leaflets (each with a thickness about 1 mm) that are attached at their bases to the fibromuscular ring and by their free edges to the subvalvular apparatus.1-4 The posterior leaflet has a quadrangular shape and is attached to approximately two thirds of the annular circumference; the anterior leaflet attaches to the remaining one-third (Fig. 4.2).
The posterior leaflet typically has two well-defined indentations that divide the leaflet into three individual scallops identified as P1, P2 and P3.5

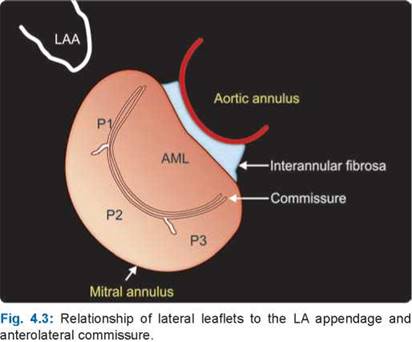
the P1 scallop corresponds to the external, anterolateral portion of the posterior leaflet, close to the anterior commissure and the left atrium appendage (Fig. 4.3). The P2 scallop is in the middle and more developed. the P3 scallop is internal, close to the posterior commissure and the tricuspid annulus.
the anterior leaflet has a semicircular shape and is in continuity with the noncoronary cusp of the aortic valve, referred to as the intervalvular fibrosa. The free edge of the anterior leaflet is usually continuous, without indentations. It is artificially divided into three portions

A1, A2 and A3, corresponding to the posterior scallops P1, P2 and P3.
The commissures define a distinct area where the anterior and posterior leaflets come together at their insertion into the annulus (Fig. 4.3).
Sometimes, the commissures exist as well-defined leaflet segments (commissural scallops), but more often this area is a subtle region. When the MV is closed, the line of contact between the leaflets is termed coaptation line and the region of leaflet overlap is called the zone of apposition (Fig. 4.4).


Typical length of anterior mitral leaflet is 25 mm and that of posterior leaflet is about 14 mm.
The mitral annulus constitutes the anatomical junction between the LV and the LA, and serves as insertion site for the leaflet tissue. It is oval and saddle shaped. The anterior portion of the mitral annulus is attached to the fibrous trigones and is generally more developed than the posterior annulus. Both parts of the annulus may dilate in pathologic conditions. The anterior-posterior diameter can be measured using real-time three-dimensional (3D) or by conventional two-dimensional (2D) parasternal long-axis view. The diameter is compared with the length of the anterior leaflet measured in diastole. Annular dilatation is present when the ratio annulus/anterior leaflet is more than 1.3 or when the diameter is more than 35 mm. The presence and extent of annular calcification is an important parameter. The normal motion and contraction of the mitral annulus also contributes to maintaining valve competence. The normal contraction of the mitral annulus (decrease in annular area in systole) is 25% (Fig. 4.5).
The annulus not only serves as a fulcrum for the leaflets but also exhibits sphincteric contraction in systole that decreases the size of the orifice and prevents mitral regurgitation.
There are three sets of chordae arising from the papillary muscles. They are classified according to their site of insertion between the free margin and the base of leaflets (Fig. 4.6).
• Marginal chordae (primary chordae) are inserted on the free margin of the leaflets and function to prevent prolapse of the leaflet margin.
• Intermediate chordae (secondary chordae) insert on the ventricular surface of the leaflets and relieve valvular tissue of excess tension. Often two large secondary or 'strut' chordae can be individualized. They may be important in preserving ventricular shape and function.
• Basal chordae (tertiary chordae) are limited to the posterior leaflet and connect the leaflet base and mitral annulus to the papillary muscle.
Additional commissural chordae arise from each papillary muscle. Rupture, calcification, fusion or redundancy of the chordae can lead to regurgitation.
Mitral regurgitation due to chordal abnormalities also results from chordae that are abnormally long, abnormally short, ectopically inserted or ruptured.
MV competence in normal hearts is achieved by:
• Systolic reduction in the LV volume (closing force acting on the leaflets)
• LV length shortening letting the leaflets float back (about 15%)
• Interpapillary muscle distance shortening bringing the leaflets close to each other
• Annular diameter shortening in systole
• Longitudinal shortening of the papillary muscles (about 25%)


• At end-systole, the anterior MV leaflet is 20% shorter due to folding at the coaptation point.
Carpentier's functional classification describes leaflet motion in relation to the mitral annular plane.6
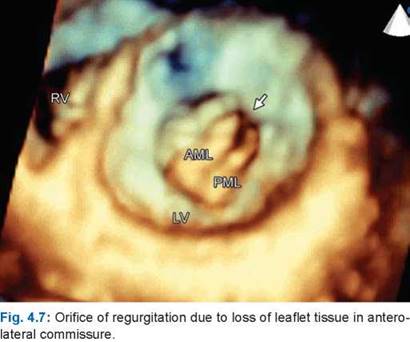
Type 1: Describes normal leaflet motion. Mitral regurgitation is due to either perforation of the leaflet, such as trauma or endocarditis, or annular dilatation, usually the result of left ventricular disease (Figs 4.7 to 4.9).
Type 2: Describes excessive leaflet motion above the annular plane into the left atrium and is a result of leaflet prolapse usually the result of degenerative disease (Fig. 4.10).
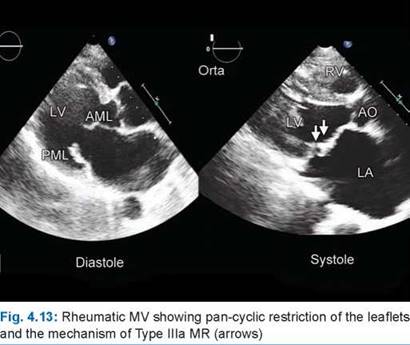
Type 3: Describes leaflet restriction and is categorized into two types; Type 3a, where the restriction is throughout the cardiac cycle, that is, in systole and diastole (usually the result of rheumatic valve disease), and Type 3b, where the leaflet restriction is seen in systole alone (Fig. 4.11 to 4.14).
MR can be primary, wherein valve leaflets are primarily involved, or secondary in which the valve leaflets are apparently normal. Secondary MR is also called the functional MR.



• Degenerative (60%)
• Rheumatic (postinflammatory)
• Functional and ischemic MR (25%)
• Congenital abnormalities (parachute MV cleft or hole)
• Infective endocarditis
• Miscellaneous (hypertrophic cardiomyopathy, endomyocardial fibrosis, SLE, etc.)
The term “degenerative” covers a range of abnormalities and includes Marfan's and Ehlers-Danlos syndromes,
fibroelastic degeneration, myxomatous valvulopathy and so forth.
Changes in the valves include thickening and stretching (due to disruption of the structural collagen core) of the leaflet tissue. The abnormal leaflets can become twice as extensible (Fig. 4.15).
A spectrum from a single segment of one leaflet through to all segments of both leaflets may be involved. The former has been coined “fibroelastic deficiency” by Carpentier (Fig. 4.16), whereas the latter describes Barlow's disease with myxomatous-type leaflets .7
In fibroelastic deficiency, often the prolapsing segment is relatively normal in appearance; the prolapse being the result of focal chordal elongation with or without rupture (Fig. 4.17).


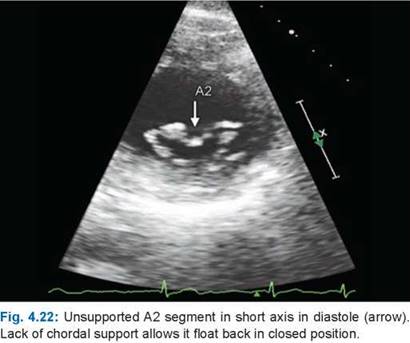
At the other end of the spectrum, the widespread involvement of the majority of the segments may be observed. ttis process affects the subvalvular structures with chordal thinning and elongation. This results in the affected leaflet segments ballooning into the left atrium (Figs 4.18 to 4.22).
Features of fibroelastic deficiency are:
• Elongated leaflets
• Long and thin chords
• Rupture of chords
• Annular dilatation
the posterior leaflet is the most frequent area to develop thickening and become flail. Mechanical stress on the degenerative chords may lead to rupture. If this
involves the primary chords, there may be total eversion of the leaflet free edge into the left atrium. This is described as a “flail” segment and is inevitably associated with severe regurgitation (Fig. 4.23). Flail segment needs to be differentiated from the prolapse wherein there is protrusion of the body of the segment with tip lagging behind although coaptation reaches superior to the annular plane.
the same disease process can result in focal regions of thickening with retraction and restriction.
A striking feature of the patient with Barlow's disease (billowing MV) is the size of the valve apparatus:
• the leaflets are usually thick, bulky, elongated and distended
• the chords are thickened and elongated, often meshlike in nature
• Annulus is dilated and enlarged (Fig. 4.24).
Herein, the body of the leaflet scallops protrude into the left atrium with coaptation point staying behind at the annular plane.
MVP is defined as failure of leaflet coaptation due to partial or complete systolic displacement of mitral leaflets beyond the annulus in the left atrium(> 2 mm). It includes Barlow's syndrome as well as floppy MV due to fibroelastic deficiency and other connective tissure disorders.8
the prolapse is often multisegmental, and involves both leaflets in up to 40% of patients (Figs 4.25 and 4.26). Prolapse needs to be assessed in parasternal long-axis view and not in apical views wherein the annulus is saddle shaped.

ЛГГ




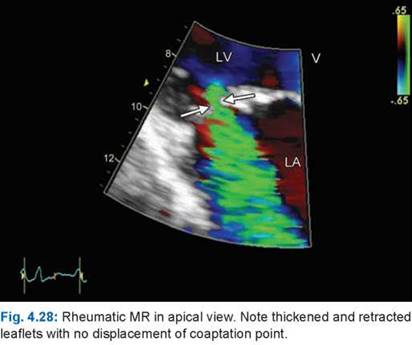
In the developing world, rheumatic MR is one of the commonest lesions in the young people. The mechanism of MR is deficiency of the leaflets due to thickening and restriction, causing malcoptation (Figs 4.27 and 4.28). In addition, chordal thickening and shortening along with papillary muscle scarring may cause pan-cyclic tethering especially of the posterior leaflet. Commissural calcium can also prevent coaptation.
Functional mitral regurgitation is defined as a disorder of regional or global left ventricular remodeling in which anatomically normal leaflets fail to coapt adequately.9 The abnormal closure pattern is one of apical tethering of one or both leaflets (Figs 4.29 to 4.31).


Pathological tethering and concomitant regurgitation occur when an imbalance is present between closing and tethering forces (Figs 4.32 and 4.33).
• Tethering forces are increased when increased traction on the leaflets exists through a combination of annular dilation, infarct expansion and spherical remodeling of the left ventricle.
• Closure forces (due to left ventricular contraction) are reduced as a consequence of left ventricular systolic dysfunction.
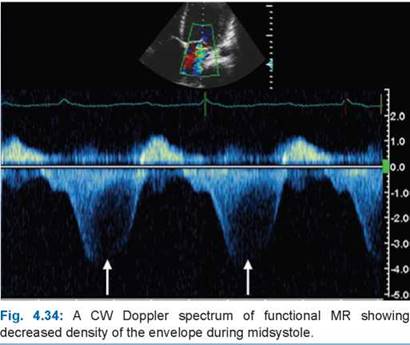
Functional mitral regurgitation may paradoxically decrease in midsystole10 or even disappear though transmitral pressure is at its peak because of greater closing force (Figs 4.34 and 4.35).
Tethering of leaflets pulls down the coaptation point into the LV cavity and away from the annular plane and causes MV deformity. Mitral valve deformation can be assessed by the tenting area and the tenting height from the parasternal long-axis view at midsystole.11
The degree of tethering and hence degree of MR is gauged by:
• Tenting height (distance between the midmitral annulus point to coaptation point). Tenting height of > 10 mm indicates severe MR.
• Tenting length (distance between the tip of the papillary muscle to the base or hinge-point of opposite leaflet)
• Tenting area. Tenting area has good correlation with effective regurgitant orifice area (Figs 4.36 and 4.37).




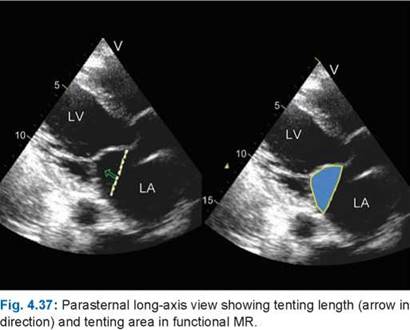


A tenting area > 2.5 cm2 suggests presence of severe functional MR.
Indicators of severity of functional MR are:
• LA diameter
• Tenting length
• Tenting height or depth
• Tenting area
• Asynchronous contraction of the mitral annulus (as in left bundle branch block)
• Loading conditions
Type of anterior mitral leaflet (AML) tethering, which has been categorized into three types,12 predicts success of mitral annuloplasty (Fig. 4.38A).
As systole begins, the LV volume decreases, mitral annulus contracts, interpapillary muscle distance decreases and the chords stretch as the mitral leaflets coapt at the annular plane. Normally, hardly any blood regurgitates into the left atrium during systole. Mitral regurgitation is said to be present when a part of LV stroke volume is received by the left atrium through a regurgitant orifice (Fig. 4.38B).
Total amount of blood flow that goes to the LA per beat is called regurgitant volume.13 Regurgitant volume normalized to total LV stroke volume is regurgitation fraction (Fig. 39).
The orifice through which regurgitant volume enters the LA is called effective regurgitant orifice area.14 There can be more than one such orifice of different shape and also of dynamic nature. Mitral valve repair may also result in two orifices that leak to some extent. All these parameters are used to judge severity of MR.15 Total LV stroke volume can be obtained by 2D or 3D echocardiographic volumetry. Forward stroke volume can be obtained from LV outflow tract flow using the formula of volume = area x velocity - time integral. Following Tables 4.1 and 4.2 provide criteria for volumetric severity of MR:
Points to Remember:
• The regurgitant volume (RV) depends upon the regurgitant orifice and the systolic pressure gradient between LV and LA.
• The observed degree of MR depends on hemodynamic conditions at the time of examination.16 Any increase in preload or afterload, and any decrease in myocardial contractility, causes LV dilatation, enlargement of the mitral annulus and an increase in effective regurgitant orifice (ERO) area.


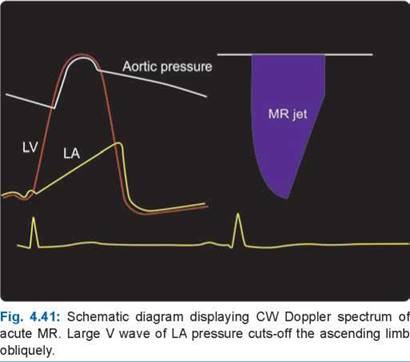
In acute MR, the atrium is noncompliant and therefore mechanical energy generated by the left ventricle causes an increase in intra-atrial pressure (Figs 4.40 and 4.41).
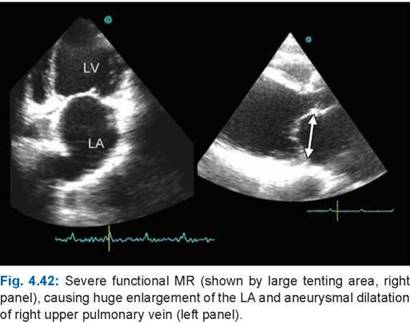
In chronic MR, the atrium is more compliant, and therefore mechanical energy generated by the ventricle causes volume overload and atrial enlargement rather than an increase in intra-atrial pressure (Fig. 4.42).
In severe MR, transthoracic echocardiography (TTE) shows left atrial and ventricular enlargement (Fig. 4.42).
LV systolic motion may be increased in the compensatory phase of chronic MR.
Peak mitral flow velocity is increased and flow in the pulmonary veins during systole may be reversed in severe MR.17 ttese are supportive signs of severe MR (Fig. 4.43).
Occasionally, diastolic MR may accompany systolic MR due to elevated LV diastolic pressure (Fig. 4.44).


Methods to Assess Severity of Mr
There are several indirect clues to the severity of MR like LA and LV enlargement, dense continuous wave (CW) Doppler spectrum, pulmonary vein systolic flow reversal, increased mitral flow E wave velocity (> 1.50 m/s) in absence of mitral stenosis, visible size of regurgitant orifice, tenting area and tenting height and en face view of the MV during systole in 3D.
However, in clinical practice, following methods are routinely used:
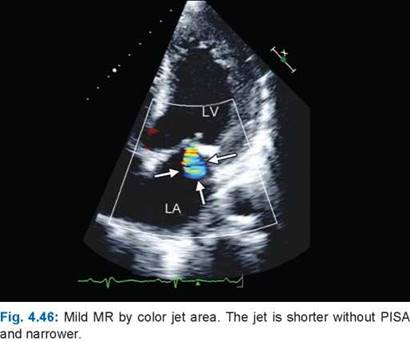
Not long back, at default Nyquist limits, MR color jet area in the LA was predominantly used to assess severity of MR. A color jet area < 4 cm2 indicated mild MR and that > 8 cm2 suggested severe MR. Later on, jet area > 10 cm2was considered evidence of severe MR (Fig. 4.45). Nowadays, color jet area is used to ballpark MR but more refined methods are used for estimating severity. Beyond doubt, a small and thin jet area close to the MV indicates mild MR (Fig. 4.46) and swirling jet as shown in Figure 4.45 is suggestive of severe MR.


There are a few caveats for color jet flow area as criterion for assessing MR severity:
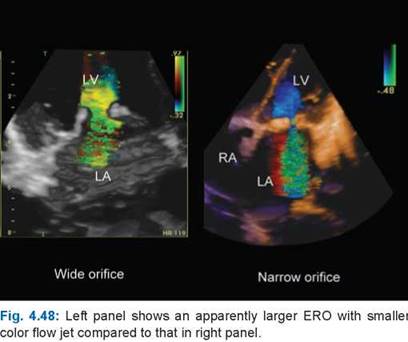
• Most frequent but inaccurate way of assessing severe MR (Figs 4.47 and 4.48)
• Size and depth of the jet color area are frequently used criteria for semiquantitation even though these are dependent upon many technical and hemodynamic factors
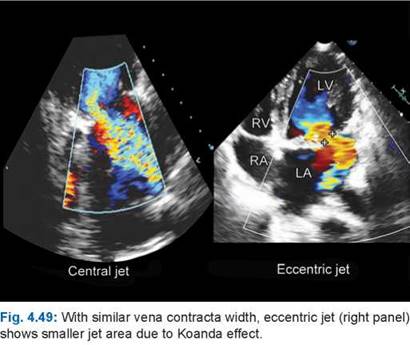
• Color jet area is smaller in eccentric jets compared to central jets (Fig. 4.49)
• In acute MR, color jet area is misleading
• Jet area is usually low in presence of elevated LA pressure.
Color jet flow area is used to detect MR but not quantify it except in certain emergency situations.
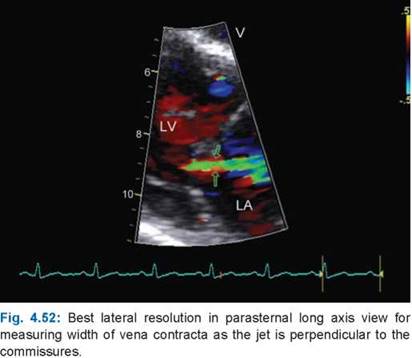
Measurement of the vena contracta is useful as it describes the smallest area of the blood flow jet as it exits a valve (Fig. 4.50). This corresponds to the effective orifice area calculated for valves using the continuity equation.18
It is preferable to use a zoom mode to optimize visualization of the vena contracta and facilitate its measurement.
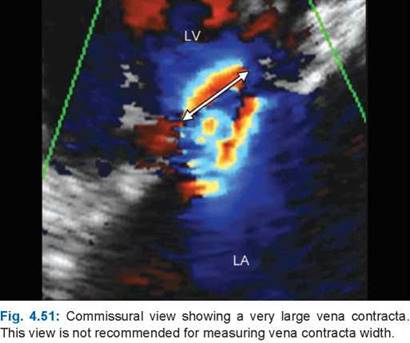
The color flow sector should also be as narrow as possible, with the least depth, to maximize lateral and temporal resolution, Nyquist limit of 30-70 cm/s and to be measured in views perpendicular to the commissures (Figs 4.51 and 4.52).
the largest diameter of a clearly defined vena contracta is measured if possible in two orthogonal planes and averaged over several cardiac cycles.
Advantages of Vena Contracta
• Simple measure of orifice area
• Valuable in eccentric jets as well
• Not dependent on pulse repetitive frequency
• No correction for angle or convergence walls
• Not affected by other valve involvement
• If the orifice is fixed then the size of the vena contracta is independent of driving pressure and flow rate
• Not affected by loading conditions
Limitations of Vena Contracta Width
• No temporal information (as needed in MVP and hypertrophic cardiomyopathy)
• May need biplane or triplane measurement to get it right in case of eccentric orifices
• Multiple jets are a problem
• Small errors can make a big difference
• In dynamic regurgitation, orifice vena contracta may change with hemodynamics or during the cardiac cycle
• The convergence zone is flatter with higher aliasing velocities and becomes more elliptical with lower aliasing velocities. the aliasing velocity is set between 20 and 40 cm/s.
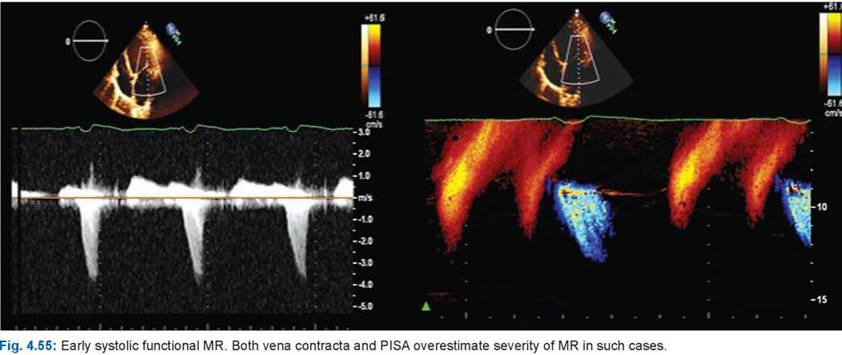
• Another limitation is with regard to variation in the regurgitant orifice during the cardiac cycle. This is particularly important in MVP where the regurgitation is often confined to the latter half of systole. the precise location of the regurgitant orifice can be difficult to judge, which may cause an error in the measurement of the proximal isovelocity surface area (PISA) radius.
• the 3D echo derived vena contracta measured in more than one axis when seen en face is a better method.19 Even though the measurement of the vena contracta
is less dependent on technical factors, small errors in measurement can by multiplied due to the relatively small values of the vena contracta width.
MR Severity and Width of Vena contracta Mild < 3 mm Moderate 3.1-6.9 mm Severe > 7 mm
the above criteria are applicable only for holosystolic MR with preferably circular regurgitant orifice.5,13
Proximal Isovelocity Surface Area (PISA) Volumetric Measurements for Severity of Mr
The PISA method is a Doppler phenomenon to estimate orifice area.


• The PISA method is derived from the hydrodynamic principle, which states that, as blood approaches a narrow orifice, its velocity increases, forming concentric, roughly hemispheric shells of increasing velocity and decreasing surface area (Fig. 4.53).
• Color flow mapping offers the ability to image one of these hemispheres that corresponds to the Nyquist limit of the instrument. Apical four-chamber view is the most appropriate for visualization.
• If an Nyquist limit can be chosen at which the flow convergence has a hemispheric shape, flow rate (mL/s) through the orifice is calculated as the product of the surface area of the hemisphere (2pR2 or 6.28 x radius2) and the aliasing velocity (Va) as 2nR2 x Va) Figure 4.54.
• Assuming that the maximal PISA radius occurs at the time of peak flow and peak velocity, the maximal ERO is derived as ERO = (6.28R2 x Va)/Vmax where Vmax is the peak velocity of the jet by continuous wave Doppler
• The transiting volume/beat can be estimated as ERO multiplied by the velocity time integral of the jet. Since the PISA calculation provides an instantaneous peak flow rate, ERO by this approach is the maximal ERO and may be slightly larger than ERO calculated by other methods. If it is a regurgitant jet, ERO represents regurgitant orifice area.
• Measurement of PISA by color flow mapping requires adjustment of the aliasing velocity such that a well-defined hemisphere is shown. This is generally done by shifting the baseline toward the direction of flow, or by lowering the Nyquist limit or both.20
• Presence of flow convergence at default Nyquist limit of 50-60 cm/sec indicates significant MR.
• Functional MR can not only be biphasic but can also be only early systolic in some cases (Fig. 4.55). In both these instances, estimation of regurgitant volume is inaccurate.
• It is more accurate for central jets than for eccentric jets.
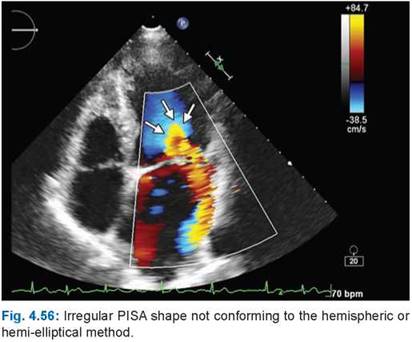
• The formula is applicable to a circular orifice.21 However, quite often, the orifices are elliptical or irregular or elongated along the coaptation line as in functional MR (Fig. 4.56).
• If the image resolution allows the flow convergence to be seen well (using Zoom mode), and an Nyquist limit can be chosen at which the flow convergence has a hemispheric shape, it is easy to identify the aliasing line of the hemisphere. However, it can be difficult to judge the precise location of the orifice and the flow convergence shape.
• Any error introduced is squared, which can markedly affect the resulting flow rate and ERO.
• In patients with normal blood pressure and MR, a simplified formula can be used if aliasing velocity is brought to 40 cm/s by shifting the baseline (Fig. 4.57). The formula gives ERO or regurgitant orifice area by R2/2 wherein R is the radius of the hemisphere.22 PISA method is much easier to apply in transesophageal echocardiographic (TEE) images than in
transthoracic images.23 Scroll function must be used to define a cardiac cycle wherein PISA is seen the best.


In about 10% of the cases, PISA cannot be defined although VC can be easily measured.
An ERO > 40 mm2 or an regurgitant volume3 60 mL indicates severe organic mitral regurgitation. Half of these values are criteria for severity of functional MR.
Velocity for Assessing Severity of MR
• In the absence of mitral stenosis, a peak mitral E velocity > 1.5 m/s suggests severe MR (Fig. 4.58).
• A dominant mitral A wave practically rules out severe MR.
• Mitral flow velocity-time integral/aortic time-velocity integral ratio > 1.4 indicates severe MR. ttis ratio < 1 indicates mild MR.

• Reduction in pulmonary venous systolic waveform velocity occurs with increasing severity of MR. In severe cases, systolic wave gets reversed or blunted. ttis sign lacks specificity because atrial fibrillation and diastolic dysfunction both can blunt systolic wave.
CW Doppler Interrogation in MR
• MR velocity does not provide estimate of severity of MR
• Density of CW jet roughly correlates with severity of MR
• A CW spectrum can display holosystolic versus non- holosystolic MR (Fig. 4.59). Non-holosystolic jets have smaller RV
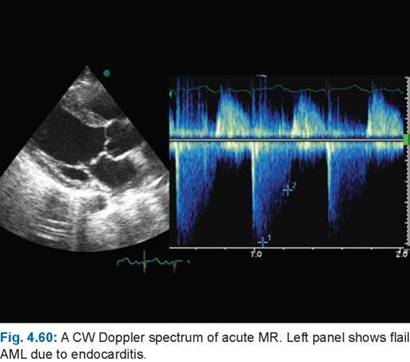
• In acute MR, CW spectrum of MR becomes triangular with early systolic peaking (Fig. 4.60).
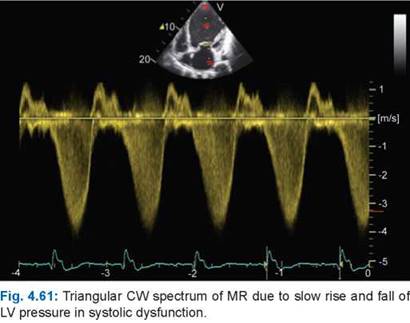
• True triangular CW spectrum can also occur due to severe LV systolic dysfunction (Fig. 4.61).
In summary, evaluation of MR requires careful study of 2D/3D echocardiographic morphology of the MV complex, quantitation by measuring vena contracta and flow convergence method and use of supportive signs to corroborate the severity of MR. As functional MR is dynamic and can be non-pansystolic, temporal information should be obtained by Doppler or color Doppler M-mode. The report should state if possible whether the mechanism is primarily organic or functional, localized remodeling or generalized LV dysfunction as this has potential bearing on management. However, the two are not always mutually exclusive as severe MR, due initially to localized remodeling, may lead over time to global ventricular dilation.
A holistic approach should be used with integration of all available information rather than relying on a single parameter.
references
1. Boudoulas H, Wooley CF, Angelini A, et al. Anatomy of the mitral valve. In: Boudoulas H, Wooley CF (Eds). Mitral Valve: Floppy Mitral Valve, Mitral Valve Prolapse, Mitral Valve Regurgitation, 2nd ed. New York: Futura; 2000. pp. 5-29.
2. Rusted IE, Scheifley CH, Edwards JE. Studies of the mitral valve. I. Anatomic features of the normal mitral valve and associated structures. Circulation. 1952;6:825-31.
3. Roberts WC. Morphologic features on the normal and abnormal mitral valve. Am J Cardiol. 1983;51:1005-28.
4. McCarthy KP, Ring L, Rana BS. Anatomy of the mitral valve: understanding the mitral valve complex in mitral regurgitation. Eur J Echocardiogr. 2010;11:i3-i9.
5. Lancellotti P, Moura L,Pierard LA, et al. European association of echocardiography recommendations for the assessment of valvular regurgitation. Eur J Echocardiogr. 2010;11:307-32.
6. Carpentier A. Cardiac valve surgery—the French correction. J Thorac Cardiovasc Surg. 1983;86:323-37.
7. Barlow JB, Bosman CK. Aneurysmal protrusion of the posterior leaflet of the mitral valve. An auscultatory-electrocardiographic syndrome. Am. Heart J. 1966;71:166-78.
8. Malkowski MJ, Biudoulas H, Wooley CF, et al. Spectrum of structural abnormalities in floppy mitral valve echocardi- ogrphic evaluation. Am Heart J. 1996;132:145-51.
9. He S, Fontaine AA, Schwammental E, et al. Integrated mechanism for functional MR: leaflet restriction versus coapting force: in vitro studies. Circulation. 1997;96:26-36.
10. Buck T, Plicht B, Kahlert P, et al. Effect of dynamic flow rate and orifice area on mitral regurgitation stroke volume quantification using the proximal isovelocity surface area method. J Am Coll Cardiol. 2008;52:767-78.
11. Song M, Fukada S, Kihara T, et al. Value of mitral valve tenting volume determined by 3-D echocardiography in patients with functional mitral regurgitation. Am J Cardiol. 2006;98:1088-93.
12. Agricola E, Oppizzi M, Maisamo F, et al. Echocardiographic classification of chronic ischaemic mitral regurgitation caused by restricted motion according to tethering pattern. Eur J Echo. 2004;5:326-34.
13. Zoghbi WA, Enriquez-Sarano M, Foster E, et al. Recommendations for evaluation of the severity of native valvular regurgitation with two-dimensional and Doppler echocardiography. J Am Soc Echocardiogr. 2003;16:777-802.
14. Enriquez-Sarano M, Tribouilloy C. Quantitation of mitral regurgitation: rationale, approach, and interpretation in clinical practice. Heart. 2002;88(Suppl. 4):iv1-3.
15. Grigioni F, Enriquez-Sarano M, Zehr KJ, et al. Ischemic mitral regurgitation: long-term outcome and prognostic implications with quantitative Doppler assessment. Circulation. 2001;103:1759-64.
16. Enriquez-Sarano M, Avierinos JF, Messika-Zeitoun D, et al. Quantitative determinants of the outcome of asymptomatic mitral regurgitation. N Engl J Med. 2005;352:875-33.
17. Enriquez-Sarano M, Dujardin KS, Tribouilloy CM, et al. Determinants of pulmonary venous flow reversal in mitral regurgitation and its usefulness in determining the severity of regurgitation. Am J Cardiol. 1999;83:535-41.
18. Hall SA, Brickner ME, Willett DL, et al. Assessment of mitral regurgitation severity by Doppler color flow mapping of the vena contracta. Circulation. 1997;95:636-42.
19. Kahlert P, Plicht B, Schenk IM, et al. Direct measurement of size and shape of noncircular vena contracta area in functional versus organic mitral regurgitation using real time 3-dimensional echocardiography. J Am Soc Echo. 2008;21:912-21.
20. Chaliki HP, Nishimura RA, Enriquez-Sarano M, et al. A simplified, practical approach to assessment of severity of mitral regurgitation by Doppler color flow imaging with proximal convergence: validation with concomitant cardiac catheterization. Mayo Clin Proc. 1998;73:929-35.
21. Fukuda S, Tran H, Greenberg NL, et al. Geometry of the proximal isovelocity surface area in mitral regurgitation by 3-dimensional color Doppler echocardiography: difference between functional mitral regurgitation and prolapse regurgitation. Am Heart J. 2008;155:231-8.
22. Pu M, Prior DL, Fan X, et al. Calculation of mitral regurgitant orifice area with use of a simplified proximal convergence method: initial clinical application. J Am Soc Echocardiogr. 2001;14:180-5.
23. Tribouilloy C, Shen WF, Quere JP, et al. Assessment of severity of mitral regurgitation by measuring regurgitant jet width at its origin w\ith transesophageal Doppler color flow imaging. Circulation. 1992;85:1248-53.