
STUDY HINTS
In Chapter 10, we discussed the concept of complementation and the use of complementation tests to assess allelic relationships. Genetic fine structure illustrates how complex a genetic system can be. The existence of pseudoalleles and complex loci shows that one must think in terms of functional interactions among closely linked loci, as well as being concerned with the units of mutation. Allelism, pseudoallelism, and the cis–trans test are among the most difficult concepts in this area for beginning students. Undoubtedly part of the confusion arises from the fact that theoretical advances in the understanding of genetic systems have matured beyond the initial concepts and definitions. The term allele refers to the alternate forms of a gene that occupies a particular locus. The term pseudoallele, on the other hand, refers to mutations that are allelic in a functional sense, in that they produce a mutant phenotype as trans-heterozygotes:
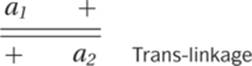
Yet they can recombine with each other to produce cis-linkage on the chromosome
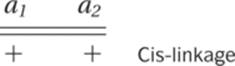
in which the + + chromosome now codes for a functional product and the cis-heterozygote is phenotypically normal.
Pseudoalleles are the subunits of a complex locus, and they can be explained in several ways. For example, pseudoalleles may be different parts of the same structural gene that functions properly only when it is intact as a single sequence. Thus, a useful degree of precision can be added to the idea of “allele” by distinguishing two levels of allelism: functional alleles and structural alleles. Two mutations are functional alleles if they are mutations in the same gene; this is equivalent to the definition of allele we have used in previous chapters. Functional alleles can, however, be of two structurally different kinds. Either the mutations can be in different parts of the gene (that is, they are not structural alleles) or they are in precisely the same nucleotide (they are structural alleles).
The fine-structure mapping done by Benzer with bacteriophage T4 confirms that one can achieve amazing resolution of the genetic structure of the organism if an appropriate experimental system can be devised. The advent of DNA mapping using restriction endonucleases and other techniques of molecular biology is making fine-structure mapping even finer. In this Problem Set, we offer problems about complementation and special mapping techniques and systems. In later chapters we focus on two-point and three-point recombination mapping in diploids (Chapter 12), mapping in bacteria and viruses (Chapter 13), and mapping using structurally altered chromosomes such as deletions (Chapter 16).
IMPORTANT TERMS
Cis-configuration
Complementation test
Coupling linkage
Functional alleles
Linkage group
Pseudoallele
Repulsion linkage
Structural alleles
Trans-configuration
PROBLEM SET 11
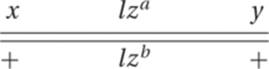
1. Two different lozenge (an eye shape mutation) pseudoalleles in Drosophila melanogaster are crossed and yield wild-type recombinants for lozenge that are all x + for the outside marker genes x and y. What can you conclude about the sequence of lza and lzb? Is lza to the left or to the right of lzb?
link to answer
2. In Drosophila, analysis of the structure of the Bar locus and of pseudoallelic loci such as the lozenge locus has involved the use of “outside markers,” which are closely linked genes on either side of the locus under study. For both types of loci, this test has led to a better understanding of the apparently high mutation rates originally reported for Bar and lozenge. How have the results of such outside marker experiments provided information on the structure and apparent mutation rate of these loci?
link to answer
3. When two mutants affect the same phenotype and are in the same linkage group, the determination of whether the two mutations are allelic or represent mutations in different loci (but with the same phenotype) can become an important question. One way to test for allelism is what is called the cis–trans (complementation) test.
(a) Describe the cis–trans test, and
(b) indicate the evidence that demonstrates the two mutants are alleles.
link to answer
4. The following are the results of a cis–trans test performed on three isolated mutants: homozygotes for mutant (x) have a mutant phenotype; homozygotes for mutant (y) also have a mutant phenotype, but somewhat different in its effect. Homozygotes for mutant (z) have a mutant phenotype that is different from the other two, but again appears to affect the same phenotypic character. When heterozygotes are produced by crossing homozygous (z) to homozygous (y), the offspring from this cross are normal in their phenotype (wild-type). The heterozygotes produced by crossing homozygous (y) with homozygous (x) all show a mutant phenotype (although different from either homozygote). The other alternative (x crossed to z) was performed and the offspring are normal (wild-type) in their phenotype. From these data, you can say
(a) all are alleles of the same gene;
(b) all are different genes;
(c) mutants x and y are alleles, but z is a different gene;
(d) mutants x and z are alleles, but y is a different gene;
(e) mutants z and y are alleles, but x is a different gene.
link to answer
5. The following chart represents the results of a mapping experiment using human–mouse somatic cell hybridization. The human cell has active enzyme R, but the mouse does not. Four cell lines have been produced, each having a full set of mouse chromosomes but differing in which human chromosomes are still present. Each cell line is tested for enzyme R activity (minus shows it absent, plus shows enzyme R activity can be detected). From these data, what can we conclude about the chromosomal location of the enzyme R gene?
|
Cell line |
Enzyme R activity |
Human chromosomes present in cell lines |
|
A |
− |
2, 4, 8, 11 |
|
B |
+ |
3, 4, 8, 18 |
|
C |
+ |
3, 5, 18, 20 |
|
D |
− |
2, 18, 12, 16 |
link to answer
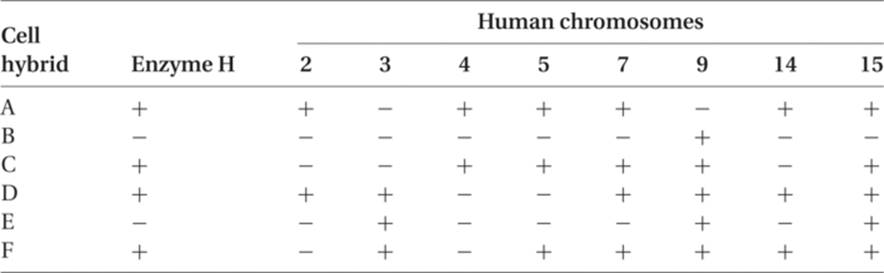
6. In the following panel of results, the presence or absence of enzyme H activity is correlated with the presence or absence of several human chromosomes in human–mouse cell hybrids. From these data, what can you conclude about the chromosomal linkage group for the enzyme H gene?
link to answer
7. Assume that the n locus in Neurospora shows 16 percent second-division segregation. What is the map distance between n and its centromere?
link to answer
8. In Neurospora, the p locus is linked to the n locus in problem 7, and p shows 10 percent second-division segregation. How many map units separate the p and n loci?
link to answer
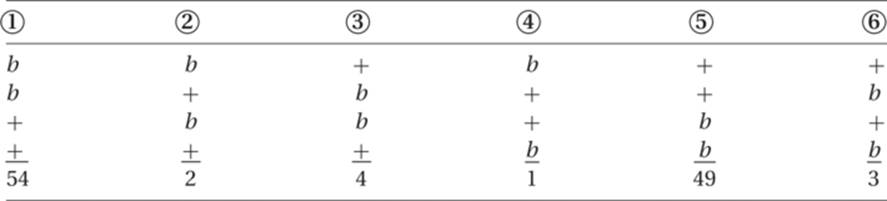
9. In Neurospora, a cross of b to plus (+) strains results in the following asci. What can you conclude about map distances in this cross?
link to answer
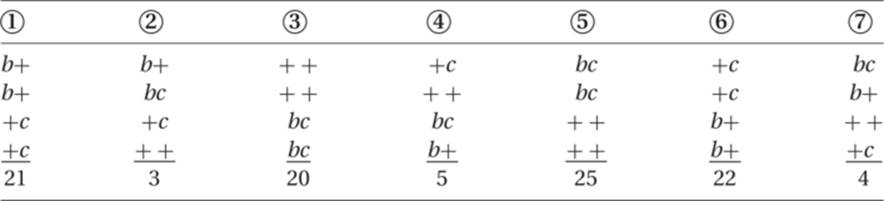
10. In Neurospora, a cross of bc and + + strains results in the following asci. Determine map distances, and discuss the results of this cross.
link to answer
ANSWERS TO PROBLEM SET 11
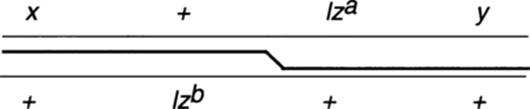
1. In order to obtain a nonlozenge recombinant in the lozenge region in which the flanking markers are x and +, lza must be to the right of lzb. To visualize this, we have redrawn the chromosome and greatly exaggerated the space between the lozenge pseudoalleles.
2. Outside markers are unrelated genes that are close to, and on opposite sides of, the region under test. These two loci are heterozygous, so crossovers between them are detectable. Every mutational event in the Bar and lozenge loci was accompanied by a crossover between the two outside markers, which indicates that the unusually high rates of “mutation” are not gene mutants per se but result from crossover events within the Bar and lozenge loci. The two loci differed in that the Bar reversion to wild-type (B+) had an equal probability of being + h or q +, where q and h are flanking markers. That is, Bar was nonpolarized. The lz+ reversions, on the other hand, were always either + h or q +, depending upon which two lozenge alleles were in the trans-position (polarized; see problem 1). The nonpolarized Bar locus is a duplication, whereas the polarized lozenge alleles represent mutations in different subloci occupying specific sites within the locus.
3. Please refer to the Overview of Genetic Mapping (Chapter 10) for a discussion of complementation.
4.
(c) Mutants x and y are alleles, but z is a different gene. The heterozygotes of x and y in trans-linkage do not complement.
5. Enzyme R activity is found when chromosome 3 is present. Although both cell lines B and C also share chromosome 18, that chromosome is also found in line D, which does not have enzyme R activity. The gene must, therefore, be on chromosome 3.
6. Chromosome 7 is the only one that shows consistency in being present when enzyme H is present. All others except chromosome 15 are missing in one or more cell lines when enzyme H is expressed. Chromosome 15, however, is present in cell line E, but enzyme H is not expressed there. So the enzyme H gene must be on chromosome 7.
7. Perhaps your immediate response is “16 map units,” but we are dealing not with single strands but with an entire meiosis. Since crossing over occurs at the four-strand stage, between two of the four strands, only half of 16 (or 8 percent) of the strands have undergone a crossover in the centromere–to–n–locus region. In order to keep map units in Neurospora tetrad analysis comparable to the units in most organisms, where only strand analysis is possible, this halving of the division 2 segregation frequency is necessary. The answer is 8 map units.
8. The p locus is 1/2 · 10, or 5 map units from its centromere. From problem 7 we know that n is 8 map units from the centromere. If both loci are on the same arm, then the distance between the two loci is 8 − 5 = 3 map units. If the two loci are on different arms, then the relationship is
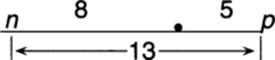
and the p–to–n distance is 8 + 5 = 13 map units.
9. The two (equivalent) parental ascus types showing first-division segregation are 1 and 5, with a total of 103 asci. The other types are all variants of second-division segregation, reflecting a crossover between the b locus and its centromere and different orientations of the centromeres at first and second anaphase. There are 10 of these. The number of map units separating the b locus from its centromere is 1/2 · (10/113) · 100 = 4.4 map units.
10. Ascus types 3 and 5 are parental ditypes, so 20 + 25 = 45. Types 1 and 6 are NPD, and 21 + 22 = 43. This apparent equality indicates that the two loci are assorting independently and thus are not linked. The tetratypes seen in ascus types 2, 4, and 7 (a total of 12 asci) are all generated by second-division segregation for the c locus, so the c–to–centromere region is 1/2 · (12/100) · 100 = 6 map units. Since there is no second-division segregation for the blocus in this sample of asci, you can conclude that b is very closely linked to its centromere.