Genetic mapping is the process of determining where a given gene is located in the genome. There are several different levels, or degrees of resolution, and a wide variety of techniques one can use. For example, one can map a gene to a major cell region, such as nuclear DNA versus mitochondrial or cytoplasmic DNA. Within the nucleus, a gene can be mapped to the X chromosome or to one of the autosomes. Within a chromosome, techniques like the frequency of recombination between pairs of heterozygous loci, the expression of recessive alleles in deletion heterozygotes, and biochemical markers detected in nuclei of somatic cell hybrids can give geneticists evidence about the linkage map order and relative spacing of genes.
A basic question behind genetic mapping is, What is a gene? A gene can be defined in molecular terms as a locus or DNA sequence on a chromosome. It can also be defined in terms of function through the phenotype it produces. Before mapping a gene, one generally has a phenotype to work with, but not the associated DNA sequence. That is what mapping is trying to identify. But there are pitfalls in working simply with phenotypes; one of the major ones is that different genetic loci acting on the same biochemical process can have the same phenotype. The fine structure mapping done by S. Benzer (1955) showed that recombination can occur both within and between genes and led to the concept of complementation. To be complementary is to complete or to supply another’s lack. What one cannot do, the other can, and vice versa. A complementation test is essentially designed to test whether two mutants are allelic or not. As seen in the following diagram, if two mutations are in different genes (that is, they are not allelic), they complement each other since the normal A and B alleles in the hybrid can provide what was missing in the recessive homozygous parents. If two mutations are allelic, on the other hand, the progeny of a cross between them are still homozygous and the two mutant strains do not complement each other.

Mapping to a chromosome can be done by tracing the inheritance of a new mutation with respect to genes of known location. For example, X-linkage can be distinguished from autosomal linkage by crossing females homozygous for the new mutant to homozygous normal males. If the gene is X-linked, all the F1 males will have the mutant trait since they inherit their X from their mother. If the males are phenotypically normal, they are heterozygous and the gene is on an autosome. Similarly, a gene can be mapped to an autosomal linkage group by the way it segregates together with, or independently of, genes of known map position.
The first genetic map was produced by A. H. Sturtevant (1913) in Drosophila using crossing over between pairs of heterozygous loci to assess gene order and relative distance between gene loci. In 1931, C. Stern and, in an independent study, H. B. Creighton and B. McClintock provided cytological proof that crossing over involves a physical exchange between homologous chromosomes during meiosis. This is a normal phenomenon that can occur at any point along the chromosome. Sturtevant used the frequency of crossover between two points as a measure of relative distance; this topic is discussed in more detail in Chapter 12.
In Drosophila and most other organisms, however, the four strands produced from each meiosis are mixed with other meiotic products. In this strand analysis, it is impossible to identify the individuals produced from the gametes of a single meiosis. One of the fascinating points about genetics is that unusual aspects of the development of some organisms can provide unique insight into general genetic principles. This is well illustrated by the Ascomycetes (including the yeasts and Neurospora), in which all the spores from a single meiosis are packaged in a sac (or ascus).
In yeasts the four ascospores are found in no particular order, but in Neurospora the meiotic products are linearly arranged in an “ordered tetrad,” because the developing ascus is narrow and elongated in one plane (see the following figure).
Tetrad analysis, in which we are able to study all four products of meiosis, is a powerful tool in the analysis of crossing over.

An interesting consequence of ordered tetrads is illustrated in the following figure. On the left is an ascus in which there is no crossover between the a locus and the centromere. The alleles segregate at the first meiotic division (division I), as do their centromeres. On the right, an exchange between the a locus and the centromere results in the segregation of the a from the plus (+) allele at the second meiotic division (division II).

The frequency of second-division segregation for a locus is a measure of the linkage of the locus to its centromere, a measure impossible to obtain in organisms that provide only strand data. A single crossover exchange involves only two of the four strands and results in two crossover and two noncrossover products. A tetrad with a crossover is indicated by an ascus showing second-division segregation, so the number of crossover strands equals half the number of asci showing second-division segregation. For example, a gene that shows 9 percent second-division segregation is 9/2 = 4.5 map units from its centromere and shows 4.5 percent crossing over.
When two loci are considered, they either assort independently or are linked. Assuming a cross of + + and ab, with independent assortment (and omitting, for simplicity, the mitotic duplication of the four meiotic products), we have

In ascus 1 (left in the figure on page 99) we have only two types of ascospores. Since these are the same as the parents, this is termed a parental ditype (PD). In ascus 2 (right) we again have only two types of ascospores, but since they are both unlike the original parents this is termed a nonparental ditype (NPD).
If the a and b loci were not linked, we would expect PD and NPD classes with equal frequency, as a result of independent assortment. A complicating factor in Neurospora is that a crossover proximal to either locus can generate a third ascus class called the tetratype (T) containing all four possible combinations of alleles.

If the numbers of PD and NPD asci are approximately equal, we can assume that the loci are unlinked. This can be tested by chi-square (χ2). If the two genes are linked, however, they can also produce PD, NPD, and T ascus classes, but the relative proportions of PD and NPD will favor the PD class. (Indeed, an NPD could only arise through two crossovers involving all four strands.) For example, consider two linked genes, b and f, and the three classes of tetrads that would result from noncrossover and single-crossover events. Note that the sequence of ascospore genotypes would differ, depending upon the orientation (that is, toward top or bottom of the ascus) of the centromeres at anaphase I and at anaphase II.
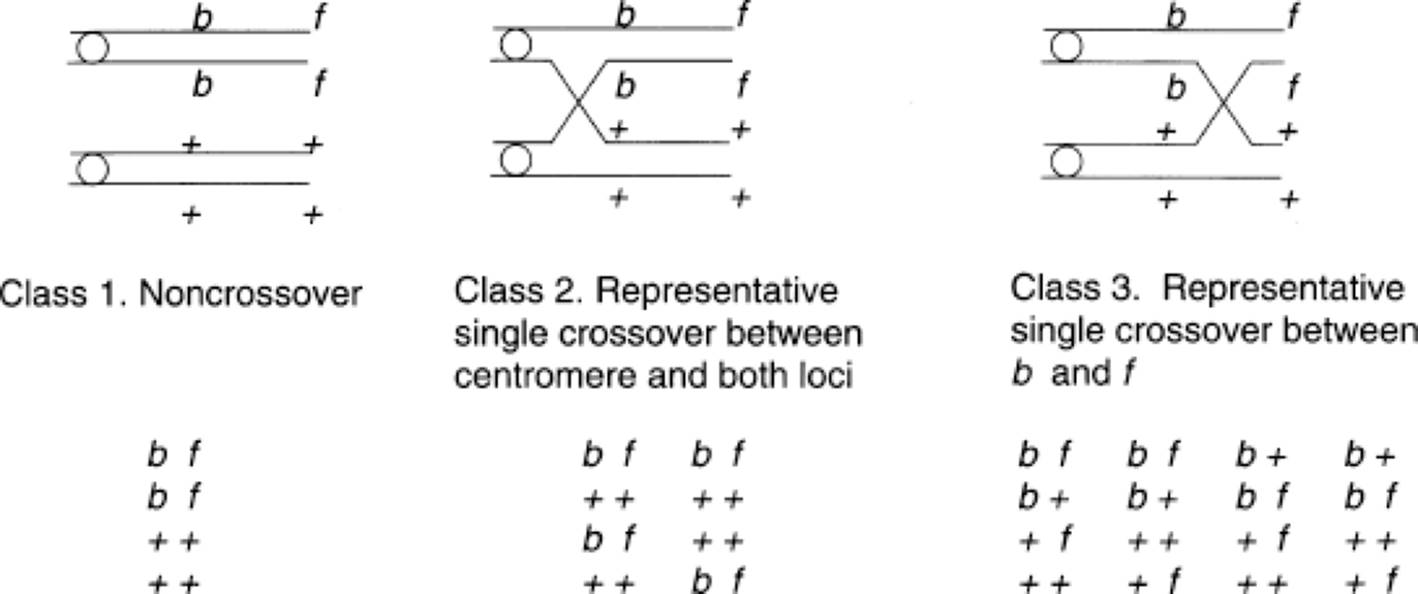
· Class 1: All are PD and show first-division segregation for b and f.
· Class 2: All are PD but show second-division segregation for both loci, indicating that the crossover took place between the centromere and both the b and f loci. Only two of the four possible ascus types are indicated.
· Class 3: All are T, indicating exchange between the b and f loci. Half of the ascospores are parental (bf and + +), and half are crossovers (b + and + f). In addition, they are all first-division segregants for band second-division segregants for f. Only four of the eight possible ascus types are indicated. Note, if there is second-division segregation for both b and f, the two genes must be on different chromosome arms.
The data provided by the class 3 asci, together with the other data, tell us that the locus closest to the centromere is b and that f, is on the same arm but distal to b. The map distance between b and f can be estimated by subtracting the b-to-centromere distance from the f-to-centromere distance, using the formula
![[1/2⋅T(PD+T)]⋅100](genetic-analysis.files/image150.jpg)
(where T = number of tetratypes, PD = number of parental ditypes), which gives the relative number of crossover strands (1/2 T) over the total number of strands.
The many complexities that one would expect to find in linkage data – such as linked loci on different arms, double crossovers, and more than two loci segregating in the cross – are also observable in Neurospora. In addition, crossover studies can be done in Neurospora with random spores. When ripe, the asci discharge their ascospores, and these can be collected, their genotypes determined, and the data handled as strand data, as they are.
The analysis of mapping data is an excellent opportunity to practice the interpretive aspect of genetic studies. Furthermore, the special insights offered by the Neurospora reproductive system show how certain organisms can provide us with valuable tools for genetic research. Even though the rules of genetics apply more or less equally to all organisms, their operation is much clearer in some than in others. One of the lessons of basic research is that what one learns about even the most obscure part of our world can answer questions of fundamental importance to all. For example, transmission genetic analysis in Neurospora has provided insights into homologous recombination mechanisms at the molecular level in all organisms.
Another example of an unusual genetic phenomenon that has been of immeasurable value in mapping is the production of polytene chromosomes in the salivary gland tissue of Drosophila larvae. These chromosomes are produced by successive rounds of DNA replication without associated cell division. The result is a nucleus containing giant banded chromosomes made up of about 1,000 copies of each original chromatid strand. The banding provides landmarks that can be used to trace chromosome segments that might be altered during mutation and even trace homologous regions in related species. The use of banded chromosomes for deletion mapping is discussed in Chapter 16.
Somatic cell hybrids offer one final example of special techniques that have been developed for mapping using unusual biological systems. The value of somatic cell hybrids for mapping was recognized when it could be demonstrated that human chromosomes were preferentially lost at random from human–mouse hybrid cell lines. This artificial segregation could then be correlated with the retention or loss of specific human characteristics, such as enzyme activity.
Production of hybrid cells: Usually, rodent cell lines derived from mice or hamsters are fused with human fibroblasts or transformed cell lines. Cell fusion can be promoted by using irradiated Sendai virus or chemical agents like polyethylene glycol. The fusion event is relatively rare, and the parental cells must be eliminated from the culture before interspecific hybrids can be isolated.
1. HAT selection system: The growth medium contains hypoxanthine, aminopterin, and thymidine (HAT). Aminopterin will block the de novo (i.e., “new”) synthesis of all purines and thymidine nucleotides. Normal cells can survive by using salvage pathways if supplemented with hypoxanthine and thymidine and if the enzymes hypoxanthine-guanine phosphoribosyltransferase (HGPRT) and thymidine kinase (TK) are functional. By using parental lines deficient in one or the other of the two enzyme activities, one can select for the rare somatic cell fusions by complementation.
2. Generating mutant parental cell lines for somatic cell hybridization: How can one obtain parental cell lines that are HGPRT or TK deficient? These lines can be generated by exposing cells to a mutagen and then selecting on a medium containing the purine analogue (and poison) 8-azaguanine (HGPRT-selection) or the thymidine analogue (and poison) 5-bromodeoxyuridine (TK-selection). Cells with a functional enzyme will incorporate these analogues into their DNA and be selectively killed. Cell lines that contain the mutant HGPRT or TK genes will survive.
3. Cloning of hybrid cells: By growing on HAT medium, the parental cells will die and hybrid cells will survive and divide. Individual colonies of surviving hybrid cells can then be isolated and clonally propagated. Since each individual cell line derives from an independent fusion event, they will probably differ in the number of human chromosomes they retain. Analysis of several clonal populations biochemically and cytogenetically is thus required to draw correspondences between specific phenotypes (e.g., enzyme activity) and which human chromosomes are present in the cell line.
Chromosome mapping using somatic cell hybrids: The correlation between a human phenotype and a human chromosome are the basis for this analysis. Cytogenetic analysis requires the ability to distinguish between chromosomes, and this is accomblished by analyzing mitotic hybrid cell populations that have been prepared so that different chromosomal regions will stain differentially. All rodent and human chromosomes show individual staining characteristics. With regard to phenotypic differences, the first genes mapped by this procedure were distinguished on the basis of differences in constitutive enzyme activity. Very often, differences between human and rodent forms of enzymes can be distinguished by electrophoretic procedures. Along with the chromosome analysis, enzyme analysis is performed on parallel cultures of the hybrid cell lines. Correlations are then drawn to determine the human chromosome consistently segregating with the human enzyme activity. Often analysis of 10–15 independent hybrid clones is necessary to identify the human chromosome correlated with the presence of the enzyme (and hence the gene encoding the enzyme). Both concordance and discordance should be demonstrable between the enzyme activity and the presence or absence of a specific chromosome. (See table above.)
Hypothetical Data from a Series of Rodent–Human Hybrid Cell Lines

A plus (+) indicates the presence and a minus sign (−) indicates absence the human enzyme or human chromosome. Note that chromosome 2 is the only one consistently present when human enzyme “X” is expressed and absent when enzyme “X” is not expressed. The gene locus for enzyme “X” can thus be assigned to human chromosome 2.
Regional mapping using somatic cell genetics: The somatic cell genetic technology will identify genes that are syntenic, that is, genes that are located on the same chromosome. Subchromosomal mapping can be accomplished by using human cells with known chromosomal rearrangements (deletions, translocations, etc.). For example, hybrid cell lines containing a reciprocal translocation chromosome carrying only the long arms of chromosomes 9 and 17 (t9q:17q), in conjunction with data on cell lines in which intact 17 and 9 chromosomes segregate independently, could provide information on whether a gene is located on the long or short arm of these two chromosomes.