
STUDY HINTS
The techniques described in the previous chapter can be used to map DNA at several different levels of resolution over several different degrees of scale. At the nucleotide level, a linear array of bases can be ordered by DNA sequencing. Using the techniques currently available in most laboratories, each sequencing experiment resolves contiguous regions on the order of hundreds to thousands of nucleotides. Using cloned DNA and batteries of restriction enzyme digests, a linear array of restriction sites can also be mapped relative to one another. Mapping via restriction enzymes can be used to order DNA regions thousands to tens of thousands of nucleotides in length. Finally, techniques of nucleic acid hybridization can be applied to locate genes to specific chromosomal regions, where any chromosomal band identifiable cytologically contains millions of base pairs.
What advantages are there to localizing genes? One advantage that has already gained clinical importance is the ability to follow the transmission of certain genetic diseases using tightly linked genetic markers. The recent application of recombinant DNA technology to gene mapping is having tremendous significance in identifying DNA sequences that are highly variable in populations, and whose inheritance pattern can be used to follow the transmission of closely linked disease genes. Moreover, once a search has been narrowed to a specific region of the genome by establishing linkage to a particular marker, molecular techniques can be brought to bear on finding and cloning the disease gene itself. Once it is cloned, the organization and expression of the gene in both normal and affected individuals can be examined, providing a means of investigating the molecular basis (cause, or etiology) of the disease process.
A great deal of progress has been made in the assignment of specific genes to chromosomes. These advances have been primarily due to the joint application of two techniques: somatic cell genetics and nucleic acid hybridization using cloned DNA. Combined with more classical forms of kindred analysis, localization of human genes to specific chromosomes has been increasing geometrically since 1970.
I. Kindred analysis
A. Examination of pedigrees represents the oldest method of establishing linkage. As mentioned earlier, it is hard to use for humans because of the relatively small number of progeny produced from any one family and the inability to structure test crosses (selective matings) as in animal and plant systems. This increases the difficulty of determining patterns of phase relationships between disease and marker loci – that is, whether linked genes in heterozygotes are in a cis- or a trans-orientation. Nevertheless, examples of linkage can be obtained from human pedigree data through the use of mathematical modeling techniques (e.g., lod score method), even in cases where the linkage phase is unknown. Information from several different families may also be combined for analysis.
B. LOD scores: Linkage data are often expressed statistically in terms of a likelihood ratio. This ratio represents the probability that two alleles are linked at some given recombination frequency (θ), divided by the probability that the alleles assort independently (i.e., a recombination frequency that equals 50 percent). The data are usually presented as the log of the likelihood ratio (LOD score):

At a specified frequency of recombination (θ), a likelihood ratio of 1,000:1 (LOD score = 3) is usually considered “proof” of linkage.
What relation does a genetic map based on linkage data have to physical features in a chromosome? Map units are based on recombination frequencies, which are clearly inconstant. As a rule of thumb, however, 1 percent recombination represents a DNA segment on the order of 500–1,000 kilobase pairs.
II. Applications of recombinant DNA technology to gene localization and characterization
A. Southern blot hybridization: The value of somatic cell hybrids for mapping has been discussed in Chapter 10, where the presence or absence of a particular human gene product (e.g., an enzyme) was correlated with the presence or absence of a human chromosome in the hybrid cell. Clearly, any demonstrable physical difference between rodent and human cells may be useful for mapping. Indeed, the nucleotide sequence of the gene itself can be used to identify its chromosomal position. A large number of human genes have been recovered from recombinant DNA libraries. An insert of cloned DNA in standard vectors (which is usually no more than 10–50-kb in size) inherently contains no information on where this DNA is located in the human genome. Cloned DNA, however, can be localized to specific chromosomes by nucleic acid hybridization. The nucleotide sequences for many evolutionarily related genes common to both rodents and humans have usually diverged sufficiently so that they can be differentiated from one another. If the DNA from a hybrid cell line is isolated, denatured, and annealed to a single-stranded probe derived from cloned human DNA, its presence can be detected and correlated with the human chromosome complement of that cell. The rodent and human genes in question can be quite similar in sequences and still be discriminated from one another. There is usually sufficient divergence between the rodent and human genome that a restriction enzyme can be identified that will differentiate between the genes on the basis of restriction fragment length polymorphisms. The technique used to detect these differences is termed a Southern blot, named for its inventor, E. M. Southern. DNA from the hybrid cell line is isolated, purified, and digested with the appropriate enzyme. The resulting fragments are then separated by gel electrophoresis, and the DNA in the gel is denatured and transferred (as in the library screenings discussed previously) to a piece of paper. The DNA is permanently attached to the paper by baking, and the paper is then incubated in the presence of labeled probe DNA, where the probe can hydrogen bond to complementary sequences. Unpaired probe molecules are then washed away, and the probe molecules that are specifically annealed to the DNA on the filter are detected (e.g., by autoradiography, in the case of radiolabeled probes). Correlations are then drawn between the human chromosomes (or parts thereof) that are present in a particular cell line and the presence or absence of restriction fragments characteristic for the human gene.
B. In situ hybridization: It is now possible to map a gene directly using probe nucleic acids annealed directly to mitotic chromosomes. This technique was first developed using radioactive probes. Briefly, mitotic chromosomes are mounted on a microscope slide. After denaturation of the DNA in the chromosome and partial disruption of chromatin structure, usually by alkali treatment, a drop of radiolabeled nucleic acid probe is added to the slide and incubated under precisely defined temperature and buffer conditions. Any probe that does not specifically anneal to the chromosomes is washed away and the slide is coated with a photographic emulsion. After an appropriate exposure period, the slide is developed. Silver grains in the exposed photographic emulsion (autoradiography) will mark the area of a chromosome where the radioactive probe has specifically bound, and differential staining techniques will identify the chromosome. Refinements in this technology (use of fluorescent probes, new hybridization conditions to increase the rate of hybridization, use of single-stranded RNA probes) now allow for the routine detection of one gene copy per chromatid.
C. DNA typing: DNA polymorphisms are now being used extensively for analysis of population structure, determining evolutionary relationships and establishing paternity, and (in humans) in forensic applications. Many of the polymorphisms detected involve mutations that arise in tandem arrays of repeated DNA. As a result of either slipped pairing during DNA replication or unequal crossing over, variations in the number of tandemly repeated sequences present at a particular chromosomal site will accumulate in populations over time. Restriction digests using enzymes whose recognition sites bracket the repeated regions will produce fragments of different lengths, depending on the number of repeats present in the array (2, 3, 4, etc.). These fragments can be detected after electrophoresis and Southern hybridization analysis, using probes complementary to the tandem repeat loci. Alternatively, if primers flanking the repeats can be identified, the variable regions can be amplified by using the polymerase chain reaction. These techniques allow one to analyze DNA from extremely small quantities of starting material, which is crucial when dealing with rare or precious samples (e.g., museum artifacts) or physical evidence obtained from a criminal investigation.
IMPORTANT TERMS
Autoradiography
Bacterial artificial chromosome (BAC)
Bacteriophage
cDNA
Cosmid
Dideoxyribonucleotides
DNA sequencing
Expressed sequence tag (EST)
Haplotype
In situ hybridization
LOD score
Microsatellite
Minisatellite
Northern blot
Nucleic acid hybridization
Plaque
Plasmid
Polymerase chain reaction (PCR, RT-PCR)
Restriction endonuclease
Restriction fragment length polymorphism (RFLP)
Reverse transcriptase
Single nucleotide polymorphism (SNP)
Somatic cell genetics
Southern blot
Variable number of tandem repeats (VNTR)
Vector
Western blot
Yeast artificial chromosome (YAC)
PROBLEM SET 20
1. DNA is isolated from a bacteriophage that has a genome consisting of a single double-stranded linear DNA molecule. The phage DNA is then digested with three different restriction enzymes in various combinations. Single enzyme digests with the enzymes A, B, and C gave the following fragment sizes when the digested DNA was examined by gel electrophoresis (kb = kilobase pairs = 1,000 base pairs):

Restriction enzyme digests using two enzymes in combination produced the following fragments:

Use the preceding data to order the restriction sites for these three enzymes relative to one another in the bacteriophage genome.
link to answer
2. Suppose the preceding viral DNA was individually digested with two additional enzymes. After single digests, the following fragments were observed through gel electrophoresis:
|
Enzyme E: |
a broad band of 25 kb |
Enzyme F: |
14 kb |
|
a broad band at 18 kb |
Are these results in conflict with the digests described in 1? Explain.
link to answer
3. The preceding viral DNA was subjected to double enzyme digests, where enzymes A, C, and E were used in combination with enzyme F. The following fragments were produced:

On the basis of the information provided in problems 1, 2, and 3, position the restriction sites for enzymes E and F relative to the sites for enzymes A, B, and C.
link to answer
4. Plasmid DED3 is a recombinant DNA vector used to propagate foreign DNA in bacteria. When plasmid DNA is subjected to digestion with the following restriction enzymes, fragments with the following sizes are produced:
|
EcoRI: 10.5 kb |
BamHI: 3.2 kb |
HindIII: 10.5 kb |
|
7.3 kb |
||
|
EcoRI + HindIII: |
1.9 kb |
EcoRI + BamHI: 0.6 kb |
|
8.6 kb |
3.2 kb |
|
|
6.7 kb |
||
|
BamHI + HindIII: |
1.3 kb |
|
|
1.9 kb |
||
|
7.3 kb |
How many sites exist for each individual enzyme? Position the EcoRI, BamHI, and HindIII cleavage sites on a restriction map.
link to answer
5. Plasmid DED3 carries two genes that confer resistance to both ampicillin (ampr gene) and tetracycline (tetr gene) in host bacteria. The plasmid DNA has a single site for the enzyme EcoRI, located in the middle of the tetr gene. Suppose we were interested in constructing a recombinant DNA library of frog genomic DNA, where the frog DNA had been cut with EcoRI then purified, mixed with EcoRI-digested DED3 plasmid DNA, treated with DNA ligase, and finally used to transform bacteria. How do we recover transformed bacterial colonies? How might we assess what percentage of transformed bacterial cells also contained cloned frog DNA?
link to answer
6. One of the first vertebrate genes examined in detail was the gene encoding the protein insulin, which is synthesized as a protein precursor (preproinsulin) and enzymatically processed to the active enzyme. In 1980, Efstradiatis, Gilbert, and collaborators isolated the chicken preproinsulin gene sequences from a chicken genomic DNA library to compare it to both cDNA clones and genomic DNA clones that had previously been cloned from rats. What is the rationale for screening both cDNA and genomic libraries for preproinsulin clones? What would be a logical tissue source (in both rats and chickens) for the isolation of the nucleic acids used to construct preproinsulin cDNA and genomic libraries?
link to answer
7. When the chicken preproinsulin genomic clone is cut with the restriction enzymes BamHI and TaqI, a 162-bp fragment that contains a piece of DNA encoding amino acids 5–57 of the preproinsulin sequence is produced. When this fragment is radiolabeled and used as a probe in a Southern blot hybridization experiment, it detects a single 0.8-kb band in BamHI digested chicken genomic DNA. When the same region from the rat cDNA clone is used as a probe of BamHI-digested rat genomic DNA, two bands are observed, 5.3 kb and 1.25 kb. What hypotheses might you make to account for this difference between the two organisms?
link to answer
8.
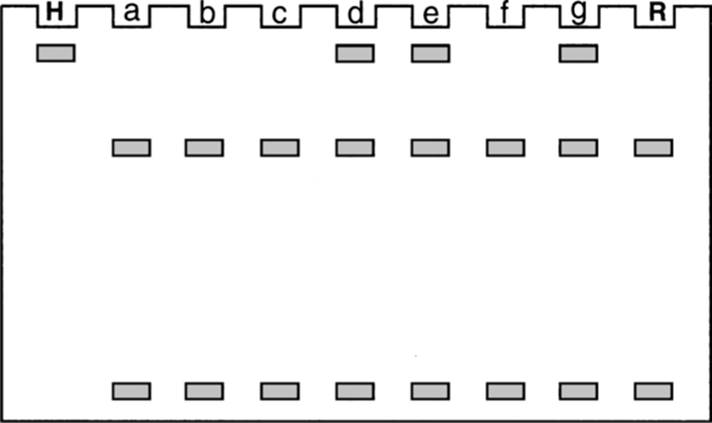
When human genomic DNA is digested with EcoRI and probed with an insulin gene sequence specific for the 5′ end of the insulin coding sequence, a 14.8-kb EcoRI fragment is detected in Southern blot experiments. EcoRI-digested rat DNA, however, produces two fragments of 7.0 kb and 0.8 kb, which hybridize to this insulin probe. A somatic cell mapping experiment is performed to localize the human insulin gene to a specific chromosome. EcoRI-digested DNA isolated from seven human-rodent cell lines (a, b, c, d, e, f, and g) are run on a gel, in conjunction with EcoRI-digested human (H) and rat (R) genomic DNA. After Southern blotting of the gel and hybridization with an insulin probe, the following patterns are observed on the resulting autoradiograph of the blot above.
The human chromosomes contained in the seven hybrid cell lines are as follows:
Cell line a: 1, 4, 6, 9, 10, 14, 22
Cell line b: 1, 6, 9, 12, 13, 18, 21
Cell line c: 5, 8, 17, 19, 20, 22
Cell line d: 2, 3, 4, 6, 11, 15
Cell line e: 1, 6, 7, 11, 14, 16
Cell line f: 3, 5, 7, 10, 13, 20
Cell line g: 3, 5, 6, 11, 13, 14, 22
On which chromosome can the human insulin gene be found? Can you suggest a method for localizing the human gene other than somatic cell mapping?
link to answer
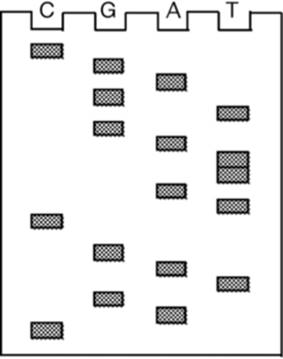
9. For the preceding portion of a DNA sequencing gel produced by using the Sanger dideoxynucleotide technique, answer the following:
(a) True or false. The preceding gel is capable of separating single-stranded DNA that differs in size by a single nucleotide.
link to answer
(b) What is the sequence of the strand being synthesized?
link to answer
link to answer
10. In the enzymatic reaction used to produce the DNA fragments shown in the “A” lane of the gel, which of the following were present in the reaction mixture?
(a) ddATP;
(b) ddTTP;
(c) dCTP;
(d) dATP;
(e) a primer molecule.
link to answer
11. In human populations, abnormal hemoglobin (Hb) variants are usually named for the geographic area in which they were discovered. Defects in the molecule may be found in either the alpha- or beta-globin proteins, which are encoded by separate genes. An abnormal hemoglobin called Hb Constant Spring causes a severe form of anemia. Although the beta-globin protein is normal, the alpha chains of Hb Constant Spring are 31 amino acids longer than the normal alpha chain. A DNA sequencing gel of the wild-type alpha-globin gene, showing the DNA encoding the last 5 amino acids on the coding strand plus some 3′ flanking DNA sequences, is shown on the left side of the figure on the following page. The sequence of the corresponding region of the Hb Constant Spring gene is shown for comparison on the right.
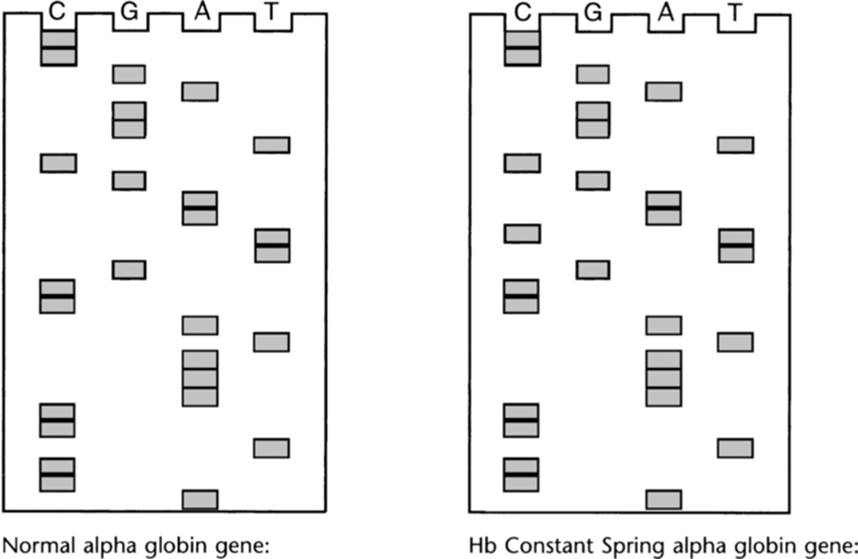
What is the nature of the mutation? Can you explain why the mutant alpha-globin protein is 31 amino acids longer?
link to answer
12. The alpha-globin proteins from the abnormal hemoglobin variants Hb Seal Rock and Hb Icaria are identical in size to the Hb Constant Spring alpha-globin. Protein electrophoresis, however, indicates that the Icaria protein is more positively charged than the Hb Constant Spring protein, and the Seal Rock protein is more negatively charged than the Hb Constant Spring protein. What is the nature of the mutation in the Hb Seal Rock and Hb Icarla alpha-globin genes? Table R.5 in the Appendix gives information on amino acid characteristics.
link to answer
13. A restriction fragment length polymorphism for the enzyme BamHI is identified in human populations by using a specific recombinant DNA probe, termed R2. For this region of the genome, the two external BamHI sites are always observed, whereas two other internal sites, indicated by asterisks on the figure, may or may not be present, depending on the individual. The region of genomic DNA that hybridizes with the R2 probe is indicated by the shaded box.

(a) How many different RFLP variant types (haplotypes) would be expected in human populations? Give the fragment pattern for each haplotype that would be detected by Southern blot analysis.
link to answer
(b) How many different haplotype combinations would one expect to see in human populations, given that each haplotype can be considered an “allelic” variant?
link to answer
link to answer
14. In the following pedigree, an autosomal dominant trait showing complete penetrance is depicted. Mapping experiments have established that the disease locus segregating in this pedigree is linked (within approximately 1 map unit) to the polymorphic locus detected by the R2 probe discussed previously. A Southern blot hybridization experiment using the R2 probe is performed on BamHI-digested genomic DNA from individual family members. The results of the autoradiograph and the source of the genomic DNA in each lane are shown directly below the pedigree (e.g., lane 1 on the autoradiograph represents III-1, lane 5 represents II-1, lane 8 represents I-1).
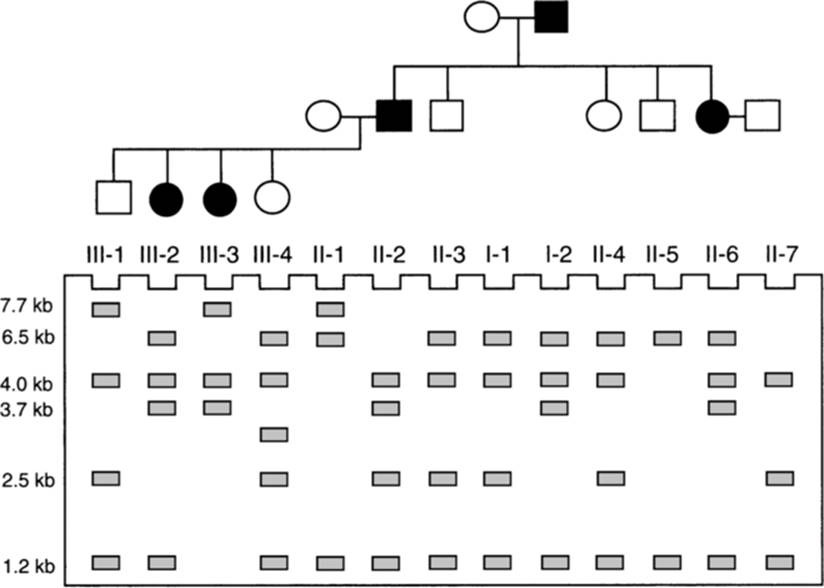
(a) What combinations of haplotypes are present in each of the individuals in the pedigree?
link to answer
(b) In this family, which haplotype is segregating with the deleterious gene? Would we necessarily expect the same haplotype to be segregating with the mutant allele in an unrelated family with this disorder? Explain.
link to answer
link to answer
15. Lt. Sandy Hippowits of the 32nd precinct has a murder to solve. The female victim, stabbed with a kitchen knife, lies on the sofa in an apartment, which she shared with her sister, Regan. There are two empty glasses on the coffee table, a half-eaten birthday cake, and a cigarette in the ashtray. Both of the glasses have lipstick on them, but not the cigarette. The victim’s purse also lies open on the coffee table; it contains her keys and lipstick, but no wallet or credit cards. A search of the apartment turns up nothing unusual, but on the floor in Regan’s bedroom is a matchbook for the Dadading Club with a phone number written on the interior of the matchbook. The phone number leads to Tony Contralto, owner of the Dadading club and an ex-boyfriend of the deceased. A credit card belonging to the deceased turns up in the hands of Mike Bison, an itinerant ex-boxer who says he got it out of the Dumpster at the Dadading club. Interviews with neighbors indicate that a major quarrel was heard the night of the murder, with someone heard screaming, “It’s my party, and I’ll cry if I want to.” All suspects deny being present in the apartment. Forensic analysis of the crime scene indicated that the victim’s fingerprints were on one of the glasses, while her sister Regan’s fingerprints were on the other glass. The lipstick on the victim’s glass appeared to come from the lipstick in the purse. DNA from cells located on both glasses and the cigarette could also be recovered. In addition, there was skin under the fingernails of the victim, which could also be typed using minisatellite markers. These samples were compared with the DNA of the principal suspects with the following results:
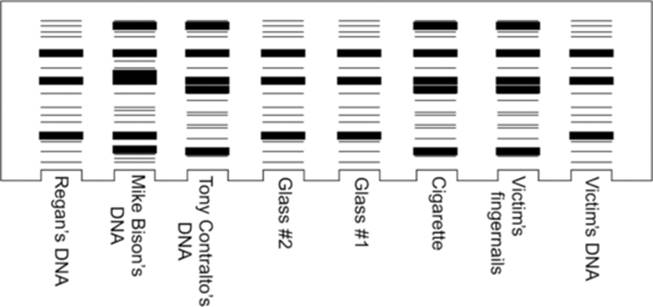
On the basis of the evidence, who is the most likely suspect? Who was having a birthday the day of the murder?
link to answer
16. A tigress is acquired by a local zoo and is a candidate for their captive breeding program. Although the identity of the tigress’s mother is believed known, there is
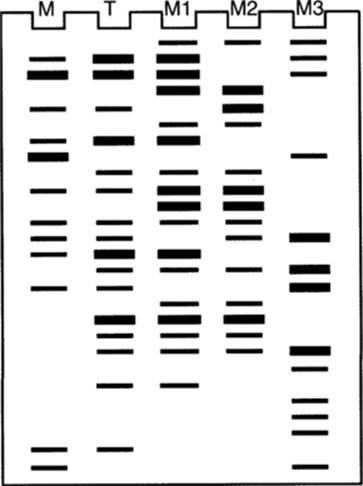
ambiguity as to her paternity, and some potential male mates could be closely related. DNA typing is performed on the tigress, her mother, and three potential mates to prevent excessive inbreeding. The results of a screen using a minisatellite probe are as follows (M = mother; T = tigress; M1–3 = potential mates): Which of the three potential males would be most suitable? Justify your reasoning.
link to answer
17. The normal beta-globin gene encodes a glutamic acid at residue 6 in the chain, giving rise to hemoglobin A (HbA) when it complexes with the alpha globin protein. The sickle cell allele at the beta globin gene locus encodes a valine at residue 6, forming hemoglobin S (HbS) when it complexes with alpha globin. A third beta-globin mutation contains a lysine codon at position 6, giving rise to hemoglobin C (HbC) when it complexes with alpha globin. Individuals homozygous for the HbC allele can experience a mild anemia that is much less severe than sickle cell disease. Individuals that are heterozygous for an HbC and an HbS allele, however, may encounter problems similar to sickle cell anemia.
(a) On the basis of this information, suppose you were designing a probe that could detect the single nucleotide polymorphism (SNP) defining each of these mutations. Relative to wild-type, what would the changes in the codon for position 6 be?
link to answer
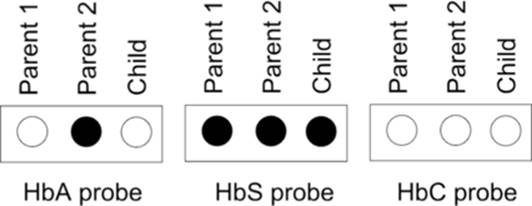
(b) Single-stranded oligonucleotide probes are designed to detect the SNPs present in the beta-globin alleles responsible for HbA (wild-type), HbS, and HbC. Genomic DNAs from two parents with a history of sickle cell anemia in their family, and from their first child, are analyzed below. The DNAs are spotted on a piece of nylon membrane, the DNA denatured, then hybridized to oligonucleotides specific for each of the three alleles. The following results are obtained, with dark indicating positive hybridization:
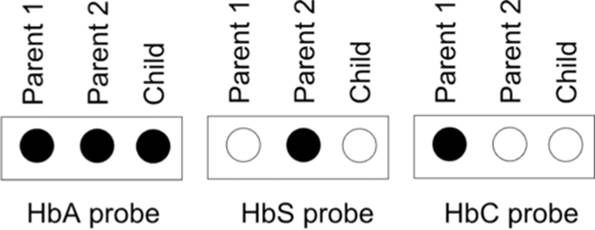
What are the genotypes of each parent and the child? Are future children at risk of developing anemia?
link to answer
(c) What might the hybridization patterns in this analysis look like if both parent 1 and the child had sickle cell disease and parent 2 was phenotypically normal?
link to answer
link to answer
18. Analysis of cDNA clones made from RNA isolated from normal breast tissue has identified a population of genes that are expressed in these cells. DNA sequence analysis of these clones has allowed for the construction of an oligonucleotide microarray representing these cloned sequences. This array is now hybridized with two different probe sequences. One cDNA probe is made out of RNAs that are isolated from breast cancer tumor cells grown in regular culture media in the laboratory. The other cDNA probe is derived from RNAs isolated from the same tumor cells that have been treated with a drug that is hoped to control cell proliferation. The cDNA probe made from untreated cells is labeled with a fluorescent molecule that will show a green fluorescence if overexpressed relative to the treated cells (see key). The cDNA probe made from drug-treated cells will lead to a red fluorescent hybridization signal if these sequences are overexpressed relative to the untreated cells. Genes expressed at the same level in both cell lines will show mixed, or yellow, fluorescence.
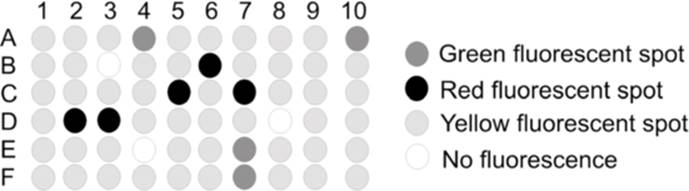
Does the drug treatment appear to have any effect on gene expression? What information can an experiment like this provide to the researcher?
link to answer
ANSWERS TO PROBLEM SET 20
1. The first consideration is to note that the three single digests all produce fragments that total 50 kb, representing the size of the entire phage genome. All of the digests generated two fragments. Since a linear molecule is being cut, this indicates that there is a single site for each of the three enzymes. The restriction site for enzyme A, therefore, must lie 10 kb from one end; similarly the restriction sites for enzymes B and C must also lie 3 kb and 15 kb from an end. Since the molecule has two ends, however, the next goal is to order these sites relative to one another.
The double digest using enzymes A + B helps resolve the position of these two sites relative to one another. The 10-kb fragment produced by enzyme A is broken into two smaller fragments by enzyme B, and their sizes total the size of the intact 10-kb fragment. This indicates that both the B and A sites lie near the same end of the molecule. Digests with enzyme A + C, however, leave the 10-kb fragment intact, but cut the 40-kb A fragment instead. This indicates the C site lies 15 kb from the other end of the molecule. The B + C digest supports this placement. A map can therefore be drawn:
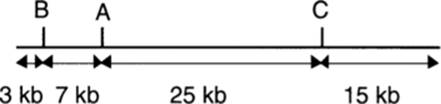
2. The results in question 1 indicate that the total length of the phage genome is 50 kb. Since the fragments resolved in these digests do not total 50 kb, a logical assumption is that these digests produced certain fragments that overlapped in size. The broad bands at 25 kb and 18 kb could represent doublets: two different fragments that have approximately the same size. If this is the case, the total fragment lengths for each digest still total 50 kb.
3. Since enzyme E produces two fragments of identical size, the single site for E must lie in the center of the 50 kb genome. Since enzyme F produces three fragments, there must be two sites for this enzyme, which need to be positioned relative to the other known sites. The single site for enzyme A cuts the 14-kb F fragment into two fragments 4 kb and 10 kb in size, so one of the F sites must lie 4 kb internal to the A enzyme site. Similarly, the single C site cuts one of the 18-kb F fragments into a 3-kb fragment and a 15-kb fragment, suggesting that the other F site lies 3 kb internal to the C site. This would produce the following map:
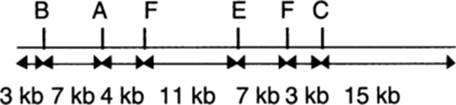
The A + F digest is consistent with these assignments.
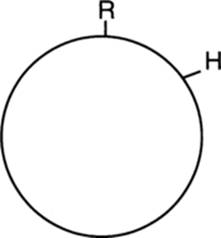
4. When a circular plasmid is cut once, a linear molecule is produced; when it is cut twice, two pieces are produced. There are, therefore, single restriction sites for the enzymes EcoRI (R) and HindIII (H), and two sites for the enzyme BamHI(B). The linear molecule is 10.5 kb in length. Furthermore, the EcoRI and HindIII sites must lie 1.9 kb apart on the circle, to yield the two fragments observed in the EcoRI + HindIII double digest:
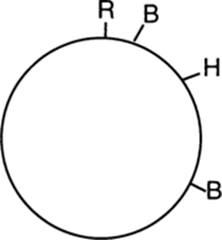
A comparison between the BamHI single digest and EcoRI + BamHI double digest indicates that the BamHI fragment that is cleaved by EcoRI is the 7.3-kb fragment. This indicates that one BamHI site is positioned 0.6 kb from the EcoRI site. If this site were located proximal to the HindIII site, we would expect to recover a 1.3-kb fragment on a BamHI + HindIII double digest; if it were distal to the HindIII site, we would expect to recover a 2.1-kb fragment. The data indicate that a 1.3-kb fragment is produced, so one BamHI site must lie between the EcoRI and HindIII sites. Using the same reasoning, the second BamHI site must lie 6.7 kb to the opposite side of the EcoRI site. If the map is linearized at the EcoRI site (to yield two “half sites,” R′) and portrayed as a line, the distances between the various sites are as follows:

5. The ligation reaction is mixed with competent bacteria, and the transformation mixture is plated on agar plates containing ampicillin. All cells that had been transformed with the plasmid should now be capable of surviving on ampicillin plates. Not all of these plasmids, however, would be expected to contain an insert of frog DNA, particularly if the plasmid were free to self-ligate. This is the reason that plasmid DNA is often treated with alkaline phosphatase prior to ligation. To identify what fraction of the transformed cells contain a plasmid carrying an insert, an aliquot of the library could be replica-plated on tetracycline plates. If a piece of frog DNA were ligated into the EcoRI site, this would produce an insertional mutation in the tetr gene. Colonies that grow on media containing ampicillin but not tetracycline would likely be carrying recombinant DNA inserts.
6. cDNA libraries are generated from mRNA and full-length clones will contain the entire coding region in a contiguous piece along with flanking 5′ and 3′ noncoding sequences. The location of coding regions in the genome, however, may not be contiguous but separated by introns. Accordingly, a transcription unit in genomic DNA could span tens, or even hundreds of thousands, of base pairs. If one is interested in expressing the gene of interest in a microorganism, it would make sense to use a cDNA sequence. There is important information, however, that can be obtained from comparisons of genomic and cDNA sequences. For example, cDNA clones do not contain promoter sequences, since mRNA transcription begins 3′ (relative to the coding strand) of the RNA polymerase binding site. Comparisons of cDNA and genomic clones can therefore provide information on promoter or other sequences important in gene regulation, as well as information on intron location.
Since most tissues in vertebrates contain a complete genome, virtually any tissue that contains nuclei could be used to isolate DNA for genomic libraries. One experimental concern might simply be to use a tissue with low endogenous nuclease activity where the cells could be easily disrupted. To build a cDNA library, however, it would be necessary to use a tissue source where the gene in question was actually being transcribed. For insulin, it would be necessary to use pancreatic cells, since insulin is produced only in the specialized beta cells in this tissue. In the actual cloning of insulin, researchers used an insulinoma, cancer cells derived from the pancreas that could be grown in vitro and that produce large amounts of insulin.
7. One hypothesis is that a BamHI site exists in rat cDNA that is not present in the same region of the chicken gene. Given the degree of evolutionary divergence between the two vertebrates, a difference in restriction pattern would not be surprising. This sequence divergence could be the result of changes in the coding sequence of the protein, or an intron in the rat gene that is absent from the chicken gene.
A second alternative is that there may be two genes for insulin in rats, and only a single gene in chickens. One way to test this alternative would be to perform a Southern blot analysis with a number of different enzymes, to see whether any enzyme produces only a single band. By using probes derived from a different region of the coding sequence one could also test to see whether the same multiple bands contain both 5′ and 3′ coding sequences. In fact, the second alternative holds for rats; a recent gene duplication has led to two insulin sequences in this rodent.
8. In this panel of somatic cell hybrids, the fragment bearing the human gene is present in cell lines d, e, and g. Relative to the chromosomes contained in these seven lines, concordance and discordance for the human chromosome complement indicate the following:
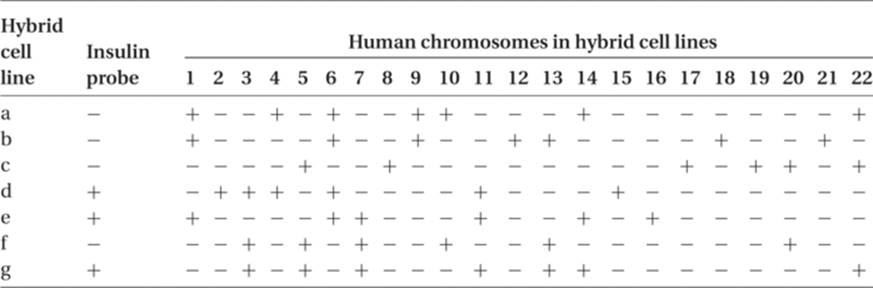
The pattern of concordance and discordance matches only chromosome 11; whenever it is present, the human gene is observed in Southern blots; whenever it is absent it is not observed.
For somatic cell mapping, tissue culture cells that contained chromosome rearrangements or deletions could also be used to refine the map to a particular region of the chromosome. For example, once it was determined that the gene was present on chromosome 11, hybrid cells carrying deletions of chromosome 11 could be used to refine the map. Of course, once a nucleic acid probe is available, it would also be possible to map the gene directly to a chromosome using in situ hybridization.
9.
(a) true. The DNA sequencing technique requires that nucleotides that differ in chain length by a single base be discriminated from one another. From the bottom of the gel upward, each DNA fragment is larger by one nucleotide.
(b) The gel is read from the bottom upward, since the labeled fragments are the result of an enzymatic reaction using DNA polymerase, which synthesizes DNA in the 5′ to 3′ direction. The sequence reads
5′-CAGTAGCTATTAGTGAGC-3′
10. (a), (c), (d), (e). In the DNA polymerase reaction used to produce the “A” lane on the gel, all four deoxyribonucleotide triphosphates must be present to synthesize a new molecule. Similarly, DNA polymerase requires a primer to initiate synthesis; it cannot start a chain de novo. To terminate specifically at adenine residues, the nucleotide analogue ddATP must also be present in the reaction. The only component not required would be ddTTP; this would be present in the “T” lane reaction, where it would serve to terminate synthesis whenever it was incorporated into growing chain.
11. The DNA sequence for the wild-type protein and the protein it encodes is:
. . . ACC TCC AAA TAC CGT TAA GCT GGA GCC . . .
. . . Thr Ser Lys Tyr Arg TER
TER denotes a chain termination (stop) triplet. The DNA sequence for the mutant protein and the protein it encodes is
ACC TCC AAA TAC CGT CAA GCT GGA GCC . . .
Thr Ser Lys Tyr Arg Gln Ala Glu Ala . . .
In Hb Constant Spring, a stop codon has mutated into the sense codon for the amino acid glutamine. The former 3′ noncoding region of the mRNA is now translated. Although this region of the gel is not depicted, we predict that another stop codon is present in the mRNA 93 nucleotides downstream of the mutated stop codon, producing a protein 31 amino acids larger than wild-type alpha globin.
12. Since the Seal Rock and Icaria proteins are also 31 amino acids longer than those of the wild-type, we predict that they also contain a stop codon that has mutated to a sense codon. For Seal Rock to mutate into a more negatively charged molecule than Constant Spring, it would have to be acidic. Similarly, for Icaria to be more positively charged, it would have to be more basic. Consulting the genetic code, we find that TAA  GAA would produce a glutamic acid residue in place of the stop codon (Seal Rock) and TAA AAA would produce a lysine (basic) residue in place of the stop codon (lcaria).
13.
(a) For the two polymorphic sites, either the site exists in the DNA or it doesn’t. This will produce four distinct haplotypes, with the following fragments hybridizing to R2:
|
+/+ (Both present) |
+/− (Left present, right absent) |
−/+ (Left absent right present) |
−/− (Both absent) |
|
1.2 kb |
1.2 kb |
3.7 kb |
7.7 kb |
|
2.5 kb |
6.5 kb |
4.0 kb |
|
|
4.0 kb |
The characteristic fragments observed on Southern blot analysis allow us to make haplotype assignments. For example, let haplotype A represent the +/+ pattern, haplotype B represent the +/− pattern, haplotype C represent the −/+ pattern, and haplotype D represent the −/− pattern.
(b) We can consider this problem as essentially an allelic series with four variants. Since every individual will have two chromosomes, there are four types of homozygotes and six types of heterozygotes for these four haplotypes, or ten combinations: [n(n − 1)]/2, where n = number of haplotypes.
14.
(a) On the basis of the haplotype analysis given in problem 13, certain bands can be seen to be diagnostic of a given pattern. Haplotype A, for example, is characterized by the 2.5-kb fragment, haplotype B by the 6.5-kb fragment, haplotype C by the 3.7-kb fragment, and haplotype D by the 7.7-kb fragment. We can now make the following assignments:
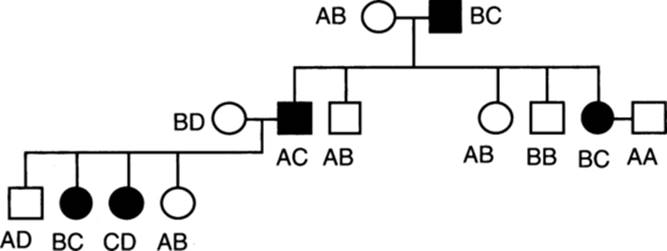
(b) In the preceding pedigree, the deleterious locus is segregating with the C haplotype. Since these loci are located within one map unit of each other, we would expect them to be separated by recombination in about 1 percent of the meiotic products. This would be useful for tracing the deleterious allele within this family, but in the population at large any of the haplotypes could be associated with the mutant disease locus. Because of recombination within the population, we would need to establish which haplotype was associated with this disease locus for each individual family.
15. The DNA from under the fingernails of the victim, as well as the DNA from the cigarette, match the DNA of Tony Contralto, so he is a logical suspect. Detective Hippowits should check Mr. Contralto for any signs of injury and see if he has an alibi, but circumstantial evidence suggests that he was present in the apartment that day. The DNA samples from both Regan and the victim are identical using this minisatellite marker. This indicates that they were identical twins, so they must have shared the same birthday. Since they were identical twins, it is not possible to tell whether it is Regan’s or the victim’s DNA on the glasses. Even identical twins, however, will have nonidentical fingerprint patterns, due to environmental factors and developmental noise.
16. An examination of the DNA “fingerprint” given in this problem indicates that every band in the tigress’s DNA can be matched either to her mother (who is a known first-degree relative) or to male 1. This would eliminate male 1 as a good candidate for mating. Similarly, a comparison between male 1 and male 2 suggests a high degree of relatedness between them, since they share 12 out of 19 bands. A comparison of the pattern in male 3 shows the highest degree of polymorphism relative to the other two males, and he also does not appear to share many bands with the tigress’s mother. Of the three candidates available, male 3 would be the best choice for the captive breeding program designed to minimize inbreeding.
17.
(a) The wild-type allele contains a glutamic acid residue at position 6, which can be represented by two codons, GAA and GAG. Lysine is represented by the codons AAA and AAG, so a change to an A in the first position would produce the HbC mutation. The valine codon is the most degenerate of the three, since any nucleotide may be present in the last position: GUN (where N = A, G, U, or C). A change at the second position from an A to a U would lead to this mutation. The third position could be encoded by either an A or a G; sequence analysis of beta-globin cDNA clones indicates that the codon is glutamic acid codon GAG.
(b) The hybridization analysis shows that Parent 1 has sequences that can base pair with both the HbA and the HbC probe, so this individual must be heterozygous for these alleles (A/C). The DNA from Parent 2 hybridizes with both the HbA and HbS probes, indicating that this parent is a carrier of the sickle cell trait (A/S). The child’s DNA only hybridizes with the A probe; he has inherited an A allele from each parent, i.e., he is homozygous for the wild-type gene. Since both parents are carriers of a mutant allele, there is a 1/4 chance that a child could inherit the C allele from Parent 1 and the S allele from Parent 2. These two alleles together can give rise to a child with hemolytic anemia.
(c) Given the new scenario, since Parent 1 and the child have the disease, their DNA will hybridize only with the S probe. Since the child is homozygous for the S allele, Parent 2 must also be heterozygous for an S allele. Since this individual is clinically normal, the other allele must be A. The pattern would look as follows:
18. The drug treatment did lead to a change in gene expression in several of the 60 genes examined in this experiment. The yellow fluorescent signal indicates that, for most of the genes, there is no detectable change between the treated and untreated cell populations in their relative level of mRNA production – a similar amount of probe derived from each mRNA population hybridizes to each spot.
(A significant difference in the level of expession for these experiments is often taken as a 1.5- to 2-fold difference in signal.) For certain clones, however, drug treatment appeared to decrease gene expression (e.g., the genes at spots A4, A10, E7, F7), since the higher level of hybridization to the green fluorescently labeled probe indicates mRNA levels for these genes were higher in the untreated cells. Similarly, for certain clones, drug treatment appeared to increase gene expression (e.g., clones B6, C5, C7, D2, and D3). There also appeared to be several genes that were not expressed in either the treated or untreated tumor cells (B3, D8, and E4). This difference may also be significant, since this panel of clones represents genes already known to be expressed in normal breast tissue (hence their inclusion in this array).
The information on changes in gene expression gained from these types of experiments can now be used to examine the relationships between genes showing common patterns. For example, the genes that show a change in expession may have some biochemical relationship to one another. They may be part of a common signaling mechanism or be proteins that interact in a metabolic pathway. Indeed, if the function of a particular gene in the array is not known, correlations in expression patterns that can be drawn to characterized genes may provide hints as to its function and open the way for further studies. Changes in expression pattern, however, ultimately need to be related to observed changes in the physiology in the cells under study. The biochemical changes that may occur in concert with changes in gene expression need to be identified and any causal relationships determined. Do the tumor cells slow in growth, accelerate in growth, or remain unchanged on drug treatment? Is this effect seen in other types of cells (e.g., other tumors from different patients)? Are similar changes in gene activity observed in other cells? How might a change in the expression of the gene influence the physiological event observed? Are there other consequences of the drug (e.g., undesirable changes in gene expression) that need to be assessed?