David Barth MD, FRCPC
Jan V. Hirschmann MD
The World Health Organization (WHO) has defined anemia in adults as a hemoglobin of <13 g/dL in males (a hematocrit [Hct] of about 39) and <12 g/dL in females (Hct about 36). For African-Americans, the hemoglobin is about 0.5 g/dL less. Using these values, anemia is common in the elderly, primarily from the presence of more disease in this population, rather than as a phenomenon of normal aging.
Especially when mild and insidious in onset, anemia often causes no symptoms. When they occur, fatigue and listlessness are common. As the anemia worsens, dyspnea may occur because of the diminished oxygen supplied to the tissues or from high-output cardiac failure, which usually occurs only when the hematocrit drops below 20, unless the patient has underlying heart disease. In patients with coronary artery disease, angina may develop or worsen. When the anemia becomes severe, faintness, dizziness, and diminished concentration can occur from decreased oxygen delivery to the brain. Diminished tissue oxygenation may provoke the compensatory mechanisms of tachycardia and increased force of ventricular contraction, which patients sometimes detect as palpitations.
Physical examination may be unremarkable, but pallor is sometimes apparent in the conjunctiva, palms, and face. Systolic murmurs, usually in the pulmonic area, can develop, probably from a combination of decreased blood viscosity and increased flow across the valves. Retinal examination in severe anemia may reveal hemorrhages that are white-centered (Roth spots), flame-shaped, or round. Some may be pre-retinal. The retinal veins are sometimes tortuous, and cotton wool spots, representing infarction of the nerve fiber layer, may occur. Ischemia of the vessels can lead to leakage of proteinaceous material, causing “hard” exudates.
The classification systems for anemia emphasize either erythrocyte size or the mechanism that reduced the number of red cells. The morphologic scheme divides anemia into three groups, based on mean corpuscular volume (MCV): (1) normocytic (MCV 90–100); (2) macrocytic (MCV >100); and (3) microcytic (MCV <80). In some disorders, the red cells may vary considerably and can cause anemias of more than one category. In hypothyroidism, for example, the red cells may be normocytic or macrocytic. A valuable aspect of this classification is that the measurement of red cell size is immediately available from automated blood counts and that the differential diagnosis of microcytic and macrocytic anemias is small. The diseases causing normocytic, normochromic anemias, however, are more numerous and complex.
Microcytic anemias represent disordered hemoglobin synthesis from inadequate iron, abnormal globin formation, or deficiencies in heme and porphyrin synthesis that occur in some types of sideroblastic anemia, such as those due to lead poisoning and pyridoxine deficiency. The commonest cause of microcytic anemia is iron deficiency. The second most frequent type is the anemia of chronic disease, in which microcytosis occurs in about 30% of cases. One of the components of the pathophysiology of this disorder is reduced transfer of iron from the macrophages in bone marrow to the plasma. Abnormal globin formation causing microcytic anemia occurs in the thalassemias and some hemoglobinopathies, such as hemoglobin C and E.
Macrocytic anemias may occur from several mechanisms. One is abnormal DNA synthesis, most commonly produced by deficiencies of folic acid and vitamin B12, causing abnormally large erythrocyte precursors (megaloblasts) in the bone marrow. Other etiologies are inherited disorders of DNA synthesis or medications that interfere with it. Macrocytic anemia also occurs frequently in the myelodysplastic syndromes because of altered erythrocyte maturation caused by a clonal expansion of abnormal hematopoietic stem cells. Macrocytosis, usually with an MCV of 100 to 110, but typically without anemia, is present in about 60% of alcoholics. The cause is not deficiency of folic acid or vitamin B12, but a direct effect of ethanol itself on the bone marrow. Another source of macrocytosis is the presence of young erythrocytes released early from the marrow because of anemia caused by hemorrhage or hemolysis. Some of these large erythrocytes are identifiable on peripheral blood smears because they still contain nuclei (nucleated red cells). Others, although matured beyond the nucleated stage, possess residual blue-staining nuclear RNA, as well as red-staining hemoglobin, leading to a purplish color with the Romanowsky stains ordinarily used for peripheral blood films. These large erythrocytes are called polychromatophilic (“lover of many colors”) or polychromatic (“many colors”) cells. The presence of a few is common on normal smears, but numerous polychromatophilic cells can lead to macrocytosis.
Normocytic anemias have many disparate causes. With acute hemorrhage or hemolysis, the bone marrow responds maximally by increasing red cell production and releasing young erythrocytes prematurely. In the other forms of normocytic anemia, however, the bone marrow response is reduced because of intrinsic bone marrow disease, insufficient iron, or inadequate erythropoietin effect. Categories of intrinsic bone marrow disorders include: (1) diminished erythrocyte precursors, such as in aplastic anemia or following cancer chemotherapy; (2) infiltration of the marrow with abnormal tissue, such as with fibrosis or leukemia; and (3) myelodysplastic disorders, in which abnormal red cell maturation leads to erythrocyte death in the marrow. In iron deficiency a normocytic anemia typically occurs before further progression leads to a microcytic one. Inadequate erythropoietin effect can develop from: (1) impaired production in the kidney because of renal disease; (2) reduced stimulation, possibly the cause of anemia in some endocrine disorders, such as hypothyroidism and hypogonadism; or (3) interference with both production and its bone marrow effects, caused by the presence of inflammatory cytokines, which is part of the pathogenesis of the anemia of chronic disease. Other components include a diminished red cell life span and impaired iron utilization.
In assessing anemias, it is useful to know whether the bone marrow has responded with a robust increase in red cell production. One assessment is to get a marrow sample to detect hyperplasia of the red cell precursors. A simpler, indirect measure is to enumerate the immature red cells in the peripheral blood by finding those with residual ribosomal RNA. When mixed with certain dyes, such as new methylene blue, that stain RNA, such immature erythrocytes show at least two blue granules or a network of material (reticulum). These young red cells are, therefore, called reticulocytes. Automated counters use a chemical, such as acridine orange, which binds to RNA and fluoresces. The reticulocyte count is expressed as a total number per volume of blood or as a percentage of the red cells. When a percentage is used, it should be corrected for the severity of anemia by multiplying it by the patient's hemoglobin (or hematocrit) divided by the normal hemoglobin (hematocrit). With a hematocrit of 20 and a reticulocyte count of 6%, for example, the corrected value would be 6% × (20/45) = 2.6%. When the anemia is severe (Hct ≤25) and polychromatophilia is prominent on the smear, a second correction is necessary. Usually, polychromatophilia lasts for 1 day in circulating red cells. When immature cells are released especially early, the blue color may persist for 2 to 3 days. For the reticulocyte percentage to reflect erythrocyte production in these circumstances, it should be divided by 2. The reticulocyte percentage that emerges from these corrections is called the reticulocyte index.
Reticulocyte enumeration is especially important in the classification of anemia by physiologic mechanisms or red cell kinetics. It has three categories: (1) hypoproliferative anemia, in which the bone marrow cannot increase its erythrocyte production; (2) maturation defects, in which bone marrow hyperplasia occurs, but many cells die in the marrow, a situation called ineffective erythropoiesis; and (3) acute hemorrhage or hemolysis, in which the red cell production increases and erythrocytes leave the marrow intact but die prematurely in the peripheral circulation.
Assigning an anemia to one of these categories utilizes the reticulocyte index and the results from a bone marrow sample. In the absence of anemia, the reticulocyte index is 1. With a moderately severe anemia (Hct <30) and a normal bone marrow, the reticulocyte index should exceed 3. This response typically occurs with hemolysis or acute hemorrhage. The reticulocyte index is less than 2 in hypoproliferative and maturation defect disorders. In a normal bone marrow sample, the ratio of erythroid to myeloid cells (E:M ratio) is about 1:3. With a moderately severe anemia, exuberant red cell production occurs and the E:M ratio should exceed 1:1. This kind of hyperplasia occurs with both maturation disorders and hemolysis. With the ineffective erythropoiesis of maturation defects, many red cells die within the bone marrow, whereas with hemolysis, the erythrocyte destruction is in the peripheral blood. In both cases, the serum lactate dehydrogenase (LDH) and indirect bilirubin levels may increase.
The reticulocyte index, the bone marrow findings, and these serum studies allow an accurate designation of the category of anemia. In hypoproliferative anemias, the erythrocytes are usually normocytic, the reticulocyte index is <2, the E:M ratio is <1:2, and the indirect bilirubin and LDH are normal. Early iron deficiency and the anemia of chronic disease are hypoproliferative disorders. Hypoproliferation also occurs when erythropoietin production (renal failure) or response (endocrine disorders) is diminished or when the bone marrow is damaged by injury to stem cells (e.g., cancer chemotherapy), by altered marrow structure (e.g., fibrosis), or by autoimmune or unknown mechanisms (e.g., pure red cell aplasia). Helping to distinguish among these possibilities is examining the blood smear for polychromatophilia, which is present in marrow damage and iron deficiency, but diminished in renal failure and the anemia of chronic disease.
In maturation defects, the reticulocyte index is <2, the E:M ratio is >1:1 with severe anemias, the serum LDH and indirect bilirubin are elevated (except in iron deficiency), and polychromasia is present. Examples of nuclear maturation defects, which cause macrocytosis, are vitamin B12 and folate deficiencies. Cytoplasmic maturation defects produce microcytic erythrocytes and include thalassemias, certain hemoglobinopathies, and some sideroblastic anemias.
In hemolysis, the reticulocyte index is >3, the E:M ratio is >1:1, serum LDH and indirect bilirubin are characteristically elevated, and polychromatophilia is prominent. In acute hemorrhage, the bone marrow takes 7 to 10 days to achieve a robust erythrocyte production. In the first few days, the anemia appears hypoproliferative. Later, the picture resembles ineffective erythropoiesis as bone marrow production increases, but the red cell precursors are not mature enough to leave the marrow. The reticulocyte index is <2; the E:M ratio is increased, yet still <1:1; and polychromatophilia is increased but not markedly. When the marrow finally achieves its maximal response, the findings are similar to those of hemolysis, with the reticulocyte index >3, the E:M ratio >1:1, and polychromasia prominent. Hemorrhage is distinguishable from hemolysis by the serum LDH and indirect bilirubin, which are normal because the red cells are not being destroyed, either in the bone marrow or in the peripheral blood.
For most clinicians, dividing anemia according to red cell size is the easiest approach, especially since the differential diagnosis of microcytic and macrocytic anemias is small. One use of the physiologic classification is in analyzing normocytic anemias, where the number of possibilities is large and that system of categorization provides a framework for distinguishing among them.
Microcytic anemia
The major diagnostic considerations in microcytic anemia are iron deficiency, anemia of chronic disease, and thalassemias. Less common causes include hemoglobinopathies and certain types of sideroblastic anemias. As discussed in the section on normocytic anemias, the anemia of chronic disease is microcytic in about 30% of cases, but usually with an MCV of 70 to 80 fl and unaccompanied by significant morphologic changes on peripheral smear. In iron deficiency, thalassemias, and hemoglobinopathies, the cell size is often smaller, and the blood film can disclose dramatic changes in red cell morphology.
Iron deficiency usually arises from chronic blood loss. The major cause in younger women is menstruation. In nonmenstruating women and in men, the most common source is gastrointestinal hemorrhage. Other less common reasons include hematuria, nosebleeds, hemoptysis, or intrapulmonary hemorrhage from such disorders as idiopathic pulmonary hemosiderosis, microscopic polyangiitis, or Goodpasture syndrome. A rare cause is intravascular hemolysis from such diseases as paroxysmal nocturnal hemoglobinuria or mechanical fragmentation of erythrocytes from prosthetic heart valves, in which destruction of red cells leads to excretion of iron in the urine in the form of ferritin, hemosiderin, or hemoglobin.
Iron deficiency occasionally develops from inadequate dietary intake or iron malabsorption. Little absorbable iron is present in the majority of foods, including most fruits and vegetables. Good sources are meat, poultry, fish, beans, and peas. Because daily iron loss is slight in adult males, primarily small amounts in the alimentary canal, they need little dietary iron, and deficiency from inadequate dietary intake is uncommon. When iron utilization is increased in infancy and during growth, or when concurrent blood loss occurs, as in menstruation, dietary intake may be insufficient, especially because women and children tend to consume less than the recommended minimal daily requirement. The problem increases during pregnancy, when some iron is diverted to the fetus for hematopoiesis, and with breast feeding, when iron is lost in the milk. Iron is absorbed throughout the gastrointestinal tract, but especially in the duodenum. With small intestinal disease, such as celiac sprue, or with gastric resection, which may accelerate the movement of intestinal materials through the duodenum and thereby diminish absorption time, iron deficiency may develop.
The clinical features of iron deficiency are generally similar to other anemias, but three uncommon but distinctive findings are pica, koilonychia, and blue sclera. Pica is the craving for, and ingestion of, certain unusual substances, such as starch, dirt, cardboard, and ice (pagophagia). Pagophagia is especially suggestive of iron deficiency. Virtually pathognomonic of iron deficiency is koilonychia, in which the fingernails become thin, brittle, and concave (spoon-shaped) in the distal half. Thinning of the sclera from impaired epithelial growth causes a blue tint because of the more visible choroid beneath.
With mild and recent iron deficiency, the red cell indices (MCV, mean corpuscular hemoglobin [MCH], mean corpuscular hemoglobin concentration [MCHC]) and the blood film are normal, but with time and increasingly severe anemia, the MCV and MCHC diminish. An early change in the erythrocytes is anisocytosis, indicated on automated counters by an increase in red cell distribution width (RDW). Later morphologic changes include poikilocytosis, microcytosis, and hypochromia. Tiny microcytes, elongated pale elliptical red cells (pencil cells), and target cells may be visible, but many of the erythrocytes may appear normal. Often, thrombocytosis is apparent. In iron deficiency anemia, the serum iron is decreased, the total iron binding capacity is elevated, and the saturation is <20%. The serum ferritin is decreased. Usually, the diagnosis is established by these tests, but occasionally obtaining a bone marrow sample for iron staining or a trial of iron therapy may be necessary to confirm the presence of iron deficiency (see Microcytic Anemia Tables and Diagrams).
Hemolytic Anemias
In hemolytic anemias, red cell destruction significantly shortens the normal life span of the erythrocyte in the peripheral circulation, which is about 120 days. Classifications of hemolytic anemia emphasize either the site of destruction—intravascular versus extravascular—or the site of the abnormality provoking it—as intrinsic or extrinsic to the red cell. In intravascular hemolysis, the red cells are destroyed within the bloodstream, whereas extravascular hemolysis indicates destruction within macrophages present in organs, such as the spleen, liver, or bone marrow.
Intravascular hemolysis is typically severe and arises from several mechanisms. One is mechanical damage to the red cell caused by: (1) fibrin present in the vessel lumen from such diseases as disseminated intravascular coagulation or vasculitis; (2) physical trauma from red cells passing through prosthetic valves or small vessels of the feet during hard marching; (3) thermal injury from burns. Intravascular hemolysis may also occur from infections, such as malaria, or from toxins, such as venom from some poisonous snakes. A third type is complement-mediated damage to erythrocytes caused by cold agglutinins, incompatible red cell transfusions, and paroxysmal nocturnal hemoglobinuria. Initially, the hemoglobin released into the circulation during intravascular hemolysis binds to haptoglobin, reducing its serum level. When the hemoglobin exceeds the binding capacity of haptoglobin, it makes the plasma appear pink. Free hemoglobin is filtered in the kidneys, and the urine may appear red. The dipstick testing for blood is positive, but the urine microscopy is negative for increased red cells. The renal tubular epithelium cells take up some of the hemoglobin, transforming it into hemosiderin, which is visible within these cells on iron stains of the urinary sediment. Evidence of recent or ongoing intravascular hemolysis, thus, includes a reduced serum haptoglobin level (which also occurs in extravascular hemolysis), the presence of plasma or urine hemoglobin, and detection of hemosiderin in renal tubular cells in the urinary sediment.
In most cases of hemolytic anemia, the red cell destruction is extravascular. The differential diagnosis includes: (1) an abnormal environment in the circulation because of infections, medications, or immunologic processes; (2) erythrocyte membrane abnormalities; (3) red cell metabolic defects; and (4) abnormalities in hemoglobin structure.
The other major classification system for hemolytic anemias differentiates disorders intrinsic to the red cell, which are typically hereditary, and those extrinsic to the red cell, usually acquired diseases. The intrinsic disorders include: (1) abnormal hemoglobins; (2) enzyme defects; (3) membrane abnormalities. The extrinsic disorders are: (1) immunologic; (2) mechanical factors; (3) infections and toxins; (4) liver disease (spur cell anemia); and (5) hypersplenism.
Abnormalities in red cell morphology may be apparent on peripheral smear, such as sickle cells, bite cells, schistocytes, and spherocytes. Other findings may include red cell agglutination from the presence of increased Igm, organisms such as malarial parasites, and ingestion of erythrocytes by macrophages (erythrophagocytosis), which especially suggests immune hemolytic anemias, but also can occur with infections or toxins. The peripheral smear in hemolytic anemia should reveal substantial polychromatophilia caused by the increased release of immature red cells from the bone marrow. The reticulocyte index is >3 and the absolute reticulocyte count is >100,000/mm3. The indirect bilirubin is elevated and represents >80% of the total bilirubin. The serum LDH may be increased and the serum haptoglobin diminished. With suspected intravascular hemolysis, helpful tests include urine and plasma hemoglobin measurements, as well as iron stains of urinary sediment. With extravascular hemolysis, Coombs tests detect immunoglobulin and complement on the red cell surface, indicating an immune hemolysis. A hemoglobin electrophoresis is indicated for suspected hemoglobinopathies.
Hemoglobinopathies and Thalassemias
Hemoglobin A (HbA), which constitutes more than 90% of the adult hemoglobin, consists of four polypeptide chains, two α and two β (α2 β2). Hemoglobin A2, composed of two α and two δ (α2δ2), is present in small quantities. Hemoglobin F (α2γ2) constitutes <1% of the normal adult's hemoglobin, but is the main hemoglobin during fetal life. As β-chain production begins just before birth, the level of HbF decreases and represents about 75% of the hemoglobin at delivery. By 6 months of age, it has diminished to 5%. The thalassemias are inherited disorders with reduced or absent synthesis of one or more globin chains. Two major consequences occur: reduced production of functioning hemoglobin, leading to hypochromic, microcytic erythrocytes; and continued production of the unaffected chains, which have decreased solubility or diminished oxygen-carrying capacity that causes damage to the red cell or its precursors, leading to ineffective erythropoiesis and hemolytic anemia. The thalassemias are labeled according to the chain with impaired production. With β-thalassemia, β-chains are absent or diminished; with α-thalassemia, α-chains are affected. These are the two most important thalassemias, although others exist.
The β-thalassemias are common in the Mediterranean area (thalassemia in Greek means “sea in the blood”), India, Southeast Asia, and the Middle East. The clinical spectrum includes severe (thalassemia major), moderate (thalassemia intermedia), and mild (thalassemia minor) cases.
β-Thalassemia major, or homozygous disease, is caused by the inheritance of two β-thalassemia alleles, resulting in little or no β-chain production although α-chain synthesis remains normal. Because of diminished HbA synthesis, anemia is severe, and the red cells produced contain diminished hemoglobin, making them very hypochromic. The accumulation of free α-chains leads to their deposition in red cell precursors, causing erythrocyte destruction in the bone marrow (ineffective erythropoiesis). Red cells containing these precipitates that do reach the peripheral blood are prematurely destroyed by macrophages in the liver, spleen, and bone marrow. Because HbF is present in substantial quantities at birth, anemia emerges only when γ-chain synthesis diminishes. Adequately transfused children grow and thrive until iron overload problems begin to develop. In untreated or insufficiently transfused patients, growth is subnormal. Increased erythropoiesis in response to the anemia leads to expanded marrow cavities that can eventuate in long-bone fractures and expansion of skull and maxillary areas, causing abnormal contours of the face and head. Increased erythrocyte destruction in the spleen causes splenomegaly, which can lead to hypersplenism with thrombocytopenia and leukopenia. On blood smear, the erythrocytes demonstrate anisocytosis and poikilocytosis, with elliptocytes, teardrop cells, and other bizarrely shaped red cells. Hypochromia is pronounced, and microcytosis is apparent, although the cells are flat and they spread out on drying, giving them a diameter larger than expected, based on the MCV. Target cells and nucleated red cells are typically numerous, and basophilic stippling is common. Red cell inclusions, representing excess α-chains, may be apparent. Findings on bone marrow examination include erythroid hyperplasia, basophilic stippling, and diminished hemoglobin in the red cell precursors, which also show inclusions. Iron content is increased.
Thalassemia intermedia is usually the result of the inheritance of two β-thalassemia mutations: both mild or one mild, one severe. The anemia is typically moderately severe, but transfusions may not always be necessary. The blood smear is similar to that of thalassemia major.
Thalassemia minor occurs from the inheritance of a single β-thalassemia mutation and a normal β-globin gene on the other chromosome. No clinical problems emerge, and anemia is mild or absent. The smear, however, is abnormal, with microcytic, hypochromic red cells. The MCV is 50 to 70 fl. Poikilocytosis, target cells, and basophilic stippling are typically present. Hemoglobin electrophoresis demonstrates HbA2 that is about twice normal and an HbA2:HbA ratio of 1:20, rather than the normal 1:40. HbF is increased in many patients.
Production of α-globin chains is regulated by four gene loci. Four α-thalassemia types occur, depending on how many gene foci are affected. No hematologic abnormalities develop with α-thalassemia-2, in which one focus fails to function. In α-thalassemia-1, two foci are affected, and the condition is mild, with slight or absent anemia. The blood smear shows microcytosis, hypochromia, and slight anisocytosis and poikilocytosis.
When three gene foci are defective, α-chain synthesis is substantially decreased, and excess β-chains form tetramers called HbH, which are soluble and do not precipitate in the marrow to cause damage of erythrocyte precursors. They are present in the circulating red cells, but precipitate as they age, forming inclusion bodies. The spleen, which enlarges in this disorder, prematurely destroys these cells, causing hemolytic anemia. This disease most commonly occurs in Asians, and the anemia is usually moderate, with hematocrits of 20 to 30. The blood smear shows substantial hypochromia, microcytosis, basophilic stippling, and polychromasia. Abnormal erythrocytes apparent on blood smear include target cells, teardrop cells, and nucleated and fragmented cells. Heinz-body preparations disclose precipitated HbH, visible as multiple small erythrocyte inclusions. On hemoglobin electrophoresis, about 3% to 30% of the total is HbH.
When four genes are defective, α-chains are absent, and tetramers of γ-chains called Hb Bart, form in the fetus. This hemoglobin oxygenates poorly, producing tissue hypoxia, and they are unstable, resulting in hemolysis and anemia. The fetus develops heart and liver failure, resulting in massive edema (hydrops fetalis) and intrauterine death. The disease almost always occurs in Southeast Asians.
Normocytic Anemias
Many of the causes of normocytic anemia, such as hemolysis, iron deficiency, leukemia, and myelodysplastic syndromes, are discussed and illustrated in other sections. The main causes considered here are pure red cell aplasia, aplastic anemia, the anemias caused by renal disease and endocrine disorders, and the anemia of chronic disease.
Pure Red Cell Aplasia
In this disorder, a normocytic anemia occurs with diminished reticulocytes (<1%), absence of polychromasia on the peripheral blood smear, and almost no erythroblasts in the bone marrow (<0.5% of the marrow differential count), despite normal megakaryocytes and white cell precursors. It may develop without apparent cause or be associated with a wide variety of systemic diseases. It occurs in about 5% of patients with thymoma, and this tumor accounts for approximately 10% of cases of pure red cell aplasia. Hematologic malignancies, especially chronic lymphocytic and large granular lymphocytic leukemias, have been associated, as have some solid tumors, rheumatic diseases (such as Sjögren syndrome and systemic lupus erythematosus [SLE]), and infections, primarily parvovirus B19. Numerous medications have been implicated, including phenytoin, azathioprine, and isoniazid. Sometimes, pure red cell aplasia occurs during pregnancy without any apparent explanation and typically disappears following delivery. In many patients, no cause is found. Often, in these cases, an IgG that inhibits erythropoiesis is present in the serum.
Aplastic Anemia
In aplastic anemia, a reduction in red cells occurs in the setting of pancytopenia in the peripheral blood and hypocellularity of the bone marrow. Certain forms, such as Fanconi anemia, are hereditary, whereas some acquired types have identifiable causes, such as medications, benzene exposure, or infections with certain viruses. Transfusion-associated graft-versus-host disease consists of fever, pancytopenia, and a generalized morbilliform eruption a few days to weeks following receipt of blood products containing competent lymphocytes. Aplastic anemia may develop in patients with paroxysmal nocturnal hemoglobinuria or as a complication of certain rheumatic diseases, such as eosinophilic fasciitis, SLE, or Sjögren syndrome. In the hemophagocytic syndrome, most commonly associated with viral infections or certain malignancies, pancytopenia, fever, hepatosplenomegaly, and lymph node enlargement occur, and the bone marrow, often hypocellular, shows macrophages ingesting erythrocytes.
Despite the many causes identified, most cases of aplastic anemia are unexplained. Many probably originate from immunologic damage to the bone marrow. Whether a cause is identified or not, the usual presentation is anemia and/or bleeding because of thrombocytopenia; infections are uncommon initially.
Anemia of Chronic Renal Disease
Anemia typically occurs with chronic renal disease only after the creatinine clearance decreases below 40 mL/min, which corresponds to a serum creatinine of about 2.5 mg/mL. The anemia tends to worsen as the renal function decreases, but it usually stabilizes at a hematocrit of 15 to 30. The cause of the kidney disease is not usually important in determining the severity of anemia, but it is typically less severe with polycystic kidney disease. Several factors cause the decrease in red cells, the most important, however, being inadequate renal production of erythropoietin, a glycoprotein hormone synthesized in the kidney and responsible for the proliferation, maturation, and differentiation of erythrocytes in the bone marrow. In addition, the red cell survival is shortened in uremia, and various toxins ordinarily excreted by the kidney accumulate in the serum and appear to depress erythropoiesis. The processes involved in the anemia of chronic disease, discussed later in this section, may also contribute.
The anemia is normochromic, normocytic, and most red cells are unremarkable on the peripheral smear. Burr cells (echinocytes), however, may form via unknown mechanisms, and sometimes schistocytes appear.
Anemia of Endocrine Disorders
Anemia, usually normocytic, occurs in several endocrine disorders. About 30% of patients with hypothyroidism have anemia, and about one-third of these are macrocytic. The anemia, usually mild, seems to be from the hormone deficiency itself, and its severity is related to the duration and degree of the hypothyroidism. Approximately 10% to 25% of patients with hyperthyroidism, usually with severe, prolonged disease, are anemic. The mechanism is uncertain.
Most patients with adrenal insufficiency have anemia, usually normocytic, normochromic. In those with autoimmune causes, pernicious anemia, producing a macrocytic anemia, is present in about 10%. Androgen deficiency also is a cause of normochromic, normocytic anemia. Hypopituitarism causes anemia through deficiencies of the previously mentioned thyroid, adrenal, and androgenic hormones.
A small number of patients with hyperparathyroidism have a normocytic, normochromic anemia, with bone marrow examinations typically demonstrating fibrosis. The increased parathyroid hormone may also decrease erythropoiesis.
Anemia of Chronic Disease
Anemia of chronic disease is quite common among certain illnesses lasting longer than 1 to 2 months, especially those with infection, noninfectious inflammation, or malignancy. In about 25% of cases, however, the only chronic diseases present in the patient, such as congestive heart failure or diabetes mellitus, have none of these features. Usually, the anemia is mild to moderate, with a hematocrit of >25 but, in about 20% of patients, it is more severe. Although the red cells are typically normocytic, normochromic, in about 30% they are microcytic (usually 70–79 fl), and in about 50% they are hypochromic (MCHC 26–32). The red cells on peripheral smear may display mild poikilocytosis and anisocytosis, but markedly small and thin cells, often seen in iron deficiency, are absent.
As in iron deficiency, the serum iron is reduced, but so is the iron-binding capacity, which is typically elevated in iron deficiency. As in iron deficiency, the saturation may be <10%. The serum ferritin, which is characteristically <15 µg/L in iron deficiency, is at least 30 µg/L and usually much higher in anemia of chronic disease. When the two disorders coexist in an individual patient, the serum ferritin is usually <30 µg/L. In ambiguous circumstances, definitive evidence to determine whether the patient has iron deficiency, anemia of chronic disease, or both simultaneously requires bone marrow samples stained for iron. A trial of oral iron therapy is an alternative; supplemental iron has no effect on a pure case of the anemia of chronic disease.
The main pathogenesis of the anemia of chronic disease appears to be the effects of cytokines on erythropoiesis. They impair the proliferation and differentiation of erythroid precursors, diminish erythropoietin production, and decrease the bone marrow response to erythropoietin. They also affect iron metabolism by increasing the retention of it in the bone marrow stores and by decreasing its availability for erythroid precursors. An additional contribution to the anemia is a mild to moderate decrease in erythrocyte lifespan.
Macrocytic Anemias
The differential diagnosis of macrocytic anemias is primarily between those whose cause is impaired DNA synthesis in the bone marrow, leading to megaloblastic changes in the red cell precursors, and those whose macrocytosis originates from other mechanisms. Among the latter are alcoholism, liver disease, hypothyroidism, and hemolysis or hemorrhage that causes the release of immature, enlarged red cells. In general, the macrocytosis in these disorders is mild (MCV 100–110 fl) and the enlarged red cells are round, rather than oval, as occurs with megaloblastic anemias. Many of the immature red cells released by the bone marrow in response to hemolysis or hemorrhage are easily recognizable by being polychromatic. Hypersegmented neutrophils, a feature of megaloblastic anemias, are not present in the nonmegaloblastic macrocytic anemias, except with myelodysplastic disorders.
The megaloblastic anemias arise from deficiencies in folic acid or vitamin B12 or from medications that impair DNA synthesis, such as cytotoxic agents used in cancer chemotherapy or immunosuppression (e.g., cyclophosphamide, azathioprine, hydroxyurea) and drugs that interfere with folic acid metabolism (e.g., methotrexate, trimethoprim). The result is defective nuclear maturation of hematopoietic cells in the bone marrow, in which nuclear division diminishes, but cytoplasmic growth, regulated by RNA, continues unabated. As a consequence, an erythrocytic megaloblast forms—a large cell with greater cytoplasm than normal and a relatively immature nucleus having a decreased condensation of the chromatin, leading to a lacy pattern. The discrepancy between maturation of the nucleus and cytoplasm is called nuclear–cytoplasmic asynchrony. Granulocyte precursors are enlarged as well, especially the metamyelocytes and bands, which are two to three times normal in size and have poorly condensed chromatin. Megakaryocytes are hypersegmented and also have lacy chromatin. The bone marrow is hypercellular, but many erythrocytes are destroyed there rather than reaching the systemic circulation, a process known as ineffective erythropoiesis. This intramedullary hemolysis causes increased levels of serum iron, unconjugated bilirubin, and LDH.
Early in the course of disease, the only finding in the peripheral blood may be mild macrocytosis (usually >110 fl). As anemia emerges, other abnormalities become apparent on the peripheral blood smear, including anisocytosis, poikilocytosis, teardrop cells, schistocytes, and basophilic stippling. Polychromasia is sparse, and the reticulocyte count is inappropriately low. Leukopenia and thrombocytopenia may occur. The presence of oval-shaped macrocytes and hypersegmented neutrophils (>5% of cells with five lobes or any with six or more lobes) strongly suggests a megaloblastic process.
Vitamin B12 is cyanocobalamin, one of a group of molecules called cobalamins that contain a central cobalt atom and are important in DNA synthesis. Cyanocobalamin is not found in the human body, but the term vitamin B12 often is used to apply to all cobalamins, which microbes in the soil, water, or intestinal tract synthesize. They are not found in plants, unless contaminated by microbes, and the main human source is meat, poultry, seafood, and dairy products. The recommended daily allowance of cobalamins is 5 µg, and the total body content is about 2 to 5 mg, about 1 mg being present in the liver. Because the daily losses are minute, cobalamin deficiency from diet alone takes years and occurs almost exclusively in strict vegetarians. In adults, the main cause of vitamin B12 deficiency is impaired absorption. Cobalamin binds to a substance in the gastric juice called R protein (haptocorrin) and is released by pancreatic enzymes when it reaches the second portion of duodenum. It then binds to intrinsic factor, a glycoprotein produced by the parietal cells in the fundus and cardia of the stomach. Intrinsic factor receptors are present on the ileal mucosa, especially in its terminal area, where cobalamin absorption occurs.
Disorders of the ileum, such as Crohn disease or lymphoma, can cause cobalamin deficiency because of malabsorption. Malabsorption of cobalamin also can occur with pancreatic insufficiency, when inadequate pancreatic enzymes are present to release cobalamin from the R proteins. Another cause of cobalamin deficiency is its consumption in the small intestine by a fish tapeworm, Diphyllobothrium latum, found mostly in fish from Canada, Alaska, and the Baltic Sea and acquired by eating undercooked fish or fish roe. Excessive intestinal bacteria in diseases associated with impaired motility or intestinal stasis, such as systemic sclerosis, extensive diverticula, or surgical blind loops, also can consume enough cobalamin to cause disease.
A major cause of cobalamin deficiency is from reduced intrinsic factor because of elimination of parietal cells from gastric resection or from chronic inflammation due to autoimmune mechanisms that lead to mucosal atrophy in the stomach's fundus and body. The latter disorder, pernicious anemia, occurs primarily in older adults, often with a family history of the disease; northern European descent; or concurrent autoimmune disorders, such as Graves disease, vitiligo, or Hashimoto thyroiditis. About 90% of patients have antibodies to parietal cells, compared with 5% in the general population, and approximately 60% have antibodies to intrinsic factor, which is rare in healthy people.
The clinical features of cobalamin deficiency include those from the anemia, but also gastrointestinal complaints, such as diarrhea and weight loss, and episodes of glossitis, leading to erythema and soreness, and, eventually, to loss of papillae, causing a smooth surface. Most importantly, cobalamin deficiency impairs nerve myelination, leading to degeneration of white matter in the brain and in both the dorsal and lateral columns of the spinal cord (subacute combined degeneration). Dorsal column involvement causes diminished vibratory sensation, creating numbness and tingling in the feet and hands (stocking–glove distribution), and decreased proprioception, producing gait difficulties and a positive Romberg sign. Lateral column damage causes limb weakness, spasticity, hyperactive reflexes, and a positive Babinski sign. Evidence of cerebral involvement includes depression, dementia, confusion, delusions, and hallucinations.
Folic acid deficiency usually is caused by an inadequate diet. Rich sources are fruits, vegetables, and animal protein, but cooking easily destroys folate. Furthermore, the body stores of folate are small, and only a few months of poor intake, caused by food fads, ignorance, poverty, or alcoholism, are necessary before anemia develops. Alcohol intake compounds the problem by increasing urinary folate excretion, impeding liver storage, and decreasing absorption, which occurs primarily in the duodenum and jejunum. Disorders affecting these portions of the intestine, such as sprue, lymphoma, amyloidosis, and Crohn's disease, can cause folate malabsorption. Folic acid deficiency also can occur when the body's demand for it increases, as in pregnancy and conditions associated with increased cell turnover, such as acute exacerbations of hemolytic anemia, leukemia, and exfoliative dermatitis. Some medications, such as methotrexate and trimethoprim, cause folate deficiency by altering its metabolism.
The diagnosis of folate and vitamin B12 deficiencies may be confusing. With cobalamin deficiency, serum cobalamin levels are usually low, but many are normal. The serum folate level is very sensitive to folate intake, and a recent folate-rich meal can normalize it. Red cell folate measurements, which can better reflect tissue levels, have several problems and are not generally helpful. Nevertheless, ordering serum levels of folate and cobalamin is a reasonable approach to a megaloblastic anemia. An alternate, or complementary, tactic to diagnosing these deficiencies is to measure homocysteine, which increases in both disorders because methionine synthesis is impaired by deficiency of either, and this laboratory finding typically precedes decreases in serum levels of folate and cobalamin. A cobalamin-dependent, but folate-independent, enzymatic reaction leads to increased serum levels of methylmalonic acid (MMA) with cobalamin deficiency. This finding also tends to precede changes in serum cobalamin. Accordingly, measurement of both homocysteine and MMA can reliably detect, and distinguish between, folate and cobalamin deficiencies. When both are elevated, cobalamin deficiency is confirmed, although concurrent folate deficiency is possible. If homocysteine is elevated and MMA is normal, folate deficiency is likely. If both are normal, deficiency of either is highly improbable. If cobalamin deficiency is present, the presence of antibody against intrinsic factor confirms the diagnosis of pernicious anemia.
A Schilling test can help distinguish among the causes of cobalamin deficiency. In normal people, oral radioactive cobalamin is absorbed from the alimentary tract and much of the dose will be excreted in the urine within 24 hours. With pernicious anemia, the absorption and urinary excretion are both decreased, but will normalize if the patient receives intrinsic factor along with the cobalamin. With other forms of intestinal malabsorption, urinary excretion of cobalamin remains low despite intrinsic factor. With bacterial overgrowth, the Schilling test may normalize after a course of antibiotics, and with pancreatic insufficiency, it should become normal with ingestion of pancreatic enzymes.
Microcytic Anemias
|
|
|
Diagram 1.1 Approach to anemia |
|
|
|
Figure 1.1 Pallor from anemia. Top to bottom panels: The conjunctiva, sublingual area, and hand on the left demonstrate pallor from anemia (hemoglobin of 5 g/dL) compared with the normal controls on the right. |
|
|
|
Figure 1.2 Curve of normal ranges of Hb in population studies. The lower limit of normal Hb concentration in men and women of various ages. Values were calculated from 11,547 subjects from the United States. (From Dallman PR, et al. Am J Clin Nutr 1984;39(4):437–445, with permission). |
|
|
|
Diagram 1.2 Approach to microcytic anemia |
|
|
|
Figure 1.3 Smooth tongue and koilonychia in iron deficiency. Top panel: Iron deficiency can result in a painless, smooth, shiny, and reddened tongue (courtesy Dr. P. Galbraith). Bottom panel: Koilonychia, a condition also referred to as “spoon-shaped nails,” is associated with iron deficiency in which the fingernails are thin, brittle, and concave with raised edges. |
|
|
|
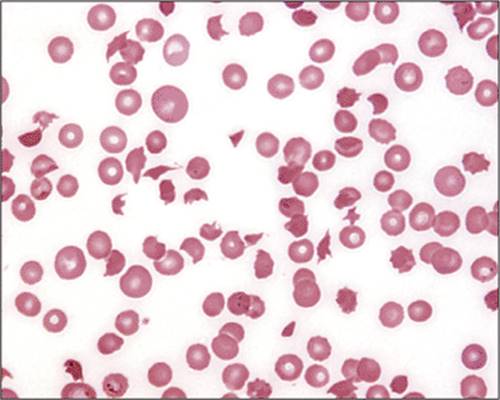
Figure 1.4 Iron deficiency blood films. Top panel: This peripheral blood film demonstrates severe iron deficiency with microcytosis, hypochromasia, and multiple morphologic changes: pencil cells, target cells, teardrops, and rare fragments. Early iron deficiency may be normocytic with no significant morphologic changes. Once the hemoglobin drops below 10–11 g/dL, red blood cell changes appear. Thrombocytosis may occur, but thrombocytopenia occasionally develops in severe iron deficiency. The morphologic changes in iron deficiency may be indistinguishable from α- or β-thalassemia trait, and iron studies, hemoglobin electrophoresis, and α-thalassemia testing may be required to differentiate these processes accurately. Red blood cell indices may be helpful: a mild, moderate, or severe decrease in hemoglobin, low MCV/MCH, and high RDW suggest iron deficiency. Bottom panel: Peripheral blood film of dual population in transfused iron deficiency. Most of the erythrocytes are hypochromic microcytic cells, (native iron deficient cells) with a minority of interspersed normocytic red blood cells (transfused red blood cells). This combination occurs in partially treated iron deficiency. It differs from sideroblastic anemia with a dual population in which most red cells are normochromic and the minority hypochromic. |
|
|
|
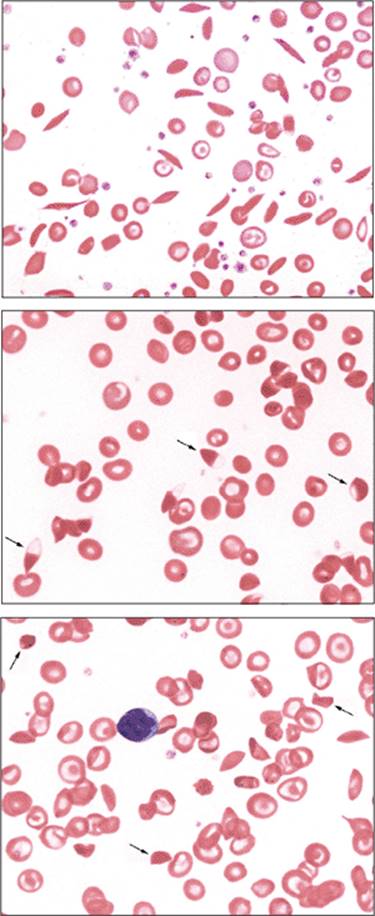
Figure 1.5 Iron deficiency blood films. Top panel: Microcytic blood film. This peripheral blood film demonstrates microcytosis. Red blood cell size can be visually estimated by comparing with the size of a small mature lymphocyte nucleus. Microcytic red blood cells should be smaller than the condensed nucleus of a mature lymphocyte. Bottom panel: Poikilocytosis and microcytosis that include numerous pencil cells are shown in this iron deficiency blood film. The degree of poikilocytosis has been observed to correlate with the degree of iron deficiency anemia. |
|
|
|
Figure 1.6 Iron deficiency and malabsorption. Peripheral blood film demonstrating hyposplenic changes in a patient with celiac disease causing iron deficiency due to malabsorption. Target cells, acanthocytes, and Howell-Jolly bodies (arrows) are seen. This patient has not had splenectomy, but this disease is a cause of functional hyposplenism. |
|
|
|
Figure 1.7 Automated hemocytometer report. Red blood cell volume curves demonstrating, from left to right: normal, unimodal RBC population; a small macrocytic population from a reactive increase in reticulocytes following therapy in iron deficiency; and a dual population of red blood cells in sideroblastic anemia. |
|
|
|
Figure 1.8 Bone marrow iron stores. Bone marrow aspirate stained with Prussian blue that shows absent iron stores with no visible blue staining, consistent with iron deficiency. Absence of bone marrow iron is one of the earliest findings in iron deficiency. |
|
|
|
Figure 1.9 Bone marrow iron stores. Low and higher magnification views (left and right, respectively) of bone marrow aspirate smears stained with Prussian blue showing varying degrees of iron staining in histiocytes. |
|
|
|
Figure 1.10 Iron deficiency from adenocarcinoma of the large bowel. A large polypoid adenocarcinoma is shown that is penetrating through the wall of the large intestine. Patients with bowel tumors often present with signs and symptoms of iron-deficiency anemia related to chronic blood loss. |
|
|
|
Figure 1.11 Hereditary telangiectasia. Vascular malformations are present on the face, lips, and hands in this patient with hereditary telangiectasia. This patient presented with iron-deficiency anemia caused by recurrent GI bleeding from gastrointestinal tract telangiectasia. (Courtesy Dr. J. Crookston.) |
|
Table 1.1 Hemoglobinopathies associated with microcytosis |
|
|
|
|
|
|
|
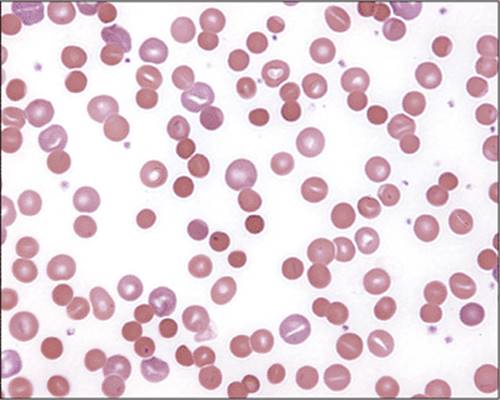
Figure 1.12 Thalassemia trait blood film. Peripheral blood films in β-thalassemia trait may demonstrate microcytosis and possibly hypochromasia. Multiple morphologic changes including target cells, teardrop cells, and rare fragments may occur. These features can appear identical to the morphologic picture of iron deficiency. Basophilic stippling can occur in Mediterranean populations with β-thalassemia trait and is less common in other populations with this disorder. Basophilic stippling may help distinguish β-thalassemia trait from iron deficiency, but is not always present in patients with β-thalassemia trait. Red blood cell indices may help: a normal or slightly decreased hemoglobin with a low MCV/MCH and a low or mildly increased RDW suggests thalassemia. Red blood cell indices may not always distinguish iron deficiency from thalassemia trait, however. Patients also may have combined iron deficiency and β-thalassemia trait and therefore require further testing to exclude the former. |
|
|
|
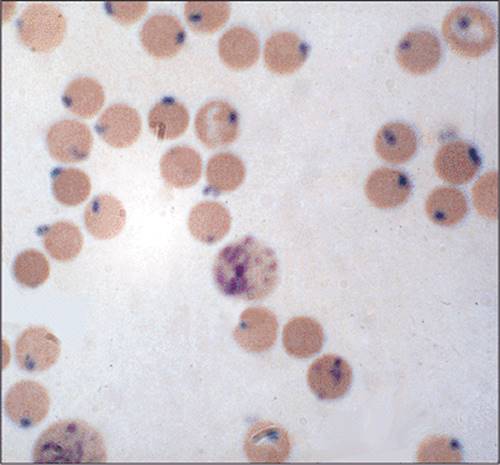
Figure 1.13 Basophilic stippling in thalassemia. Peripheral blood film demonstrating microcytic hypochromic RBCs and basophilic stippling (arrows). Basophilic stippling occurs in thalassemia as well as in other hematologic disorders. |
|
|
|
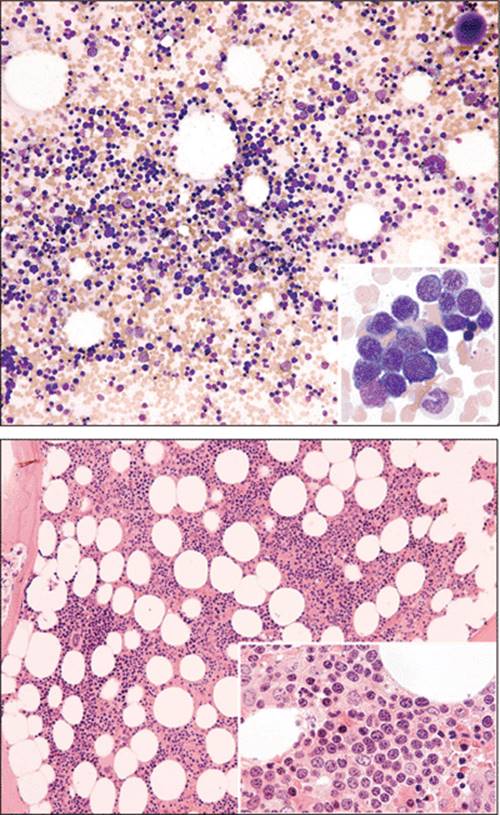
Figure 1.14 Bone marrow in thalassemia. Top and bottom panels show bone marrow aspirate and biopsy, respectively, from a case of thalassemia trait. The bone marrow has increased numbers of erythroid precursors (a low myeloid to erythroid ratio) related to the increased peripheral RBC destruction in this disease. |
|
Table 1.2 Basophilic stippling |
|
|
|
|
|
|
|
Figure 1.15 High-performance liquid chromatography (HPLC) sample demonstrating increased hemoglobin A2 (arrow) in a case of β-thalassemia trait. HPLC is an automated way of separating and identifying variant hemoglobins and is more accurate at quantifying hemoglobin A2 than is Hb electrophoresis. It can separate HbA2 from certain hemoglobins, which is not possible using hemoglobin electrophoresis alone. |
|
|
|
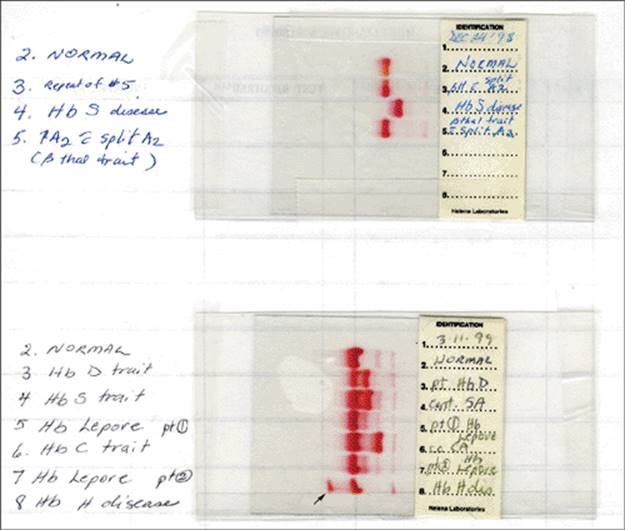
Figure 1.16 Alkaline hemoglobin (Hb) electrophoresis. Top panel: Lane 2: Normal. Lanes 3 and 5: β-thalassemia trait. Lane 4: HbS disease. Bottom panel: Lane 2: Normal. Lane 3: Hb D trait. Lane 4: HbS trait. Lanes 5 and 7: Hb Lepore trait (faint band around HbS band area). Lane 6: HbC trait. Lane 8: HbH disease (note fast-moving Hb band, arrow). Hemoglobins that move with HbS on alkaline include D/G/Lepore, and hemoglobins that move with HbC on alkaline include E/O/A2. |
|
|
|
Figure 1.17 HbH inclusions. Peripheral blood stained with supravital stain brilliant cresyl blue. The red blood cell near the top central area (red arrow) demonstrates numerous inclusions in an evenly diffuse distribution, creating a “golf ball” pattern. This cell is an HbH inclusion body seen in α-thalassemia. The difference between the HbH bodies that appear like dimpled golf balls with diffuse even involvement can be seen from reticulocytes with uneven reticulin deposits (black arrows). The HbH inclusions are precipitated β-globin tetramers. Reticulocytes, Heinz bodies, and Howell-Jolly bodies stain positive with brilliant cresyl blue. Reticulocytes are darker, more reticular, clumped, and uneven in distribution. Heinz bodies are larger and not so numerous. Howell-Jolly bodies are usually single inclusions. These inclusions appear after 10 minutes of incubation at room temperature, whereas HbH inclusions require incubation at 37°C for 1 to 2 hours. Rare HbH inclusion bodies may be seen in one or two α-gene deletions in α-thalassemia trait, but there the absence of identifying these inclusion bodies does not exclude the disorder, which may require molecular studies for definitive diagnosis. In HbH disease (three α-gene deletion), HbH bodies are frequent and easily identifiable. (Courtesy Dr. D. Amato.) |
|
|
|
Figure 1.18 Hemoglobin H disease. This blood film demonstrates microcytosis, hypochromasia, and numerous morphologic abnormalities, including target cells, microspherocytes, and fragments. Basophilic stippling may occur. Polychromasia is present. |
|
|
|
Figure 1.19 Hydrops fetalis at autopsy in hemoglobin Bart disease. Hepatosplenomegaly in a newborn with hemoglobin Bart disease. The loss of all four α-globin genes results in severe anemia, high-output heart failure, splenomegaly, edema, and intrauterine or immediately postpartum death for the affected fetus. Dystocia, eclampsia, and hemorrhage can occur in the mother carrying the affected fetus. (Courtesy Dr. D. Amato.) |
|
Table 1.3 HbH inclusions |
|
|
|
|
|
|
|
Figure 1.20 α-Thalassemia diagnosis by polymerase chain reaction (PCR) amplification of DNA. Multiplex PCR results for the seven most common deletional mutations of the α-globulin gene cluster. The LIS1 gene at 17p13.3 was included as an amplification control. Using genomic DNA from known genotypes for the following mutant alleles: -α 3.7, -α 4.2, - -FIL, - -MED, and -Sea. Plasmid controls for -THAI and -(α)20.5 were mixed with normal genomic DNA to mimic the heterozygous state. M represents the γ-BstE II molecular weight marker. Lane 1, blank; lane 2, αα/αα; lane 3, -3.7/-4.2; lane 4, αα/- -FIL; lane 5, αα/- -SEA; lane 6, αα/- -MED; lane 7, αα/- -THAI; lane 8, αα/–(α)20.5; lane 9, αα/αα; lane 10, αα /αα; lane 11, - -MED/–α .7. (Courtesy C. Wei.) |
|
|
|
Figure 1.21 β-Thalassemia facial bone abnormalities. These changes include bossing of the skull; hypertrophy of the maxilla, exposing the upper teeth; depression of nasal bridge; and periorbital puffiness. (Courtesy Dr. N.F. Olivieri.) |
|
|
|
Figure 1.22 β-Thalassemia major leg ulcer. Leg ulcers can occur in all types of hereditary hemolytic anemias, including sickle cell disease and hereditary spherocytosis. (Courtesy Dr. N.F. Olivieri.) |
|
|
|
Figure 1.23 β-Thalassemia major. Note the pallor, short stature, massive hepatosplenomegaly, and wasted limbs in this undertransfused case of β-thalassemia major. (Courtesy Dr. N.F. Olivieri.) |
|
|
|
Figure 1.24 β-Thalassemia major. Unless they have had transfusions, patients with this disease usually have severe anemia. This peripheral blood film demonstrates many nucleated red blood cells, microcytosis, and hypochromasia with multiple morphologic changes: target cells, teardrop cells, fragments, basophilic stippling, and Pappenheimer bodies. The nucleated red blood cells may be dysplastic or show abnormal hemoglobinization. Neutrophilia and thrombocytosis may occur. This patient has undergone splenectomy for hypersplenism and increased transfusion requirements. Howell-Jolly bodies are present. |
|
|
|
Figure 1.25 β-Thalassemia bone abnormalities. Note the “hair on end” appearance of the cortical bone caused by expansion of the bone marrow (arrows). The subperiosteal bone grows in radiating striations, which appears as “hairs.” (Courtesy Dr. N.F. Olivieri.) |
|
|
|
Figure 1.26 Kleihauer Betke test. This peripheral blood from a postpartum woman with fetomaternal hemorrhage demonstrates HbF containing fetal cells (dark red) in a background of maternal cells (ghost-like cells). HbF cells are resistant to acid elution of hemoglobin. Aside from detecting fetal cells in the mother's blood in a fetomaternal hemorrhage, it can be used to detect HbF–containing cells in β-thalassemia, hereditary persistence of hemoglobin F (some types have homogeneous distribution of HbF in the cells), sickle cell disease, δβ-thalassemia, and myelodysplastic syndrome. |
|
|
|
Figure 1.27 Sideroblastic anemia. Peripheral blood film of dual population and sideroblastic anemia. Normocytic cells are present, along with a minor population of microcytic, hypochromic erythrocytes possessing a thin rim of cytoplasm. Occasional teardrop cells are visible. Pappenheimer bodies, target cells, and basophilic stippling occur in some cases. |
|
|
|
Figure 1.28 RBC inclusions. In Wright-stained blood, Pappenheimer bodies are usually multiple and vary in size and Howell-Jolly bodies are typically round, smooth, and single. |
|
|
|
Figure 1.29 Pappenheimer bodies. Pappenheimer bodies are single or multiple blue, small, and angular inclusions within the erythrocyte. By contrast, Howell-Jolly bodies are usually single inclusions that are larger and round, not angular. Basophilic stippling is evenly distributed over the whole cell. Pappenheimer bodies are positive when stained for iron. |
|
|
||||||||||||||||||||
|
Figure 1.30 Sideroblastic anemia. Numerous ringed sideroblasts are seen in this marrow aspirate smear stained for iron. They are normoblasts with ≥10 iron-containing granules in the cytoplasm encircling at least one-third of the nucleus. Often, focusing up and down on the cell will more clearly demonstrate the iron-containing granules. |
||||||||||||||||||||
|
Table 1.4 Red blood cell inclusions |
||||||||||||||||||||
|
|
Table 1.5 Pappenheimer bodies |
|
|
|
|
|
|
|
Figure 1.31 Top panel: Gums in lead poisoning. Lead lines are shown in gums of this patient suffering from lead poisoning. Bottom panel: Peripheral blood film demonstrating coarse basophilic stippling. Normocytic or microcytic anemia may be present. |
|
|
|
Diagram 1.3 Approach to normocytic anemia |
|
|
|
Figure 1.32 Top panel: Bone marrow aspirate demonstrating a hypocellular fragment from a patient with aplastic anemia. Although bone marrow cellularity can be estimated from fragments on the aspirate, the bone marrow biopsy is a better sample to estimate cellularity. Bottom panel: Aplastic bone marrow biopsy showing <10% cellularity. |
|
|
|
Figure 1.33 Parvovirus B19-induced pure red cell aplasia. Left panel: Bone marrow aspirate smear shows a giant erythroblast with intranuclear viral inclusion. This inclusion can resemble a large nucleolus, and the cytoplasm may be dark blue and contain vacuoles. Right panel: Bone marrow biopsy with early erythroid precursors showing “glassy” intranuclear inclusions (so-called lantern cells; arrows). |
|
|
|
|
Figure 1.34 Pure red cell aplasia. Bone marrow aspirate smear showing absence of erythroid precursors in PRCA. |
|
|
Table 1.6 Echinocytes |
|
|
|
Table 1.7 Teardrop cells |
|
|
|
|
|
|
|
Figure 1.35 Echinocytes. Peripheral blood film demonstrating echinocytes, also called burr cells. The cells have central pallor and a diffuse, even distribution of short, bumpy projections with rounded edges around the surface of the red blood cell. Echinocytes resemble a bottle cap when viewed from above. This blood film could represent an example of anemia of chronic disease. The latter usually demonstrates a normocytic, normochromic anemia. Microcytosis and hypochromasia can develop as the severity of the underlying disease increases. The red blood cells may appear normal, demonstrate nonspecific changes, or display features secondary to the underlying cause (e.g., rouleaux due to inflammatory protein or hyperfibrinogenemia). Neutrophilia and thrombocytosis may occur. |
|
|
|
Figure 1.36 Peripheral blood film of patient recently transfused with red blood cells. Note a small population of echinocytes, which represent the recently transfused red blood cells. |
|
|
|
Figure 1.37 Increased marrow iron stores. Top panel: Bone marrow aspirate demonstrating increased iron staining in a fragment. This finding is present in a patient with anemia of chronic disease. Increased iron stores also occur in frequently transfused patients. Bottom panel: Normal iron staining in histiocytes is shown for comparison. |
|
|
|
Figure 1.38 Peripheral blood film demonstrating teardrop cells in myelofibrosis. One side of the cell is tapered and ends in a blunt tip. |
|
Table 1.8 Leukoerythroblastic picture |
|
|
|
|
|
|
|
Figure 1.39 Leukoerythroblastic picture. Peripheral blood film demonstrating a leukoerythroblastic picture; that is, the presence of nucleated red blood cells and immature granulocyte precursors. |
|
|
|
Figure 1.40 Peripheral blood film with Romanowsky stain demonstrating polychromatophilic cells. The polychromatophilic cells are basophilic because of increased RNA content. Not all reticulocytes are polychromatophilic on Romanowsky stains, and assigning the number of polychromatophilic cells alone as a surrogate marker for reticulocytosis underestimates the reticulocyte count. The cells are usually larger than normocytic red blood cells. |
|
|
|
Figure 1.41 Supravital stain of reticulocytes with brilliant cresyl blue. The blue-stained reticular inclusions in the red blood cells represent ribosomes that are precipitated when exposed to brilliant cresyl blue. The National Committee for Clinical Laboratory Standards (NCCLS) definition of reticulocyte is “any non-nucleated red blood cell containing ≥2 particles of blue-staining material corresponding to ribosomal RNA.” Howell-Jolly bodies, Pappenheimer bodies, and Heinz bodies can be mistaken for reticulin precipitation. The more immature the reticulocyte, the more reticulin precipitation occurs. |
|
|
|
Figure 1.42 Automated hemocytometer reticulocyte counts. Fluorochromes are used to bind to the RNA of reticulocytes, which then fluoresce and can be counted by flow cytometry. The degree of fluorescence gauges the maturity of reticulocytes, with more immature reticulocytes demonstrating more fluorescence. Mature red blood cells are red, and reticulocytes are green. The histogram on the left demonstrates a very low reticulocyte count, and the histogram on the right shows a high reticulocyte count. Automated reticulocyte counts allow more reticulocytes to be counted than manual reticulocyte counts and provide more precise and rapid measurement. |
|
|
|
|
Figure 1.43 Bone marrow findings in hemolytic anemia. Top panel: Erythroid hyperplasia is present with a predominance of erythroid precursors. The normal myeloid to erythroid ratio in a bone marrow aspirate is 3 to 5:1. In this case, there occurs a reversal of the myeloid to erythroid ratio of 1:4. A similar picture occurs in acute hemorrhage. Occasional mild dysplastic erythroid precursors may be presenting these cases. Bottom panel: Bone marrow biopsy in a patient with hemolytic anemia. Erythroid hyperplasia is seen with a predominance of erythroid precursors. |
|
|
Table 1.9 Spherocytosis |
|
|
|
|
|
Figure 1.44 Autoimmune hemolytic anemia. Numerous spherocytes, small round RBCs lacking central pallor, are shown in this blood smear from a case of Coombs-positive hemolytic anemia. |
|
|
|
Figure 1.45 Hereditary spherocytosis. Peripheral blood film of spherocytic hemolysis. Spherocytes are round, are slightly smaller than normal red blood cells, and lack central pallor. Note the nucleated red blood cells and polychromatophilic cells. It is important to look in the area of the slide where red blood cells are nearly touching each other to properly identify spherocytes. Red blood cells normally have a spherical appearance at the tail (thin) end of the blood smear. |
|
|
|
Figure 1.46 Osmotic fragility curves of normal and hereditary spherocytosis red blood cells. RBCs are exposed to decreasing strengths of hypotonic saline solutions, and the degree of hemolysis (%) is measured. Increased fragility is indicated by a shift of the curve to the left, and is seen in conditions associated with spherocytosis. In the fresh sample on the left, a tail of HS cells occurs with increased sensitivity. Incubation of the sample for 24 hours prior (graph on the right) accentuates the osmotic fragility of spherocytes, whereas normal cells only become more slightly fragile. The osmotic fragility of unincubated blood may be normal in some patients with HS; therefore, incubated testing should be performed as well. |
|
|
|
Figure 1.47 Peripheral blood film of microspherocytes seen in Clostridium perfringens sepsis. Although regular spherocytes are usually smaller than normocytic red blood cells, microspherocytes are even smaller than that. This finding is usually seen in critically ill, septic patients with severe C. perfringens infection. |
|
Table 1.10 Red blood cell agglutination |
|
|
|
|
|
|
|
Figure 1.48 Chronic cold agglutinin disease. The hand on the right in this picture is warmed in a patient with chronic cold agglutinin disease. Middle panel: Macroscopic appearance of red blood cell agglutination at 37°C in a tube of blood from a patient with cold-agglutinin hemolytic anemia secondary to infection with Mycoplasma pneumoniae. Bottom panel: Serum in capillary tubes from a cold agglutinin specimen at room temperature (top) and 4°C (bottom) illustrating RBC agglutination at cold temperature. (Courtesy Dr. I. Quirt.) |
|
|
|
Figure 1.49 Cold agglutinin. Peripheral blood film of red blood cell aggregates and cold agglutinin disorder. The red blood cells form clumps in which distinguishing the borders of individual erythrocytes is difficult. In cold autoimmune hemolysis, polychromasia, nucleated red blood cells, and spherocytes also may be present. The width and length of the red blood cell agglutinates are approximately equal, unlike rouleaux, in which red blood cells are arranged linearly in chains. The borders of erythrocytes are more easily distinguishable in rouleaux. |
|
|
|
Figure 1.50 Paroxysmal cold hemoglobinuria. Top panel: Blood film demonstrates small red blood cell agglutinates in a patient with paroxysmal cold hemoglobinuria. The bottom panel discloses erythrophagocytosis by a neutrophil in a patient with this disorder. |
|
|
|
Figure 1.51 Bite cells. The red blood cells in this peripheral smear appear bitten. The erythrocyte may retain or lose central pallor, depending on the size and numbers of bites. In some cases, the bite cell may be mistaken for helmet cells, a type of fragmented erythrocyte. The examiner, therefore, should consider the company that this cell keeps (i.e., the predominant morphology of the surrounding red blood cells) before deciding if the process is one of oxidation or fragmentation. A double bite cell is displayed in the center of the figure. |
|
|
|
Figure 1.52 Oxidative hemolysis. Peripheral blood film demonstrating blister cells in a patient with glucose-6-phosphate dehydrogenase deficiency. The blister appears as a vacuole in the erythrocyte's hemoglobin at the edge of the red blood cell surface. A thin rim of cytoplasm seems to enclose this vacuole. This cell is usually a precursor to a bite cell. |
|
Table 1.11 Bite cells/blister cells |
|
|
|
|
|
|
|
Figure 1.53 Oxidative hemolysis. Irregularly contracted cells are smaller than normocytic red blood cells in this blood film from a case of oxidative hemolysis. They do not have central pallor but, in contrast to spherocytes, they are irregular in shape and not spherical. The increased density of the irregularly contracted cells may give the hemoglobin a dark copper color. Occasional bite cells are present. |
|
Table 1.12 Irregularly contracted cells |
|
|
|
|
|
Figure 1.54 Heinz bodies. Peripheral blood stained with crystal violet supravital stain demonstrating Heinz-body inclusions, which are not visible with Romanowsky stains alone. Heinz bodies are purple-blue, large, single or multiple inclusions attached to the inner surface of the red blood cell membrane. They represent precipitated normal or unstable hemoglobins. Heinz bodies are more frequently seen postsplenectomy, and testing should be done within 1 hour after blood is collected. Reticulocytes do not stain with crystal violet. |
|
|
|
Figure 1.55 Microangiopathic hemolytic anemia. RBC fragments of variable shapes and sizes that lack central pallor are seen in this blood smear. RBC fragments have received specific names because of their shape; for example, comet cell, triangular cell, and schistocyte. The presence or absence of any of these cells does not have an impact on diagnosis or prognosis. In the process of red cell fragmentation, an occasional irregularly contracted erythrocyte, a bite cell, or spherocytes can be seen, but the diagnosis of microangiopathic hemolytic anemia should be made by the morphology of the majority of cells, which in this case are fragments. Note the severe thrombocytopenia. |
|
Table 1.13 Heinz bodies |
|
|
|
|
Table 1.14 Fragmentation |
|
|
|
Table 1.15 Causes of intravascular hemolysis |
|
|
|
|
|
|
|
Figure 1.56 Thrombotic thrombocytopenic purpura (TTP). A. Coronal section through autopsy brain showing multiple small hemorrhages (arrows) from diffuse microvascular occlusion of arterioles and capillaries (B). Part C is the blood smear from the same patient, displaying a microhemangiopathic picture with RBC fragments and profound thrombocytopenia. (Courtesy Dr. J. Bilbao.) |
|
|
|
Figure 1.57 Jaundice, anemia, and hemoglobinemia from intravascular hemolysis. Top panels: Scleral icterus and pallor from autoimmune hemolysis is shown in the left upper panel. The right upper panel shows serum samples: The clear sample on the left is normal and the sample on the right is from a patient with hemolysis. The red color is from free hemoglobin released from lysed red blood cells in the serum. Lower panel: Normal control without scleral icterus and pallor. |
|
|
|
Figure 1.58 Hemoglobinuria from intravascular hemolysis. Top panel: The urine sample on the left is normal. The sample to the right demonstrates the red appearance of urine due to hemoglobinuria during acute hemolysis. Bottom panel: Urine positive for hemosiderin in a patient with intravascular hemolysis. This urine sample is stained for iron with Perl stain. Hemosiderin deposition (blue) in sloughed epithelial cells of renal tubules occurs in patients who have had intravascular hemolysis within the last 7 days. This test may be useful in detecting a recent episode of hemolysis that has resolved. |
|
|
|
Figure 1.59 Top panel: Hemoglobinuria in paroxysmal nocturnal hemoglobinuria (PNH). Urine taken over the course of days in a patient with PNH. The varying color depends on the degree of hemolysis at any one time. First morning urines tend to be darker, as well as urines taken during intercurrent illnesses, due to increased intravascular hemolysis. (Courtesy Dr. J. Crookston.) Bottom panel: Flow cytometry histogram of granulocytes marked for CD59. CD59 is a protein anchored by a GPI anchor that is deficient in individuals with PNH. This histogram demonstrates a population of negative CD59 granulocytes (PNH cells; PNH type I cells) and positive CD59 granulocytes (normal cells; PNH type III cells) in a patient with PNH. No population exists in the middle with weak CD59 expression (PNH type II cells). (Courtesy J. Davidson and R. Sutherland) |
|
|
|
Figure 1.60 Flow cytometry histogram of WBC marked for fluorescent aerolysin (FLAER). The aerolysin stains positive those cells that have a GPI anchor. PNH cells do not have this and will stain negative. The green cells are granulocytes, the blue cells monocytes, and the red cells lymphocytes. A large population of granulocytes and monocytes stain negative for FLAER, consistent with PNH cells. (Courtesy J. Davidson and R. Sutherland.) |
|
|
|
|
Figure 1.61 Peripheral blood film demonstrating spiculated spheroid cells in a patient with pyruvate kinase hemolytic anemia. In some cases, elliptocytes are present. After splenectomy, spiculated cells increase. |
|
|
Table 1.16 Elliptocytosis |
|
|
|
|
|
|
Figure 1.62 Hereditary elliptocytosis. Elliptocytes and ovalocytes are present in this blood film from a case of hereditary elliptocytosis. Elliptocytes are elongated with rounded edges (as opposed to sharp edges in sickle cells). |
|
|
Table 1.17 Stomatocytes |
|
|
|
|
|
Figure 1.63 Hereditary stomatocytosis. The red blood cells in this blood smear demonstrate slit-like central pallor, creating the appearance of a mouth (stoma in Greek), from which the name stomatocytes derives. Hereditary stomatocytosis may demonstrate 10% to 50% stomatocytes on the peripheral blood film. Ovalocytes and macrocytes also may be present. |
|
|
|
Figure 1.64 Hereditary pyropoikilocytosis. Peripheral blood film in patient with hereditary pyropoikilocytosis. Significant variations in size and shape are present: teardrops, fragments, microspherocytes, elliptocytes, and small pieces and buds of red blood cells. Heating the specimen increases this effect. These morphologic changes occur at a lower temperature than with samples from people without this disorder. |
|
|
|
Figure 1.65 Infectious organisms in the peripheral blood that can cause hemolysis: On the left red blood cell inclusions of Falciparum malaria are seen. On the right Babesiosis is seen within the red blood cells. Bartonellosis causes hemolytic anemia as well. |
|
Table 1.18 Sickling disorders |
|
|
|
|
|
|
|
Figure 1.66 Cryoglobulinemia. Precipitated cryoglobulins (arrows, top panel) may appear as white spots on top of red blood cells, usually at the edges of the erythrocyte, and can be easily mistaken for bite cells and blister cells. Purplish clouds of precipitated cryoglobulins overlapping onto the red blood cells are displayed in both of these blood smears. |
|
|
|
Figure 1.67 Picture of centrifuged blood from a patient with a high IgA paraprotein. The IgA paraprotein has crosslinked and become hyperviscous so that the red blood cells at the bottom of the tube are not able to pass through the plasma despite the tube being inverted. (Courtesy Dr. I. Quirt.) |
|
|
|
Figure 1.68 Sickle cell anemia and cholelithiasis. Gallstones extracted from a patient with chronic hemolysis from sickle cell disease. These stones may provoke cholecystitis. Cholelithiasis also can occur in patients with other hereditary hemolytic disorders, such as hereditary spherocytosis. (Courtesy Dr. N.F. Olivieri.) |
|
|
|
Figure 1.69 Sickle cell retinal changes. A. “Comma” vascular sign: superficial conjunctival vessel that contains densely packed sickle cells (arrow). B. Widened veins and tortuous large retinal vessels. C. Large preretinal hemorrhage of approximately 2 weeks' duration. D. Old pigmented chorioretinal scar. |
|
|
|
Figure 1.70 Sickle cell anemia boney abnormalities. Chest radiographs of the spine reveal central endplate depression with sparing of the anterior and posterior margins of the endplate (arrow). Several names have been used to describe these changes such as “H-shaped vertebra” or “Lincoln-Log Sign.” Although not pathognomonic, these radiologic findings are seen most often in sickle cell disease. In addition, the gastric air bubble occupies most of the region under the left hemidiaphragm extending to the left lateral thoracic cage, suggesting the absence of a spleen. |
|
|
|
Figure 1.71 Sickle cell anemia skin ulcers. The most common site of skin ulcers in sickle cell anemia is the lower limb, often over bony prominences. The ulcerations often have no antecedent trauma and can progress over time to extend into the dermis and subcutaneous tissue. (Courtesy Dr. N.F. Olivieri.) |
|
|
|
Figure 1.72 Sickle cell anemia. Top panel: Peripheral blood film of hemoglobin SS (HbS disease). The numerous elongated erythrocytes with sharp points are classic sickle cells. Sickle cells that appear folded over are called envelope cells. Target cells are present, in this case because of hyposplenism from the splenic infarction that occurs in HbSS patients. Howell-Jolly bodies may be seen as well. Middle panel: Peripheral blood film in patient with HbSS, demonstrating sickle cells with Hb concentrated at one end and absent at the other, called hemi-lunes (arrows), a finding seen in HbSS or HbSC. Bottom panel: Peripheral blood film in patient with HbSS, demonstrating short, stubby, and rhomboid-shaped sickle cells called oat and boat cells (arrows). |
|
|
|
Figure 1.73 Sickle cells. A composite figure taken from different sickle cell anemia cases showing various types of sickle cells. |
|
|
|
Figure 1.74 Sickle cell solubility test. In this test, whole blood is added to a high phosphate buffer with saponin and sodium dithionite, which causes the hemoglobin to become deoxyhemoglobin. Deoxyhemoglobin S is insoluble. The turbidity of the sample on the left indicates the presence of HbS. The clear sample on the right contains no HbS. |
|
|
|
Figure 1.75 Top panel: High-performance liquid chromatography (HPLC) sample demonstrating hemoglobin S trait (HbA = 60%, HbS = 40%). HPLC can separate HbS from HbD/G/Lepore, which are seen in the same band on alkaline Hb electrophoresis. Lower panel: HPLC sample demonstrating hemoglobin S disease (HbS = 90%). Note the absence of hemoglobin A. |
|
|
|
Figure 1.76 Hemoglobin S/β-thalassemia. Sickle cells and target cells are present in this blood film. The red blood cells are microcytic, demonstrated by a diameter smaller than the nucleus of the mature lymphocyte in the bottom central region of this picture. The morphology may appear the same as in a patient with hemoglobin SS/α-thalassemia or HBSS with iron deficiency. |
|
|
|
Figure 1.77 Hemoglobin SC disease. Most of the erythrocytes in this blood smear are target cells. Few sickle cells are present, and they tend to be short, stubby, and rhomboid-shaped (oat or boat cells). Irregularly contracted cells also are present. Rarely, hemoglobin C crystals are visible. The diagnosis of hemoglobin SC disease can be difficult using peripheral blood films alone because few sickle cells are present. It may appear very similar to HbC disease. These patients may not demonstrate hyposplenic changes and may have fewer nucleated red cells than do HbSS patients. |
|
|
|
Figure 1.78 HbSC disease. The condensation of Hb crystals in this blood film produces dark, blunt protuberances and other distortions. (From Diggs LW, Bell A. 1965. Intraerythrocytic crystals in sickle cell-hemoglobin C disease, American Society of Hematology, with permission.) |
|
|
|
Figure 1.79 Hemoglobin C disease. Target cells, irregularly contracted cells, and hemoglobin C crystals are present with microcytosis in this blood smear. Hemoglobin C crystals (arrows) are seen in cells that are otherwise empty of hemoglobin. Hemoglobin C crystals are an uncommon finding. More frequent are target cells, irregularly contracted erythrocytes, and microcytosis. (Courtesy Dr. A. Chesney.) |
|
|
|
Figure 1.80 Peripheral blood film of thermal injury. This slide, from a patient with severe burns, demonstrates microspherocytes and pieces of red blood cells that can appear as barbell shapes, rod-like cells, or budding erythrocytes. Even these small pieces may retain a central pallor. Similar morphologic changes occur in hereditary pyropoikilocytosis. Clinical history will differentiate these two processes. |
|
|
|
Diagram 1.4 Approach to macrocytic anemia |
|
|
|
Figure 1.81 Smooth tongue of pernicious anemia. Top panel: The loss of papillae in pernicious anemia causes the tongue to be smooth, usually most marked along the edges. The tongue also may be red and painful. Occasionally, red patches are observed on the edges of the dorsum of the tongue. Middle panel: Atrophic gastritis of pernicious anemia. Gross pathologic sample of stomach from a patient with pernicious anemia and vitamin B12 deficiency. Atrophy of the fundus is present. Classic pernicious anemia is caused by the failure of gastric parietal cells to produce intrinsic factor to permit the absorption of vitamin B12. This disease is associated with gastric atrophy and achlorhydria. Coexistent iron deficiency is common because achlorhydria decreases iron absorption. Pernicious anemia is associated with an increased incidence of gastric carcinoma. Lower panel: normal gastric mucosa for comparison. |
|
|
|
Figure 1.82 Macrocytic RBCs and hypersegmented neutrophils. Top left panel: Peripheral blood film demonstrating oval macrocytes. The cells are larger than normocytic red blood cells (MCV >100 fl). The rule of thumb is that oval macrocytes are larger than the condensed nucleus of a mature lymphocyte. The cells should not be polychromatophilic (blue/purple staining), which differentiates them from reticulocytes. Oval macrocytes usually occur in megaloblastic states. Because the MCV is an average of cell size, macrocytes can be present in the peripheral blood film with a normocytic MCV (< 100 fl). Accordingly, the finding of oval macrocytes on the peripheral blood film with a normal MCV still may be clinically significant. When oval macrocytes are present, the examiner should search for neutrophil abnormalities, including hyper- and hyposegmented nuclei or hypogranulated cytoplasm. The rule of thumb is that round macrocytes are larger than the condensed nucleus of a mature lymphocyte. The cells should not be polychromatophilic (blue/purple staining), which differentiates them from reticulocytes. Right upper panel: Blood film displaying a round macrocyte. Round macrocytes occur in several disorders. Lower panel: Peripheral blood film demonstrating hypersegmented neutrophils with oval macrocytes (arrows) in a patient with vitamin B12deficiency. Neutrophils are hypersegmented when >5% of neutrophils have five lobes or more, or occasional neutrophils have six lobes or more. |
P.42
|
|
|
Figure 1.83 Bone marrow in megaloblastic anemia. Megaloblastic erythroid and granulocytic precursors are demonstrated in this marrow aspirate smear. Giant bands, twice the size of a normal counterpart and a hypersegmented macropolycyte are shown. Hypersegmented macropolycytes may be seen in megaloblastic states, myeloproliferative disorders, granulocyte colony-stimulating factor (G-CSF) administration, and chronic infections. |
|
|
|
Figure 1.84 Megaloblastic versus dysplastic changes in marrow precursors. Composite figure from several cases comparing normal, megaloblastic and dysplastic findings in various stages of differentiation of the three major marrow cell lineages. |
|
|
|
Figure 1.85 Macrocytic anemia in MDS. Macrocytic anemia and thrombocytosis are seen in this case of isolated del(5q) chromosome abnormality. Macrocytic RBCs (arrows) are larger than the nucleus of small mature lymphocytes, as shown here. |
|
|
|
Figure 1.86 Demyelination in pernicious anemia. Top left panel: Head magnetic resonance imaging (MRI) showing a T2-weighted image with multiple high signal foci in the periventricular white matter. This is nonspecific but compatible with demyelination associated with vitamin B12 deficiency. Top right panel: T2-weighted image of the cervical spine displaying high signal in the posterior aspect of the cervical cord (arrow). This appearance is consistent with demyelination. Bottom panel: Subacute combined degeneration of spinal cord in vitamin B12 deficiency. Cross-section of autopsy spinal cord showing spongiform changes and myelin and axonal destruction in the posterior and lateral columns (arrows). This neurologic complication of vitamin B12deficiency may precede any hematologic abnormality. Elevated serum or urinary levels of methylmalonic acid and homocysteine are sensitive for the diagnosis of vitamin B12 deficiency and usually precede the development of hematologic abnormalities and reductions in the serum vitamin B12 level. (Courtesy Dr. J. Bilbao.) |
|
|
|
Figure 1.87 Vitamin C deficiency (scurvy) in a patient with megaloblastic anemia. The gums demonstrate gingival hemorrhage; corkscrew hairs with perifollicular hemorrhages are visible on a close-up view of skin in this patient suffering from vitamin C deficiency. (Courtesy Drs. J. Crookston and D. Amato.) |
|
|
|
Figure 1.88 Acanthocytes and liver disease. Top panel: Peripheral blood film demonstrating acanthocytes, alternatively called spur cells. The acanthocytes do not have central pallor and are smaller than the normocytic red blood cell. They have long thin projections, some with bulbous or pointy edges, which are unevenly distributed around the surface of the red blood cell. Note target cells as well. Bottom panel: This peripheral blood film demonstrates many acanthocytes in a patient with severe liver disease and hemolysis. This disorder is known as spur-cell hemolytic anemia. |
|
|
|
|
Figure 1.89 Obstructive jaundice and acanthocytes. Peripheral blood film of target cells in a patient with obstructive jaundice. A central area of hemoglobin is surrounded by a clear area and then encircled by an outside hemoglobinated ring, creating a target-like appearance. |
|
|
Table 1.19 Acanthocytes |
|
|
|
|
|
|
Figure 1.90 Liver disease. Patients with liver disease and obstructive jaundice have macrocytosis and target cells caused from increased cholesterol and/or phospholipids deposition on red blood cell membranes. This blood smear, from a case of alcoholic liver disease, shows prominent numbers of macrocytic targets cells. The macrocytosis associated with alcoholism may be multifactorial and include poor nutrition with a resulting folate or vitamin B12 deficiency and direct toxicity of alcohol on the marrow. |
|
|
Table 1.20 Target cells |
|
|
|
|
|
Figure 1.91 Fanconi syndrome. Upper panel: Hands in a patient with Fanconi syndrome. Bilateral thumb hypoplasia is present. Other congenital anomalies may occur: skin pigmentation changes, short stature, upper limb abnormalities, renal malformations, ophthalmologic problems, hypogonadism, and cardiac malformations. Thrombocytopenia and leukopenia precede macrocytic anemia. Eventually, aplastic anemia develops. (Courtesy Dr. I. Quirt.) Lower panel:Spontaneous chromosomal breakage in Fanconi syndrome. Chromosomal karyotyping of peripheral blood lymphocytes in a patient with Fanconi anemia. Increased spontaneous chromosomal breakage may be seen, but on exposure to mitomycin C or diepoxybutane (right panel) increased chromosomal breaks and radial chromosomal fusions occur. (Courtesy M. Chago.) |
|
Table 1.21 Rouleaux |
|
|
|
|
|
|
|
Figure 1.92 Peripheral blood film of rouleaux and background staining. Excessive amounts of acidic proteins (often immunoglobins produced by the myeloma cells) cause an increase in background bluish staining in blood smears (upper panel: Top slide is normal and bottom slide shows background staining). The abnormal proteins cause the RBCs to stick and arrange in columns (lower panel). Rouleaux have been defined as linear patterns of RBCs of at least four red blood cells. As opposed to agglutinates, the borders of the red blood cells still can be distinguished. It is important to look in the area of the slide (middle) where red blood cells nearly touch each other to identify rouleaux. Red blood cells normally have a rouleaux appearance in the thick, and sometimes thin ends of peripheral blood films. |