Douglas C. Tkachuk MD, FRCPC
Jan V. Hirschmann MD
Acute leukemias are hematologic malignancies with increased numbers of myeloid or lymphoid blasts. The term “acute,” historically referring to a rapid onset and promptly fatal outcome, now indicates the relatively undifferentiated nature of the leukemic cells. The classification of these disorders is quite complicated because they can be categorized by morphologic findings, genetic abnormalities, putative etiology, cell of origin, immunophenotypic qualities, and clinical characteristics. Two widely used classifications, one devised by a group of French, American, British (FAB) hematologists and the other by the World Health Organization (WHO), include these features in various ways, but both fundamentally divide acute leukemias into myeloid and lymphoid types, depending on the origin of the blast cell.
The overall annual incidence of these disorders in the general population is about 4 per 100,000, with approximately 70% of them being acute myeloid leukemia (AML). AML accounts for about 15% of childhood leukemias and for approximately 80% to 90% of acute leukemias in adults, with the median age at diagnosis being about 70 years. Acute lymphoblastic leukemia (ALL) is primarily a childhood disease, with the peak incidence between the ages of 2 to 3 years. It diminishes in frequency until it reaches a nadir from about the ages of 25 to 50, after which it increases to achieve a second, but minor, peak at ages older than 80.
The etiology of most cases is unknown, but a few patients have had previous exposure to ionizing radiation, cytotoxic chemotherapeutic agents, or benzene, which are considered causes. Several congenital diseases, such as Down syndrome, Bloom syndrome, and Turner syndrome, have an increased incidence of AML, as do certain types of bone marrow failure, such as Fanconi anemia and the Blackfan-Diamond syndrome. Patients with myelodysplastic and myeloproliferative disorders have varying, but elevated risks of developing AML. Heavy cigarette smoking also increases the incidence.
At the time of diagnosis, most patients with acute leukemia have nonspecific symptoms, such as fatigue, lethargy, and weight loss. Some complaints, such as dyspnea, angina, and dizziness arise from anemia. Fever from the disease itself or from an infection related to neutropenia can be the presenting manifestation. Bleeding, such as epistaxis or cutaneous ecchymoses, may occur from thrombocytopenia or from disseminated intravascular coagulation (DIC) in patients with acute promyelocytic leukemia. Bone pain and tenderness can develop from bone marrow expansion or direct periosteal involvement. Gums may swell from leukemic infiltration, especially in the monocytic types of AML.
On physical examination, lymph node enlargement and hepatosplenomegaly may be detectable, more commonly in ALL than in AML. Pallor from anemia and petechiae or ecchymoses from thrombocytopenia or DIC may be apparent. Approximately 5% to 20% of patients with AML and ALL have skin infiltration with leukemic cells (leukemia cutis) sometime during the course of their disease. In about 5% to 10% of these patients, the cutaneous lesions precede the diagnosis, in about 35% to 45% they are simultaneous, and in about 55% they appear afterwards, usually months later. They are typically erythematous or violaceous papules or nodules, but plaques, macules, palpable purpura, or ulcers also can occur. Patients with AML also may develop Sweet syndrome, characterized by an acute onset of fever and tender violaceous plaques that are often extensive, may affect the mucous membranes, and sometimes develop into blisters. Biopsies demonstrate mature neutrophils in the dermis. The fever and skin lesions disappear with systemic corticosteroid therapy, but recurrences are common with AML. Occasionally, prior to, or concurrent with, the diagnosis of AML, patients develop granulocytic sarcomas (also called chloromas), which are tumors of leukemic cells outside the bone marrow. These tumors can involve lymph nodes, skin, periosteum, extramedullary bone, and soft tissues.
They most often affect the subperiosteal bony structures of the skull, sternum, ribs, vertebrae, and pelvis.
At the time of presentation, the blood smear typically reveals decreased red cells and platelets, with the white count varying from leukopenia to very high numbers. A decrease in the number of mature neutrophils is common. Circulating blasts are usually detectable. Aleukemic leukemia, in which blasts are not apparent, is slightly more common in AML than ALL. With DIC, which occurs primarily with acute promyelocytic leukemia, microangiopathic features may be present, including red cell fragments, marked polychromatophilia, microcytes, and profound thrombocytopenia. In patients with preceding myelodysplastic syndromes, features of those disorders are typically apparent, such as hypolobulated and hypogranular neutrophils, giant and agranular platelets, and erythrocytic macrocytosis and poikilocytosis.
All patients with suspected leukemia should undergo bone marrow aspirate and biopsy, with cytogenetic analysis, histochemical analysis, and immunophenotyping done on the cells to delineate the proper classification of the leukemia. Usually, the presence of leukemia is obvious on bone marrow examination, which is typically hypercellular, with sheets of blasts replacing the normally maturing cells in the erythroid, myeloid, and megakaryocytic lines. The distinction between a myeloid or lymphoid origin of blasts is crucial to classifying acute leukemia. The presence in the cytoplasm of Auer rods—red, needle-like structures thought to be coalescences of primary granules—indicates a myeloblast. Otherwise, the distinction requires histochemical or phenotypic studies. The first step is to use stains specific for myeloperoxidase activity or for myeloid granules, such as Sudan black, and those that detect monocytic cells, such as α-naphthyl acetate or α-naphthyl butyrate. If fewer than 3% of blasts are positive using these stains, flow cytology is appropriate to distinguish between minimally differentiated AML and ALL, to detect megakaryoblastic leukemia, and to discriminate between B- and T-cell forms of ALL.
The criterion for the diagnosis of AML is that myeloblasts constitute at least 20% of the nucleated cells in the blood (based on counting 200 cells) or the bone marrow (counting 500 cells). The abnormal promyelocytes in acute promyelocytic leukemia and the promonocytes in AML with monocytic differentiation are considered blast equivalents.
Acute Myeloid Leukemias
These disorders are defined as clonal expansions of myeloid blasts, most commonly in the blood or bone marrow, but occasionally as tumor masses (myeloid or granulocytic sarcomas) in other tissues, such as skin and lymph nodes. The WHO classification (Table 2.1) separates AML into four general groups: (1) AML with recurrent genetic abnormalities; (2) AML with multilineage dysplasia; (3) AML and myelodysplastic syndromes, therapy-related; and (4) AML not otherwise categorized. A preceding classification developed by a collaboration among FAB hematologists (Table 2.2) divides AML into eight major subtypes, M0 through M7, defined by the nature of the blast cells and the degree of differentiation and maturation. In the WHO classification, the fourth group—AML not otherwise categorized—is a revision of the FAB types. The FAB classification recognizes three types of myeloid blasts: Type I lack cytoplasmic granules, but possess prominent nucleoli, a central nucleus, and uncondensed chromatin; type II are similar but have a few primary, azurophilic (reddish-purple) cytoplasmic granules; type III have >10 azurophilic cytoplasmic granules, but do not display a Golgi zone (perinuclear clear area), which is characteristic of promyelocytes.
AML with Recurrent Genetic Abnormalities
These disorders have genetic abnormalities, most commonly breaks in chromosomes in which the fragments join other chromosomes (translocations). These rearrangements create fusion genes that regulate the production of abnormal proteins.
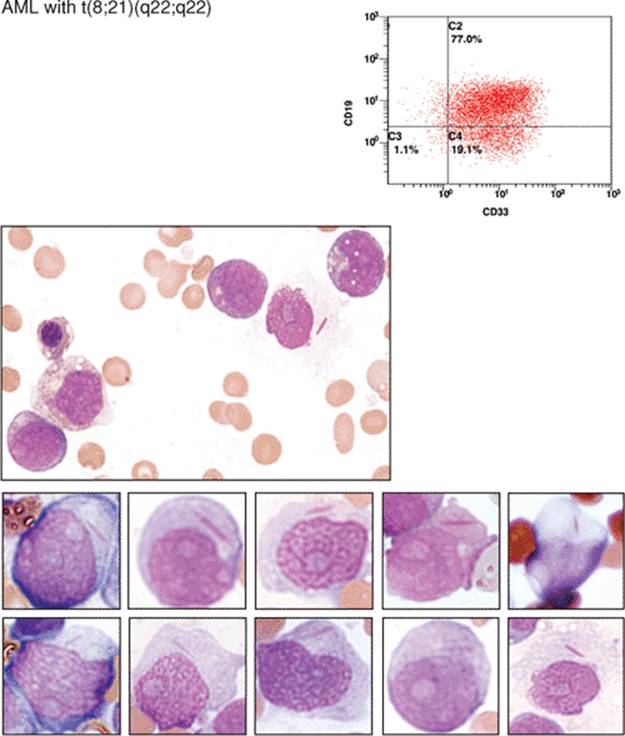
AML with t(8;21)(q22;q22) constitutes about 5% to 10% of AML cases, predominantly in younger patients. Sometimes, granulocytic sarcoma is the presenting manifestation of the disease. The blasts are typically large, with abundant basophilic cytoplasm, often with Auer rods and numerous, sometimes very large, azurophilic granules. Dysplasia in the form of abnormal nuclear segmentation and cytoplasmic staining may be present in promyelocytes, myelocytes, and mature neutrophils.
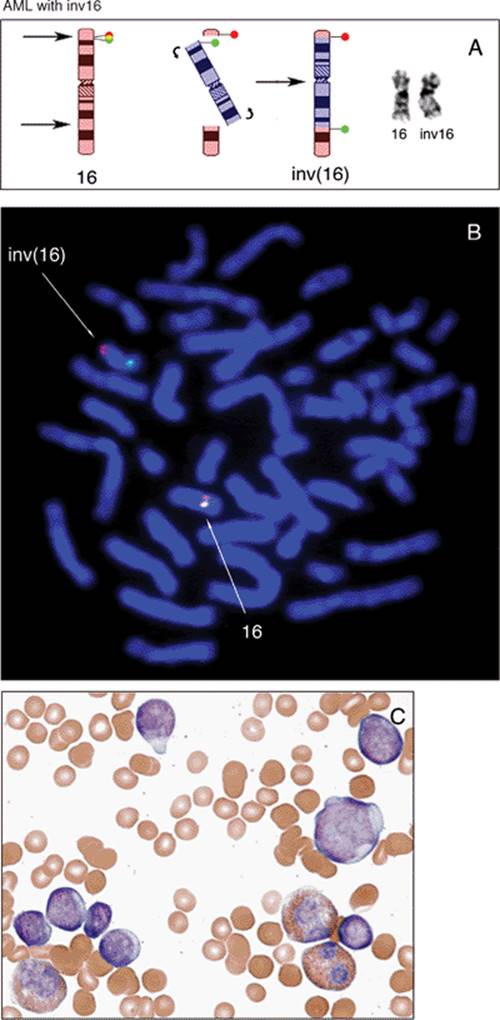
AML with inv(16)(p13q22) or t(16;16)(p13;q22) is found in about 10% of cases of AML, primarily in younger patients. The bone marrow usually has elements of both granulocytic (including myeloblasts) and monocytic differentiation (including monoblasts, promonocytes, and monocytes), combined with abnormal eosinophils (acute myelomonocytic leukemia with abnormal eosinophils: M4eo in the FAB classification). Eosinophil precursors contain abnormally large, purple granules that can be sufficiently numerous to obscure the nuclei.
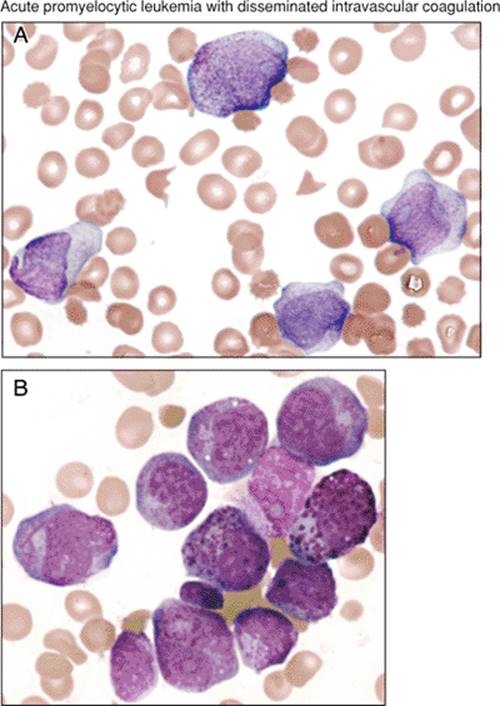
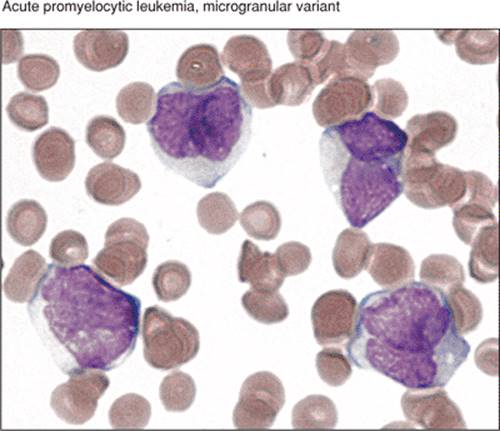
AML with t(15;17)(q22;q12) or acute promyelocytic leukemia constitutes about 5% of AML. Abnormal promyelocytes are present, either hypergranular or hypogranular (microgranular). These are equivalent to M3 and M3v in the FAB classification. DIC may occur in either form. In the hypergranular form, the cytoplasm is packed with pink, red, or purple granules that are usually large, but may be fine. Bundles of Auer rods are present in most cases. The nuclei, which may be bilobed, are irregular in size and variable in shape, and may be reniform (kidney-shaped).
AML with 11q23 abnormalities, which constitutes about 5% of AML, occurs at any age, but is more common in children. Some cases develop after treatment with topoisomerase II inhibitors. Monocytic differentiation, with monoblasts and promonocytes predominating, is the most common morphologic pattern. Patients may have gum infiltration, leukemia cutis, and DIC. Monoblasts are large cells with round nuclei that usually contain lacy chromatin and large prominent nucleoli. The abundant basophilic and sometimes vacuolated cytoplasm may form pseudopods and contain scattered, fine azurophilic granules.
AML with Multilineage Dysplasia
This type of AML, which occurs primarily in older adults, has dysplasia in at least 50% of cells in two or more cell lines, including megakaryocytes. Abnormalities in granulopoiesis include hypogranular cytoplasm and hypolobulated or bizarrely segmented nuclei. Abnormal erythropoiesis is characterized by ringed sideroblasts, vacuolated cytoplasm, and nuclei that are multiple, fragmented, or megaloblastic. Abnormal megakaryocytes are small or have single-lobed or multiple, discrete nuclei.
AML and Myelodysplastic Syndromes, Therapy-Related
These occur as a consequence of cytotoxic drugs, radiation therapy, or both. One type follows alkylating agents or radiation therapy, most commonly about 5 years later. Myelodysplasia (MDS) usually occurs first, with evidence of bone marrow failure, to which many succumb without developing AML. About two-thirds have MDS with multilineage dysplasia, and about 25% have refractory anemia with excess blasts. Whether during the MDS phase or when it develops into an AML, these patients usually have dysplasia in all cell lines. Increased marrow basophils are present in about 25% of cases. When AML occurs, the type can be AML with maturation (M2 in the FAB classification) or, less commonly, acute myelomonocytic leukemia (M4), acute monocytic leukemia (M5), erythroleukemia (M6), or acute megakaryocytic leukemia (M7).
A second type occurs after therapy with topoisomerase II inhibitors, such as etoposide and doxorubicin. The average interval between treatment and AML is about 33 months, usually without an intervening MDS phase. Most cases are acute myelomonocytic (M4) or monoblastic (M5) leukemias.
AML Not Otherwise Categorized
This category is a revision of the older FAB classification, with some deletions and additions. The classification depends on the morphologic and cytochemical characteristics of the blasts and their degree of differentiation and maturation.
AML, minimally differentiated (M0 in the FAB classification) constitutes about 5% of AML and occurs mainly in adults. By morphology and light microscopic cytochemistry, the blasts show no myeloid differentiation. They are medium-sized, have an agranular basophilic cytoplasm, round or slightly indented nuclei with one or two nucleoli, and dispersed chromatin. On cytochemical studies fewer than 3% of the blasts react to Sudan black, α-naphthyl acetate, or stains that detect myeloperoxidase.
AML, without maturation (M1 in the FAB classification) is responsible for about 10% of cases of AML, usually in adults. Azurophilic granules and Auer rods in the cytoplasm of the blasts may suggest their myeloid nature; in other cases the blasts resemble lymphoblasts, from which they are differentiated by positivity to myeloperoxidase stains or Sudan black in at least 3% of blast cells.
AML with maturation (M2 in the FAB classification) constitutes about 30% to 45% of cases of AML and may occur in all ages. Blasts may show azurophilic granules and Auer rods, and evidence of maturation is present, with >10% of the marrow cells being promyelocytes, myelocytes, and mature neutrophils and <20% being monocytes. The neutrophils may show abnormally increased or decreased segmentation and lobulation. Basophils, eosinophils, and mast cells may be increased.
Acute myelomonocytic leukemia (M4 in the FAB classification) accounts for about 15% to 25% of AML, usually in the elderly and sometimes in patients who have had preceding chronic myelomonocytic leukemia. Both neutrophilic and monocytic cells and their precursors are present, each constituting at least 20% of the marrow cells. Circulating monocytes may be numerous (≥5×10⁹/l). Monoblasts are large cells with round nuclei containing one or more prominent nucleoli and abundant basophilic cytoplasm, sometimes with fine azurophilic granules, vacuoles, and pseudopod formation. Promonocytes have a less basophilic and more granulated cytoplasm, containing occasional vacuoles and azurophilic granules. The nuclei are irregular and indented.
Acute monoblastic and acute monocytic leukemia (M5a, M5b in the FAB classification) each account for about 5% of AML, the former more common in children, the latter in adults. In both, at least 80% of the leukemic cells are in the monocytic line. In acute monoblastic leukemia, at least 80% of the monocytic cells are monoblasts; in acute monocytic leukemia, most of them are promonocytes. The monoblasts and promonocytes have the characteristics described in the previous paragraph.
Acute erythroid leukemias (M6a, M6b in the FAB classification) include two subtypes, erythroleukemia (erythroid/myeloid) and pure erythroid leukemia. The former constitutes about 5% of AML; the latter is very rare. In erythroleukemia at least 50% of the nucleated cells in the bone marrow are erythroid and at least 20% of the nonerythroid cells are myeloblasts. The erythroid cells are dysplastic, containing multiple and megaloblastoid nuclei, the cytoplasm often possessing poorly delineated, coalescing vacuoles. The myeloblasts are similar to those in AML with and without maturation. Some cases of erythroleukemia evolve from a myelodysplastic syndrome. In pure erythroid leukemia, >80% of the marrow cells are erythroid. The erythroblasts have deeply basophilic, often agranular, cytoplasm that may contain poorly delineated vacuoles. The round nuclei have fine chromatin and one or more nucleoli.
Acute megakaryoblastic leukemia (M7 in the FAB classification), which affects all ages, accounts for about 5% of AML. At least 50% of the blasts are from the megakaryocyte lineage. The megakaryoblasts are often pleomorphic and have a basophilic, often agranular, cytoplasm that may demonstrate pseudopod and bleb formation, indicating budding platelets. The nuclei have fine chromatin and one to three nucleoli. Dysplastic platelets may be visible in the blood, as may be circulating micromegakaryocytes and megakaryocyte fragments.
Acute Leukemias of Ambiguous Lineage
In less than 4% of cases of leukemia, tests currently available: (1) cannot determine whether the blasts have a myeloid or lymphoid origin (acute undifferentiated leukemia); (2) indicate two populations of cells, each having a distinct lineage from myeloid or T or B lymphocytes (acute bilineal leukemia); or (3) indicate that the blasts individually have markers of two or three lines of myeloid, T lymphocytes, and B lymphocytes (acute biphenotypic leukemia). In acute undifferentiated leukemia, the blasts lack any distinguishing characteristics, whereas in the bilineal and biphenotypic forms, the leukemic cells may resemble lymphoblasts, myeloblasts, or monoblasts.
Acute Lymphoblastic Leukemias
The WHO classification divides these leukemias into two forms, depending on whether the precursor cell is a T or B lymphocyte. The distinction between leukemia and lymphoma in these cases depends on whether the disease presents with abnormal cells in the blood and bone marrow or whether they appear primarily in lymph nodes or extranodal sites outside the bone marrow. Arbitrarily, if the patient has a mass lesion and fewer than 25% lymphoblasts in the bone marrow, the designation is lymphoma.
Precursor B-cell Acute Lymphoblastic Leukemia
About 75% of cases of this disease occur in children below the age of six. About 85% of ALL are this type. Enlarged lymph nodes, liver, and spleen are common. The leukocyte count is variable. Lymphoblasts are pleomorphic and vary from small to large, with nuclei having prominent or inconspicuous nucleoli, compact or dispersed chromatin. The blue or blue-gray cytoplasm is usually scant, but may be abundant. Coarse azurophilic granules may be present.
Precursor T-cell Acute Lymphoblastic Leukemia
This disorder accounts for about 15% of childhood ALL and about 25% of adult ALL. The leukocyte count is often markedly elevated, and a mediastinal mass is often present. The lymphoblasts are similar to those in precursor B-cell ALL, with a wide variation in morphology.
|
Table 2.1 WHO Classification of acute myeloid leukemia |
||||||||||||||||||||||
|
||||||||||||||||||||||
|
Table 2.2 FAB classification of acute myeloid leukemia |
||||||||||||||||||||||
|
|
|
|
Diagram 2.1 Reprinted with permission from Wintrobe's Clinical Hematology, 11th Edition, page 2064. |
|
Table 2.3 Cytogenetic risk groups in adult AML |
||||||||||
|
||||||||||
|
|
||||||||||
|
Diagram 2.2 Reprinted with permission from Wintrobe's Clinical Hematology, 11th Edition, page 2115. |
||||||||||
|
|
|
Diagram 2.3 |
|
Table 2.4 Acute promyelocytic leukemia: chromosomal translocations and fusion products |
||||||||||||||||||||||||||||||||||||||||||
|
||||||||||||||||||||||||||||||||||||||||||
|
|
||||||||||||||||||||||||||||||||||||||||||
|
Diagram 2.4 |
||||||||||||||||||||||||||||||||||||||||||
Clinical Findings
|
|
|
Figure 2.1 Clinical presentation of acute leukemia. Bone marrow replacement by leukemic blasts in acute leukemia can lead to decreased production of red blood cells (RBCs), platelets, and leukocytes resulting in anemia, thrombocytopenia, and leukopenia. The top two panels show conjunctiva and skin pallor in patients with severe anemia (Courtesy Dr. I. Quirt). The patient in the bottom panel presented with submandibular adenopathy from acute myelomonocytic leukemia. |
|
|
|
Figures 2.2 through 2.4 Sweet syndrome (acute febrile neutrophilic dermatosis) and AML. Sweet syndrome is most often idiopathic, but 10% to 20% of cases are associated with various malignancies, including AML, myelodysplastic syndrome, lymphoproliferative disorders, and multiple myeloma. The lesions are usually tender, swollen red papules or plaques that are most commonly distributed on the face, neck, and extremities. Compared with patients having idiopathic Sweet syndrome, those with malignancy more frequently have bullous and mucosal membrane lesions (Fig. 2.4). In addition to the skin findings, patients with Sweet syndrome usually also have fever and high erythrocyte sedimentation rates. (Courtesy of The Crookston Collection.) |
|
|
|
Figure 2.3 |
|
|
|
Figure 2.4 |
|
|
|
Figure 2.5 Conditions preceding AML. Top panel: Pyoderma gangrenosum. Approximately 10% of cases of pyoderma gangrenosum are associated with hematologic disorders, most commonly with AML, but also myeloproliferative syndromes and multiple myeloma. Pyoderma gangrenosum can precede the diagnosis of leukemia or be part of the initial presentation. The lesions are painful, coalescing papules or pustules that can evolve to large ulcers (Courtesy Dr. I. Quirt). Bottom panel: Clubbing of fingers can herald the onset of various malignancies including AML. |
|
|
|
Figures 2.6 through 2.8 Leukemia cutis. Leukemia cutis most commonly occurs in monocytic forms of AML and represents skin infiltration by leukemic blast cells. It can also develop in any acute or chronic leukemia, including the leukemic phase of lymphomas and hairy cell leukemia. As shown in these figures from different cases of AML and leukemia cutis, this condition is highly variable in appearance and can include widespread papules, nodules, macules, palpable purpura, plaques, or ulcers. Pain, tenderness, and pruritus are uncommon. (Courtesy of The Crookston Collection.) |
|
|
|
Figure 2.7 |
|
|
|
Figure 2.8 |
|
|
|
Figure 2.9 Extramedullary involvement by AML in the gums. Gingival hyperplasia, seen in these three cases of untreated AML at presentation, is most common in acute monocytic leukemias and usually resolves with effective leukemia chemotherapy. (Courtesy Drs. Galbraith and Quirt.) |
|
|
|
Figures 2.10 through 2.12 AML and thrombocytopenia. Purpura can be classified as petechiae, ecchymoses, or hematomas depending on the size, shape, and depth of blood extravasation. Petechiae are superficial, pinpoint (<3 mm), red or purple, nonblanching macules that mostly occur in dependent areas (Figs. 2.10 and 2.11). Ecchymoses (bruises) are larger, flat, extravasating lesions (Fig. 2.12). Hematomas are deep pockets of blood underneath the skin. (Courtesy Dr. D. Amato.) |
|
|
|
Figure 2.11 |
|
|
|
Figure 2.12 |
|
|
|
Figure 2.13 AML and disseminated intravascular coagulation (DIC). Extensive purpura is present on the soles of a patient with acute promyelocytic leukemia and DIC. (Courtesy Dr. I. Quirt.) |
|
|
|
Figure 2.14 AML and DIC. This brain, from a case of AML complicated by DIC, demonstrates multiple tiny hemorrhages in white matter with some forming small hematomas. (Courtesy Dr. J. Bilbao.) |
|
|
|
Figure 2.15 Hyphema. Thrombocytopenia has caused bleeding into the anterior chamber (hyphema). |
|
|
|
Figure 2.16 Ocular manifestations of AML and thrombocytopenia. A. Subconjunctival hemorrhage is present in the right eye. B. A fundus photograph shows intraretinal hemorrhages in the left eye. C. A fundus image demonstrates a hyperemic disc with peripapillary intraretinal hemorrhages and pseudo-Roth spots. D. Fundus of right eye has a subhyaloid hemorrhage with fluid level. (Courtesy Dr. F. Altomare.) |
|
|
|
Figure 2.17 Pulmonary hemorrhage from AML-induced thrombocytopenia. An autopsy specimen from a case of diffuse pulmonary hemorrhage caused by thrombocytopenia secondary to AML shows a congested lung filled with blood. |
|
|
|
Figure 2.18 AML with neutropenia. Extensive fungal infection of tongue (top panel) and perirectal abscess (bottom panel) develop in cases of AML with neutropenia. (Courtesy Drs. A. Lutynski and I. Quirt.) |
|
|
|
Figure 2.19 Autopsy lung (fixed in formalin) from a case AML presenting with neutropenia and extensive lobar pneumonia from aspergillosis (top panel). The liver from a different case of AML discloses multiple abscesses from aspergillosis. (Courtesy Dr. I. Wanless.) |
|
|
|
Figure 2.20 Top panel: Leukocytosis in acute leukemia. A tube of centrifuged whole blood from a patient with leukocytosis (WBC = 310K) due to acute leukemia is shown on the right, compared with normal (WBC = 5K) on the left. The prominent buffy coat consists entirely of leukemic blasts (arrow). Bottom panel: An autopsy liver specimen shows tiny nodules (arrows) of leukemic blasts filling the hepatic vasculature in a case of AML with a high blast count. |
Blast Morphology
|
|
|
Figure 2.21 Blast morphology in AML. The upper panel shows a pleomorphic population of cells that are aligned in the middle panel according to size and chromatin patterns. The bottom panel illustrates the distinguishing features of the two blasts most commonly seen in aspirate smears, the mycloblast and erythoblast. |
|
|
|
Figure 2.22 Chromatin patterns. A. An aspirate smear in AML shows diverse chromatin patterns in different marrow-cell populations. The blasts are characterized by “open” (uncondensed or lacy or immature) chromatin with prominent nucleoli. B. This schematic diagram categorizes cells from part A. with, from left to right, “open” (lacey or immature) to increasingly “closed” (condensed or mature) patterns of chromatin. |
|
|
|
Figure 2.23 MPO staining in AML. A. AML, minimally differentiated. By definition this type of AML shows MPO staining in <3% of the total blast population. A mature granulocyte serves as positive control. B. MPO staining in AML, without maturation. Weak to moderate punctate staining is present in the cytoplasm of >3% of the blasts (a myelocyte serves as a positive control). C. MPO staining and AML with maturation. Strong cytoplasmic staining is present in blasts and abnormal maturing granulocytes. An Auer rod staining strongly with MPO is present. |
|
|
|
Figure 2.24 FAB classification of AML. Although largely replaced by the more popular WHO classification, the FAB classification is a scheme based solely on morphology and histochemical staining characteristics of leukemic blasts. |
|
|
|
Figure 2.25 Patterns of cytoplasmic granulation in various types of AML. Cytoplasmic granulation as seen in standard Wright-Giemsa staining (left column), MPO histochemistry (middle column), and side scatter by flow cytometry (right column) correlates with the degree of blast differentiation in various types of AML. AML, minimally differentiated, is shown with the typical immature, agranular, MPO-negative blasts with low side scatter compared with the more mature cells of acute promyelocytic leukemia with the classic hypergranular cytoplasm (with multiple Auer rods here), strong MPO, staining, and the characteristic “comet-shaped” diffusely spread pattern characteristic of blasts with high side scatter. |
|
|
|
Figure 2.26 Morphology of cytoplasm in various types of AML. Cytoplasmic features are shown with standard Wright-Giemsa staining (left column), histochemistry (middle column), and CD45 versus side scatter by flow cytometry (right column) in various types of AML. Demonstrated here are: acute myelomonocytic leukemia with two distinct blast populations: acute monocytic leukemia with ample esterase+ cytoplasm, acute erythroid leukemia (pure erythroleukemia type shown here) with coarse PAS+ cytoplasmic granules, CD45 weak/negative blasts, and acute megakaryocytic leukemia with CD61+blasts that are weakly CD45 positive. (Histograms courtesy J. Davidson and T. Anderson.) |
|
|
|
Figure 2.27 Morphology and histochemical staining characteristics of lymphoid, myeloid, and monocytoid leukemic blasts. MPO, myeloperoxidase; SBB, Sudan black B; PAS, periodic acid-Schiff; ANAE, alphanaphthyl acetate esterase; ANAE/NaF, ANAE with fluoride inhibition (butyrate substrates now more commonly in use); CAE, chloroacetate esterase. |
|
|
|
Figure 2.28 AML, minimally differentiated (FAB: M0). A. Flow cytometric scattergram shows blasts with low side scatter. B. Low-power magnification of aspirate smear demonstrates hypercellular marrow fragments consisting exclusively of monotonous sheets of primitive mononuclear cells. C. High-power view of aspirate smear discloses nucleolated undifferentiated blasts. D. Less than 3% of the blasts stain positively for MPO. A late myeloid precursor serves as a positive internal control (arrow). |
AML Subtypes
|
|
|
Figure 2.29 AML, without maturation (FAB: M1). A. Flow cytometry scattergram shows a discrete population of CD45+ blasts displaying weak side scatter signal consistent with low cytoplasmic granularity. B. An aspirate smear demonstrates immature myeloid precursors, some of which show the presence of numerous primary granules in the cytoplasm (so-called type III blasts). C. MPO stains of aspirate smear show a minor subpopulation of positive-staining blasts with punctate cytoplasmic staining (arrows). |
|
|
|
Figure 2.30 AML, with maturation (FAB: M2). A. Blood smear displays a spectrum of immature and mature myeloid precursors. B. MPO stains reveal strong granular cytoplasmic staining in many leukemic blasts. Two MPO positive Auer rods are present (arrow). |
|
|
|
Figures 2.31 AML with maturation with t(8;21). Aspirates showing a spectrum of differentiated myeloid precursors ranging from blasts to mature segmented bands and neutrophils are shown in A. and B. With so many mature myeloid forms, AML with maturation can be confused with maturation arrest following marrow insults such as recent chemotherapy or recovery following bone marrow transplant. |
|
|
|
Figure 2.32 AML with maturation. A. An aspirate smear shows a leukemic blast population composed mostly of granulated promyelocytes that could be confused with a case of acute promyelocytic leukemia. The latter often shows bilobed nuclei and a more homogeneous blast population compared with cases of AML with differentiation. B. Myeloperoxidase stains show strong diffuse staining that obscures nuclear morphology. C. A hypercellular clot section consists almost exclusively of large blasts with “open” chromatin pattern (vesicular nuclei), two to three small nucleoli, and indented nuclear contours. |
|
|
|
Figure 2.33 Acute myelomonocytic leukemia (AMML). A. Flow cytometric scattergram shows dual population of blasts with the monocytic blasts displaying more side scatter and stronger CD45 staining than do the myeloblasts. B. An aspirate smear demonstrates the same dimorphic blast population composed of monocytes and myeloblasts (long and short arrows, respectively). |
|
|
|
Figure 2.34 Acute myelomonocytic leukemia (AMML). A. A blood smear shows a distinctive dimorphic blast population consisting of immature nucleolated myeloblasts and mature monocytes. Fragments of cytoplasm also are present. B. An aspirate smear stained with butyrate esterase displays positive staining in only the larger-sized monocytic blast population. C. The bone marrow biopsy shows clusters of CD34+ myeloid blasts interspersed among negative-staining monocytic blasts. Note that the endothelial cells lining the vessel on the left side of the slide act as CD34 positive internal controls. D.Immunohistochemistry for monocytic marker CD68 shows positive staining in the monocytic blast subpopulation, corresponding to approximately 50% of all leukemia cells. |
|
|
|
Figure 2.35 Acute myelomonocytic leukemia (AMML). A. A blood smear shows a dual population of small and large blasts; myeloblasts and monoblasts, respectively. On the left side are three mature monocytic blasts characterized by large size, low nuclear-to-cytoplasmic (N:C) ratios with somewhat condensed chromatin, absent nucleoli, irregularly folded nuclear contours, and vacuolated, finely granular, neutral-staining cytoplasm. The right upper corner of the slide contains three myeloblasts characterized by medium-size, higher N:C ratios, open chromatin, and scant cytoplasm. A small mature lymphocyte with closed chromatin is present in the right lower corner. B. Myeloperoxidase stains demonstrate strong granular cytoplasmic staining in a subpopulation of blasts. C. Butyrate esterase stains display strong positive staining in one blast. A neutrophil near the left upper corner serves as a built-in negative control. |
|
|
|
Figure 2.36 AMML with inv16 A. An aspirate with a dual population of small and large blasts with prominent eosinophilia. B. Some of the cells include the “eosinobasophils,” which typically are associated with inv16. C. Biopsy shows hypercellular marrow with monocytic blasts and eosinophilia. Note the large monocytic blasts with folded nuclear contours. |
|
|
|
Figure 2.37 Acute monoblastic/monocytic leukemia. A. A flow cytometric scattergram illustrates the moderate CD45 expression and intermediate side scatter properties typical for monocytic blasts. B. An aspirate features promonocytes characterized by large size with low nuclear-to-cytoplasmic (N:C) ratios, nuclei with moderately open chromatin, folded nuclear contours (some kidney bean-shaped), absent nucleoli, and agranular, slightly basophilic-staining cytoplasm. For comparison, an arrow demonstrates a small mature lymphocyte with higher N:C ratio and closed chromatin. (Courtesy T. Anderson.) |
|
|
|
Figure 2.38 Acute monoblastic leukemia (esterase negative). A. This peripheral smear shows leukocytosis consisting of large undifferentiated blasts with low to moderate N:C ratios and basophilic staining cytoplasm. B. An aspirate smear shows clusters of these immature cells. By flow cytometric evaluation, these blasts displayed CD45 versus side scatter properties characteristic of monocytes and were CD11C+/CD4+. C. Butyrate esterase stains are negative in this particular case of acute monoblastic leukemia. A benign histiocyte located near the bottom of the slide serves as internal positive control. |
|
|
|
Figure 2.39 Acute monoblastic leukemia. A. An aspirate smear from acute monoblastic leukemia displays cytoplasmic granularity that is focally localized to the Golgi area (arrows). B. Butyrate esterase stains show localized positivity restricted to the perinuclear granules, confirming the monocytic origin for this case of acute monoblastic leukemia with heavily granulated blasts. |
|
|
|
Figure 2.40 Acute monoblastic leukemia with marrow fibrosis. A. and B. Bone marrow biopsy at low- and high-power, respectively: A. shows increased cellularity and architectural distortion such as swirling and lining up of individual marrow cells, (so-called Indian filing), suggesting the presence of significant bone marrow fibrosis, whereas B. demonstrates large, monotonous-appearing, wide-spaced, immature hematopoietic cells that replace the entire marrow cavity. C and D. In this case, CD68 stains only the benign reactive histiocytes interspersed among the negative-staining leukemic monoblasts. E and F. Immunohistochemistry for lysozyme stains with equal intensity in both the benign histiocytes and leukemic monoblasts. |
|
|
|
Figure 2.41 Acute monocytic leukemia. A. A high magnification view of a blood smear shows four large mature monocytes that have low N:C ratios, lobulated nuclei with moderately closed chromatin pattern and neutral staining, and finely granular, vacuolated cytoplasm. B. This aspirate smear shows clusters of monocytic blasts that have a more immature appearance than do the circulating blasts. |
|
|
|
Figure 2.42 A. Acute monoblastic leukemia. Nucleolated monoblasts are present in this peripheral blood smear. B. An aspirate smear shows monotonous sheets of monoblasts displaying open chromatin with multiple prominent nucleoli and vacuolated, basophilic-staining cytoplasm. These are somewhat reminiscent of the L3 blasts seen in Burkitt lymphoma. C. Strong, diffuse, cytoplasmic staining by butyrate esterase confirms the monocytic origin of these leukemic blasts. An erythroid cluster on the left side of the slide serves as a negative control. |
|
|
|
Figure 2.43 Blast morphology in acute monocytic leukemia. This mosaic, from 16 different cases of acute monoblastic and monocytic leukemias, illustrates the wide variation in blast morphology seen in this type of AML. Undifferentiated monoblasts with high N:C ratios, open chromatin, nucleoli, and basophilic staining cytoplasm are present in the upper panels, promonocytes in the middle panels and differentiated monocytic blasts with closed chromatin pattern and lobulated nuclei are shown in the lower panels. |
|
|
|
Figure 2.44 Acute monoblastic leukemia. A. Monoblasts surround a large, benign histiocyte with long tentacles of cytoplasmic projections packed with dark-staining pigment (likely iron) in this case of acute monoblastic leukemia. B. In this slide from the same case, the two lower cells are monocytic leukemic blasts and the larger cell in the upper area is a benign histiocyte. Histiocytes, usually “innocent” benign bystanders in marrow diseases, are characterized by oval-shaped nuclei, smooth nuclear contours, “bland” chromatin patterns and ample neutral-staining cytoplasm. Often, histiocytes are stuffed with iron pigment and/or digested cellular debris. C. Positive butyrate esterase staining is seen in: (1) the numerous leukemic monoblasts (on the right) and (2) a benign histiocyte (long arrow). An erythroid precursor serves as a negative control (short arrow). |
|
|
|
Figure 2.45 A. Acute monoblastic leukemia, esterase negative. A peripheral blood smear displays two circulating promonocytes and a small mature lymphocyte. The two promonocytes are characterized by large size, low N:C ratios, distinctly lobulated nuclear contours and ample “agranular” neutral-staining cytoplasm. B. A higher-power view of an aspirate smear shows monoblasts with bilobed nuclei reminiscent of the microgranular variant of acute promyelocytic leukemia. (Note the dissimilarity between the cytoplasmic granularity of the blasts in peripheral blood compared with the aspirate smear). C. Butyrate esterase histochemistry demonstrates negative staining in the promonocytes (a benign histiocyte serves as positive control). |
|
|
|
Figure 2.46 Acute monocytic leukemia. A. and B. Blood smears show peripheral monocytosis consisting of mature monocytes that have a closed chromatin pattern, lobulated nuclei, and abundant granular, vacuolated cytoplasm. C. A bone marrow biopsy demonstrates hypercellular marrow consisting almost exclusively of monocytoid precursors. |
|
|
|
Figure 2.47 Chloroma. A. Low magnification of a chloroma (granulocytic sarcoma) arising in the chest wall of a patient suffering from acute monocytic leukemia. B. The malignant behavior of this lesion is shown by the invasive growth pattern consisting of finger-like projections of tumor reaching deep into the subcutaneous fat. C. Immunohistochemistry for CD45 shows negative staining in this tumor derived from leukemic monocytes. Two lymphocytes displaying strong CD45 staining are present on the left side of the slide and serve as positive controls. D. Anti-CD68 shows strong cytoplasmic staining in the monocytic leukemia cells. |
|
|
|
Figure 2.48 Acute erythroid leukemia, pure erythroid type. A. The aspirate smear consists entirely of a heterogeneous mixture of dysplastic erythroid blasts, many displaying cytoplasmic vacuolation. B. PAS stains show the characteristic coarse granular staining in immature leukemic erythroid precursors, compared with a negative staining mature erythroid precursor shown in the left upper corner. |
|
|
|
Figure 2.49 Acute erythroid leukemia, erythroid/myeloid type. A. An aspirate smear shows a mixture of dysplastic erythroid precursors and immature myeloid cells, including numerous blasts. B. In this panel, all the nonerythroid cells from the field above in A. are removed, clearly demonstrating a non-erythroid blast count exceeding 20% (blasts shown by arrows). |
|
|
|
Figure 2.50 Acute erythroid leukemia, erythroid/myeloid type. A. An aspirate smear shows erythroid hyperplasia, increased numbers of blasts, and hemophagocytosis. In the center of the figure, a benign-appearing histiocyte engulfs cellular debris. Hemophagocytosis can occur in both benign and malignant bone marrow disorders, including acute erythroid leukemia. B. This figure excludes all the nonerythroid cells from the figure above in A. and clearly shows a non-erythroid blast count exceeding 20%. |
|
|
|
Figure 2.51 Acute erythroid leukemia, pure erythroid type. A. This blood smear shows a leukoerythroblastic picture with marked poikilocytosis. B. An aspirate smear reveals only scattered megaloblastic erythroid precursors. C. Biopsy at medium magnification shows a hypercellular marrow composed exclusively of a heterogeneous mononuclear cell population. D. Biopsy at high magnification shows replacement of the bone marrow cavity by a mixed erythroid population. E. Immunohistochemistry for the erythroid lineage marker glycophorin C demonstrates positive staining in the leukemic cells, and negative staining megakaryocytes serve as controls. |
|
|
|
Figure 2.52 A and B. Acute erythroid leukemia versus dysplastic erythroid hyperplasia. Aspirate smears show increased numbers of erythroid blasts associated with dysplastic mature erythroid forms displaying irregular (“cookie cutter”) nuclear contours. Teardrop RBCs related to the bone marrow fibrosis also are visible. C. A biopsy shows atypical erythroid hyperplasia with nests consisting exclusively of monotonous immature erythroid forms. D. A periodic acid-Schiff (PAS)–stained aspirate shows the typical coarse granular pattern of staining in immature erythroid precursors (long arrows) compared with the diffuse staining seen in the more mature forms (short arrows). |
|
|
|
Figure 2.53 Acute erythroid leukemia (pure erythroid type). A. An aspirate smear shows erythroid hyperplasia and numerous dysplastic erythroid blasts with vacuolated cytoplasm. B. The biopsy demonstrates increased numbers of erythroid precursors, which, especially in biopsies, can be confused morphologically with plasma cells (a plasma cell is shown by an arrow). C. PAS stains of aspirate smear demonstrate granular and diffuse staining in immature and mature erythroid precursors, respectively. |
|
|
|
Figure 2.54 Acute megakaryoblastic leukemia. A. An aspirate shows a blast that is positive for the megakaryocytic marker CD61 (on the left) with a negative staining lymphocyte (on the right). B–D. A biopsy shows fibrotic, hypercellular marrow composed entirely of atypical megakaryocytes. In C, CD61 is only positive in the larger, more differentiated blasts. Fibrosis often precludes flow cytometry, and often the diagnosis of this disease rests solely on immunohistochemically stained biopsies. |
|
|
|
Figure 2.55 Acute megakaryoblastic leukemia. A. An aspirate smear shows four blasts with multiple, broad-based cytoplasmic projections reminiscent of platelet production by megakaryocytes. B. Cohesive clustering of malignant cells appears in this aspirate smear. C–E. Bone marrow biopsies show marrow replaced by immature hematopoietic cells, some displaying megakaryocytic features. |
|
|
|
Figure 2.56 Acute megakaryoblastic leukemia. A. An aspirate smear shows blasts with cytoplasmic blebbing reminiscent of platelet production by megakaryocytes. B. A bone marrow biopsy demonstrates increased blasts, some of which display megakaryocytic differentiation. C. Reticulin stains of a biopsy at low magnification display a diffuse increase in the number of fibers throughout the bone marrow space. D. Higher magnification of the bone marrow biopsy stained for reticulin shows thickened fibers that encircle individual bone marrow cells. |
|
|
|
Figure 2.57 AML with t(8;21). A. Aberrant expression of the B-cell marker CD19 by myeloid blasts is commonly seen in AML with t(8;21) (detailed immunophenotype discussed in Fig. 6.7). B. An aspirate shows granulated blasts mixed with abnormal mature myeloid forms. A long slender, tapered Auer rod is present in the cytoplasm of a partially degenerated blast in the upper right area of the slide. C. Auer rod morphology is shown here from several cases of AML with t(8;21). The blasts in this type of AML often appear more differentiated and may contain long, tapering Auer rods. |
|
|
|
Figure 2.58 Upper panel: The t(8;21) (q22;q22) rearrangement. The ideograms of chromosomes 8, 21 and the respective derivative chromosomes are depicted below in color, and the corresponding G-banded chromosome pairs are shown above. The arrows indicate the breakpoints on the respective chromosomes. The green, red, and yellow colors indicate expected FISH signals using the LSI AML1 and LSI ETO probe as shown in lower panel. Lower panel: FISH of the AML1/ETO fusion gene. The AML1 gene at 8q22 (green) and the ETO gene at 21q22 (red) co-localize to generate yellow fusion signals (arrows), indicating a reciprocal translocation involving these loci. |
|
|
|
Figure 2.59 Minimal residual disease assessment in AML with t(8;21). Quantitative PCR for AML-ETO mRNA is shown here for a period of 3 years following diagnosis. (Courtesy Dr. S. Kamel-Reid.) |
|
|
|
Figure 2.60 AML with t(8;21) and pseudo–Chediak-Higashi inclusions. A. An aspirate shows numerous granulated blasts and differentiated myeloid precursors. Many of the blasts contain unusual “blob-like” Auer rods or so-called pseudo–Chediak-Higashi inclusions (arrows). B. The t(8;21) leukemia cells include two blasts, each containing long thin Auer rods and, in the lower right corner, a myelocyte. C. Three blasts are shown here, one with a blob-like Auer rod. D. Myeloperoxidase stains show heavy block-like staining of the blob-like Auer rods (arrows) in this unusual case of AML with t(8;21). Pseudo–Chediak-Higashi inclusions also occur in other AML subtypes. |
|
|
|
Figure 2.61 Acute promyelocytic leukemia. A. CD45 versus side scatter plot shows the classic comet-shaped pattern from granulated blasts. B. A blood smear displays pancytopenia, low platelets, and a rare abnormal bilobed promyelocyte. A single Auer rod appears in the two o'clock position of this APL cell. C. An aspirate shows numerous abnormal promyelocytes, many containing fused primary granules in the form of either classical Auer rods (long arrow) or other bizarre forms (short arrow). D and E. Fluorescent in situ hybridization (FISH) of the PML/RARA fusion gene. The PML gene at 15q22 (red) and RARA gene at 17q12~21 (green) co-localize to generate yellow signals, indicating a reciprocal translocation involving these loci. F. A biopsy demonstrates replacement of the marrow by uniformly spaced, large, immature cells with folded nuclei and ample cytoplasm. |
|
|
|
Figure 2.62 Minimal residual disease assessment in AML with t(15;17). Quantitative PCR for PML-RAR-α and mRNA is shown here for a period of 15 months following diagnosis. (Courtesy Dr. S. Kamel-Reid.) |
|
|
|
Figure 2.63 Minimal residual disease and response to treatment and in AML with t(15;17). Quantitative PCR for PML-RAR-α mRNA is shown here for a period of 21 months following diagnosis and shows cycles of treatment response and relapse that often occur in this disease. (Courtesy Dr. S. Kamel-Reid.) |
|
|
|
Figure 2.64 Acute promyelocytic leukemia, microgranular variant. A. A peripheral smear shows leukocytosis and severe thrombocytopenia with increased numbers of early myeloid cells displaying the characteristic bilobed nuclei of microgranular APL cells. B. Closer inspection of the APL cells demonstrates the characteristic bilobed or “pinched” nuclei and very fine, dust-like cytoplasmic granules. C. High-power view of a bone marrow biopsy reveals a hypercellular bone marrow with uniformly spaced, large immature hematopoietic cells with abundant eosinophilic-staining cytoplasm and bilobed (buttock-like) nuclei. |
|
|
|
Figure 2.65 Acute promyelocytic leukemia with disseminated intravascular coagulation. A. A peripheral blood smear from a case of APL shows a leukocytosis with thrombocytopenia and schistocytes. B. Aspirate smears demonstrate increased numbers of abnormal promyelocytes with bizarre cytoplasmic granulation including typical Auer rods (shown on the left), large coarse granules (shown in the right central area), and fine, dust-like eosinophilic granules. |
|
|
|
Figure 2.66 Auer-rod morphology in acute promyelocytic leukemia. This picture shows variations on the appearance of “faggot cells” in several different cases of APL. |
|
|
|
Figure 2.67 Acute promyelocytic leukemia, microgranular variant. A. A peripheral blood smear from a case of microgranular variant APL demonstrates leukocytosis and thrombocytopenia. The characteristic abnormal bilobed promyelocytes are present. B. Close examination of the abnormal promyelocytes in this case reveals fine, dust-like eosinophilic granules within the cytoplasm. Auer rods are difficult to find in many of these cases. C. A bone marrow biopsy shows replacement of bone marrow by monotonous sheets of uniformly spaced bilobed immature hematopoietic precursors. |
|
|
|
Figure 2.68 Acute promyelocytic leukemia, microgranular variant. A peripheral blood smear from a case of the microgranular variant of APL discloses leukocytosis and thrombocytopenia with increased numbers of abnormal seemingly agranular, bilobed promyelocytes. |
|
|
|
Figure 2.69 Acute promyelocytic leukemia with bone marrow fibrosis. A. This hypocellular aspirate smear demonstrates rare, abnormal, heavily granulated promyelocytes. B. A bone marrow biopsy shows architectural distortion suggesting significant marrow fibrosis and replacement by a monotonous immature hematopoietic cell population. Higher magnification of the biopsy (inset in right lower corner) discloses monotonous foci composed of uniformly spaced immature, bilobed hematopoietic precursors. C. A bone marrow biopsy reveals infiltration of bone marrow space by MPO-positive immature hematopoietic cells. Higher-power view of the bone marrow biopsy (inset in right lower corner) shows strong granular staining of APL cells with anti-MPO immunostaining. |
|
|
|
Figure 2.70 Acute promyelocytic leukemia, microgranular variant. A. This blood smear shows increased numbers of abnormal bilobed promyelocytes with hypogranular cytoplasm and thrombocytopenia. These large immature hematopoietic cells with folded nuclear contours can be confused with monocytic blasts. B. A bone marrow biopsy demonstrates a monotonous proliferation of uniformly spaced large cells with characteristic bilobed (buttock-like) nuclei and ample cytoplasm. |
|
|
|
Figure 2.71 APL versus maturation arrest. A. An aspirate smear reveals scattered numbers of heavily granulated promyelocytes in a patient recovering from induction chemotherapy. This case of maturation arrest, without clinical-pathological correlation, could easily be mistaken for a case of APL. As demonstrated in this slide, cases of maturation arrest usually show moderate numbers of promyelocytes that are often, but not always, mixed with a spectrum of left-shifted myeloid forms. B–F. A collection of bone marrow biopsies from cases of maturation arrest (B and C) and APL (D, E, F, and G). Pleomorphism and lower marrow cellularity often are present in maturation arrest, whereas APL cases usually have more monotonous-appearing promyelocytes that may contain Auer rods and often, but not always, show the classical bilobed nuclei. |
|
|
|
Figure 2.72 The inv(16)(p13.1q22) rearrangement. A. The ideograms of the normal and inverted chromosome 16s are to the left in color and the corresponding G-banded pair is to the right. The arrows on the normal chromosome 16 ideograms indicate the breakpoints on the short and long arms of chromosome 16. B. Metaphase FISH using a dual color CBFB (16q22) probe set. The CBFB gene is labeled with a red fluorochrome at the 5′ end and with a green fluorochrome at the 3′ end. When an inv(16)(p13.1q22) is present, the red and green signals split apart such that the red signal is now on the other arm. A yellow signal indicates the normal chromosome 16. C. Acute myelomonocytic leukemia with eosinophilia and inv16. An aspirate smear reveals a dimorphic blast population made up of large monocytoid and small myeloblast cells with eosinophilia. |
|
|
|
Figure 2.73 AML with inv16. A. This aspirate smear shows granular monocytoid blasts with dysplastic eosinophilic, basophilic precursors. B. A bone marrow biopsy displays a hypercellular marrow composed of sheets of uniformly spaced monocytoid blasts with eosinophilia. C. Higher-power view of the biopsy reveals uniformly spaced monocytoid blasts with characteristic folded nuclear contours associated with eosinophilia. |
|
|
|
Figure 2.74 A–C. AML with inv16. Aspirate smears from three cases of AML with inv16 showing monocytic blasts mixed with dysplastic eosinophilic/basophilic precursors (“eosinobasophils”). The latter show the characteristic dual-staining cytoplasmic granules commonly seen in AML with inv16. D. Below are examples of the dysplastic eosinophilic, basophilic precursors seen in several different cases of AML with inv16. |
|
|
|
Figure 2.75 Acute myelomonocytic leukemia with inv16. A. A pleomorphic blast population composed of large cells with low nuclear:cytoplasmic (N:C) ratios, and smaller blasts with high N:C ratios is present in this aspirate smear. Dysplastic eosinophil precursors (“eosinobasophils”) exhibiting the classical dual-staining cytoplasmic granules are prominent (arrows). B. Butyrate esterase stains show that approximately one-half of the blast population, particularly the larger blasts, display positive staining. C. Myeloperoxidase stains demonstrate strong “block-like” cytoplasmic staining in approximately one-half of the blast population, including the abnormal “eosinobasophils.” |
|
|
|
Figure 2.76 AML with 11q23 abnormalities. A and B. FISH of a MLL rearrangement. The MLL gene at 11q23 is labeled with a green fluorochrome at the telomeric (tel) end and with a red fluorochrome at the centromeric (cen) end. A yellow fusion signal indicates an intact MLL gene (A). Translocations involving the MLL (HRX) gene splits the red and green signals apart (B). C. The t(9;11)(p22;q23) rearrangement. The ideograms of chromosomes 9, 11 and the respective derivative chromosomes are to the left in color, and the corresponding G-banded chromosome pairs are to the right. The arrows indicate the breakpoints on the respective chromosomes. D. Acute monocytic leukemia with t(9;11). Well-differentiated monocytic blasts predominate in this aspirate smear. |
|
|
|
Figure 2.77 AML with multilineage dysplasia. A. An aspirate smear with increased blasts and a dysplastic mature erythroid precursor displays irregular (“cookie cutter”) nuclear contours (arrow). B. This aspirate smear shows several giant hypogranular bands (arrows) and a dysplastic erythroid precursor with asymmetric bi-nucleation is situated just below the centrally located hypogranular band. C. An aspirate smear reveals increased blasts and two dysplastic micromegakaryocytes (arrows). |
|
|
|
Figure 2.78 Acute myeloid leukemia in cerebral spinal fluid (CSF). Hematopoietic blasts are seen in this CSF specimen contaminated with blood. The blasts have the typical open chromatin pattern seen in immature cells, unlike the closed pattern of small mature lymphocytes (arrows). |
|
|
|
Figure 2.79 Leukemia cutis. A. Nests of large leukemic cells infiltrate the dermis in this skin biopsy from a patient with acute myeloid leukemia. B. Leukemic infiltration extends into the subcutaneous fat. C. Anti-MPO immunostains show positive-staining leukemia cells invading subcutaneous fat and a blood vessel. |
Chloromas
|
|
|
Figure 2.80 AML in appendix. AML presenting as acute appendicitis with neutropenia and systemic aspergillosis. A. This low-power view of the appendix shows transmural involvement by leukemic cells. B. Higher-power view of the appendix wall reveals infiltration by large leukemic cells with some residual small mature lymphocytes shown on the upper left side. C and D. Low- and high-power views, respectively, illustrating CD117+ leukemic cells infiltrating the entire intestinal wall. In D, negative-staining residual lymphocytes are present in the upper left side of the slide. E and F. PAS stains show angioinvasive aspergillus. |
|
|
|
Figure 2.81 AML involving lymph node. A. Resected lymph node reveals almost total effacement by a diffuse proliferation of large pale-staining cells. Residual nodules of lymphocytes are present (arrows). B. CD45 immunostains show positive staining in residual lymphoid aggregates (arrows), with most of the metastatic leukemic cells showing a negative staining pattern. C. An immunostain for the myeloid marker CD15 shows positive-staining leukemic cells surrounding negative-staining nodule of residual lymphocytes (arrow). D and E. Low- and medium-magnification, respectively, of a surgically resected lymph node shows replacement of nodal tissue by pale-staining leukemic cells. Residual lymphocytes are present on the right side of both figures. F. An immunostain for CD117 demonstrates large positive-staining leukemic cells and negative-staining residual small lymphocytes. G. Anti-MPO stains show positive staining in the large leukemic cells, with negative-staining lymphocytes on the right. |
|
|
|
Figure 2.82 Acute monocytic leukemia involving lymph node. A and B. A fine-needle biopsy of a lymph node reveals effacement of architecture by sheets of large, uniformly spaced, monotonous, leukemic cells. Residual small, mature lymphocytes are present near the right lower corner of the slide. Immunostains for CD117 and lysozyme show positive leukemic cells surrounding negative-staining residual lymphocytes (C,D and E, F, respectively). |
Chloromas and Rare AML Subtypes
|
|
|
Figure 2.83 Acute basophilic leukemia. A. Blood smear shows circulating dysplastic basophilic precursors. B. An aspirate smear demonstrates cohesive clumps consisting exclusively of abnormal basophil precursors. C. A biopsy reveals a hypercellular bone marrow replaced by monotonous-appearing small cells with abundant “agranular” cytoplasm (representing basophils degranulated during tissue processing). |
Rare AML Subtypes and AML Mimics
|
|
|
Figure 2.84 “Hand mirror variant” of acute leukemia. An aspirate smear from a case of AML shows unipolar cytoplasmic extensions that have the appearance of handles. This morphologic variant is not lineage-specific, occurs in various AML subtypes as well as in ALL, and is of uncertain prognostic significance. |
|
|
|
Figure 2.85 AML with cup-like nuclear indentation. In acute myeloid leukemia, this distinctive nuclear morphology, also referred to as “thumbprinting,” has been associated with loss of HLA-DR expression and FLT3 internal tandem duplication. (Kussick et al, Leukemia, 2004;18(10):1591–1598.) |
|
|
|
Figure 2.86 Acute monoblastic leukemia with t(8;16). An aspirate smear shows a pleomorphic population of immature monocytic precursors. Although this translocation has been associated with prominent hemophagocytosis, in this particular case only a rare blast was seen engulfing RBCs as shown on the right. |
|
|
|
Figure 2.87 Small-cell carcinoma of lung. A. Low-power view of an aspirate shows tumor cell clumps. B. Medium-power view shows a cohesive nest of carcinoma cells with scalloped borders and nuclear molding is present in the aspirate. C. High power view of the aspirate shows very large pleomorphic malignant cells. An arrow delineates a paranuclear blue inclusion. D. Necrotic metastatic tumor composed of “ghost” cells appears in the biopsy specimen. |
|
|
|
Figure 2.88 Neuroblastoma in bone marrow. A. An aspirate smear demonstrates an esthesioneuroblastoma in the bone marrow with blast-like cells possessing fine cytoplasmic projections. B. This slide demonstrates loose aggregates of malignant primitive cells. C. A clump of malignant cells displays nuclear molding. D and E. Low- and high-power views, respectively, of biopsy show bone marrow replacement by small, round, blue cells separated by fibrovascular bundles. |
AML Mimics
|
|
|
Figure 2.89 Rhabdomyosarcoma. A. A hypocellular aspirate smear from a case of undifferentiated rhabdomyosarcoma presenting in the bone marrow discloses blast-like cells. B. Pretreatment biopsy demonstrates marrow replacement by an undifferentiated small round blue-cell tumor. C. Immunostains on the pretreatment biopsy for the skeletal muscle marker sarcomeric actin show strong staining in many of the tumor cells. D and E. Posttreatment biopsy reveals differentiation into sarcomeric actin positive tube-like structures. |
Precursor Lymphoblastic Leukemias
|
|
|
Figure 2.90 Ewing sarcoma of the bone marrow. A. A touch prep shows marrow replacement by undifferentiated, blast-like primitive cells. B and C. A biopsy displays infiltration of marrow by loose nests of malignant cells separated by fibrovascular bundles. D. Immuno-stains for O13 (CD99) reveal strong cytoplasmic staining. |
|
|
|
Figure 2.91 Precursor B-cell lymphoblastic leukemia/lymphoma (B-cell ALL). Lymphoid leukemic blasts with characteristic low CD45 expression and low side-scatter properties are shown by arrow in the upper right panel. Below are blood smears from six different case of B-cell ALL showing variations of morphology compared with small mature lymphocytes. Arrows delineate L2 blasts with lower N:C ratios and nucleoli. |
|
|
|
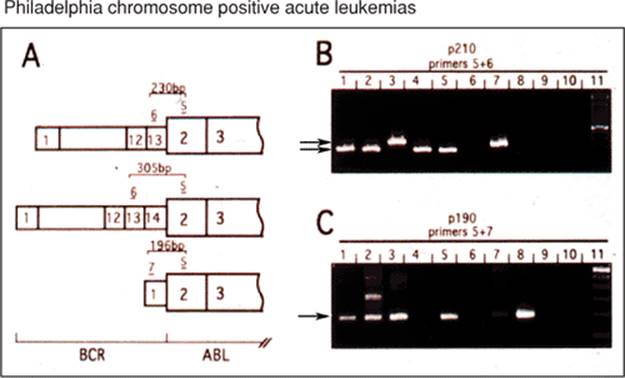
Figure 2.92 Philadelphia chromosome positive (Ph+) acute leukemia. Acute leukemia, in particular B-cell ALL, but also some AMLs, especially those coexpressing B-cell markers, harbors the t(9;22). This fact has important implications for initial treatment decisions, and RTPCR for BCR-ABL should be considered for all adult B-cell ALLs and those AMLs with B-cell marker expression profiles. RTPCR primers sets should include those that can detect the p190 BCR-ABL transcript (common in the Ph+ acute leukemia), as well as the p210 (common in CML) and p230 (found in rare Phi+ chronic neutrophilic leukemia). (Courtesy Dr. S. Kamel-Reid.) |
|
|
|
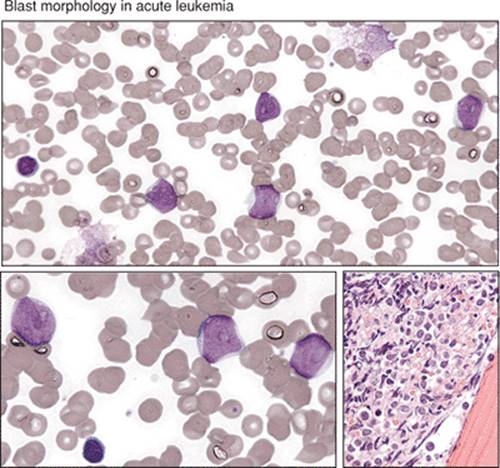
Figure 2.93 Blast morphology in ALL. On the left side of the figure are three examples from different blood smears illustrating the three morphologic variants of blasts: L1, L2, L3 seen in acute lymphoid leukemias. On the right side are the corresponding cartoons. The L1 blast is common and can be confused, especially in infants, with the normal small mature lymphocytes that are shown in many of the blood smears for comparison. |
|
|
|
Figure 2.94 L2 ALL blasts. ALL blasts, in particular the L2 morphologic variants, can look very much like typical AML blasts (large cells with moderate N:C ratios and very prominent nucleoli). Morphology can be misleading when trying to determine lineage of blasts; immunohistochemistry and immunophenotyping are almost always necessary to distinguish ALL from AML. |
|
|
|
Figure 2.95 ALL with fibrosis. A case of B-cell ALL with architectural distortion on hematoxylin and eosin (H&E)-stained biopsy sections includes lining up of individual blasts (so-called Indian filing) and swirling patterns that suggest significant marrow fibrosis (upper two panels). The latter is confirmed with reticulin stains showing increased numbers of thickened fibers (lower panel). Marrow fibrosis often precludes flow cytometric evaluation of leukemic cells from dry aspirate smears. In these cases, efforts should be made either to disaggregate biopsy specimens for flow cytometry or, alternatively, to acquire biopsies for immunohistochemistry. |
|
|
|
Figure 2.96 Precursor T-cell lymphoblastic leukemia/lymphoma (T-ALL). A scattergram shows blasts positive for cytoplasmic CD3 expression, a T-cell–specific marker that is usually positive in T-ALL (upper panel). Aspirate smears disclose sheets of L2 type blasts with high mitotic rate and strong block-like cytoplasmic PAS positivity (left and right lower panels, respectively). |
|
|
|
Figure 2.97 Precursor T-cell lymphoblastic leukemia/lymphoma (T-ALL). T-ALL often presents with a high blast count and a mass in the mediastinum or other tissues. This slide shows a young man with a mediastinal mass eroding through the sternum. An axial CT scan with intravenous contrast at the level of the upper thorax discloses an anterior mediastinal soft tissue mass consistent with leukemia/lymphoma. (Courtesy Dr. I. Quirt.) |