
How reliable is a prediction of 37-percent British ancestry? Why doesn’t your confirmed German or Italian ancestry show up in your ethnicity prediction? You can answer these questions by learning more about the ethnicity estimates that each of the major testing companies provides with the test-takers’ autosomal DNA (atDNA) testing results. While some people assume these estimates are foolproof, ethnicity estimates are merely percentages of the test-taker’s DNA determined by the testing company’s algorithm to be associated with a particular continent, region, or country. Unfortunately, ethnicity prediction is still a young and developing science, and these ethnicity estimates are subject to limitations that minimize their applicability to genealogical research.
What are Ethnicity Estimates?
Ethnicity estimation—also known as admixture or biogeographical estimation—is the process of assigning a test-taker’s DNA to one or more populations around the world based on computerized comparisons of those segments to reference populations. Individual segments of the test-taker’s DNA are assigned to the reference population that they most closely match, based on the assumption that the DNA most likely came from that population at some recent point in time. All assignments over the test-taker’s entire genome are added together to create the overall ethnicity estimate.
Let’s look at a couple examples of how ethnicity estimates are presented. In image A, test-taker Jacob Armstrong tested at one of the atDNA testing companies and received an ethnicity estimate along with his list of genetic matches. The estimate provides his ethnicity for each of four broad categories: African (10 percent), Asian (12 percent), European (78 percent), and Native American (0 percent). In image B, test-taker Millie Fuller’s estimate is much more specific, with 34-percent Great Britain, 28-percent Ireland, 14-percent Italy/Greece, 13-percent Iberian Peninsula, and 11-percent Scandinavia.

Some ethnicity estimates only specify general categories of ethnicities.

DNA testing companies will sometimes provide ethnicity estimates that mention specific countries or regions.
Typically, estimates using broader categories are more accurate, as it’s easier for geneticists to distinguish between continents (e.g., European versus Asian) than it is to distinguish between modern countries (e.g., German versus French). As a result, Jacob’s results—while less specific—are more likely to be correct than Millie, as Jacob’s results only suggest this DNA matches a particular continent, rather than a particular country or region.
Reference Populations or Panels
As discussed in earlier chapters, DNA analysis often relies on comparisons between a test-taker’s DNA and a reference sample. Ethnicity estimates operate in a similar way, as geneticists compare test-takers’ DNA to collections of reference samples that were obtained from known locations.
The goal of most ethnicity estimates is to identify where the test-taker’s DNA was found approximately five hundred to one thousand years ago. Accordingly, a perfect reference population or panel would consist of samples of DNA obtained from populations five hundred years ago. Since this is impossible, researchers normally utilize DNA from people who can reasonably assert that all four of their grandparents were from a specific, concentrated location (such as a county or village). While not a perfect filter, this does help formulate a more accurate reference panel.
Image C is a theoretical map showing fourteen reference populations from all over the world. Some reference populations in this map, such as those in Europe, represent relatively small regions that DNA companies feel they have adequately sampled local populations. Other regions, such as Asia, are not adequately sampled and thus the reference population represents a very large region.

Testing companies assign reference populations based on DNA samples they have received. Because companies have sampled the DNA of more people in Europe and North America than they have in other regions, they can create more reference populations in these regions than they can in South America, Africa, Asia, or Australia and Oceania.
Note that the size and diversity of the reference panel is a strong factor in the accuracy of an ethnicity estimate. Comparing the test-taker’s DNA to a database containing only European reference populations will not, for example, produce useful results for someone with Native American or African ancestry.
Each of the testing companies has its own reference panel:
· 23andMe utilizes a database of more than ten thousand people from various populations around the world for its ethnicity reference panel, all of whom have relatively well-known ancestry. 23andMe’s reference population was obtained from both 23andMe customers and from public sources <www.23andme.com/en-int/ancestry_composition_guide>.
· AncestryDNA uses a reference panel with more than three thousand DNA samples from people in twenty-six global regions <dna.ancestry.com/resource/whitepaper/ancestrydna-ethnicity-white-paper>.
· Family Tree DNA’s reference panel is composed of numerous individuals from twenty-two different population clusters <www.familytreedna.com/learn/ftdna/myorigins-population-clusters>.
The companies continue to add DNA from new individuals and new populations to the reference panels.
Over the next few years, reference panels will likely continue to improve in at least two ways. First, developing reference panels will likely be populated with more individuals from a wider variety of populations. Second, reference panels will likely be populated with more ancient DNA samples being obtained from ancient remains all over the globe. Together with other improvements, these additions will help DNA testing companies significantly improve the accuracy of their ethnicity estimates.
Ethnicity Estimates from the Big Three
Together with cousin matching, ethnicity estimates are one of the two major interpretations of your DNA offered by the big three testing companies. Each of the testing companies provides an estimate of very broad regions, including Africa, Asia, the Americas, and Europe, and each attempt to break these regions down into smaller categories, often based on modern-day countries. See the Global Regions Comparison Worksheet at the end of the chapter for more detailed information.
If you test at all three companies, you should expect your ethnicity estimate to vary. In the following table are actual ethnicity estimates for the same person from each company (rounded to the nearest percentage):

View text version of this table
As we learned earlier in this chapter, these differences don’t mean that one estimate is correct while another estimate is incorrect. Differences in the reference populations and ethnicity analysis algorithms utilized by the company will necessarily result in differences in the estimates.
When testing at multiple companies, remember that these differences are expected. Rather than looking for identical predictions, look for trends or patterns. According to the results in the table, for example, this person clearly has mostly European ethnicity and very likely has a significant 2- to 3-percent Native American contribution as well. The African and Asian estimates are a little more questionable, and additional research or analysis might be necessary.
AncestryDNA
Through its DNA testing, AncestryDNA provides an estimate for at least twenty-six different global regions, a number that has grown several times.
Here’s how the test works. After AncestryDNA obtains the test-taker’s DNA, the ethnicity algorithm performs forty different analyses using the test-taker’s DNA, chopping the test-taker’s DNA into random pieces for each. Running the analysis forty times allows for the program to process different combinations of the DNA and report results in a more accurate estimate while also providing a range for each estimate. Next, each of the forty analyses is compared to the reference panel to create an ethnicity estimate, and the average of the forty estimates for each region or ethnicity is determined.
In image D, for example, the average of the forty estimates for this particular ethnicity is 55 percent. Some of the forty analyses are as low as 40 percent, while others are as high as 67 percent; most of the estimates, however, fall within 45 to 65 percent. This 45 to 65 percent is the range of the estimates, which is another piece of information provided to test-takers at AncestryDNA.

AncestryDNA analyzes test-takers’ DNA forty times, then takes the average of these to calculate an ethnicity estimate for a particular reference population. For this reference population (Great Britain), the average of my comparisons was 55 percent (indicated by the dotted line).
AncestryDNA provides information to the test-taker in the ethnicity estimate interface. For example, my ethnicity estimate from AncestryDNA is shown in image E. The values for each region are the average obtained from the forty different analyses. Clicking on each individual region will expand that region and the range from the forty analyses is shown to the test-taker.

AncestryDNA compiles the averages of your estimates from each reference population and reports them alongside a map of the world showing roughly where a reference population originates from.
For much more information about AncestryDNA’s ethnicity estimate, see the AncestryDNA Ethnicity Estimate White Paper <dna.ancestry.com/resource/whitePaper/AncestryDNA-Ethnicity-White-Paper>.
23andMe
Like AncestryDNA, 23andMe also starts with the test-taker’s DNA sequence, then uses a proprietary computer algorithm called “Finch” to phase the DNA. Phasing refers to separating the test-taker’s DNA sequence into the DNA provided by the mother and the DNA provided by the father. Normally, phasing is done by comparing a child’s DNA to one or both of the parents’ DNA. For automated phasing, however, the algorithm uses a statistical analysis to separate each parent’s contribution to the test-taker’s DNA. The program attempts to separate the DNA into two different contributors, but it doesn’t know which contributor was the mother and which contributor was the father.
Next, 23andMe breaks the chromosomes into short, non-overlapping, adjacent segments of about one hundred markers (approximately fifty to four hundred segments for each chromosome). Each of the segments is then compared to 23andMe’s reference populations to determine which of the reference populations is most similar to the segment.
The 23andMe process then corrects several different types of errors in assignments. For example, the algorithm “smooths” the data by correcting assignments that are almost certainly incorrect. If the data shows a series of ten segments in a row assigned to Population A interrupted in the middle by an assignment of a single segment to Population B, the smoothing algorithm will change the assignment to Population A. The smoothing algorithm will also correct phasing mistakes known as a “switch error” in which the phasing algorithm mixes up the DNA of one parent with the other parent. The smoothing algorithm fixes the switch error by switching the ancestry assignments back between the two versions (“mom” and “dad”) of a given chromosome.
Next, 23andMe applies a confidence threshold to the data to determine what ethnicity estimates are provided to the test-taker. The test-taker is able to adjust this threshold to see estimates that are more conservative (where the threshold is higher) and estimates that are speculative (where the threshold is lower). In 2016, 23andMe switched all users to a new user interface experience. In the old user interface, test-takers could adjust their ethnicity estimate threshold from Speculative to Standard to Conservative. In the new user interface, test-takers can adjust their ethnicity estimate threshold based on percentages ranging from 50 percent (Speculative) to 90 percent (Conservative). The default is 50 percent, and as the test-taker increases the threshold, the estimate may change as some assignments no longer satisfy the selected threshold.
My ethnicity estimate from the old user interface at 23andMe is shown in image F. The threshold for this display was set to Speculative, and the display is also adjusted to show “Sub-Regional Resolution,” meaning that the ethnicity estimate identifies specific regions. For example, instead of broad categories like European or northwestern European, estimates for individual countries like British & Irish and French & German are shown.

23andMe allows you to specify how you’d like to view your ethnicity estimate at different region levels, with varying degrees of confidence at each interval.
23andMe also allows test-takers to use a chromosome browser to see where in their genome the assigned segments of each population are found (image G). The blue (European), orange (East Asian & Native American), red (Sub-Saharan African), and purple (Middle Eastern & North African) colors on the chromosomes represent where each ethnicity assignment is found. For example, my chromosome 6 has a long orange (East Asian & Native American) segment, suggesting I received that DNA from East Asian or Native American ancestors.

When you test at 23andMe, you’ll also receive a chromosome browser that allows you to see from which region you likely received different portions of each chromosome.
Each chromosome is shown with two copies in the 23andMe chromosome browser, although there is no order to the arrangement. It is also unclear from one person’s test results whether multiple segments on a chromosome all came from one parent or a mixture of the two parents. For example, chromosome 2 in the image has two small red segments and one orange segment. It is possible that the red segments came from one parent and the orange segment came from the other parent, or that one red segment came from one parent and the other red segment and the orange segment from the other parent, for example. Only if an ethnicity is identified at the same location on both chromosomes can the test-taker be reasonably assured that an ethnicity came from both the mother and father. In the image, for example, most of the chromosomes are blue (i.e., European) on both copies.
To learn more about 23andMe’s ethnicity estimate, see the 23andMe Ancestry Composition guide: <www.23andme.com/en-int/ancestry_composition_guide>.
Family Tree DNA
Family Tree DNA’s ethnicity estimate is called myOrigins, which provides an estimate for several different global regions. To do this, Family Tree DNA first obtains the test-taker’s DNA sequence, then compares the DNA to the different global regions to obtain an overall ethnicity estimate.
My myOrigins ethnicity estimate from Family Tree DNA is shown in image H. The default for the user interface is to show broad categories such as European, Central/South Asian, Middle Eastern, New World, and East Asian. Clicking on these regions reveals sub-regions, as shown in image I, where expanding European to sub-regions reveals Western and Central Europe, British Isles, and Scandinavia.

The default view in Family Tree DNA’s ethnicity estimate results describes broad categories, projected over the rough regions they represent.

Family Tree DNA users can expand regions to view a breakdown of estimates for more specific regions.
To learn more about myOrigins, including a detailed description of the different reference populations, see the myOrigins Methodology Whitepaper <www.familytreedna.com/learn/user-guide/family-finder-myftdna/myorigins-methodology/>.
GEDmatch Ethnicity Calculators
In addition to the ethnicity estimates provided by the testing companies, you can also access the free third-party tool GEDmatch <www.gedmatch.com>, which offers test-takers a variety of different ethnicity calculators. These calculators, all created by academics and independent researchers, can help verify and expand upon your ethnicity estimates from the major testing companies.
Similar to the company ethnicity algorithms, the calculators at GEDmatch each have different reference populations. Since the different calculators at GEDmatch have different underlying algorithms and each use different reference populations, it is not unusual for ethnicity estimates to vary significantly from one calculator to another calculator, or for GEDmatch calculator estimates to vary from the ethnicity estimate from the testing companies.
Each of the ethnicity calculators at GEDmatch has two or more models the user can select from. These models are slight variations of the individual calculators and usually differ based on the composition and/or number of the reference populations used for analysis.
GEDmatch currently offers the following ethnicity calculators:
1. MDLP (Magnus Ducatus Lituaniae Project) <magnusducatus.blogspot.com> is described by the creator as a biogeographical analysis project for the territories of the former Grand Duchy of Lithuania. There are twelve different models of the MDLP Project calculators, and World22 is the default model.
2. Eurogenes (Eurogenes Genetic Ancestry Project) <bga101.blogspot.com> focuses on European ancestry. There are thirteen models of the Eurogenes calculators, usually varying by the reference populations included in the analysis. Eurogenes K13 is the default model.
3. Dodecad (Dodecad Ancestry Project) <dodecad.blogspot.com> focuses on Eurasian individuals. The project is named after the Greek word for “group of twelve.” There are five models of the Dodecad calculator, and the default is Dodecad V3.
4. HarappaWorld (Harappa Ancestry Project) <www.harappadna.org> focuses on South Asian ancestry and populations: Indians, Pakistanis, Bangladeshis, and Sri Lankans. The HarappaWorld calculator has no variations.
5. Ethio Helix (Intra African Genome-Wide Analysis) <ethiohelix.blogspot.com> focuses on African ancestry and populations. There are four models of the Ethio Helix calculator, and the default model is Ethio Helix K10 + French.
6. puntDNAL focuses primarily on Africa (particularly East Africa), West Asia, and Europe. There are five models of the puntDNAL calculator, and the default is puntDNAL K10 Ancient.
7. gedrosiaDNA focuses on the Indian subcontinent. There are nine models of the gedorsiaDNA calculator, and the default is Eurasia K9 ASI.
The results of the GEDmatch analysis can be displayed in multiple ways, including a chromosome view showing where the ethnicities are found within the chromosomes and a percentages view that shows the overall percentages of the ethnicity estimate. For example, in image J, my DNA was analyzed using the World9 model of the Dodecad calculator. The nine reference populations used for the World9 model are shown in the image, and the ethnicities are shown on the chromosomes. Unlike the 23andMe chromosome browser, only one copy of each chromosome is shown.
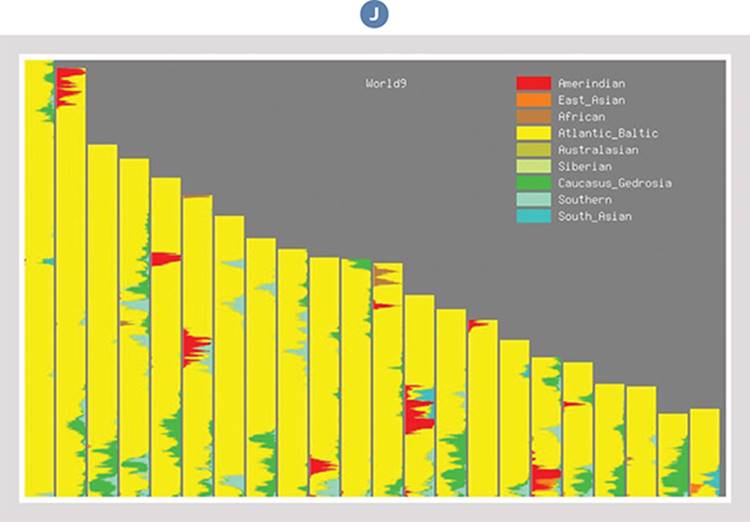
Ethnicity calculators on GEDmatch, such as the Docecad’s World9 model, compare use your testing results to display your DNA in more detail.
A comparison of the 23andMe ethnicity chromosome browser and the results from the World9 model of the Dodecad calculator, shown in image K, reveal that many segments were identified in both calculators. Generally, you can trust an ethnicity assignment that has been identified by two or more independent calculators.
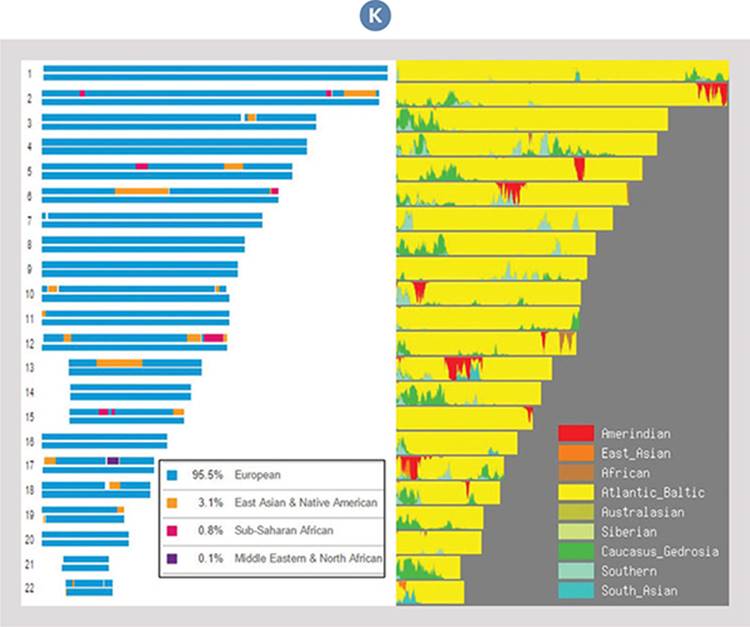
Ethnicity calculators, such as the one on the right, can correspond with (and thus verify) the estimates from your test results, such as those on the left.
In image L, the results of the same Dodecad World9 analysis are shown in percentage and pie chart form. Using these two formats, the test-taker can see percentages for ethnicity estimates, as well as where within the chromosomes those segments are located.
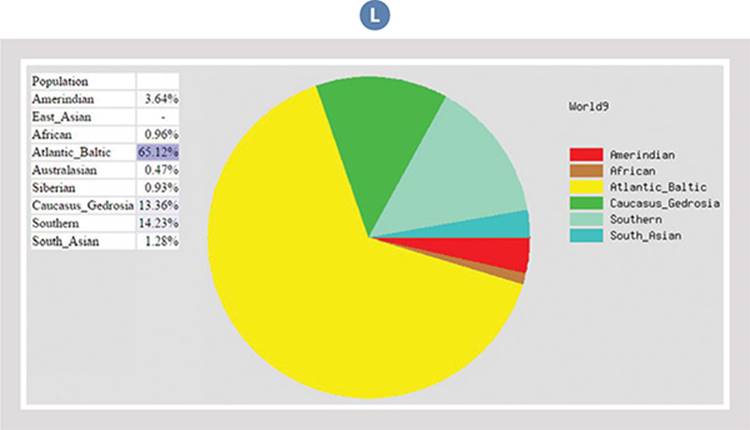
Ethnicity calculators can also represent your estimates in a pie chart.
Limitations of Ethnicity Estimates
Ethnicity estimates are subject to several inherent limitations that prevent them from being completely accurate or especially helpful for genealogical research. These limitations do not mean that ethnicity estimation is bad science; rather, the limitations mean the science these estimates are based upon is continuing to develop and improve. And as a result, it’s almost certain that any ethnicity estimate you receive today will be revised and updated several times in the future.
First, it’s important to remember that ethnicity estimates are just that—estimates. Although the estimates have genealogical applications, they are fundamentally limited by the underlying science. For example, every company or third-party calculator utilizes a reference population, but reference populations are based on modern-day populations rather than ancient populations. Further, these reference populations sample a limited number of people and are not representative of the entire world.
Further, some ethnicities are nearly impossible to accurately identify. For example, populations have been migrating throughout central and western Europe for centuries, bringing their DNA from one place to another. Accordingly, the populations that eventually became modern-day Germany, France, Belgium, Switzerland, and a variety of other locations do not have enough genetic differences to be able to reliably identify a test-taker’s DNA as belonging to just one of those populations. AncestryDNA describes this genetic intermingling process in its Help Topics section:
“When individuals from two or more previously separated populations begin intermarrying, the previously distinct populations become more difficult to distinguish. This combination of multiple genetic lineages is called admixture. Regions that border each other are often admixed — sometimes to a great degree.”
For example, AncestryDNA has found that most of the people in their Spain reference panel have about 13 percent of their DNA from the Italy/Greece region. Accordingly, it is difficult to determine whether an individual who has DNA from the Italy/Greece region has recent Italian/Greek or Spanish ancestry.
While broad categories such as Europe, Asia, Africa, and the Americas are generally reliable, ethnicity estimates become less reliable the more specific the estimate attempts to predict. Accordingly, a test-taker must be cautious about relying on an ethnicity estimate at the sub-continent or country level.
Genealogical Uses of Ethnicity Estimates
Despite their limitations, ethnicity estimates can have genealogical applications. For example, 23andMe’s Ancestry Composition has a chromosome view that shows the test-taker where the segments of DNA for each ethnicity are found. The test-taker whose results are in image M has African (red) and Native American (orange) segments of DNA on chromosome 2. Although the exact start and stop positions of these segments of DNA (which would more specifically identify shared DNA) are not provided, the test-taker can use the information to look for others who share similar segments. It may also be possible to assign these segments of DNA to particular ancestors if the test-taker knows what parent, grandparent, or ancestor these segments likely came from.

Looking for other individuals who have DNA from similar parts of the world in particular places on particular chromosomes can be a new avenue of research.
Ethnicity estimates can also provide clues to adoptees or others with recent genealogical brick walls. In image N, for example, one of the test-taker’s parents had almost 100 percent Ashkenazi Jewish ancestry. As a result, the test-taker is predicted to be about 46 percent Ashkenazi, and none of the Ashkenazi segments (in green) overlap on both copies of the chromosome. This means that the adoptee almost certainly inherited the segments from one parent.

This test-taker has a relatively large percentage of DNA from Ashkenazi Jewish ancestry. Because none of the Ashkenazi regions overlap on both chromosomes, it’s likely the test-taker inherited the DNA from only one parent, opening up a research opportunity.
CORE CONCEPTS: ETHNICITY ESTIMATES
An ethnicity estimate represents which portions (and how much) of a test-taker’s DNA match one or more reference populations around the world.
A reference population is a collection of DNA samples representing a particular geographic population at some recent point in time.
The small size and limited geographic diversity of a reference population database constrains the accuracy of ethnicity estimates created using that database.
Each of the testing companies—23andMe, AncestryDNA, and Family Tree DNA—provides an ethnicity estimate with atDNA testing. Third-party tools such as GEDmatch offer additional ethnicity calculators.
Ethnicity estimates are not able to adequately distinguish between specific geographic locations such as neighboring countries. Ethnicity estimates work best for determining the continental source of DNA (Africa, Americas, Asia, and Europe).
Ethnicity estimates can sometimes provide useful information to genetic genealogists as long as you bear in mind their limitations.
Global Regions Comparison Worksheet

View text version of this table
The accuracy of ethnicity estimates depends largely on the geographic regions each testing company uses to sample and report data. Below, you’ll find a table expressing the global regions used by each of the “Big Three” (23andMe, AncestryDNA, and Family Tree DNA) in reporting ethnicity estimates as of this book’s writing. Download a PDF version online at <ftu.familytreemagazine.com/ft-guide-dna>.