
6.1. Contrast agents in neuroradiology
Also see Intraoperative dyes, page 144 for visible dyes useful in the operating room.
IODINATED CONTRAST AGENTS
✖ Caution: iodinated contrast (IV or intraarterial) may delay excretion of metformin (Glucophage®, Avandamet®), an oral hypoglycemic agent used in diabetes type II, and can be associated with lactic acidosis and renal failure. The manufacturer recommends withholding metformin 48 hrs prior to and following contrast administration (or longer if there is evidence of declining renal function following use of contrast). Metformin should also be held ≈ 48 hours before any surgery, and should not be restarted post-op until the patient has fully recovered and is eating and drinking normally.
Maximum dose of iodine with normal renal function is ≈ 86 gm in a 24 hour period.
INTRATHECAL CONTRAST AGENTS
The primary approved agent employed for intrathecal use today is iohexol (Omnipaque®) (see below).
Inadvertent intrathecal injection of ionic contrast agents
✖ Caution: serious reactions can occur with inadvertent intrathecal injection (e.g. for myelography, cisternography, ventriculography…) of iodinated contrast media that are not specifically indicated for intrathecal use (including ionic contrast agents as well as some non-ionic agents (e.g. Optiray®, Reno-60…)). This can cause uncontrollable seizures, intracerebral hemorrhage, cerebral edema, coma, paralysis, arachnoiditis, myoclonus (tonic-clonic muscle spasms), rhabdomyolysis with subsequent renal failure, hyperthermia, and respiratory compromise, with a significant fatality rate1.
Management suggestions include:
1. immediately remove CSF + contrast if the error is recognized when the opportunity is available (e.g. withdraw fluid through myelography needle)
2. elevate head of bed ≈ 45° (to keep contrast out of head)
3. if there is a question about what may have occurred (i.e. it is not certain if an inappropriate contrast agent was used) send blood and CSF with contrast for high-performance liquid chromatography for identification of agent2
4. antihistamines: e.g. diphenhydramine (Benadryl®) 50 mg deep IM
5. respiration: supplemental oxygen, and if needed, intubation
6. control HTN
7. IV hydration
8. IV steroids
9. sedation if patient is agitated
10. treat fever with acetaminophen and if needed with a cooling blanket
11. pharmacologic paralysis if necessary to manage muscle activity
12. anticonvulsant medication: more than one agent may be required (e.g. phenytoin + phenobarbital + a benzodiazepine)
13. consider unenhanced brain CT scan: may help assess if contrast has diffused intracranially, but this requires placing patient flat and may not be advisable
14. insertion of lumbar subarachnoid drain
15. monitor: electrolytes, anticonvulsant levels, creatine kinase (CK)
16. repeat EEGs to assess seizure activity while sedated/paralyzed
Iohexol (Omnipaque®)
A non-ionic triiodinated compound. It has replaced metrizamide. Concentrations expressed as follows: e.g. Omnipaque 300 contains the equivalent of 300 mg of organic iodine per ml of media (300 mgI/ml).
Usually reserved for IV contrast CT scan of brain primarily for patients with previous dye reaction, e.g. to Reno-60. Uses and concentrations are shown in Table 6-1.
Table 6-1 Iohexol concentrations for adults
|
Procedure |
Concentration (mgI/ml) |
Volume (ml) |
|
lumbar myelography via LP |
180 |
10-17 |
|
thoracic myelography via LP or cervical injection |
240 |
6-12.5 |
|
cervical myelography via LP |
240 |
6-12.5 |
|
cervical myelography via C1-2 puncture |
180 |
7-10 |
|
complete myelography via LP |
240 |
6-12.5 |
|
cerebral arteriography* |
300 |
≈ 6-12 ml/vessel |
|
IV contrast enhanced CT scan of the brain |
240 |
120-250 ml IV drip |
|
CT cisternography via LP or C1-2 puncture |
300 |
12 |
|
CT ventriculography via ventricular catheter |
180‡ |
2-3 |
|
plain film ventriculography via ventricular catheter |
180 |
2-3 |
|
plain film “shunt-o-gram” injected via shunt into ventricles |
180 |
2-3 |
|
plain film “shunt-o-gram” injected via shunt distal to valve so as not to enter into ventricles (to check distal shunt function) |
300 |
10-12 |
* most centers use Optiray®, see text
† follow with 250 ml bolus of 0.45% NS to rehydrate patient
‡ 180 will be very dense on CT, and some use 1-3 ml of 140 or diluted 180%(dilute approximately 2 parts contrast to 1 part preservative-free normal saline)
Intrathecal use: NB: only Omnipaque 180, 210, 240 and 300 are labeled for intrathecal use. 140 and 350 are not FDA approved for intrathecal use, however, some neuroradiologists will use Omnipaque 140 or diluted 180 e.g. for CT ventriculography.
Consider discontinuing neuroleptic drugs (including: phenothiazines, e.g. chlorpromazine, prochlorperazine, and promethazine) at least 48 hours prior to procedure. Elevate HOB ≥ 30° for the first few hours after the procedure. Hydrate orally or IV.
Use with caution in patients with seizure history, severe cardiovascular disease, chronic alcoholism or multiple sclerosis.
Iohexol undergoes slow diffusion from the intrathecal space to the systemic circulation and is eliminated by renal excretion with no significant metabolism or deiodination.
Maximum dosage: a total dose of 3060 mg iodine should not be exceeded in an adult during a single myelogram (some say up to 4500 mg is OK) (e.g. 15 cc of Omnipaque 300 = 15 ml x 300 mgI/ml= 4500 mg of iodine).
Iopamidol (e.g. Isovue 300, Isovue 370®)
Triiodinated, non-ionic, water-soluble. Used for intravascular and intrathecal radiographic contrast. Isovue 300 and 370 contains 300 and 270 mg iodine/ml, respectively.
NON-INTRATHECAL CONTRAST AGENTS
For inadvertent intrathecal injection of contrast agents not intended for intrathecal use, see above.
Diatrizoate meglumine (e.g. Reno-60®, Reno-dip®)
✖ Not for intrathecal use (see above).
A tri-iodinated benzine derivative similar to Conray. Both have been available for a long time. Due to the fact that it ionizes, it is ionic and hyperosmolar. Widely used IV, in neuroradiology for IV contrast enhanced CT (CECT)scan when there is no history of prior reaction to IV contrast agents (use iohexol in patients with previous reaction, see above).
• CECT of the brain in adult patient with no history of previous dye reaction:
A. 300 ml IV drip of Reno-dip® (30% solution, i.e. 300 mg/ml) over ≈ 15 mins
B. 50-150 ml of Reno-60 (60% solution). Typically: 150 ml is used
• body CT: bolus of 150 ml of Reno-60® (3 vials of 50 ml each), followed e.g. by 250 ml of 0.45% NS to help prevent dehydration. Usually given more slowly to diabetics and the elderly where there is increased risk of renal failure
Ioversol (Optiray®)
✖ Not for intrathecal use (see above).
Uses and concentrations include:
• arteriography: Optiray 300 (ioversol 64%) or Optiray 320 (ioversol 68%). Total procedural dose should not usually exceed 200 ml
• IV contrast enhanced CT scan of brain:
A. adult: 50-150 ml of Optiray 300, 320, or 100-250 ml of Optiray 240. Typically: 100 ml of Optiray 320
B. pediatrics: 1-3 ml/kg of Optiray 320
Iopromide (Ultravist®)
✖ Not for intrathecal use (see above). Available in 150, 240, 300 & 370 mg iodine/ml. Osmolality of Ultravist 300 is 607.
Cerebral angiography (300 mg/ml): maximum dose is 150 ml per procedure.
Contrast enhanced CT (CECT) (300 mg/ml). Rx Pediatrics (> 2 years age): typical dose in is 1-2 ml/kg IV, maximum dose is 3ml/kg per procedure. Adult: typical dose is 50-200 ml, maximum dose is 200 ml.
Iodixanol (Visipaque®)
✖ Not for intrathecal use (see above). Triiodinated, non-ionic, iso-osmolar to blood. For intravascular use. FDA approved for CECT, some angiographers use Visipaque 270 for cerebral angiography (slightly lower opacification, but also slightly lower iodine dose). Available in 270 and 320 mg iodine/ml.
6.1.1. Iodinated contrast preps
6.1.1.1. Allergy prep
Indicated for patients with previous history of reaction to IV iodinated contrast material. Minor previous reactions such as hives and itching should merit preparation with this regimen whenever possible. Patients with anaphylactic shock or severe edema causing compromise of the airway should probably not receive IV iodine even with this prep, unless absolutely necessary. ✖ Caution: the patient may still have serious reaction (modified3). This prep has also been used for the rare gadolinium allergy.
1. utilize non-ionic contrast medium (e.g. iohexol) whenever possible
2. have emergency equipment available during study
3. medications:
A. steroid (see page 31 for further details of steroid dosing)
1. prednisone 50 mg PO: 20-24 hrs, 8-12 hrs & 2 hrs before study
2. equivalent dose of IV Solumedrol® (methylprednisolone): ≈ 25 mg
B. diphenhydramine (Benadryl®) 50 mg, EITHER IM 1 hr before, OR IV 5 min before study
C. optional: H2 antagonist, e.g. cimetidine 300 mg PO or IV 1 hr before study
Medications for an emergency scan when 24 hour prep is not possible:
• hydrocortisone 100 mg IV then scan within 2 hours
6.1.1.2. Prep for renal insufficiency
For patients with DM or mild renal insufficiency (e.g. slight serum creatinine elevation, > 1.2 mg/dL (U.S.) which is > 100 μmol/L), to mitigate against iodine contrast-induced nephropathy:
• N-acetyl cysteine (Mucomyst)A: regimens all accompany hydration and include:
A. 800 mg PO q 8 hrs for 24 hours before the study4, followed by 600 mg PO BID for 24 hours after the study
B. 600 mg PO BID X 2 days before the study, 600 mg PO BID for 24 hours after
C. 600-mg IV bolus before the study, and 600 mg PO BID for 48 hours after5
• hydration: 1 L of sterile water with 3 amps of sodium bicarbonate IV at 100 ml/hr, start 1 hour prior to the study, and continue until entire L given
A. the actual efficacy of NAC has not been proven, and may be no better than hydration alone
6.1.2. Reactions to intravascular contrast media
BETA BLOCKERS
Beta blockers can increase the risk of contrast media reactions, and may mask some manifestations of an anaphylactoid reaction.
They also make use of epinephrine inadvisable since the alpha effects of epinephrine will predominate (bronchospasm, vasoconstriction, increased vagal tone). If treatment is required for hypotension, may try glucagon 2-3 mg IV bolus, followed by 5 mg IV drip over 1 hour (glucagon has positive inotropic and chronotropic effect that is not mediated through adrenergic pathways).
IDIOSYNCRATIC REACTIONS AND TREATMENT
For treatment of inadvertent intrathecal injection of ionic contrast agents, see page 122.
HYPOTENSION WITH TACHYCARDIA (ANAPHYLACTOID REACTION)
1. mild: Trendelenburg position. IV fluids
2. if no response but remains mild:
epinephrine (use with caution in patients with coronary artery disease, limited cardiac reserve, hypertension, or unclipped cerebral aneurysm)
A. 0.3-0.5 ml of 1:1000 SQ (0.3-0.5 mg) q 15-20 mins (peds: 0.01 mg/kg)
B. or, ASEP recommendations (especially for elderly or patients in shock): 10 ml of 1:100,000 IV over 5 to 10 min (put 0.1 ml of 1:1000 in 10 ml of NS, or dilute 1 amp of 1:10,000 to 10 ml with NS)
3. moderate to severe or worsening (anaphylaxis): add:
A. IV colloidal fluids, e.g. hetastarch (Hespan®) 6% (colloids are required since there is extravascular shift of fluids due to seepage, these agents also carry a small risk of allergic reaction)
B. epinephrine (see above). May repeat x 1
C. O2 2-6 L/min per NC. Intubate if necessary
D. EKG to R/O ischemic changes
4. if shock develops: add dopamine, start at 5 mcg/kg/min (see page 22)
HYPOTENSION WITH BRADYCARDIA (VASOVAGAL REACTION)
1. mild:
A. Trendelenburg position
B. IV fluids
2. if no response, add:
A. atropine 0.75 mg IV, may repeat up to 2-3 mg over 15 mins PRN. Use with caution in patients with underlying heart disease
B. EKG and/or cardiac monitor: especially if atropine or dopamine are used
3. if no response: add dopamine, start at 5 mcg/kg/min (see page 22)
URTICARIA
1. mild: self limited. No treatment necessary
2. moderate:
A. diphenhydramine (Benadryl®) 50 mg PO or deep IM (avoid IV, can cause anaphylaxis itself)
B. cimetidine (Tagamet®) 300 mg PO or IV diluted to 20 ml and given over 20 mins. H2 receptors contribute to wheal and flare of reaction
3. severe: treat as above for moderate reaction, and add:
A. epinephrine (see above)
B. maintain IV line
FACIAL OR LARYNGEAL ANGIOEDEMA
1. epinephrine: see above. May repeat up to 1 mg
2. if respiratory distress: O2 2-6 L/min. Intubate if necessary (orotracheal may be very difficult due to swelling of tongue, nasotracheal intubation or emergency cricothyrotomy may be required)
3. diphenhydramine: see above
4. cimetidine: see above
5. if angioedema is accessible, add ice pack
6. maintain IV line
7. steroids are usually effective only for chronic angioedema
BRONCHOSPASM
1. mild to moderate:
A. epinephrine: see above. May repeat up to 1 ml
B. if respiratory distress: O2 2-6 L/min. Intubate if necessary
C. maintain IV line
D. inhalational therapy with a ß-adrenergic agonist, e.g. albuterol (Proven-til®) if respiratory therapy is available, otherwise, metered dose inhaler e.g. pirbuterol (Maxair®) or metaproterenol (Metaprel®), 2 puffs
2. severe: treat as above for moderate reaction, and add:
A. aminophylline 250-500 mg in 10-20 cc NS slow IV over 15-30 mins. Monitor for hypotension and arrhythmias
B. intubate
3. prolonged: add the following (will not have immediate effect):
A. hydrocortisone 250 mg IV
B. diphenhydramine: see above
C. cimetidine: see above
PULMONARY EDEMA
1. O2 2-6 L/min per NC. Intubate if necessary
2. raise head and body
3. furosemide (Lasix®) 40 mg IV
4. EKG
5. if hypoxia develops (may manifest as agitation or combativeness), add:
A. morphine 8-15 mg IV. May cause respiratory depression, be prepared to intubate
B. epinephrine: see above. ✖ CAUTION: use only if MI can be R/O as cause of the pulmonary edema. Patients with acute intracranial pathology may be at risk of neurogenic pulmonary edema (see page 28)
SEIZURES
If seizure is not self limited, start with lorazepam (Ativan®) 2-4 mg IV for an adult. Take precautions for status epilepticus (see page 404) and proceed to other drugs as indicated (see page 405).
6.2. Radiation safety for neurosurgeons
Radiation exposure has both a deterministic component (exposure over a certain threshold will cause a specific injury) as well as a stochastic component (any dose increases the chances of an adverse event, and the higher the cumulative dose, the higher the chances).
UNITS6
Absorbed dose: the amount of energy absorbed per unit mass. Expressed in Gray or rads.
Gray (Gy): the SI unit. 1 Gy = 100 cGy = 100 rads = an absorbed dose of 1 Joule/kg.
Rad: 1 rad = an absorbed dose of 100 ergs/gram = 0.01 joule/kg = 0.01 Gy = 1 cGy.
The biological effect (dose equivalent) of radiation: can be expressed in rem or Sieverts.
Sievert (Sv): the SI unit. The dose equivalent in sieverts is equal to the absorbed dose in grays multiplied by a “quality factor” (Q) which differs for different sources of radiation, e.g. high-energy protons have a Q of 10, x-rays have a Q of 1. 1 Sv=100 rems.
Roentgen-equivalent man (rem): the absorbed dose in rads multiplied by Q. 1 rem is estimated to cause ≈ 300 additional cases of cancer per million persons (one third of which are fatal). 1 rem = 0.01 sievert.
TYPICAL RADIATION EXPOSURE
The average annual exposure to radiation is 360 mrem (about 30 mrem are due to background cosmic radiation). A transcontinental airline flight exposure is ≈ 5 mrem.
CXR: causes about 0.01-0.04 rem of exposure to the chest.
Spine x-ray with obliques: 5 rem.
CAT scan (brain, noncontrast): median effective dose to the head = 0.2 rem, but the range varied 13 fold within and across institutions7.
Spine CT: 5 rem.
Cerebral arteriogram: ≈ 10-20 rem (including fluoroscopy)9.
Cerebral embolization: 34 rem.
Bone scan: 4 rem.
C-arm fluoroscopy8: exposure is shown in Table 6-2.
Doses during a minimally invasive TLIF10:
Patient exposure: mean 60 mGy to the skin in the AP plane (range: 8-250 mGy), 79 mGy in the lateral plane.
Surgeon exposure: 76 mrem to dominant hand, 27 mrem at the waist under a lead apron, and 32 mrem to an unprotected thyroid level detector.

OCCUPATIONAL EXPOSURE
The U.S. Nuclear Regulatory Commission (NRC) maximal recommended annual occupational dose limits for radiation are shown in Table 6-3.11. The 1990 recommendations of the International Commission on Radiological Protection (ICRP) was to keep exposure ≤ 2 rem/year averaged over 5 years12.
ALARA: an acronym for “As Low As Reasonably Achievable” by which the NRC means making every reasonable effort to keep radiation dose as far below the limits as possible consistent with the purpose for which the licensed activity is undertaken13.
Table 6-3 Annual occupational radiation dose limits
|
Target organ |
Recommended MAXIMAL dose (rem/yr) |
|
whole body |
5 |
|
lens of eye |
15 |
|
skin, hands, feet |
50 |
|
other organs (including thyroid) |
15 |
Steps to reduce occupational radiation dose (to staff) during surgery:
1. increase the distance from the radiation source: radiation exposure is proportional to the inverse square of the distance. Conventional wisdom is to try to keep 6 feet away. In a AANS publication, 3 m (10 ft) was recommended14
 Lead aprons/shields may or may not work. Distance ALWAYS works19 (inverse square law - double the distance and get 1/4 the radiation!).
2. use shielding: shielding is less effective at higher kV (used with larger patients). Portable lead “doors” are more effective than aprons. Wrap-around 2-piece aprons are better than front side aprons. Non-lead aprons may not provide the rated protection at levels > 100 keV15
3. don’t overuse magnification: most fluoro systems increase the radiation emitted x ≈ 4 to compensate for the associated reduction in image brightness
4. “boost” mode can double the radiation output. Use should be kept to a minimum
5. use live fluoro only when absolutely necessary
6. for lateral imaging, stand on the “downstream” (image intensifier (ImI)) side of the C-arm: scatter is the most significant cause of exposure here and is higher on the source side16 (this asymmetry is not as significant for C-spine17)
7. keep the ImI as close to the patient as possible (reduces patient & staff exposure)
8. on AP images (with the patient prone or supine): position the x-ray tube under the table with the ImI over the patient (lowers scatter exposure to staff)18
9. collimate the beam as much as possible: reduces radiation to patient and to staff, and results in less image degradation
10. keep hands, arms, etc. out of the primary beam at all times (consider using leaded gloves if hands need to be within the beam or nearby for an extended time)
11. minimize number of images: plan your shot, avoid frequent “checks” or peeks
12. use image guided navigation when possible and practical
13. leaded glasses are recommended only for personnel with very high fluoro times: cataracts can be induced by single doses of 200 rads (very high), cumulative doses of 750 rads have not been associated with cataracts
6.3. CAT scan or CT scan
Attenuation of the x-ray beam on a CT scan is defined in Hounsfield units. These units are not absolute, and vary between CT scanner models. Some sample values are shown in Table 6-4.
If there are no calibration marks on a scan, one can estimate the average adult globe (eyeball) is 25 mm in diameter (through its equator).
Table 6-4 Hounsfield units for a sample CT scanner
|
DEFINITIONS |
Hounsfield units |
Comment |
|
no attenuation (air) |
–1000 |
definition |
|
water |
0 |
definition |
|
dense bone |
+1000 |
definition |
|
CRANIAL CT |
||
|
brain (grey matter) |
30 to 40 |
|
|
brain (white matter) |
20 to 35 |
|
|
cerebral edema |
10 to 14 |
|
|
CSF |
+5 |
|
|
bone |
+600 |
|
|
blood clot* |
75 to 80 |
acute SDH or EDH, fresh SAH |
|
fat |
–35 to –40 |
|
|
calcium |
100 to 300 |
|
|
enhanced vessels |
90-100 |
|
|
SPINE CT |
||
|
disc material |
55-70 |
disc density is ≈ 2 x thecal sac |
|
thecal sac |
20-30 |
|
* Hct < 23% will cause an acute SDH to be isodense with brain
Differential diagnosis of an intracranial hyperdense (with respect to brain) structure on non-contrast CT:
1. acute blood
2. calcium
3. vessels with low flow
4. melanoma: may be slightly hyperdense to brain due to melanin
Contrast enhanced CT scan (CECT)
Used primarily for imaging neoplasms or vascular malformations.
Typical IV dose of contrast: 60-65 ml of e.g. Isovue 300® (see page 123) which delivers 18-19.5 grams of iodine.
6.3.1. CT angiography (CTA)
Employs rapid injection of iodinated contrast at 3-4 cc/sec, typically 65-75 ml of e.g. Isovue 300®.
Accuracy is diminished for vessels that are perpendicular to the axial CT plane. Also in the vicinity of dense clot, CTA has trouble resolving the adjacent vessels.
6.3.2. CT perfusion (CTP)
Requires use of iodinated contrast. Areas of interest are selected from an unenhanced CT scan in the 3 supratentorial vascular territories. Contrast is given at a standard rate (e.g. 40 ml IV at 5 ml/sec). Scans through the regions of interest are repeated at intervals, e.g. every 2 seconds for 1 minute.
Acetazolamide (ACZ) (Diamox®) challenge: after the above, a bolus of 1000 mg of IV ACZ is given, and scans are repeated at intervals for approximately 10 minutes, with a final scan usually at 15 minutes. Parameters then calculated from the images: cerebral blood volume (CBV), CBF, meant transit times (MTT), and time to peak (TTP).
Abnormalities that can be demonstrated (also, see page 1011):
1. flow significant stenosis: decreased CBV & CBF, increased MTT and TTP
2. steal: after ACZ challenge (see above), CBV & CBF decrease, often with increases in the corresponding contralateral territory; MTT increases
In comparison to perfusion weighted MRI (PWI) (see page 132):
1. PWI acquires multiple slices of the whole brain over and over. CTP is limited to a given slice or several slices (usually 10-20 mm thick), and one has to choose where to place that slice
2. PWI has more artifact than CTP
6.4. Magnetic resonance imaging (MRI)
6.4.1. General information
DEFINITIONS20
Abbreviations
|
TR |
time to repetition |
|
TE |
time to echo |
|
TI |
time to inversion |
|
T1 |
spin-lattice relaxation time (“time to magnetize”) (regrowth) |
|
T2 |
spin-spin relaxation time (“time to demagnetize”) (decay) |
Table 6-5 Range of acquisition data
|
short TE (te < 50) |
long TE (te > 80) |
|
|
short TR (TR < 1000) |
T1WI |
|
|
long TR (TR > 2000) |
proton density or spin density |
T2WI |
T1 weighted image (T1WI)
Short T1 → high signal (bright). “Anatomic image”, somewhat resembles CT. Shorter acquisition time than T2WI. Proton rich tissue (e.g. H2O) has long T1.
Clues to recognizing T1WI: CSF is black, subcutaneous fat is white, TR and TE are short (hundreds and double digits, respectively).

 The only objects that appear white on T1WI are: fat, melanin, Onyx® (see page 1102), and subacute blood (> 48 hrs old). White matter is higher signal than grey matter (myelin has a high fat content). Most pathology is low signal on T1WI.
T2 weighted image (T2WI)
Long T2 → high signal (bright). “Pathological image”. Most pathology shows up as high signal, including surrounding edema.
Clues to recognizing T2WI: CSF is white, TR & TE are long (thousands and hundreds, respectively).

Differentiating blood and fat: both fat and 7-14 day-old blood (see Table 32-4, page 1125) are high signal on T1WI. On T2WI blood remains high signal but fat “drops out” and becomes black.
Spin density image
AKA balanced image, AKA proton density image. Partway between T1WI and T2WI. CSF = grey, approximately isodense with brain (useful in white matter demyelinating disease).
FLAIR
Acronym: FLuid-Attenuated Inversion Recovery. Long TR and TE. Resembles a T2WI except the CSF is nulled out (appears dark). The grey/white intensity pattern is reversed from T1WI and is more prominent. Most abnormalities including MS plaques, other white matter lesions, tumors, edema, encephalomalacia, gliosis and acute infarcts appear bright. Periventricular lesions such as MS plaques become more conspicuous. Also good for demonstrating abnormalities in CSF.
Differential diagnosis of increased signal in subarachnoid spaces on FLAIR:
1. subarachnoid hemorrhage (SAH):  the best sequence for detecting SAH on MRI
2. meningitis: occurs in some cases
3. meningeal carcinomatosis
4. superior sagittal sinus thrombosis
5. stroke
6. adjacent tumor: ? if related to higher protein
7. previous administration of gadolinium
8. high levels of FIO2 especially at levels nearing 100% as may be used in patients getting MRI under general anesthesia21. Shows up in basal cisterns and in sulci over the convexity, but not in ventricles
Echo train (AKA fast spin echo (FSE))
tr is held constant, te is progressively increased utilizing multiple echoes (8-16) rather than 1. Image approaches T2WI but with substantially reduced acquisition time (fat is brighter on FSE, which may be rectified by fat suppression techniques).
Gradient echo
AKA T2* (called T2-star), and some manufacturers have trademarked names for this, e.g. “GRASS” (a GE trademarked acronym for Gradient Recalled Acquisition in a Steady State) or FISP. A “fast” T2WI utilizing a partial flip angle. CSF and flowing vessels appear white. Bone, calcium and heavy metals are dark. Typical acquisition data: TR = 22, TE = 11, angle 8°. Used e.g. in cervical spine to produce a “myelographic” image, improves MRI’s ability to delineate bony spurs. Also shows small old cerebral hemorrhages (seen in 60% of patients presenting with hemorrhagic infarction, and in 18% with ischemic infarcts22); these patients may be at increased risk of hemorrhage from anticoagulation. Gradient-echo T2WI MRI is the most sensitive test for blood (which appears dark) due to high sensitivity to paramagnetic artifact.
“STIR” image
Acronym for “Short Tau Inversion Recovery”. Summates T1 & T2 signals. Causes fat to drop out - sometimes also called fat suppression or “fat sat” (for fat saturation), allows gadolinium enhancement to show up better in areas of fat. Useful primarily in spine and orbit. Very good for showing bone edema (can help in dating spine fractures). The dorsal root ganglion may enhance on fat suppression images.
MRI contrast
Current agents are mostly based on gadolinium (a rare earth metal which is para-magnetic in solutions) include: gadopentatate dimeglumine (Magnevist®), gadodiamide (Omniscan®), gadoversetamide (OptiMARK®), gadobenate dimeglumine (MultiHance®) and gadoteridol (ProHance®). Adverse reactions:
1. anaphylactic reactions: rare (prevalence: 0.03-0.1%)
2. nephrotoxicity: incidence is lower than with iodinated agents used with CT
3. nephrogenic systemic fibrosis (NSF): a rare, but serious illness characterized by fibrosis of skin, joints and other organs, which is associated with certain gadolinium containing agents given to patients with severe renal failure (most were on dialysis). ✖ Gadolinium is now relatively contraindicated with a GFR of 30-60 ml/min, and is contraindicated with GFR < 3023. Safest agents: Dotarem, Gadovist and ProHance24. Contrast agents with a linear structure appear to be associated with a higher risk of NSF and include: Omniscan, Multihance, Magnevist and OptiMARK. In patients with end-stage renal disease, the risk is ≈ 2.4% per gadolinium study25
4. gadolinium allergy: use the same allergy prep as for iodine allergy (see page 124)
5. for issues related to pregnancy, see below
CONTRAINDICATIONS TO MRI
An extensive reference26 details safety issues. Web sites for MRI safety include: www.MRIsafety.com and www.IMRSER.org. Some issues that come up frequently in neurosurgical patients follows.
Pregnancy and MRI: During the first trimester, MRI can cause reabsorption of products of conception (miscarriage). There are no studies to determine the long term effects of MRI on a fetus after the first trimester (the low risk of MRI in this situation is probably preferable to the known dangers of ionizing radiation of x-rays (including CT)27). Gadolinium contrast is contraindicated during all of pregnancy, and is not approved for use in age < 2 years. Breast-feeding must be interrupted for 2 days after administration of gadolinium to the mother.
Contraindications to MRI:
1. cardiac pacemakers/defribrillator, implanted neurostimulators, cochlear implants, infusion pumps: may cause temporary or permanent malfunction
2. ferromagnetic aneurysm clips (see below): some centers exclude all patients with any type of aneurysm clip
3. metallic implants or foreign bodies with large component of iron or cobalt (may move in field, or may heat up)
4. Swann-Ganz catheter (pulmonary artery catheter)
5. metallic fragments within the eye
6. placement of a vascular stent, coil or filter within the past 6 weeks
7. shrapnel: BB’s (some bullets are OK)
8. relative contraindications:
A. claustrophobic patients: may be able to sedate adequately to perform study
B. critically ill patients: ability to monitor and access to patient are impaired. Specially designed non-magnetic ventilator may be required. Cannot use most brands of electronic IV pumps/regulators
C. obese patients: may not physically fit into many closed bore MRI scanners. Open bore scanners may circumvent this but many utilize lower field strength magnets and produce inferior quality images in large patients
D. non-MRI compatible metal implants in the region of interest (or previous surgery with high speed drills which may leave metal filings): may produce susceptibility artifact which can distort the image in that area
E. programmable shunt valve: (see page 317) most will tolerate up to a 3 T MRI without permanent damage, however, the pressure setting may be altered and therefore should be rechecked after having an MRI for any reason
ANEURYSM CLIPS AND MRI
MRI considerations in patients with a cerebral aneurysm clip:
1. the danger of the MRI magnetic field causing the aneurysm clip to be pulled or torqued off of the aneurysm or to tear the neck
2. the artifact produced by the metal of the clip in the magnetic field
3. heat generated in the region of the clip: not clinically significant

The more ferromagnetic the clip, the larger the force exerted on it by the magnetic field and the greater the image distortion near the clip.
Stainless steel (SS) is classified as martensitic (ferromagnetic) or austenitic (non-ferromagnetic). Cobalt-based superalloys are non-ferromagnetic and include Elgiloy (Sugita clips), Phynox (Yasargil), and Vari-Angle (McFadden).
Table 6-6 shows the magnetic remnance of various clips which is related to their ferromagnetic properties. If in doubt at the time of aneurysm surgery, apply the following simple test: non-ferromagnetic clips cannot be lifted or dragged with a small magnet.
HEMORRHAGE ON MRI
Because its signal characteristics change with time (and location), blood is one of the most complex entities to interpret on MRI. A mnemonic for the changes in appearance of blood on MRI with time is shown in Table 6-7. For intracerebral hemorrhage, see page 1125. Blood, hemosiderin and calcium are dark on GRASS images. FLAIR is the best sequence for detecting SAH on MRI (see page 129).
Table 6-7 Signal characteristics of blood on MRI with time*
|
Time |
T1WI |
T2WI |
|
Mnemonic |
Acronym: “George Washington Bridge” |
The layers of an Oreo® cookie |
|
Acute |
G (gray) |
B (black) |
|
Subacute |
W (white) |
W (white) |
|
Chronic |
B (black) |
B (black) |
* note: on T2WI blood is bright only in the sub-acute phase, and in the chronic phase it is dark on both T1WI & T2WI
6.4.2. Magnetic resonance angiography (MRA)
May be done with contrast (gadolinium, usually for extracranial vessels) or, without (usually for intracranial vessels, using flow related enhancement techniques (most commonly, 2D time of flight (2D TOF))). Anything that appears bright on T1WI will also show up on MRA, but doesn’t necessarily represent blood flow. This includes fat and fat-laden macrophages in an area of old CVA. Using fat-sat T1WI can mitigate this. Has some utility in screening for aneurysms (see page 1038), and for angiographically occult vascular malformations (see page 1105). High-flow AVMs are hard to resolve because arterialized veins can appear similar to arteries.
6.4.3. Diffusion-weighted imaging (DWI) and perfusion-imaging (PWI)
DIFFUSION-WEIGHTED IMAGING
Primary uses: early detection of ischemia and differentiating active MS plaques from old ones. DWI is sensitive to random Brownian motion of water molecules. Two images are generated, an apparent diffusion coefficient (ADC) map (based on a number of variables (time, slice orientation…)), and a trace image (the actual DWI)29. Freely diffusing water (e.g. in CSF) appears dark on DWI. Parenchymal areas of bright signal on DWI may denote regions of restricted diffusion (abnormal).
The DWI is based on a T2WI, and anything that is bright on T2WI can also be bright on DWI (“shine-through”). Problem: bright areas on DWI can represent either restricted diffusion or T2 “shine-through”.  check the ADC map: if the lesion is black, then this likely represents true restricted diffusion (recent infarct is the most common etiology).
Differential diagnosis of areas of increased signal (bright) on DWI:
1. ischemic brain: acute stroke and areas with hypoperfusion (penumbra). While restricted diffusion usually indicates irreversible cell injury (death), it can some-times indicate tissue that is just near cell death (penumbra). Acute brain ischemia can light up within minutes29, 30. The DWI abnormality will persist for ≈ 1 month. The ADC map usually normalizes after ≈ 1 week
2. cerebral abscess: DWI = bright, ADC = dark (see page 352)
3. active MS plaque (old plaques will not be bright)
4. some tumors: most tumors are dark on DWI, but highly cellular tumors (e.g. some meningiomas…) may have decreased diffusion (bright on DWI)
Other possible uses of DWI:
TIAs: some, but not all31, are associated with DWI abnormalities. However, factors other than focal ischemia (e.g. global ischemia, hypoglycemia, status epilepticus…) can produce ADC decline and the DWI images must therefore be interpreted in relation to the clinical setting29.
DWI may also be able to distinguish cytotoxic from vasogenic edema32, 33 (see page 109
PERFUSION-WEIGHTED MRI
Provides information related to the perfusion status of the microcirculation. PWI is the most sensitive study for ischemia of the brain (more sensitive than DWI) (FLAIR shows infarcted tissue). There are several methods currently in use; the bolus-contrast approach is the most widely employed29. Ultrafast gradient imaging is used to follow the gradual reduction to normal following administration of contrast (usually gadolinium). A signal wash-out curve is derived and is compared to contrast in an artery. In practical terms, PWI is not widely used because of technical challenges. Time-to-peak and mean-transit-time are 2 common parameters that are displayed (higher signal = longer times beyond normal).
DWI & PWI MISMATCH
DWI and PWI may be combined to locate areas of diffusion-perfusion mismatch (deficit on PWI that exceeds the zone of diffusion deficit on DWI), thus identifying salvageable brain tissue at risk of infarction (“penumbra”, see page 1062) e.g. to screen for potential candidates for thrombolytic therapy34.
6.4.4. Magnetic resonance spectroscopy (MRS)
This section specifically covers proton (H+) MRS which can be performed on almost any MRI scanner (especially units ≥ 1.5 T) with the appropriate software. Spectroscopy of other nuclei (e.g. phosphorous) can be evaluated only with specialized equipment.
Table 6-8 Important peaks on proton MRS
|
Moiety |
Resonance(ppm) |
Description |
|
lipid |
0.5-1.5 |
slightly overlaps lactate peak at TE ≈ 35 |
|
lactate |
1.3 |
a couplet peak. Not present in normal brain. End product of anaerobic glycolysis, |
|
N-acetyl aspartate (NAA) |
2 |
a neuronal marker. Normally the tallest peak (higher than Cr or Cho). ↓ in ≈ all focal and regional brain abnormalities (CVA, tumor, MS, epilepsy, Alzheimer’s disease, abscess, brain injury…) |
|
creatine (Cr) |
3* |
useful primarily as a reference for choline. Higher in grey matter than white matter |
|
choline (Cho) |
3.2 |
marker of membrane synthesis. ↑ in neoplasms and some rare conditions of increased cell growth & in the developing brain. |
* Cr has another less important peak
SINGLE VOXEL MRS
A small area is selected on the “scout” MRI and the spectroscopic peaks for that region are displayed in resonance as a function of parts-permillion (ppm). Since only small regions are selected, may be subject to “sampling” error.
Clinically important characteristic peaks are delineated in Table 6-8.
ILLUSTRATIVE PATTERNS
Normal brain: See Figure 6-1.
Tumor: See Figure 6-1. ↓ NAA, ↑ lactate, ↑ lipid, ↑ choline (rule of thumb: with gliomas, the higher the choline, the higher the grade up to grade 3, thereafter necrosis reduces relative choline levels and the lipid peak may be utilized).
CVA: ↑ lactate peak predominates. Choline is characteristically low.
Abscess35: Reduced NAA, Cr & choline peaks, and “atypical peaks” (succinate, acetate…) from bacterial synthesis is pathognomonic for abscess (not always present). Lactate may be elevated.
Multiple sclerosis: Bland pattern. NAA slightly reduced. Lactate and lipid slightly elevated. Choline not elevated.
POSSIBLE USES OF MRS
1. differentiating abscess from neoplasm
2. post-op enhancement vs. recurrence of tumor
3. distinguishing tumor from MS plaques: occasionally cannot be differentiated
4. in AIDS: may be able to help differentiate toxoplasmosis from lymphoma from PML (PML: ↓ NAA, no significant increase in choline, lactate or lipid)
5. the promise of differentiating tumor infiltration from edema has not materialized
6. some utility in distinguishing tumor from radiation necrosis (see page 771)
7. large inositol peak may distinguish hemangiopericytoma from meningioma36)
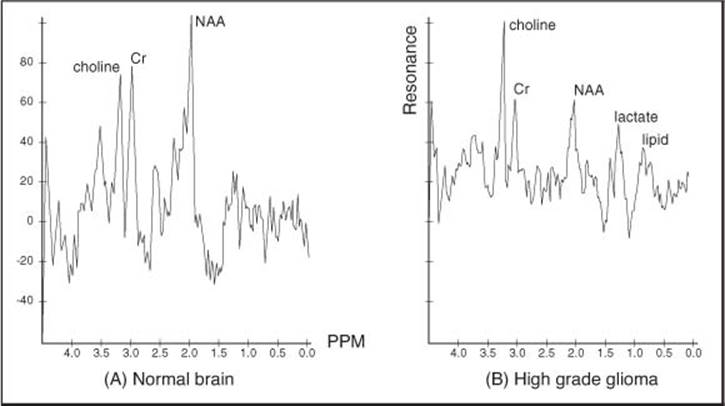
Figure 6-1 Proton MRS of (A) normal brain, and (B) high grade glioma
MULTI-VOXEL MRS
Color coded scan with selected overlay for NAA, choline… one at a time. May reduce risk of sampling error.
6.4.5. Diffusion tensor tractography MRI (DTT)
An MRI technique that demonstrates white matter tracts by exploiting the difference in diffusion parallel to the tracts from diffusion perpendicular to their course.
Available only with specialized software for specific MRI scanners.
Contraindications are same as for MRI in general (see page 130).
Probably most useful to permit a surgeon to avoid critical white matter tracts during intraparenchymal brain surgery, especially when a lesion (e.g. tumor, AVM…) may displace these tracts from their expected position.
6.5. Angiography (cerebral)
Risks
Risk varies with the nature of the pathology being investigated and with the experience of the angiography team. Overall risk of a complication resulting in a permanent neurologic deficit37, 38: 0.1%. In ACAS, there was a 1.2% complication rate (see page 1149).
General information39
In general: non-vascular deep lesions cause changes in venous structures, superficial lesions affect arterial structures. The classic feature of a malignant neoplasm (e.g. glioblastoma) on angiography is an early draining vein. Meningiomas “come early, stay late” (appears early in arterial phase, blush persists beyond venous phase) - see page 617 for other angiographic findings with meningiomas.
Allcock test: evaluates flow through the posterior communicating arteries by vertebral injection with simultaneous common carotid artery compression in the neck.
To help find the middle meningeal artery on lateral ECA angio, follow the anterior sweep of the sphenoid air sinus.
Intraoperative angiography
Typically used in aneurysm surgery to confirm exclusion of the aneurysm from the circulation and to verify patency of critical adjacent vessels, and during AVM surgery to confirm total elimination of the nidus.
1. using traditional iodinated contrast and fluoroscopy. Requires use of radiolucent headholder. Typically the introducer sheath is placed in the femoral artery at the time of initial pre-op angio, and is left in place for intraoperative use
2. indocyanine green (ICG)40, 41: can be visualized under normal light, or sometimes to better advantage when illuminated with near-infrared light. Use is restricted to surface vessels. May be less reliable with giant or wide-neck aneurysms or with thick-walled atherosclerotic vessels42. Also used intraoperatively with some spinal AVMs
6.6. Plain films
6.6.1. C-Spine
NORMAL FINDINGS
For radiographic signs of cervical spine trauma, see Table 28-7, page 939, and for guidelines for diagnosing clinical instability, see Table 28-30, page 970.
CONTOUR LINES

Figure 6-2 Spinal contour lines and lines used to diagnose basilar invagination Lateral view through craniocervical junction. *For a discussion of the basilar lines, see page 139
On a lateral C-spine x-ray, there are 4 contour lines (AKA arcuate lines). Normally each should form a smooth, gentle curve (see Figure 6-2):
1. posterior marginal line (PML): along posterior cortical surfaces of vertebral bodies (VB). Marks the anterior margin of spinal canal
2. anterior marginal line (AML): along anterior cortical surfaces of VBs
3. spinolaminar line (SLL): along base of spinous processes. The posterior margin of the spinal canal
4. posterior spinous line (PSL): along tips of spinous processes
RELATION OF ATLAS TO OCCIPUT
See page 952 for criteria for atlantooccipital dislocation (AOD).
RELATION OF ATLAS TO AXIS
These measurements are useful for atlantoaxial subluxation/dislocation e.g. in trauma (see page 957) or rheumatoid arthritis (see page 495).
Rule of Spence
On AP or open-mouth odontoid x-ray, if the sum total overhang of both C1 lateral masses on C2 is ≥ 7 mm (x + y in Figure 6-7), the transverse atlantal (TAL) ligament is probably disrupted43, 44 (when corrected for an 18% magnification factor, it has been suggested that the criteria be increased to ≥ 8.2 mm45)
(Anterior) atlantodental interval (ADI)A
AKA predental space. The distance between the anterior margin of the dens and the closest point of the anterior arch of C1 (“C1 button”) on a lateral C-spine x-ray (see Figure 6-3). The normal maximal ADI is variously given in the range of 2 to 4 mm46, 47. Commonly accepted upper limits are shown in Table 6-9. An abnormally increased ADI is a surrogate marker for TAL disruption48
A. the term ADI usually refers to the anterior atlantodental interval (there is also a posterior ADI (see page 495) and a lateral ADI which can be seen on AP radiographs)
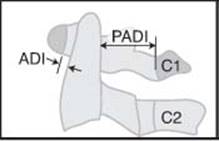
Figure 6-3 The atlantodental interval (ADI) and posterior atlantodental interval (PADI) on a lateral C-spine x-ray
Table 6-9 Normal ADI
|
Patient |
ADI |
|
adults |
|
|
males |
≤ 3 mm |
|
females |
≤ 2.5 mm |
|
pediatrics49 (≤ 15 yrs) |
≤ 4 mm |
Posterior atlantodental interval (PADI)
AKA the neural canal width (NCW)50. The PADI is the AP diameter of the bony canal and is measured from the back of the odontoid to the anterior aspect of the posterior C1 ring (see Figure 6-3). It is more useful than the ADI for some conditions (e.g. AAS in rheumatoid arthritis (see page 495) or Down syndrome (see page 498)).
CANAL DIAMETER
Normal canal diameter on lateral C-spine x-ray (from spinolaminar line (SLL) to posterior vertebral body with 6 foot tube to film distance)51: 17 ± 5 mm. In the presence of osteophytic spurs, measure from the back of the spur to the SLL.
Cervical spinal stenosis: various cutoffs for the normal minimum AP diameter have been suggested52. On a plain lateral C-spine x-ray this is usually measured from the posterior vertebral body (or the posterior aspect of an osteophyte) to the spinolaminar line. Some use 15 mm. Most agree that stenosis is present when the AP diameter is < 12 mm in an adult (see page 489 for correlation with myelopathy).
PREVERTEBRAL SOFT TISSUE
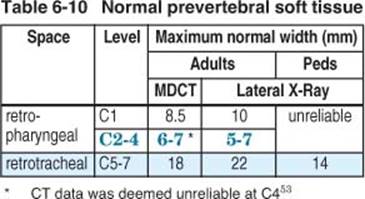
Abnormally increased prevertebral soft tissue (PVST) may indicate the presence of a vertebral fracture, dislocation, or ligamentous disruption54. Normal values for lateral C-spine x-ray and CT scan are shown in Table 6-10. Plain films are subject to errors due to magnification and rotation. Multi-detector CT (MDCT) eliminates these shortcomings53.
Increased PVST is more likely with anterior than posterior injuries55. NB: the sensitivity of these measurements is only ≈ 60% at C3 and 5% at C654. False positives may occur with basal skull/facial fractures, especially with fracture of the pterygoid plates.
An ET-tube may allow fluid to accumulate in the posterior oropharynx which can obscure this measurement. In this setting, one can look for a thin fat layer between the prevertebral muscles and the posterior pharynx on cervical CT; the prevertebral tissue (posterior to this line) will be thickened (no measurements available at this time). MRI can also demonstrate abnormal signal within the prevertebral tissue.
INTERSPINOUS DISTANCES
C-spine AP: a fracture/dislocation or ligament disruption may be diagnosed if the interspinous distance is 1.5 times that at both adjacent levels (measured from center of spinous precesses)56. Also look for a malalignment of spinous processes below a certain level which may be evidence of rotation due to a unilaterally locked facet.
C-spine lateral: look for “fanning” or “flaring” which is an abnormal spread of one pair of spinous processes that may also indicate ligament disruption.
PEDIATRIC C-SPINE
C1 (ATLAS)
Ossification centers57: usually 3 (see Figure 6-4)
1. 1 (sometimes 2) for body (not ossified at birth; appears on x-ray during 1st yr)
2. 1 for each neural arch (appear bilaterally ≈ 7th fetal week)
Synchondroses57:
• synchondrosis of the spinous process: fuses by ≈ 3 yrs age
• 2 neurocentral synchondroses: fuse by ≈ age 7 yrs
Up to 5% of adults have incomplete closure of ossification centers of C1, most commonly posteriorly. The rare anterior defect is usually associated with a posterior defect.
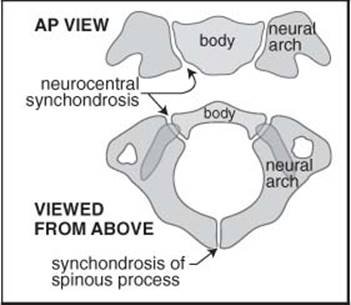
Figure 6-4 Pediatric C1 (atlas)
C2 (AXIS)
4 primary ossification centers (see Figure 6-5):
• odontoid process
• vertebral body
• 2 neural arches
Synchondroses: normally fuse between 3-6 years of age.
A secondary ossification center appears at the summit of the dens between 3-6 yrs, and fuses with dens by age 1257.
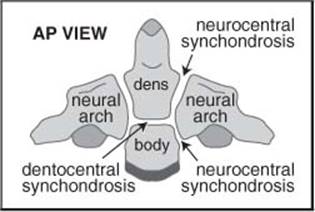
Figure 6-5 Pediatric C2 (axis)
C3-7
Cervical bodies are normally wedge shaped in pediatric population (narrower anteriorly). Wedging decreases with age.
6.6.2. Lumbosacral (LS) spine
L4-5 is normally the lumbar disc space with the greatest vertical height. Also see Normal LS spine measurements, page 480.
AP view: look for defect or non visualization of the “owl’s eyes” which is due to pedicle erosion which may occur with lytic tumors (common with metastatic disease).
Oblique views: look for discontinuity in neck of “Scotty dog” for defect in pars inter-articularis.
Butterfly vertebra: An uncommon congenital anomaly thought to arise from failure of fusion of the lateral halves of the VB due to persistent notochord tissue, producing a “butterfly” appearance on AP x-rays or coronal CT scan reconstructions. The involved VB is widened, and adjacent vertebrae may show a compensatory deformity as if to fill in some of the gap. May be associated with other spinal and rib malformations58. On lateral views may simulate compression fracture. In severe cases, there may be significant kyphosis and/or scoliosis. Often asymptomatic, requiring no treatment. May be associated with lipomyelomeningocele (see page 251).
6.6.3. Skull films
Water’s view: x-ray tube angled up 45° (perpendicular to clivus), AKA submental vertex view. Towne’s view: x-ray tube angled down 45°, to view occiput.
SELLA TURCICA
NORMAL ADULT DIMENSIONS ON SKULL X-RAY
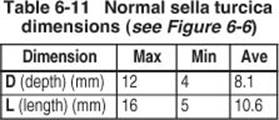
Technique: true lateral, 91 cm target to film distance, central ray 2.5 cm anterior and 1.9 cm superior to EAM. Table 6-11 shows normal values (Figure 6-6 shows how measurements are made).
Depth (D): defined as the greatest measurement from floor to diaphragma sellae.
Length (L): defined as the greatest AP diameter.
ABNORMAL FINDINGS
Pituitary adenomas tend to enlarge the sella, in contrast to craniopharyngiomas which erode the posterior clinoids. Empty sella syndrome tends to balloon the sella symmetrically, and also does not erode the clinoids. Tuberculum meningiomas usually do not enlarge the sella, and may be associated with enlargement of the sphenoid sinus (sphenoid pneumosinus dilatans - see page 1216).
“J” shaped sella suggests optic nerve glioma. It can also occur congenitally in Hurler syndrome (a mucopolysaccharidosis).

Figure 6-6 Measurements of the sella turcica (lateral view)
BASILAR INVAGINATION & BASILAR IMPRESSION (BI)
Terminology
The terms basilar impression and basilar invagination are often used interchangeably in the literature, and making a distinction seems pointlessA (the abbreviation (BI) will be used for either). Common feature: upward displacement of the upper cervical spine (including odontoid process, AKA cranial migration of the odontoid) through the foramen magnum into the p-fossa.
A. historically, basilar invagination (AKA cranial settling) denoted upward indentation of skull base usually due to acquired softening of bone (see below), often associated with atlanto-occipital fusion, while basilar impression implied normal bone
Platybasia: flattening of the skull base. Originally assessed on plain x-rays (which are subject to error due to skull rotation or difficulty identifying landmarks), now more commonly evaluated on CT or MRI. May or may not be associated with BI, and may occur in association with craniofacial abnormalities, Chiari malformation, Paget’s disease…
Quantitated by measuring the basal angle, which on plain x-rays, measured the angle between lines drawn from the nasion to center of sella and then to the anterior foramen magnum59, but on MRI was felt to be better represented by the angle between a line drawn along the floor of the anterior fossa to the dorsum sellae and a second line drawn along the posterior clivus60. Normal mean basal angle: 130°. Platybasia: > 145° (abnormally obtuse basal angle).
Measurements used in BI
(refer to Figure 6-2, page 135, and Figure 6-7 below):
1. McRae’s line (“McR” in Figure 6-2): drawn across foramen magnum (tip of clivus (basion) to opisthion)61. No part of odontoid should be above this line (the most accurate for BI). On CT62 and MRI63 the normal odontoid tip is 5 mm (± 1.8 mm) above the line
2. Chamberlain’s line (“CL” in Figure 6-2)64: posterior hard palate to posterior margin of foramen magnum (opisthion). Less than 3 mm or half of dens should be above this line, with 6 mm being definitely pathologic. Seldom used because opisthion is often hard to see on plain film and may also be invaginated. On CT62 and MRI63 the normal odontoid tip is 1.4 mm (± 2.4) below the line
3. McGregor’s baseline (“McG” in Figure 6-2)65: posterior margin of hard palate to most caudal point of occiput. No more than 4.5 mm of dens should be above this. On CT62 and MRI63 the normal odontoid tip is 0.8 mm (± 2.4) above the line
4. Wackenheim’s clivus-canal line (“WCCL” in Figure 6-2): the odontoid should be tangential to or below the line that extends the course of the clivus (the clivus baseline). If the clivus is concave or convex, this baseline is drawn to connect the basion to the base of the posterior clinoids on the clivus66
5. (Fischgold’s) digastric line (“FDGL” in Figure 6-7): joins digastric notches. The normal distance from this line to the middle of the atlanto-occipital joint is 10 mm (decreased in BI)67. No part of odontoid should be above this line. More accurate than the bimastoid line (FBML)
6. Fischgold’s bimastoid line (“FBML” in Figure 6-7): joins tips of mastoid processes. The odontoid tip averages 2 mm above this line (range: 3 mm below to 10 mm above) and this line should cross the atlanto-occipital joint

Figure 6-7 AP view through craniocervical junction*
* FDGL = Fischgold’s digastric line, FBML = Fischgold’s bimastoid line, x + y = total overhang of C1 on C2 (see Rule of Spence page 957)
Conditions associated with BI
1. congenital conditions (BI is the most common congenital anomaly of the craniocervical junction, it is often accompanied by other anomalies68 (p 148-9))
A. Down syndrome
B. Klippel-Feil syndrome: see page 253
C. Chiari malformation: see page 233 (in a series of 100 patients, 92 had BI69)
D. syringomyelia
2. acquired conditions
A. rheumatoid arthritis (in part due do incompetence of transverse ligament, see Basilar impression in rheumatoid arthritis, page 497)
B. post-traumatic
3. conditions with BI associated with softening of bone include70:
A. Paget’s disease
B. osteogenesis imperfecta
C. osteomalacia
D. rickets
E. hyperparathyroidism
Two subtypes of BI71
Type I: BI without Chiari malformation. Tip of odontoid tends to be above CL, McR, and WCCL in Figure 6-7. Brainstem compression is due to odontoid process invagination. 85% can be reduced with traction. Transoral surgery is recommended, usually accompanied by posterior fusion
Type II: BI + Chiari malformation. Odontoid tip tends to be above CL, but not McR or WCCL. Brainstem compression is due to reduced p-fossa volume. Only 15% can be reduced with traction. Foramen magnum decompression is appropriate
6.7. Myelography
Contraindications:
1. anticoagulation
2. allergy to iodinated contrast: requires iodine allergy prep (see page 124). NB: risk of adverse reaction still persists
Lumbar myelogram
Using iohexol (Omnipaque® 140 or 180) as shown in Table 6-1.
Cervical myelogram with water soluble contrast via LP
Use iohexol (Omnipaque® 300 or 240) as shown in Table 6-1. Insert spinal needle into lumbar subarachnoid space, tilt the head of the myelogram table down with the patient’s neck extended and then inject dye. If a complete cervical block is seen, have patient flex neck. If the block cannot be traversed, patient may need C1-2 puncture or MRI (first obtain a CT which may show dye above the block that cannot be appreciated on myelography alone).
Post myelographic CT
Increases sensitivity and specificity of myelography (see page 435). In cases of complete block on myelogram, CT will often show dye distal to the apparent site of the block.
6.8. Radionuclide scanning
Three phase bone scan
Technetium-99 (99mTc) pertechnetate is a radioisotope that may be attached to various substrates for use in bone scanning. It may be used to label polyphosphate (rarely used today), diphosphonate72 (MDP), or phosphorous (HDP) (the most widely agent used currently). Accumulates in areas of osteoblastic activity.
With technetium 99m-HDP, images are obtained immediately after injection (flow phase), at 15 min (blood pooling) and in 4 hours (bone imaging). Cellulitis shows up as increased activity in the first 2 phases, and there is little or diffuse increased activity in the 3rd. Osteomyelitis causes increased uptake in all 3 phases.
Used in evaluation of acute osteomyelitis with sensitivity and specificity of ≈ 95% each, and is usually positive within 2-3 days. False positives can occur in conditions involving increased bone turnover, e.g. fracture, septic arthritis, tumors. False negative can occur in cases with associated bone infarction.
Applications for bone scans include:
1. infection
A. osteomyelitis of the spine (vertebral osteomyelitis, see page 382) or skull
B. discitis: see page 385
2. tumor
A. spine metastases: see page 746
B. primary bone tumors of the spine: see page 737
C. skull tumors: see page 698
3. diseases involving abnormal bone metabolism
A. Paget’s disease: of the skull (see page 499) or spine (see page 499)
B. hyperostosis frontalis interna: see page 701
4. craniosynostosis: see page 229
5. fractures: spine (see page 940) or skull
6. “low back problems”: to help identify some of the above conditions (see page 432)
Gallium scan
Nuclear medicine scan with 67Ga citrate which accumulates in areas of inflammation and some malignancies. Utility in neurosurgery for: sarcoidosis (see page 72), chronic vertebral osteomyelitis (for comparison to bone scan, see page 382).
6.9. References
1. Rivera E, Hardjasudarma M, Willis B K, et al.: Inadvertent use of ionic contrast material in myelography: Case report and management guidelines. Neurosurgery 36: 413-5, 1995.
2. Bohn H P, Reich L, Suljaga-Petchel K: Inadvertent intrathecal use of ionic contrast media for myelography. AJNR 13: 1515-9, 1992.
3. Lasser E C, Berry C C, Talner L B, et al.: Pretreatment with corticosteroids to alleviate reactions to intravenous contrast material. N Engl J Med 317: 825-9, 1987.
4. Allaqaband S, Tumuluri R, Malik A, et al.: Prospective randomized study of n-acetylcysteine, fenoldopam, and saline for prevention of radiocontrast-induced nerphropathy. Catheter Cardiovasc Interv 57: 279-83, 2002.
5. Marenzi G, Assanelli E, Marana I, et al.: N-acetylcysteine and contrast-induced nephropathy in primary angioplasty. N Engl J Med 354 (26): N Engl J Med: 2773-82, 2006.
6. Units of radiation dose. 327-8, 1991.
7. Smith-Bindman R, Lipson J, Marcus R, et al.: Radiation dose associated with common computed tomography examinations and the associated lifetime attributable risk of cancer. Arch Intern Med 169 (22): Arch Intern Med: 2078-86, 2009.
8. Mehlman C T, DiPasquale T G: Radiation exposure to the orthopaedic surgical team during fluoroscopy: “how far away is far enough?” J Orthop Trauma 11 (6): J Orthop Trauma: 392-8, 1997.
9. Thompson T P, Maitz A H, Kondziolka D, et al.: Radiation, radiobiology, and neurosurgery. Contemp Neurosurg 21 (13): 1-5, 1999.
10. Bindal R K, Glaze S, Ognoskie M, et al.: Surgeon and patient radiation exposure in minimally invasive transforaminal lumbar interbody fusion. J Neurosurg Spine 9 (6): J Neurosurg Spine: 570-3, 2008.
11. Occupational dose limits for adults. 330-1, 1991.
12. 1990 recommendations of the International Commission on Radiological Protection. Ann ICRP 21 (1-3): Ann ICRP, 1991.
13. Definitions. 321-7, 1991.
14. McCormick P W: Fluoroscopy: Reducing radiation exposure in the OR. In AANS neurosurgeon. AANS, Rolling Meadows, IL, 2008, Vol. 17: pp 14-6.
15. Scuderi G J, Brusovanik G V, Campbell D R, et al.: Evaluation of non-lead-based protective radiological material in spinal surgery. Spine J 6 (5): Spine J: 577-82, 2006.
16. Boone J M, Pfeiffer D E, Strauss K J, et al.: A survey of fluoroscopic exposure rates: AAPM task group no. 11 report. Med Phys 20 (3): Med Phys: 789-94, 1993.
17. Giordano B D, Baumhauer J F, Morgan T L, et al.: Cervical spine imaging using standard C-arm fluoroscopy: Patient and surgeon exposure to ionizing radiation. Spine 33 (18): Spine: 1970-6, 2008.
18. Faulkner K, Moores B M: An assessment of the radiation dose received by staff using fluoroscopic equipment. Br J Radiol 55 (652): Br J Radiol: 272-6, 1982.
19. Rechtine G R: Radiation satety for the orthopaedic surgeon: Or, C-arm friend or foe. Tampa, FL: 2009.
20. Jackson E F, Ginsberg L E, Schomer D F, et al.: A review of MRI pulse sequences and techniques in neuroimaging. Surg Neurol 47: 185-99, 1997.
21. Anzai Y, Ishikawa M, Shaw D W, et al.: Paramagnetic effect of supplemental oxygen on CSF hyperintensity on fluid-attenuated inversion recovery MR images. AJNR Am J Neuroradiol 25 (2): AJNR Am J Neuroradiol: 274-9, 2004.
22. Alemany M, Stenborg A, Terent A, et al.: Coexistence of microhemorrhages and acute spontaneous brain hemorrhage: Correlation with signs of microangiopathy and clinical data. Radiology 238: 240-7, 2006.
23. Kanal E, Barkovich A J, Bell C, et al.: ACR guidance document for safe MR practices: 2007. Am J Roentgenol 188 (6): Am J Roentgenol: 1447-74, 2007.
24. Medicines and Healthcare Products Regulatory Agency: Drug Safety Update: Drug Safety Update: 2-4, 2007.
25. Deo A, Fogel M, Cowper S: Nephrogenic systemic fibrosis: A population study examining the relationship of disease development to gadolinium exposure. Clinical Journal of the American Society of Nephrology 2 (2): Clinical Journal of the American Society of Nephrology: 264-7, 2007.
26. Shellock F G: Reference manual for magnetic resonance safety. Amirsys, Inc., Salt Lake City, Utah, 2003: pp 456.
27. Edelman R R, Warach S: Magnetic resonance imaging (first of two parts). N Engl J Med 328: 708-16, 1993.
28. Romner B, Olsson M, Ljunggren B, et al.: Magnetic resonance imaging and aneurysm clips: Magnetic properties and image artifacts. J Neurosurg 70: 426-31, 1989.
29. Fisher M, Albers G W: Applications of diffusion-perfusion magnetic resonance imaging in acute ischemic stroke. Neurology 52: 1750-6, 1999.
30. Prichard J W, Grossman R I: New reasons for early use of MRI in stroke. Neurology 52: 1733-6, 1999 (editorial).
31. Ay H, Buonanno F S, Rordorf G, et al.: Normal diffusion-weighted MRI during stroke-like deficits. Neurology 52: 1784-92, 1999.
32. Ay H, Buonanno F S, Schaefer P W, et al.: Posterior leukoencephalopathy without severe hypertension: Utility of diffusion-weighted MRI. Neurology 51: 1369-76, 1998.
33. Schaefer P W, Buonanno F S, Gonzalez R G, et al.: Diffusion-weighted imaging discriminates between cytotoxic and vasogenic edema in a patient with eclampsia. Stroke 28: 1082-5, 1997.
34. Marks M P, Tong D C, Beaulieu C, et al.: Evaluation of early reperfusion and IV tPA therapy using diffusion- and perfusion-weighted MRI. Neurology 52: 1792-8, 1999.
35. Martinez-Perez I, Moreno A, Alonso J, et al.: Diagnosis of brain abscess by magnetic resonance spectroscopy. Report of two cases. J Neurosurg 86: 708-13, 1997.
36. Barba I, Moreno A, Martinez-Perez I, et al.: Magnetic resonance spectroscipy of brain hemangiopericytomas: High myoinositol concentrations and discrimination from meningiomas. J Neurosurg 94: 55-60, 2001.
37. Dion J E, Gates P C, Fox A J, et al.: Clinical events following neuroangiography: A prospective study. Stroke 18: 997-1004, 1987.
38. Earnest F, Forbes G, Sandok B A, et al.: Complications of cerebral angiography: Prospective assessment of risk. AJR 142: 247-53, 1984.
39. Newton T H, Potts D G, (eds.): Radiology of the skull and brain. C. V. Mosby, Saint Louis, 1971.
40. Raabe A, Nakaji P, Beck J, et al.: Prospective evaluation of surgical microscope-integrated intraoperative near-infrared indocyanine green videoangiography during aneurysm surgery. J Neurosurg 103 (6): J Neurosurg: 982-9, 2005.
41. Dashti R, Laakso A, Niemela M, et al.: Microscope-integrated near-infrared indocyanine green videoangiography during surgery of intracranial aneurysms: The Helsinki experience. Surg Neurol 71 (5): Surg Neurol: 543-50; discussion 550, 2009.
42. Li J, Lan Z, He M, et al.: Assessment of microscope-integrated indocyanine green angiography during intracranial aneurysm surgery: A retrospective study of 120 patients. Neurol India 57 (4): Neurol India: 453-9, 2009.
43. Spence K F, Decker S, Sell K W: Bursting atlantal fracture associated with rupture of the transverse ligament. J Bone Joint Surg 52A: 543-9, 1970.
44. Fielding J W, Cochran G B, Lawsing J F, 3rd, et al.: Tears of the transverse ligament of the atlas. A clinical and biomechanical study. J Bone Joint Surg Am 56 (8): 1683-91, 1974.
45. Heller J G, Viroslav S, Hudson T: Jefferson fractures: The role of magnification artifact in assessing transverse ligament integrity. J Spinal Disord 6 (5): 392-6, 1993.
46. Hinck V C, Hopkins C E: Measurement of the atlanto-dental interval in the adult. Am J Roentgenol Radium Ther Nucl Med 84: 945-51, 1960.
47. Meijers K A E, van Beusekom G T, Luyendijk W, et al.: Dislocation of the cervical spine with cord compression in rheumatoid arthritis. J Bone Joint Surg 56B: 668-80, 1974.
48. Panjabi M M, Oda T, Crisco J J, 3rd, et al.: Experimental study of atlas injuries. I. Biomechanical analysis of their mechanisms and fracture patterns. Spine 16: S460-5, 1991.
49. Powers B, Miller M D, Kramer R S, et al.: Traumatic anterior atlanto-occipital dislocation. Neurosurgery 4: 12-7, 1979.
50. Brockmeyer D: Down syndrome and craniovertebral instability. Topic review and treatment recommendations. Pediatr Neurosurg 31 (2): Pediatr Neurosurg: 71-7, 1999.
51. Schmidek H H, Sweet W H, (eds.): Operative neurosurgical techniques. 1st ed., Grune and Stratton, New York, 1982.
52. Epstein N, Epstein J A, Benjamin V, et al.: Traumatic myelopathy in patients with cervical spinal stenosis without fracture or dislocation: Methods of diagnosis, management, and prognosis. Spine 5: 489-96, 1980.
53. Rojas C A, Vermess D, Bertozzi J C, et al.: Normal thickness and appearance of the prevertebral soft tissues on multidetector CT. AJNR Am J Neuroradiol 30 (1): AJNR Am J Neuroradiol: 136-41, 2009.
54. DeBenhe K, Havel C: Utility of prevertebral soft tissue measurements in identifying patients with cervical spine injury. Ann Emerg Med 24: 1119-24, 1994.
55. Miles K A, Finlay D: Is prevertebral soft tissue swelling a useful sign in injury of the cervical spine? Injury 19: 177-9, 1988.
56. Naidich J B, Naidich T P, Garfein C, et al.: The widened interspinous distance: A useful sign of anterior cervical dislocation. Radiology 123: 113-6, 1977.
57. Bailey D K: The normal cervical spine in infants and children. Radiology 59: 712-9, 1952.
58. Fischer F J, Vandemark R E: Sagittal cleft (butterfly) vertebra. J Bone Joint Surg 27: 695-8, 1945.
59. Poppel M, Jacobson H, Duff B, et al.: Basilar impression and platybasia in Paget’s disease. Br J Radiol 21: Br J Radiol: 171-81, 1953.
60. Koenigsberg R A, Vakil N, Hong T A, et al.: Evaluation of platybasia with MR imaging. AJNR Am J Neuroradiol 26 (1): AJNR Am J Neuroradiol: 89-92, 2005.
61. McRae D L: The significance of abnormalities of the cervical spine. AJR 70: 23-46, 1960.
62. Cronin C G, Lohan D G, Mhuircheartigh J N, et al.: CT evaluation of Chamberlain’s, McGregor’s, and McRae’s skull-base lines. Clin Radiol 64 (1): Clin Radiol: 64-9, 2009.
63. Cronin C G, Lohan D G, Mhuircheartigh J N, et al.: MRI evaluation and measurement of the normal odontoid peg position. Clin Radiol 62 (9): Clin Radiol: 897-903, 2007.
64. Chamberlain W E: Basilar impression (platybasia); bizarre developmental anomaly of occipital bone and upper cervical spine with striking and misleading neurologic manifestations. Yale J Biol Med 11: 487-96, 1939.
65. McGregor J: The significance of certain measurements of the skull in the diagnosis of basilar impression. Br J Radiol 21: 171-81, 1948.
66. VanGilder J C, Menezes A H, Dolan K D: Radiology of the normal craniovertebral junction. In The craniovertebral junction and its abnormalities. Futura Publishing, NY, 1987: pp 29-68.
67. Hinck V C, Hopkins C E, Savara B S: Diagnostic criteria of basilar impression. Radiology 76: 579, 1961.
68. The Cervical Spine Research Society, (ed.) The cervical spine. 1st ed., J.B. Lippincott, Philadelphia, 1983.
69. Menezes A H: Primary craniovertebral anomalies and the hindbrain herniation syndrome (Chiari I): Data base analysis. Pediatr Neurosurg 23 (5): 260-9, 1995.
70. Jacobson G, Bleeker H H: Pseudosubluxation of the axis in children. Am J Roentgenol 82: 472-81, 1959.
71. Goel A, Bhatjiwale M, Desai K: Basilar invagination: A study based on 190 surgically treated patients. J Neurosurg 88 (6): 962-8, 1998.
72. Handa J, Yamamoto I, Morita R, et al.: 99mTcpolyphosphate and 99mTc-diphosphonate bone scintigraphy in neurosurgical practice. Surg Neurol 2: 307-10, 1974.