SKULL X-RAY
With the development of more advanced imaging techniques, skull X-ray is now less often used, but may still provide useful information.

More specific views are available, but in practice have been replaced by other imaging techniques, e.g.
Base of skull (submentovertical) – cranial nerve palsies
Optic foramina – progressive blindness
Sella turcica – visual field defects
Petrous/internal auditory meatus – sensorineural deafness.
COMPUTERISED TOMOGRAPHY (CT) SCANNING
The development of this non-invasive technique in the 1970s revolutionised the investigative approach to intracranial pathology. A pencil beam of X-ray traverses the patient’s head and a diametrically opposed detector measures the extent of its absorption. Computer processing, multiple rotating beams and detectors arranged in a complete circle around the patient’s head enable determination of absorption values for multiple small blocks of tissue (voxels). Reconstruction of these areas on a two-dimensional display (pixels) provides the characteristic CT scan appearance. For routine scanning, slices are 3–5 mm wide. The latest ‘spiral’ or ‘helical’ CT scanners use a large bank of detectors (multislice) and the patient moves through the field during scanning so that the X-ray beams describe a helical path. This considerably reduces scanning time and is of particular value when slices of 1–2 mm thickness provide greater detail. These ‘high definition’ views permit coronal and sagittal reconstructions and allow detailed examination of certain areas e.g. the orbit, pituitary fossa and cerebello-pontine angle.
Selecting different window levels displays tissues of different X-ray density more clearly. Most centres routinely provide two images for each scanned level of the lumbar spine, one to demonstrate bone structures, the other to show soft tissue within and outwith the spinal canal.
An intravenous iodinated water-soluble contrast medium is administered when the plain scan reveals an abnormality or if specific clinical indications exist, e.g. suspected arteriovenous malformation, acoustic schwannoma or intracerebral abscess. Intravenous contrast shows areas with increased vascularity or with impairment of the blood– brain barrier.

Note: diagram illustrates individual slices. In the latest generation scanners, the beam describes a helical pathway around the head.
NORMAL SCAN

Spinal CT scanning
If MRI is unavailable, CT of the spine can demonstrate the bony canal, intervertebral foramen and disc protrusion. After instilling some intrathecal contrast, CT scanning clearly demonstrates lesions compressing the spinal cord or the cervico-medullary junction.

Coronal and sagittal reconstruction
CT imaging in the coronal plane is difficult and in the sagittal plane, virtually impossible. Two dimensional reconstruction of a selected plane may provide more information, but requires CT slices of narrow width e.g. 1–2 mm.

Coronal CT scanning
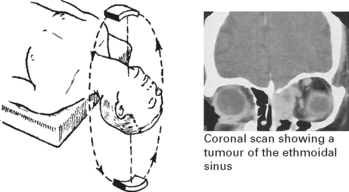
In the absence of the latest scanners and good reconstruction, full neck extension combined with maximal angulation of the CT gantry permits direct coronal scanning.
CT angiography
Helical scanning during infusion of intravenous contrast provides a non-invasive method of demonstrating intracranial vessels in 2 and 3-D format. The ability to rotate the image through 360° more clearly demonstrates vessels and any abnormalities. Many reports claim that 3-D CT angiography is as accurate as conventional angiography in detecting small aneurysms.
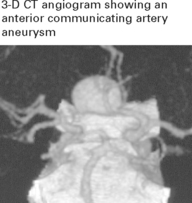
CT perfusion imaging
Following the infusion of contrast it is possible to construct brain perfusion maps. Ischaemic regions receive less contrast and appear as low density areas. This technique can be of value in predicting outcome from acute stroke.
Xenon-enhanced computed tomography (XE-CT)
Inhaled stable xenon mixed with O2 crosses the intact blood–brain barrier. CT scanning detects changes in tissue density as xenon accumulates producing quantitative maps of regional blood flow. This technique determines the degree and extent of cerebral ischaemia.
Interpretation of the cranial CT scan
Before contrast enhancement note:

After contrast enhancement:
Vessels in the circle of Willis appear in the basal slices. Look at the extent and pattern of contrast uptake in any abnormal region. Some lesions may only appear after contrast enhancement.
MAGNETIC RESONANCE IMAGING (MRI)
For many years, magnetic resonance techniques aided chemical analysis in the food and petrochemical industries. The development of large-bore homogeneous magnets and computer assisted imaging (as in CT scanning) extended its use to the mapping of hydrogen nuclei (i.e. water) densities and their effect on surrounding molecules in vivo. Since these vary from tissue to tissue, MRI can provide a detailed image of both head and body structures. The latest echo-planer MR imaging permits rapid image acquisition.
Physical basis

A variety of different radiofrequency pulse sequences (saturation recovery (SR), inversion recovery (IR) and spin echo (SE)) combined with computerised imaging produce an image of either proton density or of T1 or T2 weighting depending on the sequence employed.
Normal MRI images (T1/T2 weighting in relation to normal grey/white matter)
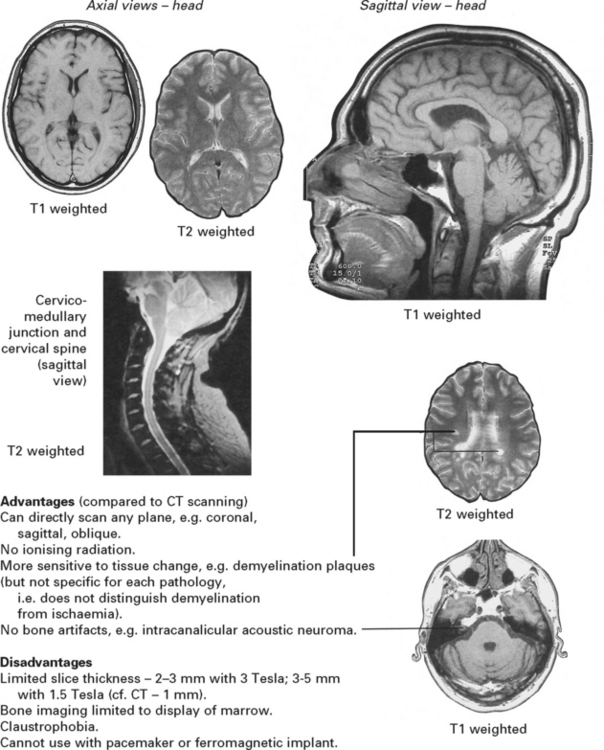
Interpretation of abnormal MRI image
Look for structural abnormalities and abnormal intensities indicating a change in tissue T1 or T2 weighting in relation to normal grey and white matter. (A prolonged T1 relaxation time gives hypointensity, i.e. more black; a prolonged T2 relaxation time gives hyperintensity, i.e. more white).
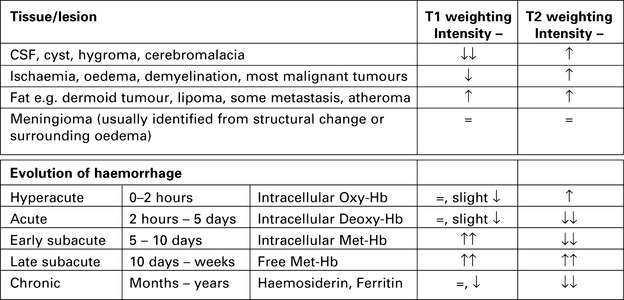
Paramagnetic enhancement
Some substances e.g. gadolinium, induce strong local magnetic fields – particularly shortening the T1 component. After intravenous administration, leakage of gadolinium through regions of damaged blood–brain barrier produces marked enhancement of the MRI signal, e.g. in ischaemia, infection, tumours and demyelination. Gadolinium may also help differentiate tumour tissue from surrounding oedema.
MR Angiography (MRA)
Rapidly flowing protons can create different intensities from stationary protons and the resultant signals obtained by special sequences can demonstrate vessels, aneurysms and arteriovenous malformations. Vessels displayed simultaneously, may make interpretation difficult, but selection of a specific MR section can demonstrate a single vessel or bifurcation. By selecting a specific flow velocity, MRA will show either arteries or veins. The resolution has improved with 3 Tesla MRA, but may still miss aneurysms seen on intra-arterial DSA (see page 45).


Diffusion-weighted MRI (DWI)

Images are based on an assessment of thermally driven translational movement of water and other small molecules within the brain. In acute ischaemia, cytotoxic oedema restrains diffusion. The degree of restricted diffusion is quantified with a parameter termed the apparent diffusion coefficient (ADC). ADC values fall initially, then normalise and prolong as ischaemic tissues become necrotic and are replaced by extracellular fluid. DWI shows size, site and age of ischaemic change. Whilst the volume normally increases within the first few days, the initial lesion size correlates best with the final outcome. This image shows restricted diffusion in a left middle cerebral artery infarct 3 hours from the onset.
Perfusion-weighted MRI (PWI)
Images are obtained by ‘bolus tracking’ after rapid contrast injection. A delay in contrast arrival and reduced concentration signifies hypoperfusion of that brain region. Soon after onset, ischaemic changes on PWI appear larger than on DWI. The difference between PWI and DWI may reflect dysfunctional salvagable tissue (ischaemic penumbra see page 245). Early resolution of the PWI abnormality indicates recanalisation of an occluded vessel, whereas in those who do not recanalise the DWI volume expands to fill a large part of the original PWI lesion.

Functional MRI (fMRI)

The oxygenated state of haemoglobin influences the T2 relaxation time of perfused brain. A mismatch between the supply of oxygenated blood and oxygen utilisation in activated areas, produces an increase in venous oxygen content within post capillary venules causing signal change due to blood oxygenation level dependent (BOLD) contrast. Improved spatial and temporal resolution has increased the scope of functional imaging, leading to greater understanding of normal and abnormal brain function. A demonstration of the exact proximity of eloquent regions to areas of proposed resection, helps minimise damage.
Magnetic resonance spectroscopy (MRS)
Spectroscopic techniques generate information on in vivo biochemical changes in response to disease. Concentrations of chemicals of biological interest are minute but measurement can be undertaken in single or multiple regions of interest of around 1.5cm3. N-acetylaspartate (a neuronal marker) and lactate are studied by 1H-MRS, whilst adenosine triphosphate phosphocreatine and inorganic phosphate are measured by 31P-MRS. MRS is gradually emerging from being a research tool to play a role in tumour characterisation, the confirmation of metabolic brain lesions and the study of degenerative disease.

1H-MRS from both regions of normal brain and from a grade II astrocytoma. The tumour trace shows a high choline peak, due to high membrane turnover, a grossly reduced peak of N-acetylaspartate and the presence of lactate, confirming anaerobic metabolism.
Diffusion tensor imaging (DTI) - tractography
As with diffusion-weighted MRI, diffusion tensor imaging utilises the movement of water. Water diffuses more rapidly in the direction aligned with the internal structure. Each MR voxel has a rate of diffusion and a preferred direction. The structure of the white matter tracts facilitates movement of water through the brain in the direction of the tract (anisotropic diffusion). Tractography is the technique which makes use of this directional information. For each voxel a colour-coded tensor (or vector) can be created which reflects 3-dimensional orientation of diffusion, the colour reflecting the direction. By this means neural tracts can be demonstrated along their whole length.

This imaging technique has demonstrated interruption of white matter tracts in patients who have suffered a traumatic diffuse axonal injury. Of even more clinical value is the technique’s ability to show whether intrinsic tumours infiltrate or deflect crucial structures such as the corticospinal tracts, potentially of value in pre-operative planning and performing tumour resection. The accuracy of DTI tractography and its use as an operative guide still requires validation.
ULTRASOUND
Extracranial
When the probe (i.e. a transducer) – frequency 5–10 MHz, is applied to the skin surface, a proportion of the ultrasonic waves emitted are reflected back from structures of varying acoustic impedance and are detected by the same probe. These reflected waves are reconverted into electrical energy and displayed as a two-dimensional image (β-mode).
When the probe is directed at moving structures, such as red blood cells within a blood vessel lumen, frequency shift of the reflected waves occurs (the Doppler effect) proportional to the velocity of flowing blood. Doppler ultrasound uses continuous wave (CW) or pulsed wave (PW). The former measures frequency shift anywhere along the path of the probe. Pulsed ultrasound records frequency shift at a specific depth.
Duplex scanning combines β-mode with doppler, simultaneously providing images from the vessels from which the velocity is recorded.
Colour Coded Duplex (CCD) uses colour coding to superimpose flow velocities on a two dimensional ultrasound image.
Applications: assessment of extracranial carotid and vertebral arteries.

Intracranial – transcranial Doppler ultrasound
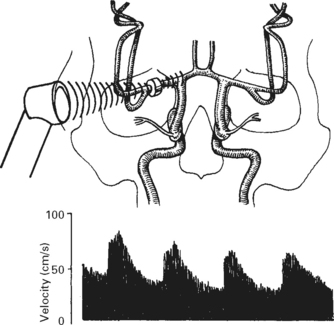
By selecting lower frequencies (2 MHz), ultrasound is able to penetrate the thinner parts of the skull bone.
Combining this with a pulsed system gives reliable measurements of flow velocity in the anterior, middle and posterior cerebral arteries and in the basilar artery.
Applications:
Assessment of intracranial haemodynamics in extracranial occlusive/stenotic vascular disease. Detection of vasospasm in subarachnoid haemorrhage.
ANGIOGRAPHY
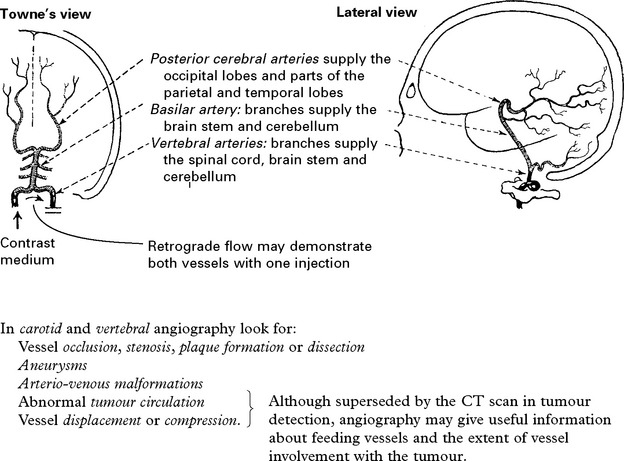
Many neurological and neurosurgical conditions require accurate delineation of both intra- and extracranial vessels. Intra-arterial injection of contrast, imaged by digital subtraction (DSA), remains the gold standard for imaging intracranial vessels.
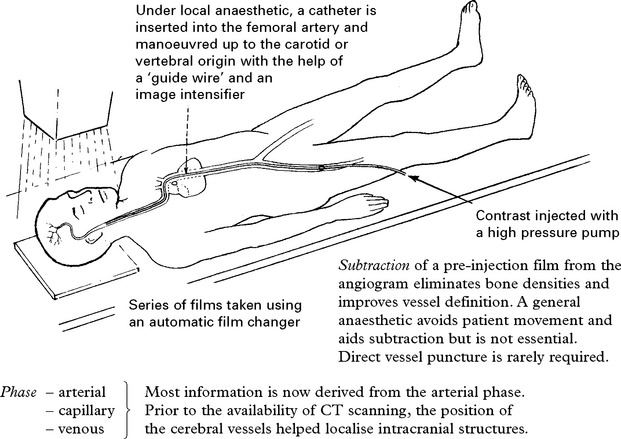
Digital subtraction angiography (DSA) depends upon high-speed digital computing. Exposures taken before and after the administration of contrast agents are instantly subtracted ‘pixel by pixel’. With the latest equipment, data processing provides 3D imaging of vessels and permits magnification of specific areas and rotation of the 3D image in any plane.

CAROTID ANGIOGRAPHY
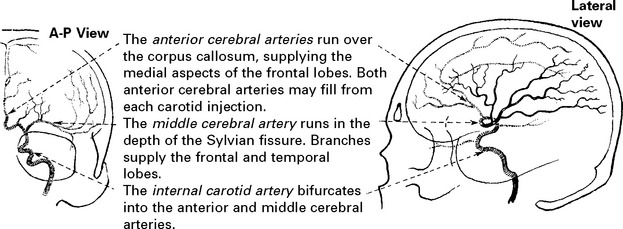
In the absence of the ability to rotate the image, oblique views may aid identification of some lesions, e.g. aneurysms.
VERTEBRAL ANGIOGRAPHY
Complications
The development of non-ionic contrast mediums, e.g. iohexol, iopamidol, has considerably reduced the risk of complications during or following angiography.
Cerebral ischaemia: caused by emboli from an arteriosclerotic plaque broken off by the catheter tip, hypotension or vessel spasm following contrast injection. The small amount of contrast used for intra-arterial DSA carries low risk. In the hands of experienced radiologists, permanent neurological deficit occurs in only one in every 1000 investigations (one in 100 in arteriopaths).
Contrast sensitivity: mild sensitivity to the contrast occasionally develops, but this rarely causes severe problems.
CT angiography (see page 37), Magnetic Resonance Angiography (MRA) (see page 41)
INTERVENTIONAL ANGIOGRAPHY
With recent advances, endovascular techniques now play an important role in neurosurgical management.
Embolisation: Particles (e.g. Ivalon sponge) injected through the arterial catheter will occlude small vessels; e.g. those feeding meningioma or glomus jugulare tumours, thus minimising operative haemorrhage.
‘Glue’ (isobutyl-2-cyanocrylate) can be injected into both high and low flow arteriovenous malformations. Operative excision is greatly facilitated; if the lesion is completely obliterated, this may even serve as a definitive treatment.
Balloons inflated, then detached from the catheter tip will occlude high flow systems involving large vessels, e.g. carotico-cavernous fistula, high flow arteriovenous malformations.
Platinum coils inserted into the aneurysm fundus through a special catheter can produce complete or partial obliteration. Many centres now use this technique as a first line treatment for intracranial aneurysms, particularly those at the basilar bifurcation (see page 288). Temporary inflation of a balloon within the parent vessel during coiling can help prevent occlusion of the parent vessel in wide necked aneurysms (balloon remodelling) (see page 289).
Stents are now available for use in intracranial vessels and can prevent prolapse of platinum coils into the vessel lumen.
All techniques carry some risk of cerebral (or spinal) infarction from inadvertent distal embolisation when used in the internal carotid or spinal systems.
Angioplasty: Inflation of an intravascular balloon within a vasospastic segment of a major vessel may reverse cerebral ischaemia, but the technique is not without risk. No large trials of effectiveness exist.
RADIONUCLIDE IMAGING
Single photon emission computed tomography (SPECT)
There are two components to imaging with radioactive tracers – the detecting system and the labelled chemical. Each has become increasingly sophisticated in recent years. SPECT uses compounds labelled with gamma-emitting tracers (ligands), but unlike conventional scanning, acquires data from multiple sites around the head. Similar computing to CT scanning provides a two-dimensional image depicting the radioactivity emitted from each ‘pixel’. This gives improved definition and localisation. Various ligands have been developed but a 99Tcm labelled derivative of propylamine oxime (HMPAO) is the most frequently used. This tracer represents cerebral blood flow since it rapidly diffuses across the blood–brain barrier, becomes trapped within the cells, and remains long enough to allow time for scanning. Of the total injected dose, 5% is taken up by the brain and 86% of this activity remains in the brain at least 24 hours.

A rotating gamma camera is often used for detection, although fixed multidetector systems will produce higher quality images. Data are normally reconstructed to give axial images but coronal and sagittal can also be produced.

Clinical applications

Positron emission tomography (PET)
PET uses positron-emitting isotopes (radionuclides) bound to compounds of biological interest to study specific physiological processes quantitatively. Positron-emitting isotopes depend on a cyclotron for production and their half-life is short; PET scanners only exist on adjacent sites which limits availability for routine clinical use.

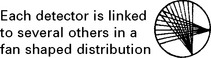
Each decaying positron results in the release of two photons in diametric opposition; these activate two coincidental detectors. Multiple pairs of detectors and computer processing techniques enable quantitative determination of local radioactivity (and density of the labelled compound) for each ‘voxel’ (a cube of tissue) within the imaged field. Reconstruction using similar techniques to CT scanning produces the PET image.

Clinical and research uses
PET scanning is used primarily as a research tool to elucidate the relationships between cerebral blood flow, oxygen utilisation and extraction in focal areas of ischaemia or infarction (page 245) in patients with dementia, epilepsy and brain tumours. Identification of neurotransmitter and drug receptor sites aids the understanding and management of psychiatric (schizophrenia) and movement disorders. Whole body PET scans can also identify occult tumour in patients with paraneoplastic syndromes (page 549).

ELECTROENCEPHALOGRAPHY (EEG)
Electroencephalography examines by means of scalp electrodes the spontaneous electrical activity of the brain. Tiny electrical potentials, which measure millionths of volts, are recorded, amplified and displayed on either 8 or 16 channels of a pen recorder. Low and high frequency filters remove unwanted signals such as muscle artefact and mains interference.
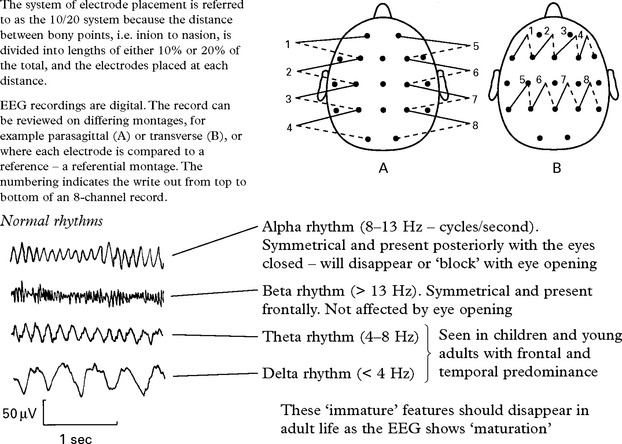
As well as recording a resting EEG stressing the patient by hyperventilation and photic stimulation (a flashing strobe light) may result in an electrical discharge supporting a diagnosis of epilepsy.
More advanced methods of telemetry and foramen ovale recording may be necessary
– to establish the diagnosis of ‘epilepsy’ if doubt remains
– to determine the exact frequency and site of origin of the attacks
– to aid classification of seizure type.
Telemetry: utilises a continuous 24–48 hour recording of EEG, often combined with a videotape recording of the patient. Increasing availability of this and ambulatory recording has greatly improved diagnostic accuracy and reliability of seizure classification.
Foramen ovale recording: a needle electrode is passed percutaneously through the foramen ovale to record activity from the adjacent temporal lobe.
INTRACRANIAL PRESSURE MONITORING
Although CSF pressure may be measured during lumbar puncture, this method is of limited value in intracranial pressure measurement:
An isolated pressure reading does not indicate the trend or detect pressure waves.
Lumbar puncture is contraindicated in the presence of an intracranial mass.
Pressure gradients exist between different intracranial and spinal compartments, especially in the presence of brain shift.
Many techniques are now available to measure intracranial pressure. In most instances a transducer either lying on the brain surface or inserted a few millimetres into the brain substance suffices, but a catheter inserted into the lateral ventricle remains the ‘gold’ standard by which other methods are compared.
Ventricular catheter insertion
A ventricular catheter is inserted into the frontal horn of the lateral ventricle through a frontal burr hole or small drill hole situated two finger breadths from the midline, behind the hairline and anterior to the coronal suture.

Complications
Intracerebral haemorrhage following catheter insertion rarely occurs.
Ventriculitis occurs in from 10–17%. Minimise this risk by tunnelling catheter under the skin and removing as soon as is practicable.
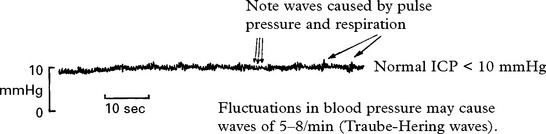
NORMAL PRESSURE TRACE
ABNORMAL PRESSURE TRACE

CLINICAL USES OF ICP MONITORING
– Investigation of normal pressure hydrocephalus – the presence of β waves for > 5% of a 24-hour period suggests impaired CSF absorption and the need for a drainage operation.
– Postoperative monitoring – a rise in ICP may precede clinical evidence of haematoma formation or cerebral swelling.
– Small traumatic haematomas – ICP monitoring may guide management and indicate the need for operative removal.
– ICP monitoring is required during treatment aimed at reducing a raised ICP and maintaining cerebral perfusion pressure.
EVOKED POTENTIALS – VISUAL, AUDITORY AND SOMATOSENSORY
RECORDING METHODS
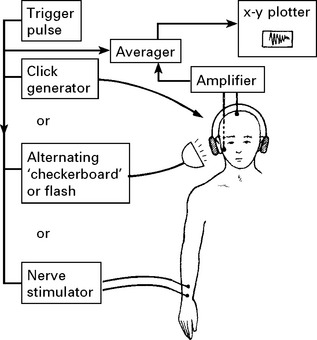
Stimulation of any sensory receptor evokes a minute electrical signal (i.e. microvolts) in the appropriate region of the cerebral cortex. Averaging techniques permit recording and analysis of this signal normally lost within the background electrical activity. When sensitive apparatus is triggered to record cortical activity at a specific time after the stimulus, the background electrical ‘noise’ averages out, i.e. random positive activity subtracts from random negative activity, leaving the signal evoked from the specific stimulus.
Visual evoked potential (VEP)

A stroboscopic flash diffusely stimulates the retina; alternatively an alternating checkerboard pattern stimulates the macula and produces more consistent results. The evoked visual signal is recorded over the occipital cortex. The first large positive wave (PC1) provides a useful point for measuring conduction through the visual pathways.
Uses: Multiple sclerosis detection – 30% with normal ophthalmological examination have abnormal VEP. Peroperative monitoring – pituitary surgery.
Brain stem auditory evoked potential (BAEP)

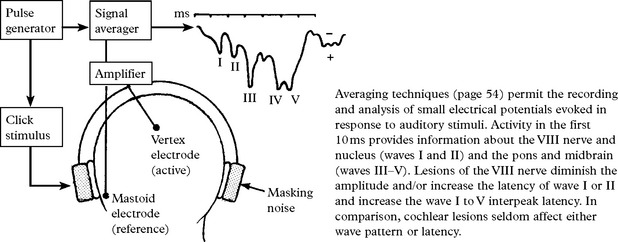
Electrical activity evoked in the first 10 milliseconds after a ‘click’ stimulus provides a wave pattern related to conduction through the auditory pathways in the VIII nerve and nucleus (waves I and II) and in the pons and midbrain (waves III–V). Longer latency potentials (up to 500 ms), recorded from the auditory cortex in response to a ‘tone’ stimulus, are of less clinical value.
Uses: Hearing assessment – especially in children.
Detection of intrinsic and extrinsic brain stem and cerebellopontine angle lesions, e.g. vestibular schwannoma.
Peroperative recording during cerebellopontine angle tumour operations.
Assessment of brain stem function in coma.
Somatosensory evoked potentials (SEP)

The sensory evoked potential is recorded over the parietal cortex in response to stimulation of a peripheral nerve (e.g. median nerve). Other electrodes sited at different points along the sensory pathway record the ascending activity. Subtraction of the latencies between peaks provides conduction time between these sites.
Central conduction time (CCT): sensory conduction time from the dorsal columns (or nuclei) to the parietal cortex.
Uses: Detection of lesions in the sensory pathways
– brachial plexus injury
– demyelination.

Motor Evoked Potential (MEP)
Subtraction of the latencies between motor evoked potentials elicited by applying a brief magnetic stimulus to either the motor cortex, the spinal cord or the peripheral nerves gives peripheral and central motor conduction velocities.
MYELOGRAPHY
Now rarely used due to availability of MRI and CT scanning. Injection of water-soluble contrast into the lumbar theca and imaging flow up to the cervicomedullary junction provides a rapid (although invasive) method of screening the whole spinal cord and cauda equina for compressive lesions (e.g. disc disease or spondylosis, tumours, abscesses or cysts). For suspected lumbosacral disc disease, contrast is screened up to the level of the conus i.e. RADICULOGRAPHY (but a normal study does not exclude the possibility of a laterally situated disc). CT scanning and MRI have gradually replaced the need for myelography, but the introduction of a low dose of water-soluble contrast considerably enhances axial CT scan images of the spinal cord and nerve roots.
Problems
Headache occurs in 30%, nausea and vomiting in 20% and seizures in 0.5%.
Arachnoiditis – previously a major complication with oil based contrast MYODIL, but rarely occurs with water soluble contrast.
Haematoma – occurs rarely at the injection site.
Impaction of spinal tumour – may follow CSF escape and aggravate the effects of cord compression, leading to clinical deterioration.
LUMBAR PUNCTURE (LP)
Lumbar puncture is used to obtain cerebrospinal fluid for analysis and to drain CSF and reduce intracranial pressure, for example in patients with idiopathic intracranial hypertension, communicating hydrocephalus or CSF fistula.
TECHNIQUE
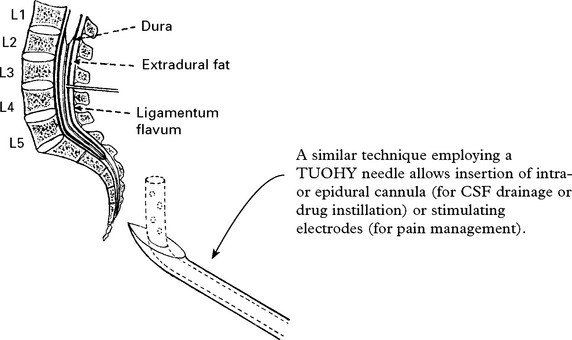
Use the smallest gauge possible to reduce post LP headaches (PLPH), preferably 22G or 20G. Using ‘atraumatic’ needles rather than standard cutting needles reduces the frequency of PLPH, for 22G needles from ∼20% to ∼5%.
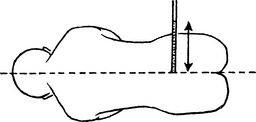
1. Correct positioning of the patient is essential. Open the vertebral laminae by drawing the knees up to the chest and flexing the neck. Ensure the back is parallel to the bed to avoid rotation of the spinal column.
2. Identify the site. Usually aim for the L3/4 space at iliac crest level, but since the spinal cord ends at L1 any space from L2/L3 to L5/S1 is safe.
3. Clean the area and insert a few millilitres of local anaesthetic.
4. Ensure the stylet of the LP needle is fully home and insert at a slight angle towards the head, so that it parallels the spinous processes. Some resistance is felt as the needle passes through the ligamentum flavum, the dura and arachnoid layers.

5. Withdraw the stylet and collect the CSF. If bone is encountered, withdraw the needle and reinsert at a different angle. If the position appears correct yet no CSF appears, rotate the needle to free obstructive nerve roots.
Avoid lumbar puncture
– if raised intracranial pressure is suspected. Even a fine needle leaves a hole through which CSF will leak. In the presence of a space-occupying lesion, especially in the posterior fossa, CSF withdrawal creates a pressure gradient which may precipitate tentorial herniation.
– if platelet count is less than 40000 and prothrombin time is less than 50% of control.
CEREBROSPINAL FLUID
CSF COLLECTION
Subarachnoid haemorrhage (SAH), or puncture of a blood vessel by the needle, may account for blood-stained CSF. To differentiate, collect CSF in three bottles.

CSF PRESSURE MEASUREMENT
Check that the patient’s head (foramen of Munro) is level with the lumbar puncture. Connect a manometer via a 3-way tap to the needle and allow CSF to run up the column. Read off the height. Normal value: 100–200 mm CSF.
CSF ANALYSIS
Standard tests
|
1. Bacteriological |
– RBC and differential WBC (normal = < 5 WBCs per mm3) – Gram stain and culture – appearance of supernatant. Xanthochromia (yellow staining) results from subarachnoid haemorrhage with RBC breakdown, high CSF protein or jaundice. |
|
2. Biochemical |
– protein (normal = 0.15–0.45 g/l) – glucose (normal = 0.45–0.70 g/l) 40–60% of blood glucose simultaneously sampled. |
Special tests
|
Suspected: |
|
|
Subarachnoid haemorrhage Malignant tumour |
– spectrophotometry for blood breakdown products – cytology |
|
Tuberculosis |
– Ziehl-Neelson stain, Lowenstein-Jensen culture, polymerase chain reaction (PCR) |
|
Non-bacterial infection Demyelinating disease |
– virology, fungal and parasitic studies – oligoclonal bands |
|
Neurosyphilis |
– VDRL (Venereal Disease Research Laboratory) test – FTA-ABS (Fluorescent treponemal antibody absorption) test – Treponema pallidum immobilisation test (TPI) |
|
Cryptococcus HIV |
– culture and antigen detection – culture, antigen detection and antiviral antibodies (anti-HIV-IgG). |
Complications
– tonsillar herniation (see page 83)
– transient headache (5–30% depending on needle type), radicular pain (10%), or ocular palsy (1%)
– epidural haemorrhage very rare.
ELECTROMYOGRAPHY/NERVE CONDUCTION STUDIES
Needle electromyography records the electrical activity occurring within a particular muscle.
Nerve conduction studies measure conduction in nerves in response to an electrical stimulus.
Both are essential in the investigation of diseases of nerve (neuropathy) and muscle (myopathy).
Repetitive nerve stimulation tests are important in the evaluation of disorders of neuromuscular transmission, e.g. myasthenia gravis.
ELECTROMYOGRAPHY
A concentric needle electrode is inserted into muscle. The central  wire is the active electrode and the outer casing the reference electrode. This records from an area of 300μ radius.
The potential difference between the two electrodes is amplified and displayed on an oscilloscope. An audio monitor enables the investigator to ‘hear’ the pattern of electrical activity.
Normal muscle at rest is electrically ‘silent’ with a resting potential of 90 mV; as the muscle gradually contracts, motor unit potentials appear … followed by the development of

Spontaneous activity at rest

Fibrillation potentials are due to single muscle fibre contraction and indicate active denervation. They usually occur in neurogenic disorders, e.g. neuropathy.
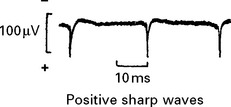
Slow negative waves preceded by sharp positive spikes. Seen in chronically denervated muscle, e.g. motor neuron disease, but also in acute myopathy, e.g. polymyositis. These waves probably represent injury potentials.
Motor unit potential
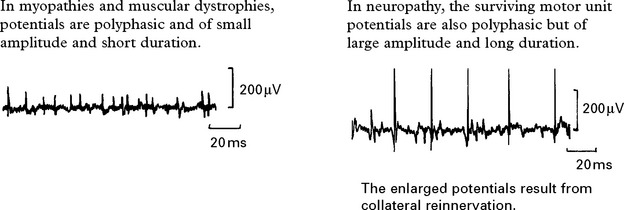
Interference pattern
In myopathy, recruitment of motor units and the interference pattern remain normal. The interference pattern may even appear to increase due to fragmentation of motor units.

In neuropathy, there is a reduction in interference due to a loss of motor units under voluntary control.

Myotonia
High frequency repetitive discharge may occur after voluntary movement. The amplitude and frequency of the potentials wax and wane giving rise to the typical ‘dive bomber’ sound on the audio monitor.

An abnormal myotonic discharge provoked by moving the needle electrode.
NERVE CONDUCTION STUDIES
Distal latency (latency from stimulus to recording electrodes), amplitude of the evoked response and conduction velocity all provide information on motor and sensory nerve function.
Conduction velocity: measurement made by stimulating or recording from two different sites along the course of a peripheral nerve.

Motor conduction velocities slow with age.
Body temperature is important; a fall of 1°C slows conduction in motor nerves by approximately 2 metres per second.
Pathological delay occurs with nerve entrapments, demyelinating neuropathies (Guillain– Barré syndrome) and multifocal motor neuropathy.
REPETITIVE STIMULATION
In the normal subject, repetitive stimulation of a motor nerve at a frequency of <30/second produces a muscle potential of constant form and amplitude. Increasing the stimulus frequency to >30/second results in fatigue manifest by a decline or ‘decrement’ in the amplitude. In patients with disorders of neuromuscular transmission, repetitive stimulation aids diagnosis:

SINGLE FIBRE ELECTROMYOGRAPHY
A standard concentric needle within muscle will record electrical activity 0.5–1 mm from its tip – sampling from up to 20 motor units. A ‘single fibre’ electromyography needle with a smaller recording surface detects electrical activity within 300 μ m of its tip – sampling 1–3 muscle fibres from a single motor unit.

Single fibre electromyography is occasionally helpful in the investigation of disorders of neuromuscular transmission. In ocular myasthenia, the affected muscles are not accessible and frontalis is sampled instead.
NEURO-OTOLOGICAL TESTS
AUDITORY SYSTEM
Neuro-otological tests help differentiate conductive, cochlear and retrocochlear causes of impaired hearing. They supplement Weber’s and Rinne’s test (page 16).
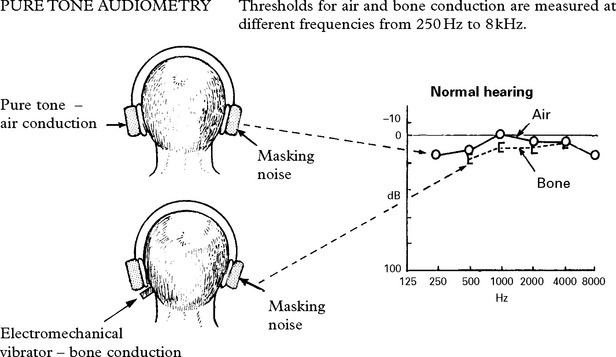
Sound conducted through air requires an intact ossicular system as well as a functioning cochlea and VIII nerve. Sound applied directly to the bone bypasses the ossicles.

SPEECH AUDIOMETRY
This test measures the percentage of words correctly interpreted as a function of the intensity of presentation and indicates the usefulness of hearing. The graph shows how different types of hearing loss can be differentiated.

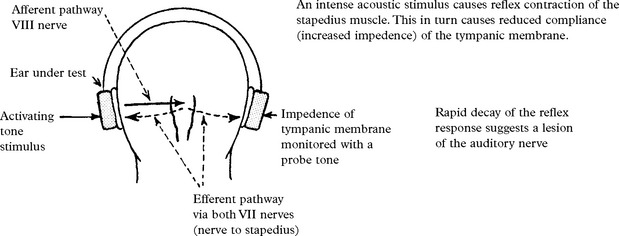
STAPEDIAL REFLEX DECAY
AUDITORY BRAINSTEM EVOKED POTENTIAL
VESTIBULAR SYSTEM
Bedside vestibular function testing
Hallpike’s manoeuvre: see page 185.
Head thrust test
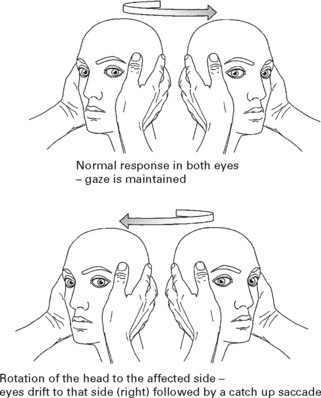
The semicircular canals detect rotational acceleration of the head. When the head is moved the endolymph stays in place relative to the skull and deflects the cupula within which the hair cells are imbedded. At rest the vestibular nerve from each semicircular canal has a background tonic firing rate. When the head is turned in one direction deflection of the hair cells increases the rate of firing from one canal and decreases the rate of firing from the paired contralateral canal (and vice versa). This activity acting through the III and VI nerves moves the eyes in a direction opposite to the rotation, tending to hold the eyes steady in space.

The head thrust test uses this to detect a peripheral unilateral vestibular lesion. The patient is asked to maintain gaze on the examiner’s eyes. Slow rotation of the head (with minimal rotational acceleration) has no effect. With rapid head rotation in either direction, the gaze is maintained. In the presence of a unilateral vestibular lesion, if the head is turned rapidly towards the affected side, the firing rate does not increase in the vestibular nerve on this side and fails to maintain the position of gaze. The eyes move towards the affected side and this is followed by a catch up saccade. When the head is turned away from the affected side, increased activity in the normal ipsilateral vestibular nerve is sufficient to maintain the normal response.
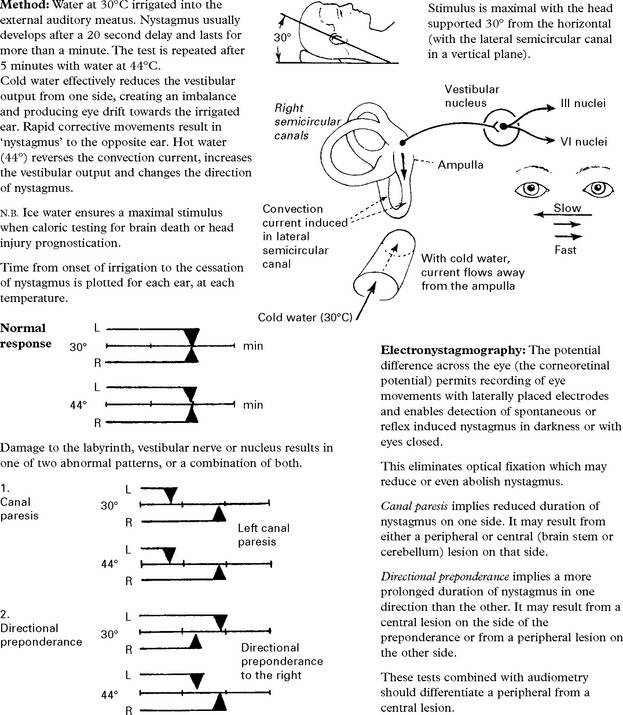
Caloric testing (vestibulo-ocular reflex)
Compensatory mechanisms may mask clinical evidence of vestibular damage – spontaneous and positional nystagmus. Caloric testing provides useful supplementary information and may reveal undetected vestibular dysfunction.