
Antonio Tito Fojo and Susan E. Bates
INTRODUCTION
Approaches to response assessments have become increasingly important over the past decade as the drug development pipeline has steadily increased in volume. In 2012, an estimated 981 medicines were in development for cancer, and the number is certainly higher today.1 The challenge is, first, how to measure the activity of an agent in the research setting, and, second, how to measure activity in the standard of care setting.
The “modern era” of drug development began in 1976 when 16 experienced oncologists treating lymphoma gathered to decide what would be considered a reliable measure of response to a therapy.2 Each oncologist measured 12 simulated tumor masses employing usual clinical methods (i.e., calipers or rulers). A principal goal was to identify the amount of shrinkage that could not be ascribed to operator error and that would not be found if a placebo was administered. Moertel and Hanley recommended that to avoid error, a 50% reduction in the product of perpendicular diameters be employed as the criterion for efficacy.2 It was from this beginning that our current methodologies of response assessment evolved. The important point to note is that the decision to use a 50% reduction in the product of perpendicular diameters as a measure of efficacy was made so as to reduce error and not because it represented a value that conferred clinical benefit.
From Calipers and Rulers in Lymphoma to the Bidimensional World Health Organization Criteria
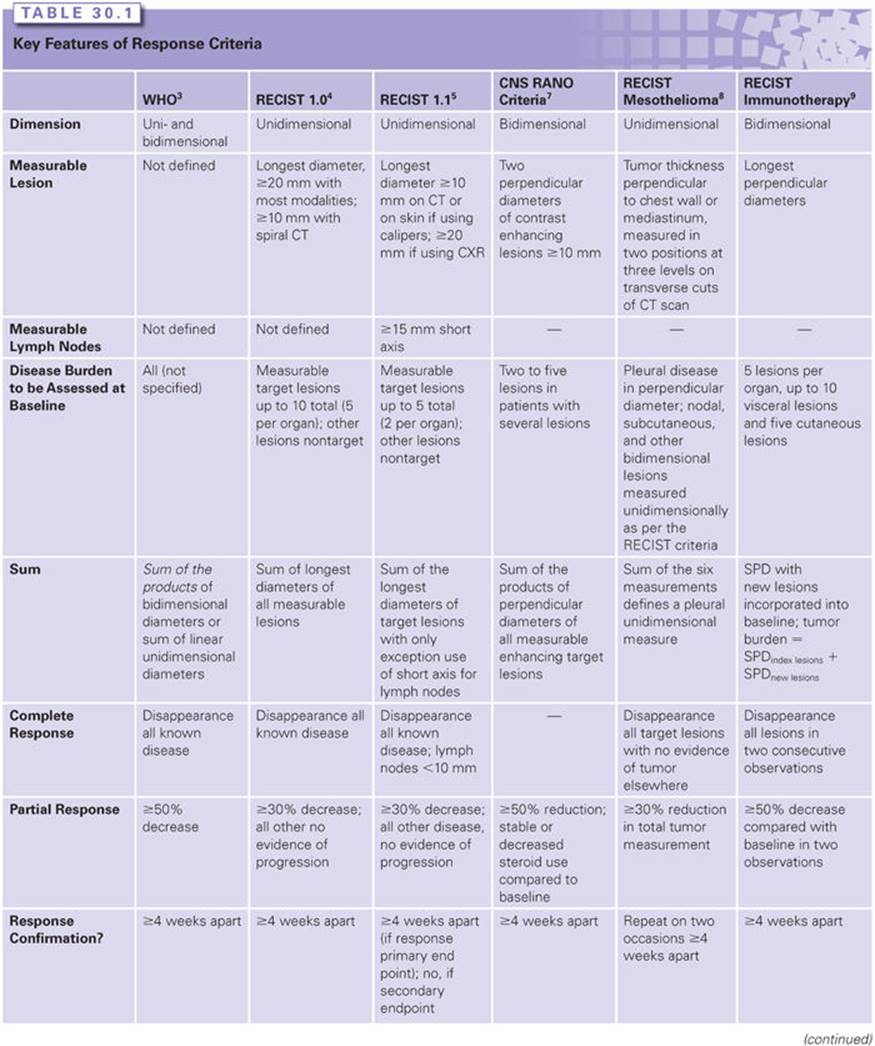
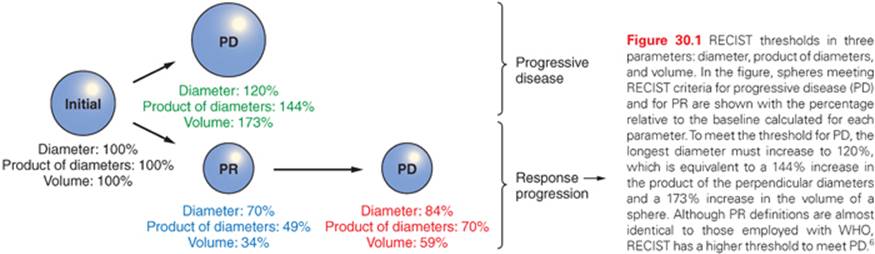
In 1981, five years after the Moertel and Hanley report,2 a World Health Organization (WHO) initiative developed standardized approaches for the “reporting of response, recurrence and disease-free interval.”3 The WHO criteria, like Moertel and Hanley, recommended that malignant disease be measured in two dimensions. Complete response (CR) was defined as the disappearance of all known disease, and a partial response (PR) was scored if there occurred a “50% decrease in the sum of the products of the perpendicular diameters of the multiple lesions.” Thus, the 50% reduction initially chosen as an operationally optimal value became institutionalized as the threshold for declaring efficacy in the majority of cancers. This measure of efficacy was perpetuated in 2000 with the now widely used Response Evaluation Criteria in Solid Tumors (RECIST), but shifting to one dimension.4 The authors noted “the definition of a partial response, in particular, is an arbitrary convention—there is no inherent meaning for an individual patient of a 50% decrease in overall tumor load.” Nevertheless, the threshold chosen—a 30% reduction in one dimension—was comparable in volume to the 50% decrease in the sum of the products of the perpendicular diameters and thus perpetuated the 1976 standard. In spite of its arbitrary origins, the 50% reduction has held up over time. But the major impact of the WHO criteria was that it marked the beginning of a common language of response. These criteria have been revisited and refined over time, as technology and medicine advanced. Table 30.1 compares the WHO criteria with those of RECIST 1.0 and RECIST 1.1 and three modifications of RECIST, whereas Figure 30.1 provides a visual presentation of the RECIST threshold required to qualify as response or progression.3–9

ASSESSING RESPONSE
RECIST 1.1
The RECIST 1.0 guidelines were updated as RECIST 1.1 in 2009, with a number of differences between the two response criteria highlighted. RECIST 1.1 preserves the same categories of response found in RECIST 1.0:
 Complete response: Complete disappearance of all disease
Partial response: ≥30% reduction in the sum of the longest diameter of target lesions
Stable disease: Change not meeting criteria for response or progression
Progression: ≥20% increase in the sum of the longest diameter of target lesions
However, a decade of experience with RECIST identified several problems with the criteria, some of which could be corrected. In RECIST 1.0, minimum size varied between 1 and 2 cm depending on technique; in RECIST 1.1, a 1-cm lesion is the minimum measurable. In RECIST 1.0, 10 lesions were to be measured, 5 per organ; RECIST 1.1 reduced that to 5 lesions, 2 per organ. Response criteria in RECIST 1.0 did not address lymph nodes; in RECIST 1.1, lymph nodes decreasing to <1 cm in their short axis could constitute a complete response. Disease progression in nontarget disease was further defined to indicate that in addition to a 20% increase in target lesions over the smallest sum on study, there must be an absolute increase of 5 mm, and that an increase of a single nontarget lesion should not trump an overall disease status assessment based on target lesions.
Variations of the RECIST Criteria
The RECIST criteria have been widely used for standardizing the reporting of clinical trial results and have improved reproducibility. However, the increasing precision and codification of RECIST has led to recognition of its limitations. For example, there are unique challenges in central nervous system (CNS) disease, relating response to tumor size measurements based on contrast enhancement. Pseudoprogression refers to an increase in contrast enhancement due to a transient increase in vascular permeability after irradiation, whereas pseudoresponse is a decrease in contrast enhancement that may occur due to a reduction in vascular permeability following corticosteroids or an antiangiogenic agent such as bevacizumab.10–12 The McDonald criteria, traditionally used in determining glioma response based on two-dimensional measurements, have been recently updated as part of the Response Assessment in Neuro-Oncology (RANO) response criteria and extended to include a response assessment for metastatic CNS disease.7,13
Other examples where RECIST is limited include mesothelioma, gastrointestinal stromal tumors (GIST), hepatocellular cancers, among others. The pleural disease of mesothelioma increases in depth while following the pleural surface. GIST tumors may remain unchanged in size after treatment, whereas the center of the tumor mass undergoes necrosis, and progression may occur in the remaining rim.14Hepatocellular cancers are often treated with local–regional therapy in which the goal is tumor necrosis and treatment failure occurs in surviving viable tumor.15 Different strategies have emerged to quantify these diseases, including modifications of RECIST, quantifying positron-emission tomography (PET) imaging, and biomarker criteria, as will be discussed. The RECIST adaptation for mesothelioma, growing along the pleural surface, is to measure the diameter perpendicular to the chest wall or mediastinum, and to measure at three levels.8 The adaptation for hepatocellular cancer following local therapy is measurement of the longest diameter of the tumor that shows enhancement on the arterial phase of the scan, bypassing the dense, homogeneous Lipiodol-containing necrotic area.15
Investigators have also observed that following immunotherapy, tumor lesions may increase in size due to the increased infiltration of T cells, even meeting criteria for RECIST-defined progressive disease (PD). Previously radiographically undetectable lesions may appear. Departing from conventional RECIST, which defines any new lesion as PD, the immune response criteria allow the appearance of new lesions, adding them to the total tumor burden.9 An increase in total tumor burden of >25% relative to baseline or nadir is required to define PD.
International Working Group Criteria for Lymphoma
Revised guidelines for lymphoma assessment were promulgated by the International Working Group (IWG) in 2007.16 These guidelines incorporated 18F-fluorodeoxyglucose (FDG)-PET assessments in metabolically active lymphomas.16 Although a CR requires the complete disappearance of detectable disease, a posttreatment residual mass is permitted if it is negative on FDG-PET and was positive at baseline. For lymphomas that are not consistently FDG avid, or if FDG avidity is unknown, a CR requires that nodes >1.5 cm before therapy regress to <1.5 cm, and nodes that were 1.1 to 1.5 cm in long axis and >1.0 cm in the short axis shrink to ≤1.0 cm in short axis. The definition of PR resembles the WHO criteria, in that a ≥50% decrease in the sum of the product of the diameters in up to six nodal masses or in hepatic or splenic nodules must be documented. Although RECIST 1.1 now includes lymph node assessment, the IWG criteria remain the assessment method typically used in lymphoma clinical trials.
ALTERNATE RESPONSE CRITERIA
The previous examples represent attempts to more accurately measure tumor burden. Evolving imaging technology enabling volumetric measurements of tumor masses may eventually resolve some of these problems, but effective therapeutic agents are required to enable validation and utilization of response assessment tools. The lack of an agent that can mediate substantial tumor shrinkage underlies the concept of clinical benefit response (CBR) as an endpoint in pancreatic cancer. Clinical benefit was defined as a combination of improvement in pain, performance status, and weight; the assessment of CBR supported the U.S. Food and Drug Administration (FDA) approval of gemcitabine in pancreatic cancer.17,18 Better therapies for pancreatic cancer that result in tumor shrinkage or eradication should include and then eclipse clinical benefit.
Response criteria may be specific to a particular disease or clinical setting. Some diseases by their nature require specific strategies for response assessment.
Severity-Weighted Assessment Tool Score in Cutaneous T-Cell Lymphoma
Cutaneous T-cell lymphoma (CTCL) is a disease that can involve the entire epidermis, or comprise individual skin lesions varying widely in severity rather than size. The severity-weighted assessment tool (SWAT) assigns a factor for skin lesion severity—patch, plaque, or tumor—multiplies this factor by the percent of skin involved with each lesion type and then adds these together. This complex system formed the basis of the FDA approval of vorinostat for CTCL.19
Pathologic Complete Response in Breast Cancer
One unique response endpoint is the assessment of breast cancer treated in the neoadjuvant setting. The purpose of neoadjuvant therapy is to improve survival, render locally advanced cancer amenable to surgery, or to aid in breast conservation. In that setting, the absence of cancer cells in resected breast tissue has been used to define a pathologic complete response (pCR). The rate of pCR has been proposed as a surrogate endpoint for event-free survival (EFS) or overall survival (OS) to support approval of new agents or combinations of agents tested in clinical trials.20 In a pooled analysis of 11,955 patients enrolled on 12 neoadjuvant trials, individual patients with pCR had improved EFS and OS.21 However, at the trial level, pCR rates did not correlate with EFS or OS, a problem likely due to heterogeneity of breast cancer subtypes among the trials. Despite this, pCR rates were recently used to support the approval of pertuzumab and trastuzumab in the neoadjuvant setting.21,22
Computed Tomography-Based Tumor Density
One approach, often called the Choi criteria, advocates assessing tumor response in GIST, renal cell cancer, or hepatocellular cancer based on density on computed tomography (CT) scans (Table 30.2). This variation was prompted by the evident response to treatment with imatinib but with minimal tumor shrinkage.23 The Choi criteria are still considered exploratory in GIST,24,25 and it is too soon to know of benefits in other histologies.26,27 Further study should determine its utility, although it will likely be confined to specific tumor types with specific drugs.

FDG-PET
Although widely used in clinical practice, FDG-PET has become part of standardized response criteria for clinical trials only in lymphoma (see Table 30.2). In solid tumors, FDG-PET can aid in the detection of new or recurrent sites of disease, and can be used as an adjunct during assessments for disease progression when using RECIST criteria.5 Although FDG uptake is a powerful diagnostic tool and its uptake reflects a tumor’s metabolic activity, it has some limitations: Some tumors have variable FDG avidity; differences can occur due to variations in patient activity, carbohydrate intake, blood glucose, and timing; and there are several benign sources of uptake, including inflammatory and postsurgical sites. Multiple methods of quantitating FDG-PET and assessing response have been proposed, but to date there is no consensus, particularly regarding the definition of a metabolic response.28–33
The two most widely used response criteria—the European Organisation for the Research and Treatment of Cancer (EORTC) criteria and PET Response Criteria in Solid Tumors (PERCIST) (see Table 30.2)—have been evaluated in specific disease types, but unifying FDG-PET response criteria remains a challenge in anticancer drug development.28,30 We would note that, as shown in Figure 30.1, a 30% reduction in the diameter of a sphere—the magnitude of change required to score a response according to RECIST—represents a 65% decrease in volume. If an standardized uptake value (SUV) decrease is directly equated to a volume decrease, a reduction of 25% translates to a 10% reduction in diameter, a value that likely constitutes an insufficient response.
Serum Biomarkers of Response
The ideal response assessment method is an assay that could measure tumor quantity by a simple blood test (see Table 30.2). Circulating protein biomarkers have been identified and studied for several decades for screening, early detection of recurrent disease, determining prognosis, selecting therapy, and monitoring response to therapy. These serum tumor markers are to be distinguished from the assays determining the presence of an overexpressed or mutated molecular target. With the successful launch of therapies against such molecular targets, there has been increased interest in the assays needed to select therapy for individual patients (predictive biomarkers). The analytical and clinical validation of such assays, along with determination of their clinical utility, has created a new regulatory paradigm known as companion diagnostics.34,35 This investment in the development of predictive markers for companion diagnostics has reduced the focus on protein biomarkers of treatment response relative to older literature.
As a result, there are few clinically validated biomarkers of response.36 In addition to issues regarding sensitivity and specificity, their use and development has also been hindered by the often limited efficacy of therapies; response biomarkers are of little value without highly effective primary and salvage therapies. For example, a recent clinical trial indicates that in asymptomatic patients with ovarian cancer whose only evidence of disease progression is an isolated rising CA-125, nothing is gained by instituting treatment before there is other evidence of progression.37,38
Cancer Antigen 125 (CA-125): Despite recognized limitations, CA-125 is widely used. For example, the Gynecologic Cancer InterGroup (GCIG) criteria have evolved to help determine whether a patient’s tumor has responded to therapy.39–41 Response is defined as a 50% decline from an elevated baseline value, whereas progression is defined as a doubling over the nadir or the upper limit of normal.42In clinical practice, CA-125 levels are followed as part of standard management, but making clinical decisions on marker changes alone is not recommended.43
Prostate-Specific Antigen (PSA): Similar issues have confronted investigators caring for patients with prostate cancer. The PSA Working Group 1 (PCWG1) guidelines, first published in 1999, established PSA criteria, particularly for use in patients with disease that was difficult to quantify.44 There followed a second working group (PCWG2) that recommended plotting the percent PSA change for each patient in a waterfall plot so as to avoid creating a dichotomous variable from the changes in PSA.45 PCWG2 also recommended keeping patients on trial until evidence of a change in clinical status—either symptomatic or radiographic progression. The latter addressed concerns with patients in whom PSA changes did not reflect clinical status, particularly those with transient increases in the first 12 weeks of a new therapy.
Human Chorionic Gonadotropin (hCG) and alpha fetoprotein (AFP): Because testicular cancer is a highly curable disease with validated biomarkers, outcome assessment has focused on the rapid detection of patients whose tumors have a poor response to therapy. Because both markers have relatively short half-lives—2 to 3 days for hCG and 5 to 7 days for serum AFP—the rate of decline can be determined. Various methods have demonstrated that a rapid decline or early normalization of marker levels is indicative of a good outcome, without any one method achieving widespread acceptance.46–48Nonetheless, the 2010 American Society of Clinical Oncology (ASCO) guidelines on serum tumor markers concluded there was still insufficient evidence to recommend changing therapy solely on the basis of a slow marker decline.49 Rising levels after two cycles of therapy (outside the first week of treatment when rises can be due to tumor lysis) can be considered an indication to change the treatment plan.49,50
Circulating Tumor Cells and Circulating Tumor DNA
Two response endpoints under recent investigation show a potential to detect the impact of therapy. One is the measurement of circulating tumor cells (CTC) in the bloodstream, enriched by one or more capture strategies, including one that has received FDA approval.51 The number of CTCs in the blood has been shown to be prognostic, with higher levels conferring a poor prognosis, and to correlate with a response to therapy. A second approach is the determination of levels of circulating tumor DNA (ctDNA) in the blood. This is detected by quantitating the number of DNA molecules carrying a given mutation or gene rearrangement in the blood, typically detected through targeted sequencing of common mutations, or of a previously identified mutation signature or gene rearrangement. The amount of ctDNA appears to correlate with tumor burden, increases with stage, and in one study, was deemed more sensitive than CTC detection.52–54 Whether these tests will ultimately prove to be more sensitive and accurate than the serum biomarkers discussed previously remains to be determined. Because targeted sequencing can be very sensitive, one concern is that false-positive ctDNA detection may occur after treatment, or intermittently in the setting of enlarging tumor masses. At the least, detection of CTCs and ctDNA is advancing our understanding of cancer biology, as studies reveal evidence of metastatic heterogeneity, clonal heterogeneity, and emergence of resistance mutations in clinical samples.
DETERMINING OUTCOME
The response measures described previously represent different approaches to quantitate tumor burden. What happens after those data are obtained varies depending on the clinical setting. In the community, less emphasis is placed on strict criteria. In the setting of a clinical trial, tumor size is measured and the response categorized. For FDA submission, these are but factors in the risk-benefit equation needed for drug approvals. The FDA conveys full approval to new agents based on true clinical benefit (i.e., an improvement in a survival endpoint or symptom relief).55 Surrogates for clinical benefit, such as response rate, may support either regular approval or accelerated approval, depending on the setting.
Overall Response Rate, Duration of Response, and Stable Disease
Overall response rate (ORR) is the proportion of patients with a tumor size reduction of a predefined amount for a minimum time period. The FDA has generally defined ORR as the sum of PRs and CRs. Although OS remains the gold standard, ORR is often used both in drug development and in clinical practice to indicate antitumor efficacy of a given therapy. Table 30.3 summarizes the attributes and drawbacks of using ORR as a method of assessment. Using standardized definitions of response, it has been shown that ORR often correlates with OS, although ORR usually explains only a fraction of the variability of the survival benefits.56–58 Equally important, however, is the duration of response, a value that is measured from the time of initial response until documented tumor progression, and which assumes added importance when ORR is the endpoint for regulatory approval.

Unlike PR and CR, the FDA has generally not been willing to include stable disease (SD), defined as shrinkage that qualifies as neither response nor progression, as part of the ORR, feeling it is often indicative of the underlying disease biology rather than a drug’s therapeutic effect.55,59 Nevertheless, in reporting data, investigators are increasingly using the term CBR, which includes CR + PR + SD and which is a misuse of the term clinical benefit because neither CR, PR, or SD are objective tumor findings that address the true clinical benefit of a therapy.58,60 In the absence of standardized definitions for SD that are shown to effect meaningful changes in a clinical outcome, SD should not be used as a response endpoint. A better approach is to use nondichotomized response assessments, such as the waterfall plot or one of the kinetic analyses, discussed later.
Progression-Free Survival, Time to Progression, and Time to Treatment Failure
In cancer drug development, one usually finds ORR assessed as an indicator of activity in phase II trials, whereas randomized phase III trials rely on other endpoints such as progression-free survival (PFS) and time to progression (TTP) (see Table 30.3). Although PFS and TTP attempt to assess efficacy in close proximity to a therapy, they score outcomes differently and are not interchangeable. TTP is defined as the time from randomization to the time of disease progression.55 In TTP analyses, deaths are censored either at the time of death or at an earlier visit. In contrast, PFS is defined from the time of randomization to the time of disease progression or death. Although patients who discontinue trial participation for adverse events might be censored in both analyses, patients who die while on study are censored only in the TTP analysis. Those who favor TTP argue that if a patient dies without their tumor meeting criteria for progression, one cannot accurately estimate when progression might have occurred, so the data should be censored. However, those who favor PFS argue that, in some cases, death might be an adverse effect of the therapy. High-dose therapies represent an example of why PFS might be a preferable (regulatory) endpoint. If in a given tumor there is evidence of a dose-response relationship for an active drug, then high doses may have a greater response. However, such high doses may also be responsible for a greater number of deaths. Assessing only those who survive the high dose therapy and ignoring those who die (i.e., TTP) may lead to the conclusion that the high-dose therapy is more effective. The balance sheet that includes death (i.e., PFS) would clearly demonstrate this efficacy came at too great a price.
Although many have argued that PFS and TTP should be acceptable endpoints for cancer clinical trials, in the majority of tumors there is no convincing evidence PFS is a surrogate for OS, and in those where there is some evidence, its value is arguable.61 Table 30.3 presents the attributes and drawbacks of PFS and TTP. Note that the definition of progression is often difficult, particularly in some tumor types, and that investigator bias can influence PFS and TTP. Problems with ascertainment bias and censoring, depicted in Figure 30.2, can also impact outcomes.

Alternate endpoints include time to treatment failure (TTF), defined as a composite endpoint measuring time from randomization to discontinuation of treatment for any reason, including disease progression, treatment toxicity, and death. The FDA has not recommended TTF as a regulatory endpoint for drug approval. However, the high rates of censoring due to toxicity seen in phase III clinical trails may lead to a reassessment of this position given that most can agree that not only is efficacy important, but so too is tolerability, and TTF can capture both of these attributes.
Overall Survival
Defined as the time from randomization to death, OS has been considered the gold standard of clinical trial endpoints (see Table 30.3). In part, this is so because it is unambiguous and does not suffer from interpretation bias. An additional advantage of the survival endpoint is that it can balance the effect of therapies with high treatment-related mortality even if tumor control is substantially better with the new treatment. However, some worry that because patients may receive multiple lines of therapy following the clinical trial, the results may be confounded by those subsequent therapies. The latter concern is often cited as the reason why an advantage in PFS/TTP disappears when one looks to OS. But as a review of clinical trials confirms,62 the magnitude of the difference does not disappear, only the statistical validity (Fig. 30.3).63,64

When evaluating a randomized controlled trial, it is important that the OS as well as the PFS analyses are always by intention to treat (ITT). In an ITT analysis, often described as once randomized, always analyzed, all patients assigned to a group at the time of randomization are analyzed regardless of what occurred subsequently.65 An ITT analysis avoids the bias introduced by omitting dropouts and noncompliant patients that can negate randomization and overestimate clinical effectiveness.
Kaplan–Meier Plots
In a typical clinical trial, data are often presented as a Kaplan–Meier plots. In discrete time intervals, the number of patients in each group who are progression free and alive (PFS analysis) or alive (OS analysis) at the end of the interval are counted and divided by the total number of patients in that group at the beginning of the time interval. One excludes from this calculation patients censored for a reason other than progressive disease or death during the same interval. This has the advantage that it allows one to include censored patients in estimates of the probability of PFS or OS up to the point when they were censored (i.e., they are excluded only beyond the point of censoring). In most clinical trials, a fraction of patients are typically censored.
In constructing the Kaplan–Meier plot, probabilities are calculated for each interval of time. The probability of surviving progression free or being counted as a survivor to the end of any interval of assessment is the product of the probabilities of surviving in all the preceding assessment intervals multiplied by the probability for the interval of interest. One might ask to what extent the two curves in each study differ. One measure that is of value is the median PFS or OS—a value calculated in most studies from a Kaplan–Meier plot.
Hazard Ratios
Increasingly, however, hazard ratios are cited in preference to the more traditional measures of efficacy such as the median PFS and median OS. However, because a hazard ratio is a value that has no dimensions, it has very limited value, informing the reader only with regard to the reliability and uniformity of the data. It does not quantify the magnitude of the benefit. A physician and, especially, a patient want to know the magnitude of the benefit (i.e., the extent to which a life will be prolonged), not what a dimensionless hazard ratio is. By definition, the hazard ratio is a ratio of the hazard rates. The hazard rate quantifies the likelihood that a patient will experience a hazardous eventor a hazard during a defined interval of observation, and this is expressed as a rate or percent. For example, if during a given period of observation 20 of 100 patients receiving a reference or control therapy experience progression or death, their hazard rate during this interval is 0.2 (20/100). If during this same interval, only 10 of the 100 patients receiving the experimental therapy experience progression or death, their hazard rate is 0.1 (10/100). In this simple example, the hazard ratio for the interval, calculated as the ratio of the hazard ratesis 0.5 (0.1/0.2) and indicates the likelihood of experiencing a hazardous event is reduced by 50% in the experimental arm. As commonly presented, and as this simple example illustrates, the lower the hazard ratio, the better the experimental therapy. To determine whether the hazard ratio has statistical significance, one can (1) use a log-rank test to show that the null hypothesis that the two treatments lead to the same survival probabilities is wrong, or (2) use a parametric approach writing a regression model and fitting the data to the model so that one can establish the hazard ratio for the whole trial and its statistical significance. In many cases, the Cox proportional hazard model is used. Although the ideal hazard ratio would capture the differential benefit throughout the period of study, in practice, the extremes depicted in a Kaplan–Meier plot may not be analyzed.
Forest Plots
Interest in determining whether there is heterogeneity in a treatment effect, such that better outcomes occur in some subgroups, has led to the use of Forest plots to display treatment effects across subgroups. Although simple in concept, these plots are subject to error because subgroups are composed of smaller numbers and the confidence intervals are therefore wider than those for the entire group. The most common presentation includes a vertical line at the no effect point (e.g., a hazard ratio of 1.0), with symbols of varying size representing the subgroups, each with its confidence interval depicted by a line that stretches from the symbol to both sides (the symbol size is usually proportional to the size of the subgroup). If the confidence interval for a subgroup crosses the no effect point, this is commonly interpreted (not necessarily correctly) as a lack of effect in the subgroup. The information one seeks from a Forest plot is whether the effect size for different subgroups varies significantly from the main effect, which is determined by a test for heterogeneity.66
Beyond Dichotomized Data
Quality of Life
The assessment of cancer patients enrolled on a clinical trial can be said to consist of two sets of endpoints: cancer outcomes and patient outcomes. Cancer outcomes measure the response of the tumor to treatment, the duration of the response, the symptom-free period, and the early recognition of relapse. In contrast, patient outcomes assess the benefit achieved with a given therapy by measuring the increase in survival and the quality of life (QOL) before and after therapy. Unfortunately, physicians tend to concentrate on cancer-related outcomes, often neglecting assessments of QOL. Although a QOL assessment in clinical settings is possible with currently available instruments, there must be continued development and refinement of these instruments. Such development must focus not only on extracting valuable information in an unbiased manner, but also and equally important, developing an instrument that is user friendly and will be completed in a high percentage of encounters.
Waterfall Plots
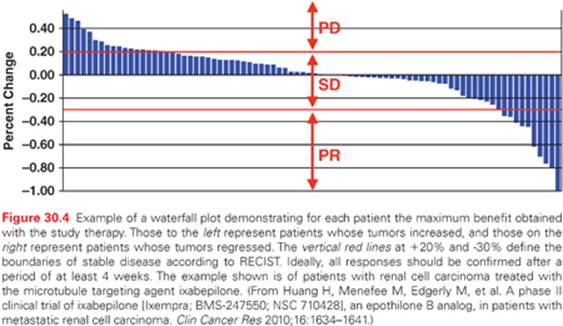
The arbitrary nature of the 50% cutoff set by Moertel and Hanley and its evolution to the current RECIST threshold of 30% reduction in the size of the maximum diameter raises valid queries as to why 30% is valuable and not 29% or 25%. On this background, waterfall plots such as the one shown in Figure 30.4 have become increasingly popular because they depict the benefit or lack thereof in all patients as a continuum of response, rather than a dichotomized response rate.67 Waterfall plots can be generated from any quantitative assessment. If ctDNA or tumor cells prove to be as quantitative as hoped, the maximum decline could be plotted as a waterfall plot.
Growth Kinetics
Efforts to quantify tumor kinetic parameters from clinical data have been investigated in recent years. Different equations have been applied to describe the two-phase curve based on tumor size as observed in most solid tumor trials, where there is first shrinkage followed by regrowth (Fig. 30.5). These models show exponential tumor shrinkage after treatment, followed by tumor regrowth that is either exponential or linear and have been shown to correlate with OS and to discriminate effective therapies as well as individual patients within trials.68–73 A major advantage is that more of the data are used, relative to dichotomized response assessment, and regression or growth rates can be determined even in patients who are censored in a Kaplan–Meier analysis. Equations that model both regression and growth rates confirm the clinical intuition that resistant disease is emerging even as overall tumor volume is reduced. Further, “the strategy of studying tumor growth kinetics circumvents one weakness of ‘progression criteria,’ which is that they inherently dichotomize a complex biological process that may be better characterized using a continuous function.”74 As shown in Figure 30.5, the response of a tumor to a therapy is exemplified by the nadir, the time to the nadir, and the time to progression or PFS, and these are all are all dependent on the growth rate.

REFERENCES
1. America’s Biopharmaceutical Research Companies. Medicines in Development for Cancer. PhRMA Web site. http://www.phrma.org/sites/default/files/pdf/phrmamedicinesindevelopmentcancer2012.pdf.
2. Moertel CG, Hanley JA. The effect of measuring error on the results of therapeutic trials in advanced cancer. Cancer 1976;38:388–394.
3. Miller AB, Hoogstraten B, Staquet M, et al. Reporting results of cancer treatment. Cancer 1981;47:207–214.
4. Therasse P, Arbuck SG, Eisenhauer EA, et al. New guidelines to evaluate the response to treatment in solid tumors. European Organization for Research and Treatment of Cancer, National Cancer Institute of the United States, National Cancer Institute of Canada. J Natl Cancer Inst 2000;92:205–216.
5. Eisenhauer EA, Therasse P, Bogaerts J, et al. New response evaluation criteria in solid tumours: revised RECIST guideline (version 1.1). Eur J Cancer 2009;45:228–247.
6. Mazumdar M, Smith A, Schwartz LH. A statistical simulation study finds discordance between WHO criteria and RECIST guideline. J Clin Epidemiol 2004;57:358–365.
7. Wen PY, Macdonald DR, Reardon DA, et al. Updated response assessment criteria for high-grade gliomas: response assessment in neuro-oncology working group. J Clin Oncol 2010;28:1963–1972.
8. Byrne MJ, Nowak AK. Modified RECIST criteria for assessment of response in malignant pleural mesothelioma. Ann Oncol 2004;15:257–260.
9. Wolchok JD, Hoos A, O’Day S, et al. Guidelines for the evaluation of immune therapy activity in solid tumors: immune-related response criteria. Clin Cancer Res 2009;15:7412–7420.
10. Quant EC, Wen PY. Response assessment in neuro-oncology. Curr Oncol Rep 2011;13:50–56.
11. Hawkins-Daarud A, Rockne RC, Anderson AR, et al. Modeling tumor-associated edema in gliomas during anti-angiogenic therapy and its impact on imageable tumor. Front Oncol 2013;3:66.
12. Fink J, Born D, Chamberlain MC. Pseudoprogression: relevance with respect to treatment of high-grade gliomas. Curr Treat Options Oncol 2011;12:240–252.
13. Lin NU, Lee EQ, Aoyama H, et al. Challenges relating to solid tumour brain metastases in clinical trials, part 1: patient population, response, and progression. A report from the RANO group. Lancet Oncol 2013;14:e396–e406.
14. Mabille M, Vanel D, Albiter M, et al. Follow-up of hepatic and peritoneal metastases of gastrointestinal tumors (GIST) under Imatinib therapy requires different criteria of radiological evaluation (size is not everything!!!). Eur J Radiol 2009;69:204–208.
15. Liu L, Wang W, Chen H, et al. EASL- and mRECIST-evaluated responses to combination therapy of sorafenib with transarterial chemoembolization predict survival in patients with hepatocellular carcinoma. Clin Cancer Res 2014; 20:1623–1631.
16. Cheson BD, Pfistner B, Juweid ME, et al. Revised response criteria for malignant lymphoma. J Clin Oncol 2007;25:579–586.
17. Bernhard J, Dietrich D, Scheithauer W, et al. Clinical benefit and quality of life in patients with advanced pancreatic cancer receiving gemcitabine plus capecitabine versus gemcitabine alone: a randomized multicenter phase III clinical trial—SAKK 44/00-CECOG/PAN.1.3.001. J Clin Oncol 2008;26:3695–3701.
18. Burris HA, Moore MJ, Andersen J, et al. Improvements in survival and clinical benefit with gemcitabine as first-line therapy for patients with advanced pancreas cancer: a randomized trial. J Clin Oncol 1997;15:2403–2413.
19. Mann BS, Johnson JR, He K, et al. Vorinostat for treatment of cutaneous manifestations of advanced primary cutaneous T-cell lymphoma. Clin Cancer Res 2007;13:2318–2322.
20. von Minckwitz G, Untch M, Blohmer JU, et al. Definition and impact of pathologic complete response on prognosis after neoadjuvant chemotherapy in various intrinsic breast cancer subtypes. J Clin Oncol 2012;30:1796–1804.
21. Cortazar P, Zhang L, Untch M, et al. Pathological complete response and long-term clinical benefit in breast cancer: the CTNeoBC pooled analysis. Lancet 2014 [Epub ahead of print].
22. Bardia A, Baselga J. Neoadjuvant therapy as a platform for drug development and approval in breast cancer. Clin Cancer Res 2013;19:6360–6370.
23. Choi H, Charnsangavej C, Faria SC, et al. Correlation of computed tomography and positron emission tomography in patients with metastatic gastrointestinal stromal tumor treated at a single institution with imatinib mesylate: proposal of new computed tomography response criteria. J Clin Oncol2007;25:1753–1759.
24. Schramm N, Englhart E, Schlemmer M, et al. Tumor response and clinical outcome in metastatic gastrointestinal stromal tumors under sunitinib therapy: comparison of RECIST, Choi and volumetric criteria. Eur J Radiol 2013;82:951–958.
25. Dudeck O, Zeile M, Reichardt P, et al. Comparison of RECIST and Choi criteria for computed tomographic response evaluation in patients with advanced gastrointestinal stromal tumor treated with sunitinib. Ann Oncol 2011;22:1828–1833.
26. Ronot M, Bouattour M, Wassermann J, et al. Alternative response criteria (Choi, European Association for the Study of the Liver, and Modified Response Evaluation Criteria in Solid Tumors [RECIST]) versus RECIST 1.1 in patients with advanced hepatocellular carcinoma treated with sorafenib. Oncologist2014. http://prostatecancer.theoncologist.com/article/alternative-response-criteria-choi-european-association-study-liver-and-modified-response.
27. van der Veldt AA, Meijerink MR, van den Eertwegh AJ, et al. Choi response criteria for early prediction of clinical outcome in patients with metastatic renal cell cancer treated with sunitinib. Br J Cancer 2010;102:803–809.
28. Wahl RL, Jacene H, Kasamon Y, et al. From RECIST to PERCIST: evolving considerations for PET response criteria in solid tumors. J Nucl Med 2009;50:122S–150S.
29. Shankar LK, Hoffman JM, Bacharach S, et al. Consensus recommendations for the use of 18F-FDG PET as an indicator of therapeutic response in patients in National Cancer Institute Trials. J Nucl Med 2006;47:1059–1066.
30. Young H, Baum R, Cremerius U, et al. Measurement of clinical and subclinical tumour response using [18F]-fluorodeoxyglucose and positron emission tomography: review and 1999 EORTC recommendations. European Organization for Research and Treatment of Cancer (EORTC) PET Study Group. Eur J Cancer 1999;35:1773–1782.
31. Kramer-Marek G, Capala J. Can PET imaging facilitate optimization of cancer therapies? Curr Pharm Des 2012;18:2657–2669.
32. Niederkohr RD, Greenspan BS, Prior JO, et al. Reporting guidance for oncologic 18F-FDG PET/CT imaging. J Nucl Med 2013;54:756–761.
33. Liu Y, Litière S, de Vries EG, et al. The role of response evaluation criteria in solid tumour in anticancer treatment evaluation: results of a survey in the oncology community. Eur J Cancer 2014;50:260–266.
34. Rubin EH, Allen JD, Nowak JA, et al. Developing precision medicine in a global world. Clin Cancer Res 2014;20:1419–1427.
35. Parkinson DR, McCormack RT, Keating SM. Evidence of clinical utility: an unmet need in molecular diagnostics for cancer patients. Clin Cancer Res 2014;20:1428–1444.
36. Buyse M, Sargent DJ, Grothey A, et al. Biomarkers and surrogate end points—the challenge of statistical validation. Nat Rev Clin Oncol 2010;7:309–317.
37. Karam AK, Karlan BY. Ovarian cancer: the duplicity of CA125 measurement. Nat Rev Clin Oncol 2010;7:335–339.
38. Rustin GJ, van der Burg ME, Griffin CL, et al. Early versus delayed treatment of relapsed ovarian cancer (MRC OV05/EORTC 55955): a randomised trial. Lancet 2010;376:1155–1163.
39. Vergote I, Rustin GJ, Eisenhauer EA, et al. Re: new guidelines to evaluate the response to treatment in solid tumors [ovarian cancer]. Gynecologic Cancer Intergroup. J Natl Cancer Inst 2000;92:1534–1535.
40. Guppy AE, Rustin GJ. CA125 response: can it replace the traditional response criteria in ovarian cancer? Oncologist 2002;7:437–443.
41. Rustin GJ, Quinn M, Thigpen T, et al. Re: New guidelines to evaluate the response to treatment in solid tumors (ovarian cancer). J Natl Cancer Inst 2004;96:487–488.
42. Rustin GJ, Vergote I, Eisenhauer E, et al. Definitions for response and progression in ovarian cancer clinical trials incorporating RECIST 1.1 and CA 125 agreed by the Gynecological Cancer Intergroup (GCIG). Int J Gynecol Cancer 2011;21:419–423.
43. Eisenhauer EA. Optimal assessment of response in ovarian cancer. Ann Oncol 2011;22:viii49–viii51.
44. Bubley GJ, Carducci M, Dahut W, et al. Eligibility and response guidelines for phase II clinical trials in androgen-independent prostate cancer: recommendations from the Prostate-Specific Antigen Working Group. J Clin Oncol 1999;17:3461–3467.
45. Scher HI, Halabi S, Tannock I, et al. Design and end points of clinical trials for patients with progressive prostate cancer and castrate levels of testosterone: recommendations of the Prostate Cancer Clinical Trials Working Group. J Clin Oncol 2008;26:1148–1159.
46. Mazumdar M, Bajorin DF, Bacik J, et al. Predicting outcome to chemotherapy in patients with germ cell tumors: the value of the rate of decline of human chorionic gonadotrophin and alpha-fetoprotein during therapy. J Clin Oncol 2001;19:2534–2541.
47. Fizazi K, Culine S, Kramar A, et al. Early predicted time to normalization of tumor markers predicts outcome in poor-prognosis nonseminomatous germ cell tumors. J Clin Oncol 2004;22:3868–3876.
48. Toner GC. Early identification of therapeutic failure in nonseminomatous germ cell tumors by assessing serum tumor marker decline during chemotherapy: still not ready for routine clinical use. J Clin Oncol 2004;22:3842–3845.
49. Gilligan TD, Seidenfeld J, Basch EM, et al. American Society of Clinical Oncology Clinical Practice Guideline on uses of serum tumor markers in adult males with germ cell tumors. J Clin Oncol 2010;28:3388–3404.
50. Albers P, Albrecht W, Algaba F, et al. EAU guidelines on testicular cancer: 2011 update. Eur Urol 2011;60:304–319.
51. Yap T, Lorente D, Omlin A, et al. Circulating tumor cells: a multifunctional biomarker. Clin Cancer Res 2014;20:2553–2568.
52. Dawson SJ, Tsui DW, Murtaza M, et al. Analysis of circulating tumor DNA to monitor metastatic breast cancer. N Engl J Med 2013;368:1199–1209.
53. Punnoose EA, Atwal S, Liu W, et al. Evaluation of circulating tumor cells and circulating tumor DNA in non-small cell lung cancer: association with clinical endpoints in a phase II clinical trial of pertuzumab and erlotinib. Clin Cancer Res 2012;18:2391–2401.
54. Bettegowda C, Sausen M, Leary RJ, et al. Detection of circulating tumor DNA in early- and late-stage human malignancies. Sci Transl Med 2014;6:224ra24.
55. Pazdur R. Endpoints for assessing drug activity in clinical trials. Oncologist 2008;13:19–21.
56. Buyse M, Thirion P, Carlson RW, et al. Relation between tumour response to first-line chemotherapy and survival in advanced colorectal cancer: a meta-analysis. Meta-Analysis Group in Cancer. Lancet 2000;356:373–378.
57. Bruzzi P, Del Mastro L, Sormani MP, et al. Objective response to chemotherapy as a potential surrogate end point of survival in metastatic breast cancer patients. J Clin Oncol 2005;23:5117–5125.
58. Vidaurre T, Wilkerson J, Simon R, et al. Stable disease is not preferentially observed with targeted therapies and as currently defined has limited value in drug development. Cancer J 2009;15:366–373.
59. McKee AE, Farrell AT, Pazdur R, et al. The role of the U.S. Food and Drug Administration review process: clinical trial endpoints in oncology. Oncologist 2010;15:13–18.
60. Ohorodnyk P, Eisenhauer EA, Booth CM. Clinical benefit in oncology trials: is this a patient-centred or tumour-centred end-point? Eur J Cancer 2009;45:2249–2252.
61. Buyse M. Use of meta-analysis for the validation of surrogate endpoints and biomarkers in cancer trials. Cancer J 2009;15:421–425.
62. Wilkerson J, Fojo T. Progression-free survival is simply a measure of a drug’s effect while administered and is not a surrogate for overall survival. Cancer J 2009;15:379–385.
63. Reck M, von Pawel J, Zatloukal P, et al. Overall survival with cisplatin-gemcitabine and bevacizumab or placebo as first-line therapy for nonsquamous non-small-cell lung cancer: results from a randomised phase III trial (AVAiL). Ann Oncol 2010;21:1804–1809.
64. Hortobagyi GN, Gomez HL, Li RK, et al. Analysis of overall survival from a phase III study of ixabepilone plus capecitabine versus capecitabine in patients with MBC resistant to anthracyclines and taxanes. Breast Cancer Res Treat 2010;122:409–418.
65. Hennekens C, Buring J. Epidemiology in Medicine. 1st ed. Boston: Little, Brown and Co.; 1987.
66. Cuzick J. Forest plots and the interpretation of subgroups. Lancet 2005;365:1308.
67. Huang H, Menefee M, Edgerly M, et al. A phase II clinical trial of ixabepilone (Ixempra; BMS-247550; NSC 710428), an epothilone B analog, in patients with metastatic renal cell carcinoma. Clin Cancer Res 2010;16:1634–1641.
68. Stein WD, Gulley JL, Schlom J, et al. Tumor regression and growth rates determined in five intramural NCI prostate cancer trials: the growth rate constant as an indicator of therapeutic efficacy. Clin Cancer Res 2011;17:907–917.
69. Stein WD, Wilkerson J, Kim ST, et al. Analyzing the pivotal trial that compared sunitinib and IFN-α in renal cell carcinoma, using a method that assesses tumor regression and growth. Clin Cancer Res 2012;18:2374–2381.
70. Maitland ML, Wu K, Sharma MR, et al. Estimation of renal cell carcinoma treatment effects from disease progression modeling. Clin Pharmacol Ther 2013;93:345–351.
71. Claret L, Girard P, Hoff PM, et al. Model-based prediction of phase III overall survival in colorectal cancer on the basis of phase II tumor dynamics. J Clin Oncol 2009;27:4103–4108.
72. Claret L, Gupta M, Han K, et al. Evaluation of tumor-size response metrics to predict overall survival in Western and Chinese patients with first-line metastatic colorectal cancer. J Clin Oncol 2013;31:2110–2114.
73. Wang Y, Sung C, Dartois C, et al. Elucidation of relationship between tumor size and survival in non-small-cell lung cancer patients can aid early decision making in clinical drug development. Clin Pharmacol Ther 2009;86:167–174.
74. Oxnard GR, Morris MJ, Hodi FS, et al. When progressive disease does not mean treatment failure: reconsidering the criteria for progression. J Natl Cancer Inst 2012;104:1534–1541.
75. Team RDC. R: A language and environment for statistical computing. R Foundation for Statistical Computing. Vienna, Austria: R Foundation for Statistical Computing, 2010. http://www.r-project.org.