
Chung-Han Lee
Two different fluorophores are used to label the cells
X-Axis FITC
Y-Axis APC
96.4% of cells are high for FITC labeled marker
3.58% of cells are high for both APC & FITC labeled markers (Transfus Sci 1995;16:303)
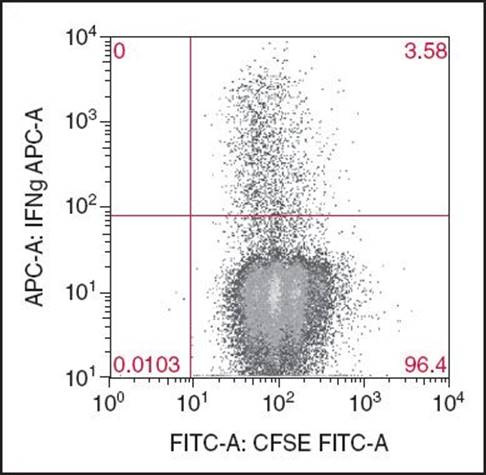
Figure 5-3 Example of Flow Cytometry Data
Clinical Applications in Hematology/Oncology
• Phenotypic characterization of leukemia & lymphomas
• Measurement of DNA content & proliferation markers (Ki-67, proliferating cell nuclear antigen (PCNA))
• Histocompatibility cross-matching
• HLA-B27 detection
• Immunodeficiency studies (CD4, CD8)
• Isolating progenitor cells (CD34) (Clin Chem 2000;46:1221)
Sources of False Negatives with Flow Cytometry
• Sampling error
Rare in liquid samples, but possible w/tissue samples such as touch preps
• Cell loss during processing
Large cells (large lymphoid cells, plasma cells) more likely to be lost
Samples from smears/touch preps should be compared to cytospin
• Rare neoplastic cells
Marginal zone lymphoma—neoplasm hidden among reactive B cells
Min. residual disease detection requires screening of 500000–1000000 cells, typical clinical lab screens 30000–100000 cells
• Neoplastic cell difficult to identify
Abn B cells lacking CD20 overlooked after anti-CD20 Rx
B cells lacking surface Igs (Blood 2008;111:3941)
Immunophenotyping of NonHodgkin Lymphoma
• B vs. T cell neoplasm
Pan-B Ags (CD19, CD20, CD79a, PAX5)
Pan-T Ags (CD2, CD3, CD5, CD7, & negative for B-cell Ags)
• Morphologically/clinically stratify B & T cell neoplasms
B cell neoplasm: Small cells, medium cells, large cells, cutaneous
T cell neoplasm: Anaplastic, cutaneous, extranodal, nodal
• B cell neoplasms
