
19
I. OVERVIEW
The functions and design of the cardiovascular system are, in many ways, similar to that of a water utility in a modern city. A water utility is tasked with distributing clean water to its many consumers. The distribution network is vast, and pumping stations are required to ensure that water arrives at sufficiently high pressure for adequate flow from faucets and showerheads (Figure 19.1). Waste water is collected and returned to treatment plants under low pressure by an elaborate system of drains. The cardiovascular system similarly distributes blood at high pressure to ensure adequate flow to many consumers (cells). Waste (venous) blood travels back to the heart at low pressure for “treatment” by the lungs. Water utilities distribute water, a Newtonian fluid whose flow cha racteristics behave predictably under pressure. The cardiovascular system circulates blood, a viscous non- Newtonian fluid comprising water, solutes, proteins, and cells. Considerable pressure must be applied to blood in order to make it flow through the vasculature at rates sufficient to meet the needs of the tissues. The capillaries used to deliver blood to individual cells are extremely leaky, unlike the copper pipe used in household water- distribution systems. Leakiness means that the pressure used to drive flow through the system also drives fluid out of the vasculature and into the intercellular spaces. Lastly, the pipe-work used to distribute and collect blood from cells is composed of biologic tissue that stretches and causes the vessels to distend when pressure is applied. Distensibility poses a threat to system function because there is always the potential that the entire vascular contents might become trapped in the pipes, thereby allowing the vascular faucets to run dry.
II. VASCULATURE
The systemic vasculature comprises a vast network of blood vessels that channel O2-rich blood to within a few microns of every cell in the body. Here, O2 and nutrients are exchanged for CO2 and other metabolic waste products, and then blood is returned to the heart for reoxygenation by the lungs and redistribution to the tissues. Figure 19.2 provides an overview of the systemic vasculature and its various components.
A. Organization
The human body contains ~100,000,000,000,000 cells, every one of which must be supplied with blood. Creating a vascular distribution network that is capable of such a task requires extensive branching of the vascular tree. Thus, blood leaves the left ventricle (LV) via a single large-diameter vessel (the aorta), which then branches repeatedly to yield ~10,000,000,000 tiny capillaries. The branching pattern greatly increases vascular cross-sectional area, from ~4 cm2 (aorta) to ~4,000 cm2 total at the level of the capillaries (Figure 19.3). Blood flow velocity drops proportionally. Blood exits the LV at up to ~50 cm/s, but velocity has dropped to <1 mm/s by the time blood reaches the capillaries. A low flow rate greatly increases the time available for exchanging materials between blood and tissues during blood's passage through capillary beds. Note that whereas arteries and veins are arranged in series with each other, capillaries are organized in parallel circuits (see Figure 19.2). This vascular arrangement has important physiologic consequences, as discussed in Section IV below. Blood travels back to the heart via venules, which join and fuse to form veins. Smaller veins merge to form larger veins, each fusion decreasing the total cross-sectional area of the system.
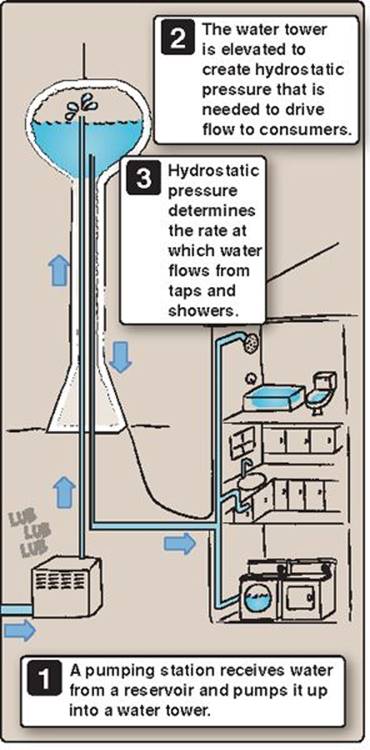
Figure 19.1
Hydrostatic pressure drives flow through plumbing systems.
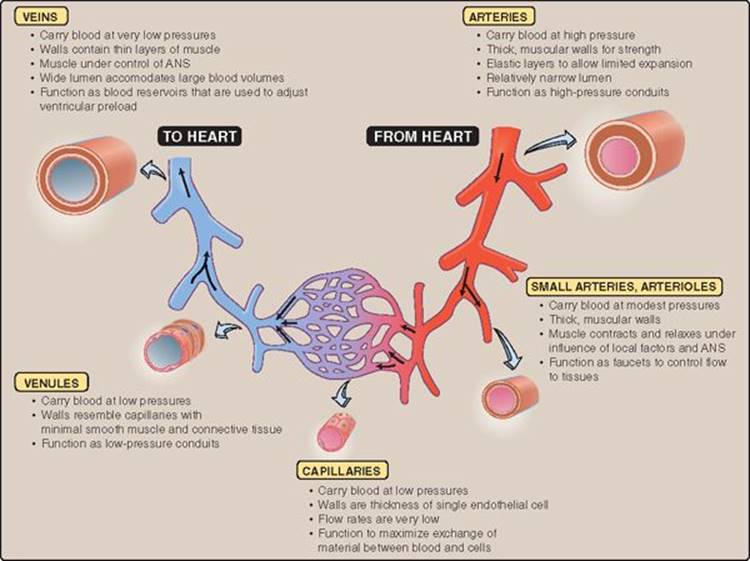
Figure 19.2
Properties and functions of the vessels comprising the systemic vasculature. ANS = autonomic nervous system.
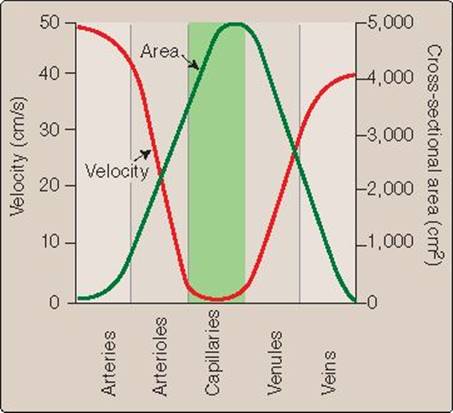
Figure 19.3
Blood velocity and vessel cross-sectional area across the systemic vasculature.
B. Anatomy
Blood vessels all have a common structure, although vessel wall thickness and composition varies with vessel function and its location within the vasculature. The lining of all blood vessels consists of a single layer of endothelial cells (the tunica intima) as shown in Figure 19.4. Arteries and veins also contain layers of vascular smooth muscle cells ([VSMCs] the tunica media) that modify vessel diameter when they contract or relax. Extensive networks of cross-linked elastic fibers give all vessels except capillaries and venules the ability to stretch like a rubber hose when blood pressure is raised. Elastic fibers have a central core of coiled elastin and an outer covering of microfibrils composed of glycoproteins. Blood vessels also contain collagen fibers that resist stretching and limit vessel expansion when internal pressures rise. A thin outer layer of connective tissue (the tunica adventitia) maintains vascular integrity and shape.

Figure 19.4
Blood vessel structure.
C. Vessels
A blood vessel's primary function is to provide a conduit for blood flow to and from cells. The different vessel classes (i.e., arteries, capillaries, veins) have additional important functions reflecting their location within the vasculature. Arteries are high-pressure conduits, arterioles are flow regulators, capillaries facilitate exchange of materials between blood and tissues, and venules and veins have a reservoir function.
1. Large arteries: The arterial system comprises a network of narrow-bore distribution vessels (see Figure 19.2). Arteries must carry blood at high pressure (Figure 19.5), so their walls are thick and their lumens narrow, which limits arterial system capacity. The walls of the larger arteries (also called elastic arteries) contain smooth muscle layers and are rich in elastin fibers. The muscle layers have a resting tone, which limits arterial distensibility and helps maintain the pressure of the blood within.
2. Small arteries and arterioles: The walls of the smallest arteries and arterioles are dominated by their smooth muscle layers. Collectively known as resistance vessels, they act as faucets or stopcocks to control blood flow to capillaries (Figure 19.6). When tissue demand for O2 and nutrients is high, the VSMCs relax, and flow to the tissues increases. A decreased demand for blood or intervention by the central nervous system constricts the muscular “faucets,” and flow to the tissues is reduced (see 20·II).
3. Capillaries: Capillaries bring blood to within 30 μm of virtually every cell in the body. They are designed to keep the blood contained within the vasculature while simultaneously maximizing the opportunity for exchange of materials between blood, interstitium, and tissues. Their walls are the thickness of a single endothelial cell plus the basal lamina. In some tissues, capillaries permit direct communication between blood and cells via transmural pores (fenestrations) and junctional clefts between adjacent cells (Figure 19.7).
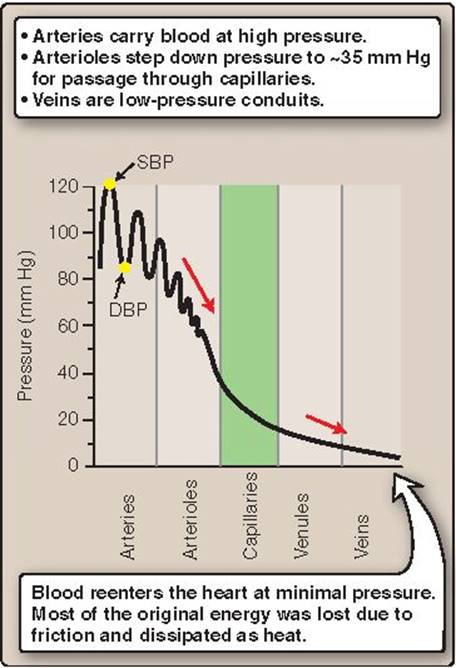
Figure 19.5
Perfusion pressures across the systemic vasculature. DBP = diastolic blood pressure; SBP = systolic blood pressure.

Figure 19.6
Vascular faucets regulate blood flow. SNS = sympathetic nervous system.
Although capillaries average only 1 mm in length and 8–10 μm in diameter, they provide a total surface area for exchange of 500–700 m2 in an average adult.
4. Venules and veins: Venules and veins are low-pressure conduits for blood to make its way back to the heart. Smaller venules are almost indistinguishable from capillaries, which allows them to participate in fluid and metabolite exchange. Venules widen and fuse with each other as they progress toward the heart. Larger venules contain VSMCs within their walls, but far fewer than those seen in vessels of equivalent size in the arterial system. The paucity of muscle means that vein walls are thin (see Figure 19.2), making them highly distensible and able to accommodate large volumes of blood. Under resting conditions, ~65% of total blood volume resides in the venous compartment, creating a reservoir that is used to sustain ventricular preload when the need arises (see 20·V). The larger veins contain valves that help maintain unidirectional flow through the system and counter the tendency of blood to be pulled downward under the influence of gravity.
III. BLOOD FLOW DETERMINANTS
Blood will not flow through the vasculature unless it is forced to do so by application of pressure, which is required to overcome a resistance to flow. Understanding the origins of this resistance is important clinically because it is a primary indicator of cardiovascular status and health. For example, whereas resistance usually goes up during circulatory shock, septic shock is associated with a profound decrease in vascular resistance (see 40·III·C). The source of resistance is considered in the Poiseuille law:

Figure 19.7
Capillary wall structure.
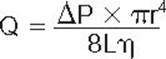
where Q denotes flow, ΔP is the pressure gradient across the ends of the vessel, r is internal radius, L is vessel length, and η is the viscosity of blood. Whereas pressure drives flow, radius, length, and viscosity all contribute to flow resistance.

Figure 19.8
Effects of constriction on flow through a resistance vessel.
A. Vessel radius
Vessel radius is the primary determinant of vascular resistance. Radius is also a variable because the VSMCs that make up the walls of the small arteries and arterioles contract and relax as a way of controlling flow. Because flow is proportional to r4, a twofold change in radius causes a 16-fold change in flow. The potency of radius's effect on flow relates to a layer of plasma that clings to the inner surface of all vessels. The layer forms through interactions between blood and the vascular endothelium and, in so doing, impedes flow. Although the depth of the coating layer is essentially the same in all vessels irrespective of bore size, its contribution to total cross-sectional area is much greater in a small-diameter vessel than in a large one, and, therefore, resistance to flow through a small vessel is correspondingly larger (Figure 19.8).
B. Vessel length
Blood flow through a vessel is inversely related to vessel length, again reflecting blood's tendency to interact with the vascular endothelium. Vessel length does not change physiologically and is not considered further.
C. Blood viscosity
Blood is a complex fluid, whose viscosity varies with flow. A fluid's viscosity is measured relative to water. Adding electrolytes and organic molecules (including proteins) to water raises viscosity from 1.0 cp to ~1.4 cp. Cells, principally red blood cells (RBCs), have the greatest impact, with viscosity rising at a greater-than-exponential rate with hematocrit (Figure 19.9).
1. Hematocrit: Hematocrit measures the percentage of whole blood volume that is occupied by RBCs. Hematocrit is determined clinically by centrifuging a tube containing a small blood sample to separate cells from plasma. Hematocrit can then be estimated from the height of the packed RBC layer within the tube, which is dependent on both RBC number and volume. Normal values for hematocrit range between 41%–53% for males and 36%–46% for females.
A hematocrit that falls below a normal range indicates anemia. Anemia is more usually defined in terms of hemoglobin (Hb) levels, however. Normal Hb values for males range from 13.5–17.5 g/dL, 12.0–16.0 g/dL in females.

Figure 19.9
Relationship between hematocrit and blood viscosity. cp = centipoise; RBC = red blood cell.
2. Flow resistance: RBCs increase flow resistance by rubbing up against the vessel wall. RBCs travel through capillaries measuring only 2.5 μm in diameter, which is surprising given that these blood cells are typically pictured as 8-μm diameter disks (Figure 19.10). RBCs readily distort, however, which allows them to slip through narrow vessels. They also travel in the center of the vessel, which minimizes interactions with the endothelium. Even so, the heart must still expend significant energy to overcome the resistance associated with friction between RBCs and vessel walls.
Cells can be likened to plastic bags filled with water. Like bags, most cells rupture when deformed mechanically. RBCs more closely resemble plastic bags that are only partially filled with water. They deform easily, which allows them to squeeze through narrow vessels and pores. RBCs swell and deform less readily as they age, which allows the body to target them for destruction. Disposal occurs in the spleen, where RBCs are forced through a filter made of connective tissue fibrils (splenic cords). Young, flexible RBCs pass through the filter with relative ease, but older RBCs become trapped and are then phagocytosed.

Figure 19.10
Red blood cell flexibility.
3. Anemia: Anemia is associated with a decrease in RBC number. Blood viscosity and flow resistance decreases also. Physiologic anemias occur when blood volume is expanded faster than RBC production, such as during pregnancy (see 37·IV·C) or exercise training.
4. Polycythemia: Increasing RBC numbers increases blood viscosity and resistance to flow. People living at high altitude demonstrate a physiologic polycythemia stimulated by reduced atmospheric O2levels. Although increased RBC production helps compensate for reduced O2 availability, the tradeoff is increased workload on the heart, limiting the altitude at which humans can comfortably exist to around 5,000 m.
IV. HEMODYNAMIC OHM LAW
Vascular resistance represents afterload to the LV and determines how hard it must work to generate output. If resistance increases, the heart is forced to work harder to compensate. A healthy heart is well equipped to meet the demands placed on it by changes in vascular resistance under normal conditions, but increased resistance can seriously stress a diseased heart. For this and other reasons, it is important to be able to quantify vascular resistance in a clinical setting. Identifying and summing all of the individual components that make up vascular resistance in a typical human is not feasible. As an alternative, vascular resistance can be estimated with relative ease from knowledge of pressure and flow using a modified version of the Ohm law (Figure 19.11A). The Ohm law describes the effects of electrical resistance (R) on current flow (I) in a DC circuit:
Clinical Application 19.1: Polycythemia Vera
Polycythemia vera is a neoplastic disorder affecting myeloid red blood cell (RBC) precursors. The disease causes uncontrolled RBC production, and hematocrit (HCT) climbs accordingly. Polycythemia is defined by a HCT of >48% in females and >52% in males.
Once HCT reaches around 60%, the RBCs are so closely packed that they collide with each other and begin forming aggregates and clots. Cohesion is dependent on fibrinogen and other large plasma proteins that coat the RBC surface. Viscosity and vascular resistance increases to such a degree that the left ventricle is unable to generate sufficient pressure to maintain even basal flow rates. Patients typically present with headaches, weakness, and dizziness associated with decreased cerebral perfusion. A common complaint is relentless pruritis (skin itching) after taking a warm bath.
Left untreated, the median survival time is 6–18 months. This improves to >10 years if treated with serial phlebotomy, optimally reducing HCT to <42% in females and <45% in males. The main risk factors are thrombotic events (i.e., stroke, deep vein thromboses, myocardial infarction, and occlusion of peripheral arteries).

Figure 19.11
The Ohm law.

where V is the voltage drop across the resistance. The hemodynamic form of the Ohm law is thus:

Where Q is blood flow, P is the pressure gradient across a vascular circuit, and R is vascular resistance (see Figure 19.11B). As discussed above, R is defined by vessel radius, length, and blood viscosity (R = 8Lη ÷ πr4). The hemodynamic form of the Ohm law makes it possible to calculate R for any vessel or vascular circuit, regardless of its size, from measurements of pressure and flow.
A. Systemic vascular resistance
The largest circulation in the body and the one with the greatest resistance is the systemic circulation. The value of systemic vascular resistance ([SVR] also known as total peripheral resistance) is calculated as


Figure 19.12
Derivation of mean arterial pressure. DBP = diastolic blood pressure; SBP = systolic blood pressure.
where MAP − CVP represents the pressure difference between the aorta (mean arterial pressure [MAP]) and vena cavae (central venous pressure[CVP]). MAP is a time-averaged value that recognizes that arterial pressure rises and falls in step with the cardiac cycle (Figure 19.12). MAP is calculated as

where SBP = systolic blood pressure and DBP = diastolic blood pressure (SBP − DBP is also known as pulse pressure). Using typical normal values for MAP (95 mm Hg), CVP (5 mm Hg), and CO (6L/min), SVR is calculated to be 15 mm Hg·min·L−
SVR typically varies between 11 and 15 mm Hg·min·L−1 in an average person. SVR may also be expressed clinically in units of dyn·s·cm−5, calculated by multiplying the values above by 80. Thus, a normal SVR range is between ~900 and 1,200 dyn·s·cm−
Pulmonary vascular resistance (PVR) can be calculated in a similar manner (by using mean pulmonary artery and left atrial pressures), amounting to ~2–3 mm Hg·min·L−1 (150–250 dyn·s·cm−5) in an average person.
B. Serial and parallel circuits
Hemodynamic circuits are treated in the same way as electrical circuits when calculating the combined resistance of multiple individual components (Figure 19.13). The total resistance (RT) of a circuit containing three resistors (R1 − R3) arranged in series is equal to the sum of the individual components. If each of the resistors below has a resistance of 10 units, RT = 30 units.
RT = R1 + R2 + R3 = 10 + 10 + 10 = 30
Calculating the total resistance of the same three resistors arranged in parallel requires that the reciprocal of each component be summed (see Figure 19.13): 1 _

Note that RT of the parallel circuit is 3.3 units, significantly less than that of any individual component. Thus, even though the systemic circulation contains approximately 1010 capillaries that individually have a very high resistance to flow, their parallel arrangement means that their combined resistance is relatively low.
Adding capillaries to a vascular circuit causes SVR to decrease, not increase, because they provide additional pathways for blood flow (see Figure 19.13).

Figure 19.13
Calculating the resistance of vascular circuits.
V. LIMITS TO THE POISEUILLE LAW
The Poiseuille law helps identify the sources of flow resistance in the cardiovascular system, but system complexity limits its application to smaller arterial vessels and to capillaries. Confounding cardiovascular design features include the predilection for turbulent flow, the fact that blood viscosity is velocity dependent, and the compliance of blood vessels.
A. Turbulence
When blood flows through the vasculature, it experiences drag caused by its various components interacting with the vessel wall. As discussed above, the vascular endothelium is coated with a layer of immobilized plasma. This coating exerts drag on blood that is flowing closer to the center of the vessel, creating another slowed layer that exerts its own drag, and so on toward the center of the vessel. Thus, flow through vessels occurs in concentric layers that slip over each other, with fastest flow at the center and slowest up against the walls of the vessel. This flow pattern is referred to as laminar or streamline flow (Figure 19.14). Laminar flow is observed in most regions of the cardiovascular system, and the Poiseuille law is valid for as long as it is maintained. When streamline flow is disrupted, kinetic energy is squandered on chaotic motion, a pattern known as turbulence (Figure 19.15).
1. Reynolds equation: The likelihood of turbulence can be predicted using the Reynolds equation:
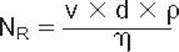

Figure 19.14
Laminar blood flow.
where NR is Reynolds number, v is mean blood velocity, d is vessel diameter, ρ (rho) is blood density, and η is blood viscosity. Blood density does not change within the parameters of normal human physiology. Many blood vessels constrict and relax and hence their internal diameter changes constantly, but not to the extent that they cause turbulence in vivo. Velocity and viscosity are both physiologically relevant variables, however.
2. Blood velocity effects: Turbulence is most likely to be observed within the heart chambers or within the vessels that enter and leave the heart. These are regions where large volumes of blood are moving at high flow velocities. Turbulence occurs once a certain critical velocity is achieved, causing orderly streamline flow to become chaotic and inefficient.
3. Equation of continuity: Congenital and pathologic heart valve defects are common causes of turbulence. The aortic valve is located in a high-pressure, high-velocity region of the cardiovascular system where it is subject to constant wear and tear. It is not uncommon for the valve leaflets to calcify and stiffen with age, or perhaps fuse along their commissures as a result of repeated inflammation. Such changes reduce the cross-sectional area of the valve orifice and obstruct outflow. Because CO has to be maintained at a basal 5–6 L/min regardless of circumstance, left ventricular pressure increases and drives flow at higher velocity through the narrowed outlet (Figure 19.16). The extent to which velocity is increased by stenosis is defined by the equation of continuity:

Figure 19.15
Streamline and turbulent flow. RBC = red blood cell.
Q = vnl × Anl = vs × As
where Q is flow, vnl and vs are flow velocities through normal and stenotic valves, respectively, and Anl and As are valve cross-sectional areas. If Q is constant and As is reduced, velocity must increase to compensate.
4. Sounds: Turbulent flow creates crosscurrents and eddies and causes kinetic energy to be expended when blood impacts the vessel wall. Impacts cause vibrations that travel to the body surface where they can be heard as sounds. Common examples encountered clinically include murmurs and Korotkoff sounds.
a. Murmurs: Blood being forced at high velocity through a stenotic aortic or pulmonary valve yields a systolic murmur. Valves that fail to close completely also produce murmurs. Such murmurs are caused by blood being forced backward through an incompetent valve and impacting blood contained within the atria or ventricles (see Clinical Application 18.1).
b. Korotkoff sounds: Turbulence can be induced artificially for diagnostic purposes. Partial occlusion of the brachial artery with a pressure cuff causes murmurs that reflect blood being ejected at high velocity through the compressed area and impacting the column of blood beyond. These murmurs (Korotkoff sounds) can be heard with a stethoscope placed downstream of the cuff. Sounds are first heard when cuff pressure drops just below SBP, allowing small amounts of blood to jet through the occluded artery. The murmurs typically disappear when cuff pressure drops below DBP and the artery is fully patent. These sounds thereby provide a convenient way of approximating SBP and DBP.
5. Hematocrit: Because blood velocity is inversely related to viscosity and hematocrit, anemia can also increase the likelihood of turbulence. For example, the physiologic anemia that accompanies pregnancy causes functional murmurs, sounds associated with ejection of blood at high velocity through a normal valve (see 37·IV·C).
6. Occurrence of turbulence in vivo : In an ideal system, turbulence can be expected when NR exceeds 2,000. When NR is below 1,200, laminar flow prevails. The cardiovascular system is less than ideal. Many factors, especially the extensive branching that is inherent to the vascular tree, lower the threshold for turbulence to around 1,600. Vessel branches disrupt laminar flow and create foci for local eddy currents to form.
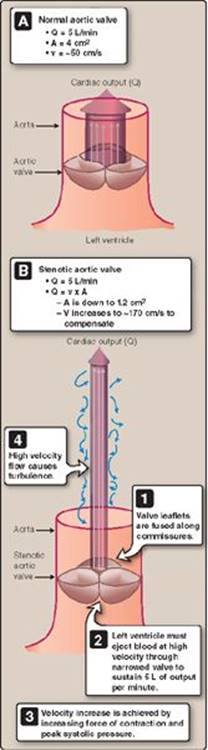
Figure 19.16
Effect of aortic stenosis on ventricular ejection velocity. A = area; Q = flow; v = ejection velocity.
Clinical Application 19.2: Thrombi and Anticoagulation Therapy
The tendency for red blood cells to aggregate in regions where flow velocity is low is of serious clinical concern because such aggregates can lead to thrombus formation. Thrombi are blood clots adhered to a vessel wall. Thrombi may break loose to form emboli, which then travel through the vasculature until they encounter and become lodged in a vessel that is too small to travel through. In a healthy person, thrombi can form during prolonged periods of immobility such as during long-haul airplane flights. Cramped cabins and hard seats restrict mobility and compress the vasculature that returns blood from the lower extremities. Blood that is trapped within the deep veins of the legs may form deep vein thromboses. Disembarkation restores flow and dislodged emboli may then travel through the venous system to the right side of the heart and become lodged in the pulmonary vasculature (pulmonary embolism).
Atrial fibrillation (AF) and heart valve replacement also puts patients at risk of thrombus formation. AF prevents orderly contraction and flow through the atria, creating regions of blood stagnation within the affected chamber. Prosthetic (“mechanical”) heart valves may also allow pockets of stagnation to form behind their leaflets, increasing the incidence of thrombus formation. If this valve is located on the left side of the heart, a freed embolus potentially can enter the cerebral vasculature and cause a stroke. Thrombi formation can be reduced in AF and mechanical valve replacement patients by oral anticoagulants such as warfarin (trade name Coumadin).1 Warfarin is a vitamin-K+ antagonist that prevents formation of several coagulation factors required for clot formation.

Natural and prosthetic aortic valves.
B. Velocity effects
When blood is stationary or barely moving, RBCs have time to adhere to each other and form aggregates that resemble stacks of coins (rouleaux). Aggregates require more effort to move through the circulation than do individual cells, thereby increasing resistance to flow. Rouleaux begin to break apart as flow velocity increases, and viscosity falls in parallel (Figure 19.17).
C. Vessel compliance
The Poiseuille law assumes that blood vessels are rigid tubes. Although smaller vessels (capillaries, arterioles, and small arteries) are relatively nondistensible, most veins and larger arteries expand when internal pressure rises (Figure 19.18). Distensibility invalidates application of the Poiseuille law, but it does provide cardiovascular benefits.
 1For more information on anticoagulants, see LIR Pharmacology, 5e, p. 251.
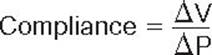
1. Venous reservoir: Distensibility defines the ease with which a vessel swells when filling pressure rises. Recall that veins have thinner walls than arteries. Therefore, although a pressure increase of 1 mm Hg might cause a 1-mL increase in arterial volume, it would cause a similarly sized vein to swell by 6–10 mL. The distensibility of veins means that the venous system as a whole has a much higher compliance or capacitance than does the arterial system, which allows it to function as a blood reservoir. Compliance is a measure of a vessel's ability to accommodate volume (V) when filling pressure (P) increases:
2. Arterial pump: During systole, the ventricle ejects blood into the arterial tree faster than it can be passed on to capillaries. The distensibility of large arteries allows them to expand to accommodate a full ventricular stroke volume (Figure 19.19) and then transmit it to the capillary beds during diastole when the ventricle is relaxing and the aortic valve is closed (diastolic runoff). The energy driving flow during diastole was stored in the elastic elements of the arterial wall by the ventricle during systole. This storage and runoff effect (known as a windkessel) is advantageous in that it evens out pressure and flow through the vasculature over time even though ventricular ejection is overtly phasic.

Figure 19.17
Effects of rouleaux on the pressure required to induce blood flow. RBCs = red blood cells.
Windkessel is German for “air chamber” and refers to a feature of early fire engine design. Prior to invention of the internal combustion engine, fire engines were horse drawn and hand operated. In the event of fire, water was pumped by hand into the air chamber, causing pressure to develop within. Pressurized water from the windkessel was then directed from a hose at the fire. The inclusion of the windkessel in the design ensured a continuous, steady stream of water from the hose, even when fire personnel were unable to pump.
3. Age effects: Aging is associated with a stiffening of the vessel walls due to calcification and collagen deposition (arteriosclerosis). Loss of distensibility reduces the amount of blood that can be stored in the arterial system during systole for subsequent diastolic runoff. The LV is forced to make up for this deficit by generating higher pressures to drive increased flow during systole. This pressure manifests as an essential hypertension that is common in older adults.

Figure 19.18
Relative compliance of blood vessels.
VI. EXCHANGE BETWEEN BLOOD AND TISSUES
The primary function of the cardiovascular system is to deliver O2 and nutrients to all cells in the body. Blood is distributed by capillaries, vessels with exceptionally thin walls (~0.5 μm, or the width of an endothelial cell) designed to facilitate diffusional exchange between blood and cells. Blood moves through capillaries very slowly (~1 mm/s), which maximizes the opportunity for exchange during passage. In discussions of how exchange occurs at the cellular level, it is helpful to recognize four general mechanisms: pinocytosis, bulk flow, diffusion via pores, and diffusion via cells (Figure 19.20).
A. Pinocytosis
Pinocytotic vesicles form when the plasma membrane invaginates and pinches off to capture and internalize an extracellular fluid sample. The vesicles then migrate across the vessel wall and release their contents on the opposite side. Pinocytosis is not a major pathway for exchange, but it does provide for transit of large, charged molecules such as antibodies.
B. Bulk flow
Capillaries are typically very leaky, with fenestrations in their walls and clefts between adjacent cells that provide ready pathways for exchange of ions and solutes. Blood entering capillaries is pressurized, so these same pathways allow water and anything dissolved in it to be driven out of the vasculature and into the interstitium. This bulk flow of fluid is not completely unregulated, however. Intercellular junctions typically contain a proteinaceous barrier that both cements cells together and filters fluid as it leaves the blood. Proteins are too large to escape via junctions or pores and remain trapped within the vasculature.

Figure 19.19
Arterial walls expand during systole and then drive flow during diastole. LA = left atrium; LV = left ventricle; SVR = systemic vascular resistance.

Figure 19.20
Four general mechanisms by which materials are exchanged across the capillary wall.
C. Diffusion via fenestrations and pores
The same pathways that allow for bulk flow also provide pathways for simple diffusion of water and other small molecules. Movement is driven by chemical concentration gradients between blood, interstitium, and cells.
D. Diffusion across endothelial cells
Lipid-soluble materials cross between blood and interstitium by simple diffusion across endothelial cells and their plasma membranes. This is the primary means by which O2 and CO2 are exchanged.
VII. FLUID MOVEMENT
The leakiness of capillaries is problematic. Blood has to enter capillaries under pressure to ensure that it has sufficient energy to traverse the capillaries and veins and return to the heart, yet this same pressure also drives fluid out of the vasculature (Figure 19.21). The severity of the problem is such that, in the absence of any counter measure, we would lose our entire blood volume to the interstitium within an hour or two!

Figure 19.21
Pressure-induced fluid loss from the vasculature.
A. Vascular water retention
The main force holding water in the blood stream is an osmotic potential that is generated by proteins that are trapped in the blood stream by virtue of their size. Albumin (60,000 MW) is the principal plasma protein (~80% of total), although globulins (140,000 MW) are important also. Proteins help blood retain water through direct osmotic effects, but their many negatively charged groups secondarily attract and concentrate osmotically active cations such as Na+ and K+ (a Donnan effect).
B. Interstitial water retention
The space between blood vessels and cells (the interstitium) contains collagen fibers that provide structural support to tissues, but the bulk of the space is occupied by a dense network of fine proteoglycan filaments (see 4·IV·B·3). Fluid that filters from the bloodstream becomes trapped by these filaments, much as water is trapped by filaments in gelatin (Figure 19.22). The interstitial gel normally contains ~25% of total body water, creating an invaluable fluid reservoir that can be recruited to reinforce vascular volume should the need arise.
C. Lymphatic system
Blood loses several liters of fluid to the interstitium on a typical day, far more than the proteoglycan gel can absorb. It is the lymphatic system's responsibility to retrieve excess fluid and return it to the circulation, along with any proteins that may have escaped the vasculature.

Figure 19.22
Contents of a gelatin desert.
1. Structure: Lymphatic capillaries are simple, blind-ended endothelial cell tubes that arise in the interstitium (Figure 19.23). Adjacent endothelial cells overlap to create flap valves that allow fluid influx but discourage retrograde flow, and protein filaments tethered to the cell margins maintain vessel patency
2. Flow: The larger lymphatic vessels are structurally similar to veins. They contain valves that help maintain unidirectional flow, and their walls contain smooth muscle layers that contract spontaneously in response to rising fluid pressure within. Contraction propels lymph onward and simultaneously creates a slight negative pressure within the lymphatic capillaries that allows them to suction fluid and protein from the interstitium. The lymphatics ultimately drain into the left and right subclavian veins.

Figure 19.23
Lymph vessels.
D. Starling forces
Maintaining a balance between the forces governing fluid filtration and reabsorption from the vasculature is vital for continued health. Excess filtration causes edema, whereas an inability to recover filtered fluid can compromise LV preload and MAP. There are four principal Starling forces governing fluid movement, which are related in the Starling law of the capillary:
Q = Kf [(Pc − Pif) − (πc − πif)]
where Q is net fluid flow across the capillary wall, Kf is a filtration coefficient that recognizes that total surface area and permeability of capillary beds varies from tissue to tissue, Pc is capillary hydrostatic pressure, Pif is interstitial fluid pressure, πc is plasma colloid osmotic pressure, and πif is interstitial colloid osmotic pressure.
1. Capillary hydrostatic pressure: Blood enters capillaries at a pressure of ~35 mm Hg. Blood exits capillaries and enters veins at a pressure of ~15 mm Hg (Figure 19.24). Mean capillary hydrostatic pressure (Pc) is typically closer to venous pressure than it is to arteriolar pressure but still is usually a positive pressure that drives fluid out of the capillary and into the interstitium.
2. Plasma colloid osmotic pressure: The main force opposing Pc is the osmotic pressure created by plasma proteins. Values for πc typically average ~25 mm Hg.
3. Interstitial fluid pressure: Pif is typically between 0 and −3 mm Hg normally, due largely to lymphatic suctioning. The lymphatic system does have a finite capacity for fluid removal, however, and if fluid filters from the vasculature faster than it can be removed, the tissue swells. Tissues that are enclosed within skin, bone, or another physical boundary have limited opportunity for expansion, so Pif climbs and can become a significant force driving fluid back into the capillary.
4. Interstitial colloid osmotic pressure: The interstitium always contains a small amount of protein that creates an osmotic pressure of <5 mm Hg favoring fluid movement out of the capillary. The lymphatic system removes proteins along with fluid, but capillaries continually leak proteins via larger fenestrations and intercellular clefts.

Figure 19.24
Hydrostatic pressure gradient across the length of a capillary. πc = plasma colloid osmotic pressure.
Clinical Application 19.3: Lymphatic Filariasis
Lymphatic filariasis results from infection by one of three parasitic nematodes, most commonly Wuchereria bancrofti (>90% of total). Also known familiarly as elephantiasis, infection can cause gross disfiguration of the legs, arms, and genitalia. The infection is suggested to affect as many as 120 million individuals worldwide and is endemic in the developing regions of Asia, Africa, and South America. Infection occurs by way of a mosquito bite, which injects its host with larval nematodes. The larvae migrate to and establish themselves in lymphatic vessels, where they mature, mate, and breed to produce microfilariae (larvae). The presence of larvae within the lymphatic vessels interferes with drainage and causes pitting edema. Patients typically are infected in childhood but do not become symptomatic until adulthood after they have accumulated large numbers of parasites during repeated infections. Treatment involves prolonged (>1 year) dosing with antihelminthic drugs such as ivermectin.

Elephantiasis.
E. Starling equilibrium
The balance of forces governing fluid movement across the capillary wall is so perfect that net flow is close to zero in most tissues. Any excess filtrate is returned to the circulation by the lymphatics, which collect <4 L daily. This figure disguises the fact that an additional 16–18 L leaves and is then reabsorbed by capillaries daily. This fluid turnover occurs because of local imbalances between Pc and πc. At the arteriolar end of the capillary, Pc exceeds πc by ~10 mm Hg, causing fluid to filter from the capillary and enter the interstitium. By the time that blood has traversed the capillary, Pc has dropped below πc. Absorption is now favored, and most of the filtered fluid is recovered. The near-precise balancing between filtration and reabsorption across the capillary wall has been termed the Starling equilibrium (Figure 19.25).
VIII. STARLING EQUILIBRIUM DISTURBANCES
Because water traverses the capillary wall so easily, disturbances in the Starling equilibrium can rapidly cause large amounts of fluid to leave the bloodstream and enter the interstitium, or vice versa. This feature is put to good use in several aspects of cardiovascular design.
A. Renal circulation
Kidneys cleanse blood of surplus water, electrolytes, and various waste products. As shown in Figure 19.26, blood arrives at the glomerulus, a specialized renal capillary network, at pressures that greatly exceeds πc (Pc =?60 mm Hg; see 25·III·A). The pressure excess causes 180 L/day of protein- and cell-free fluid to filter into the Bowman space. Most of the water and essential ions and other solutes are later recovered, leaving waste products concentrated in urine.

Figure 19.25
The Starling equilibrium. Pc = capillary hydrostatic pressure; πc = plasma colloid osmotic pressure.
B. Pulmonary circulation
Mean pulmonary vascular pressures are far lower than in the systemic circulation. Pc for pulmonary capillaries averages 7 mm Hg (compare with ~25 mm Hg in the systemic circulation). πif tends to be higher (~14 mm Hg), but the net driving force for fluid movement is still directed inward (Figure 19.27). This is advantageous because it ensures that the lungs remain relatively fluid free. Fluid accumulating in the pulmonary interstitium and alveolar sacs would interfere with O2 and CO2 exchange.
C. Decreased blood volume
The interstitium contains 10 L of fluid on average. This represents a readily accessible fluid reservoir that can be recruited by the vasculature to support CO when circulating blood volume decreases. Causes include hypohydration (hypohydration occurs when fluid intake is insufficient to replenish the amount lost through sweating, for example) and hemorrhage. The heart maintains MAP by drawing down the venous blood reservoir. Hydrostatic pressure on the venular side of the capillary falls as a result, causing the pressure gradient across the capillary to steepen. With πc now dominating along much of the capillary's length, the Starling forces favor fluid recovery from the interstitium. Circulating blood volume rises as a result (Figure 19.28).
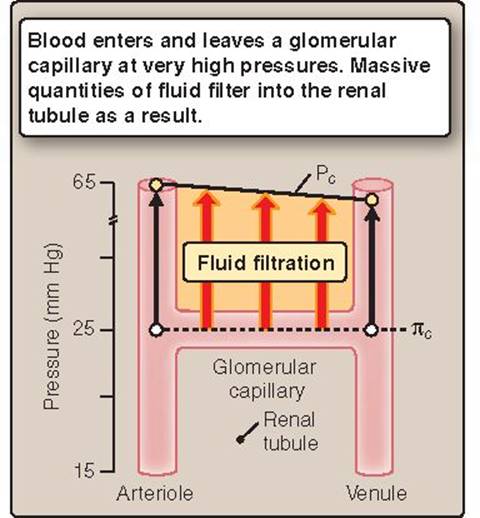
Figure 19.26
Fluid filtration from renal glomerular capillaries. Pc = capillary hydrostatic pressure; πc = plasma colloid osmotic pressure.
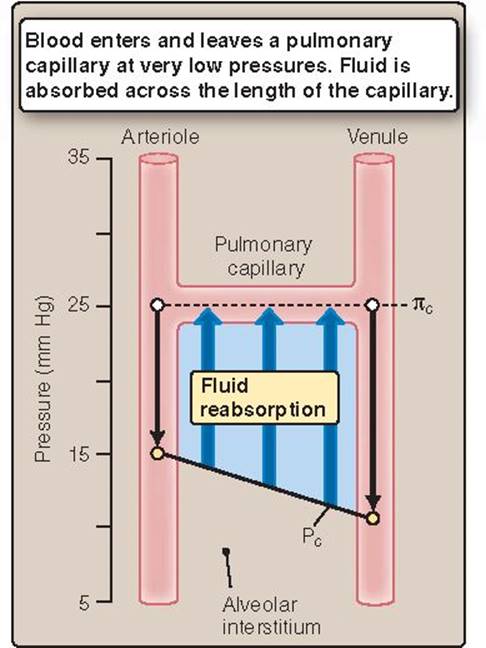
Figure 19.27
Fluid absorption by pulmonary capillaries. Pc = capillary hydrostatic pressure; πc = plasma colloid osmotic pressure.

Figure 19.28
Use of Starling forces to recruit fluid from the interstitium. Pc = capillary hydrostatic pressure; πc = plasma colloid osmotic pressure.
Clinical Application 19.4: Congestive Heart Failure
Edema is encountered frequently in a clinical setting, and there are many causes. One of the most common is congestive heart failure. Left ventricular failure presents as an inability to maintain arterial pressure at levels that ensure adequate tissue perfusion. The body compensates by retaining fluid (see 20·IV) to increase circulating blood volume and raise central venous pressure (CVP). The enhanced preload helps compensate for the failure-induced decrease in output through the Frank-Starling mechanism, but raising CVP flattens the hydrostatic pressure gradient across the capillary. The lymphatic system helps compensate for large quantities of fluid that now filter from the vasculature into the interstitium, but the tendency for edema (tissue congestion) is increased greatly. Initially, this may manifest as swelling of the feet and ankles, but in the later stages of failure, pulmonary edema may occur also.

Excess fluid filtration causes edema during congestive heart failure.
Pc = capillary hydrostatic pressure;
πc = plasma colloid osmotic pressure.
Chapter Summary
• Blood travels through several different classes of vessel once it leaves the heart.
• Arteries and arterioles are thick-walled, narrow-bore vessels designed to carry blood under high pressure. The smaller arteries and arterioles contract and relax in order to modulate flow to the capillaries.
• Capillaries are simple tubes of endothelial cells designed to facilitate exchange of materials between blood and tissues.
• Veins are low-pressure drainage vessels with thin walls and a high capacity that allows them to function as a blood reservoir.
• The heart pumps blood at high pressure to overcome several factors that resist flow. These are summarized in the Poiseuille law, which states that flow is proportional to the pressure gradient driving flow, vessel radius to the fourth power, and the inverse of vessel length and blood viscosity.
• Vessel radius is the main determinant of vascular resistance, which is why the smaller arteries and arterioles (resistance vessels) control flow so effectively through contraction and relaxation. Blood viscosity is largely a reflection of hematocrit.
• Estimates of flow resistance recognize that several factors can invalidate the Poiseuille law, including the fact that blood viscosity changes with flow velocity, the occurrence of turbulence, and vessel capacitance.
• Viscosity increases when red-cell density is high or flow rates are low, and cells are given an opportunity to aggregate. Aggregates increase resistance to flow. Turbulent flow is less efficient than streamline flow because kinetic energy is dissipated through chaotic motion. It usually only occurs in regions of the cardiovascular system where flow velocities are high such as when blood is forced through a heart valve. Vessel capacitance relates to a tendency to distend when filling pressure is increased. Distensibility allows arteries to store blood under pressure during systole and then release it to the capillary beds during diastole (diastolic runoff). The high capacitance of veins allows them to function as a blood reservoir for use when cardiac output increases or to help sustain arterial pressures when circulating blood volume decreases.
• Capillaries leak fluid continually through pores, fenestrations, and junctions between adjacent endothelial cells, driven by hydrostatic pressure. Some of this fluid is trapped by a proteoglycan gel that fills the interstitium. The gel gives up fluid to support circulating blood volume when needed. Most filtered fluid is returned to the circulation by osmotic forces associated with plasma proteins (albumin and globulins) that are trapped in the vasculature by virtue of their large size. Excess filtrate is returned to the vasculature by the lymphatic system.
• Disturbances in the forces that control fluid movement across the capillary wall (the Starling equilibrium) can have serious repercussions. Increases in venous pressure can raise net capillary hydrostatic pressure to the point where filtered fluid overwhelms the lymphatics. The result is edema.
• Decreases in capillary hydrostatic pressure allow fluid to be pulled from the interstitium. This provides a means of supporting cardiac output during a circulatory emergency.