
20
I. OVERVIEW
The volume of blood contained within the cardiovascular system represents only around 20% of its total capacity. Carrying a limited blood volume has clear energetic advantages, but such frugality requires that flow to the different organs be carefully metered with an eye to the needs of the system as a whole if cardiovascular catastrophe is to be avoided. The threat stems from the cardiovascular system's absolute dependency on pressure to drive flow. Just as a broken main in a city's infrastructure can deprive consumers of fresh water, uncontrolled flow through a low-resistance circuit (e.g., an exercising muscle) can cause perfusion pressure and flow through the vasculature to drop precipitously (Figure 20.1). Because some tissues (e.g., the brain and heart) are highly dependent on sustained arterial blood flow for normal function, loss of arterial pressure is a potentially fatal event. Thus, although the cardiovascular system includes flow regulators (resistance vessels) that can be operated by the tissues themselves if their nutrient needs increase, it also incorporates mechanisms by which the central nervous system (CNS) can monitor and maintain arterial pressure by reapportioning flow for the benefit of the system as a whole.
II. VASCULAR CONTROL
The cardiovascular system functions very much like a public water utility. Pumping stations ensure that there is always sufficient volume and pressure in the mains to supply consumer needs. Consumers typically do not leave taps running, but rather turn them on and then off as their need to bathe or fill kettles has been satisfied. Consumers recognize that fresh water is a valuable commodity and that the supplies are limited. Similarly, resistance vessels allow tissues (the consumers) to draw arterial blood from the cardiovascular system on the basis of metabolic need. Resistance vessels are located at key positions within the vasculature and, hence, they are subject to a multitude of controls. Four general control mechanisms can be recognized: local, central (neural), hormonal, and endothelial.
A. Local
All tissues are able to regulate their blood supply through local control of resistance vessels. Flow is tied to tissue need. Increased activity causes the resistance vessels to dilate, and blood flow increases proportionately. If supply exceeds prevailing needs, the resistance vessels constrict reflexively. There are two broad classes of local control mechanisms: metabolic and myogenic.

Figure 20.1
Pressure is required to drive flow through vessels.
1. Metabolic: Cells continually release various metabolic byproducts, including adenosine, lactate, K+, H+, and CO2. When tissue activity increases, metabolites are produced in greater quantities, and interstitial concentrations rise (Figure 20.2). Resistance vessels lie close to the cells they serve and are sensitive to the appearance of these metabolites in the extracellular fluid. Some metabolites act directly on vascular smooth muscle cells(VSMCs), whereas others act through endothelial cells, but all cause the VSMCs to relax and the vessel to dilate. Blood flow increases as a result, simultaneously providing the tissues with the nutrients they need and also carrying away metabolites (Figure 20.3). When activity ceases, metabolite concentrations fall, and a reflex vasoconstriction again matches flow with need.
2. Myogenic: Resistance vessels in many circulations constrict reflexively when intraluminal pressures rise. Contraction is mediated by stretch-activated Ca2+ channels in the VSMC membranes and may protect capillaries from surges in arterial pressure. Postural changes can cause sudden gravity-induced pressure spikes of >200 mm Hg in the pedal vasculature, for example.

Figure 20.2
Metabolic control of resistance vessels.
B. Physiologic consequences
Local and myogenic control mechanisms operate independently of external influence, which frees the CNS from having to micromanage circulatory control. This autonomy manifests in several ways, including flow autoregulation and hyperemia.
1. Autoregulation: Autoregulation is the intrinsic ability of an organ to maintain stable blood flow in the face of changing perfusion pressures (Figure 20.4). If arterial pressure increases suddenly (e.g., during a pressure spike), flow increases also. Metabolites are washed away faster than they are produced, and the resistance vessels constrict reflexively. The myogenic response potentiates this effect, so that over the course of several seconds, flow rates are restored to levels approximating those observed prior to the pressure change. Conversely, a sudden drop in arterial pressure leads to reflex vasodilation, and flow is restored within a few seconds. When presented graphically (see Figure 20.4B), pressure extremes are seen to overwhelm the resistance vessels’ autoregulatory powers, but flow remains relatively stable over a wide range of pressures.
2. Hyperemia: Active hyperemia is a normal vasodilatory response to increased tissue activity (Figure 20.5). Muscles also demonstrate postexercise hyperemia, a period of increased blood flow that persists even after activity has ceased. This reflects a time during which metabolite levels are still high, and the muscles are repaying oxygen debts that were accumulated during exercise (see 39·VI·C).

Figure 20.3
Metabolic control concept map.
C. Central control
All resistance vessels are innervated by the sympathetic nervous system (SNS). When arterial pressure falls, SNS nerve terminals release norepinephrine onto the VSMCs, causing them to contract. Contraction is mediated by α1-adrenergic receptors via the inositol trisphosphate (IP3) transduction pathway, causing Ca2+ release from the sarcoplasmic reticulum (see 1·VII·B·3).
D. Hormonal control
Many circulating hormones modulate resistance vessels, including antidiuretic hormone (ADH), angiotensin II (Ang-II), and epinephrine.
1. Antidiuretic hormone: ADH, also known as arginine vasopressin, is released from the posterior pituitary when tissue osmolarity rises or blood volume decreases (see 28·II·C). Its principal role is in extracellular fluid volume regulation through control of renal water retention, but if circulating levels are sufficiently high (e.g., during hemorrhage), it can vasoconstrict also. ADH affects VSMCs directly via ADH V1 receptors.
2. Angiotensin II: Ang-II is a potent vasoconstrictor. It appears in the bloodstream when renal artery pressure falls, although sympathetic activity can trigger Ang-II release also (see Section IV·C below). Ang-II affects VSMCs directly via AT1A receptors.
3. Epinephrine: Epinephrine is produced and released by the adrenal medulla during SNS activation. Its primary effect is to increase myocardial contractility and heart rate (HR), but it also binds to α1-adrenergic receptors on VSMCs to potentiate the direct SNS- mediated vasoconstriction. Resistance vessels in some circulations (e.g., skeletal) express a β2-adrenergic receptor that mediates epinephrine-mediated vasodilation. In the skeletal vasculature, this pathway may facilitate increased blood flow to muscles during “flight-or-fight” responses.

Figure 20.4
Autoregulation of blood flow.
E. Endothelial control
The endothelial lining of resistance vessels acts as an intermediary for a number of vasoactive compounds, including nitric oxide (NO), prostaglandins (PGs), endothelium-derived hyperpolarizing factor(EDHF), and endothelins ([ETs] Figure 20.6).
1. Nitric oxide: NO is a potent vasodilator that acts on both arteries and veins. Also known as endothelium-derived relaxing factor (EDRF), it is synthesized by a constitutive endothelial NO synthase (eNOS, or Type III NOS), following a rise in intracellular Ca2+ concentrations. NO is a gas with a half-life of less than 10 s in vivo, meaning that its actions remain highly localized. It diffuses through the endothelial cell membrane to adjacent VSMCs and then binds to and activates a soluble guanylyl cyclase. Rising cyclic guanosine monophosphate (cGMP) levels cause cGMP-dependent protein kinase to phosphorylate and inhibit myosin light-chain kinase. It also phosphorylates and increases the activity of a SERCA (SR Ca2+ATPase) pump and causes intracellular Ca2+ concentration to fall. The net result is vasodilation and increased blood flow. NO mediates the actions of many vasodilators, including local modulators; neurotransmitters, such as acetylcholine, substance P, and adenosine triphosphate; bradykinin; thrombin; flow-induced shear stress; and the bacterial endotoxins that cause septic shock.

Figure 20.5
Active hyperemia.
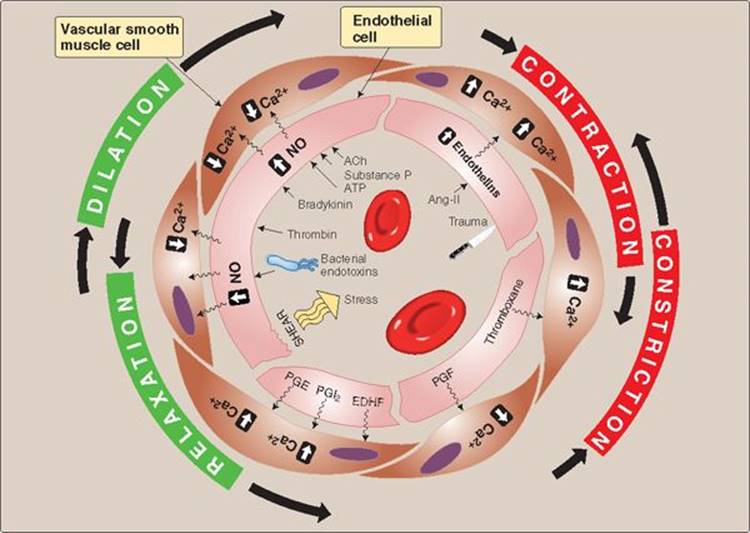
Figure 20.6
Role of endothelium in controlling resistance vessels. ACh = acetylcholine; Ang-II = angiotensin II; ATP = adenosine triphosphate; EDHF = endothelium-derived hyperpolarizing factor; NO = nitric oxide; PGE = prostaglandin E; PGF = prostaglandin F;
PGI2 = prostaglandin I2.
Nitroglycerin and related nitrates are commonly used to relieve the pain of angina pectoris. Angina is caused by inadequate myocardial O2 supply, typically because coronary arteries have become narrowed by plaque (atherosclerosis). Nitrates break down to release NO in vivo, causing arterial and venous vasodilation to lower ventricular after-load and preload, respectively. Reducing cardiac workload restores the balance between oxygen demand and supply and relieves the angina.
2. Prostaglandins: The endothelium is an important source of a number of vasoactive PGs, which it synthesizes from arachidonic acid. PGE (PGE1, PGE2, and PGE3) and PGI2 (prostacyclin) relax VSMCs in many vascular beds, whereas PGF (PGF1, PGF2α, PGF3α) and thromboxane A2 are vasoconstrictors.
3. Endothelium-derived hyperpolarizing factor: EDHF opens K+ channels in the plasma membranes of VSMCs. The ensuing membrane hyperpolarization reduces membrane Ca2+ permeability, causing intracellular Ca2+levels to fall and vasodilation.
4. Endothelins: ETs are a group of related peptides synthesized and released by endothelial cells in response to many factors, including Ang-II, mechanical trauma, and hypoxia. ET-1 is a potent vasoconstrictor that binds to ETA receptors on VSMC membranes and triggers intracellular Ca2+ release via the IP3 pathway (see Figure 20.6).
F. Circulatory hierarchy
The discussions above delineate several mechanisms by which flow to individual vascular beds is regulated. In practice, most of the moment-by-moment control involves a simple weighing of the amount of flow that a tissue needs to support prevailing activity levels versus the amount that the CNS is willing to make available based on the needs of the organism as a whole. Thus, if there is a threat to arterial pressure, the CNS has the ability to deprive certain vascular beds of cardiac output (CO) in an effort to preserve flow to the more important organs. In reviewing the relative ability of the different organs to demand and receive flow, a circulatory hierarchy emerges. At the head of the list are the circulations that supply the brain, myocardium, and skeletal musculature (during exercise). Here, local control mechanisms dominate, and central controls have little or no effect. At the bottom of the hierarchy are organs such as the gut, kidneys, and skin that receive blood flow under optimal conditions, but flow is sacrificed if there is a need to preserve arterial pressure.
The rationale for such a hierarchy can best be understood in evolutionary terms. One of the greatest challenges that the cardiovascular system faces involves intense physical activity, of the kind that might be required for chasing after prey or running away from predators (Figure 20.7). Maintaining optimal flow to the three organs at the top of the hierarchy is critical for sustaining such activities. Meeting the challenge requires that the CNS temporarily divert flow away from organs at the bottom of the hierarchy in order to support the needs of the skeletal musculature (see 39·V). Fortunately, these same organs also have relatively low metabolisms so that their sacrifice does not threaten survival.

Figure 20.7
Blood flow redistribution during exercise.
III. ARTERIAL PRESSURE CONTROL
Survival of the individual requires that pressure be maintained in the arterial system at all times. Because all organs of the body have the ability to demand increased flow, they could easily cause arterial pressure to collapse if their arteriolar supply vessels were not strictly regulated. The cardiovascular system includes two distinct pathways for monitoring and maintaining arterial pressure. The first is fast activating and helps compensate for short-term pressure changes. Known as a baroreceptor reflex (baroreflex), it employs simple feedback loops that include sensors to monitor pressure and flow, an integrator to compare current with preset pressure values, and effector mechanismsthat make any necessary adjustments. A second, slow-activating system manipulates mean arterial pressure ([MAP] see 19·IV·A) through changes in circulating blood volume by modifying renal function (discussed in Section IV below).
A. Sensors
Three main groups of sensors provide the integrator (located in the brainstem medulla) with information about pressure and flow in the cardiovascular system: high-pressure arterial baroreceptors located in the aortic arch and carotid sinus, low-pressure cardiopulmonary receptors, and chemoreceptors.
1. Arterial baroreceptors: The aortic and carotid baroreceptors are the primary means of detecting changes in MAP. They monitor pressure indirectly by responding to arterial wall stretch.
a. Anatomy: Baroreceptors are clusters of bare sensory nerve endings buried within the elastic layers of the aorta and the carotid sinus (Figure 20.8A). Information from the former is relayed to the brain via sensory afferents traveling in the aortic nerve and the vagus nerve (cranial nerve[CN]X). Afferents from the carotid sinus travel in the sinus nerve, which joins with the glossopharyngeal nerve (CN IX) en route to the brainstem.
b. Function: In the absence of stretch, the baroreceptors are inactive. When MAP increases, the walls of the aorta and carotid sinus expand, and the embedded nerve endings are stretched. The nerves respond with graded receptor potentials. If the degree of deformation is sufficiently high, the receptor potentials trigger spikes in the sensory nerve (see Figure 20.8B). Baroreceptors are especially sensitive to changesin pressure, responding to the sharp rise in pressure that occurs during rapid ejection with strong depolarization and a train of high-frequency spikes. During reduced ejection and diastole, the depolarization abates and spike frequency drops to a new steady-state level that reflects diastolic pressure.
c. Sensitivity: Stretch-sensitivity varies from one nerve ending to the next, thereby allowing for responsiveness over a wide pressure range (see Figure 20.8B). The carotid baroreceptors have a response threshold of around 50 mm Hg and saturate at 180 mm Hg. The aortic baroreceptors operate over a range of 110–200 mm Hg.
2. Cardiopulmonary receptors: A second set of baroreceptors is found in low-pressure regions of the cardiovascular system. They provide the CNS with information about the “fullness” of the vascular system, and their principal role is in modulating renal function. However, because fullness correlates with ventricular preload, they also have a role in maintaining MAP.
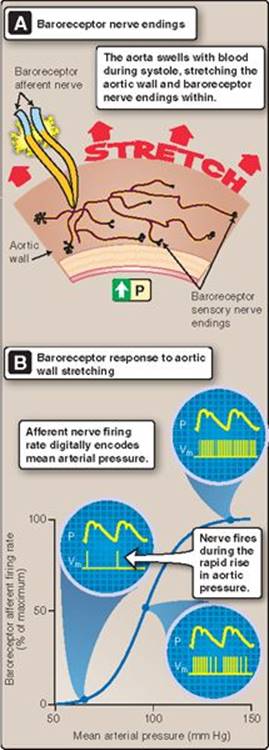
Figure 20.8
Arterial baroreceptors. P = pressure; Vm = membrane potential.
a. Anatomy: The receptors are similar to those found in the arterial system: bare sensory nerve endings embedded in walls of the vena cavae, the pulmonary artery and vein, and the atria. They relay information back to the CNS via the vagal nerve trunk.
b. Function: Atria contain two functionally distinct populations of baroreceptors. A receptors respond to tension that develops in the atrial wall during contraction. B receptors are sensitive to atrial wall stretching during filling. B receptors are also involved in raising HR when central venous pressure (CVP) is high, a response known as the Bainbridge reflex.
3. Chemoreceptors: Chemoreceptors monitor local metabolite levels, which reflect adequacy of perfusion pressure and flow.
a. Anatomy: There are two groups of chemoreceptors, one located in the brainstem medulla, the other peripheral. Peripheral chemoreceptors are discrete, highly vascularized glomus cell clusters lying close to the aortic arch and carotid sinus (the aortic and carotid bodies, respectively) as shown in Figure 20.9. Sensory fibers from the aortic bodies travel in the vagus nerve, whereas nerves from the carotid bodiestravel with the sinus nerve and join the glossopharyngeal trunk en route to the medulla.
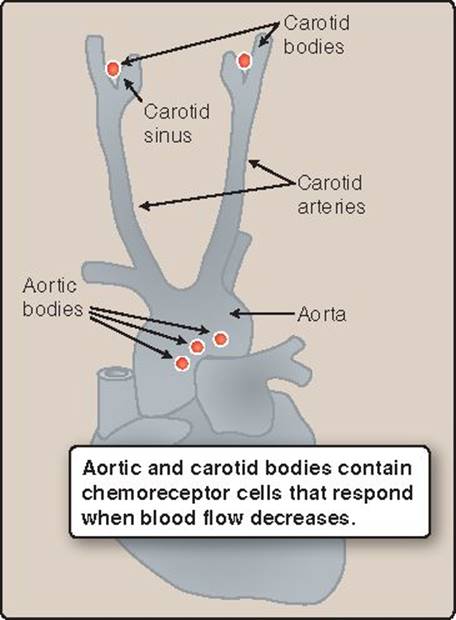
Figure 20.9
Peripheral chemoreceptors.
b. Function: Peripheral chemoreceptors activate when arterial O2 levels fall (<60 mm Hg) or when PCO2 or H+ levels rise (PCO2 > 40 mm Hg or pH <7.4) as shown in Figure 20.10. Medullary chemoreceptors are sensitive to the pH of brain interstitial fluid, which is dependent on arterial PCO2. The chemoreceptors seem designed to monitor lung function and are principally involved in respiratory control (see 24·III), but hypercapnia and acidosis can also reflect low perfusion pressures.
B. Central integrator
The sensory afferents converge on the medulla oblongata. Here, arte rial pressures are compared with preset values and decisions then made about the nature and intensity of a compensatory response.
1. Control centers: The medulla contains a collection of nuclei that together comprise a cardiovascular center. Some cells in this area cause vasoconstriction when active and are known as the vasomotor center. Another group comprises a cardioacceleratory center, which increases HR and myocardial inotropy when activated. A third group slows HR when active (the cardioinhibitory center). The three control centers are interlinked extensively so as to generate a unified response to changes in arterial pressure (Figure 20.11).
2. Feedback loops: Arterial pressure is a product of CO and systemic vascular resistance (SVR) (MAP = CO × SVR), and the control centers adjust both parameters simultaneously. Control is exerted using simple feedback loops (Figure 20.12). Sensory afferents project to the nucleus tractus solitarus within the medulla and synapse with interneurons that, in turn, project to the three control centers (see Figure 20.11). The sensory afferents are all excitatory, but the interneurons may be either excitatory (glutamatergic) or inhibitory (GABAergic). The cardioinhibitory center receives inputs from excitatory interneurons, so this area is excited when MAP is high (a positive feedback loop). The cardioacceleratory and vasomotor centers are innervated by inhibitory interneurons. When MAP is high, they suppress the activity of the nerves that they innervate. Inhibition is required because the cardioacceleratory and vasomotor centers control sympathetic nerves that are tonically active in the absence of external input. This arrangement creates a negative feedback loop between MAP and SNS output.

Figure 20.10
Chemoreceptor function.

Figure 20.11
Organization and output of the medullary cardiovascular control center. CO = cardiac output; HR = heart rate; SVR = systemic vascular resistance.
3. Integration with other central and peripheral pathways: There are numerous inputs to the cardiovascular center from other regions of the brain and periphery.
a. Brainstem: The brainstem also contains a respiratory center that controls breathing. The cardiovascular and respiratory centers work in close cooperation with each other to maintain optimal arterial PO2and PCO2.
b. Hypothalamus: Hypothalamic control centers help coordinate vascular responses to changes in external and internal body temperatures.
c. Cortex: Cortical control centers account for changes in cardiovascular performance induced by emotions (fainting or anticipatory changes associated with exercise, for example).
d. Pain centers: Pain centers can precipitate profound changes in blood pressure by manipulating cardiovascular center output.

Figure 20.12
Cardiovascular feedback loop.
C. Effector pathways
The cardiovascular centers adjust cardiac and vascular function via the ANS. The cardioinhibitory center depresses HR (see Figure 20.11). It acts via parasympathetic fibers traveling in the vagus nerve that target the sinoatrial (SA) and atrioventricular (AV) nodes. The cardioacceleratory and vasomotor centers act via sympathetic nerves. The cardioacceleratory center increases HR by manipulating SA and AV nodal excitability and increasing myocardial contractility. The vasomotor center controls resistance vessels, veins, and adrenal glands.
D. Response
To understand how the various effector pathways work toward a common goal, it is helpful to dissect the ANS response to a sudden drop in arterial pressure. Such events are triggered routinely when climbing out of bed and assuming an erect position (an orthostatic response). When a person stands, blood is forced downward under the influence of gravity and begins to pool in the legs and feet (Figure 20.13). Venous return (VR), CVP, and ventricular preload all fall as a consequence. Stroke volume (SV), CO, and MAP all follow (Figure 20.14). The baroreceptor nerve endings are stretched to a lesser degree and spike frequency in the afferent arm of the reflex pathway falls. Within the cardioinhibitory center, the loss of excitatory input causes withdrawal of parasympathetic output to the SA node and myocardium. Within the two pressor regions of the cardiovascular center, decreased baroreceptor output weakens inhibitory interneuron influence on SNS effector pathways. With the brakes removed, sympathetic nerves now drive up arterial pressure by constricting resistance vessels and veins, increasing myocardial contractility, and increasing HR.
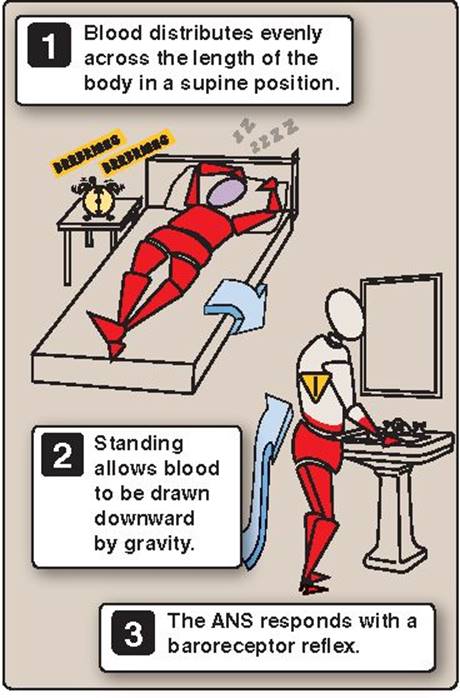
Figure 20.13 Orthostatic reflex. ANS = autonomic nervous system.

Figure 20.14
Baroreceptor reflex. CO = cardiac output; HR = heart rate; LV = left ventricle; MAP = mean arterial pressure; SVR = systemic vascular resistance.
1. Resistance vessels: All resistance vessels are innervated by SNS nerve terminals that cause vasoconstriction when active. SVR increases, and outflow from the arterial tree is reduced as a result.
2. Veins: Veins and larger venules contract when the SNS is active, reducing the capacity of the venous reservoir and causing intravenous pressures to rise. Valves ensure that this pressure increase forces blood forward toward the heart. Here, it increases left ventricular preload (end-diastolic pressure) and increases SV on the next beat.
3. Myocardium: SNS activation increases myocardial contractility by increasing intracellular Ca2+ release. The myocardium now works with increased efficiency and contributes to the increased SV caused by preloading. The SNS also speeds myocardial relaxation rate by increasing the rate at which Ca2+ is released from the contractile machinery and then removed from the sarcoplasm. Faster relaxation times make more time available for preloading during diastole and thereby facilitate a concurrent increase in HR.
4. Nodes: SA and AV nodes are innervated by both parasympathetic and sympathetic nerve terminals, both of which are active at rest. A drop in MAP simultaneously causes parasympathetic activity to be withdrawn and sympathetic activity to increase, accelerating the rate at which SA nodal cell membrane potential slides toward the threshold for action potential formation (phase 4 depolarization; see 17·IV·C). HR and CO are both increased as a result.
Clinical Application 20.1: Orthostatic Hypotension
Orthostatic or postural hypotension is a common complaint of older adults. The condition describes a 10–20 mm Hg drop in arterial pressure that accompanies standing from a sitting position. The resulting decrease in cerebral perfusion pressure leads to momentary lightheadedness, dizziness, weakness, or darkening of the vision. In extreme cases, patients may not be able to rise from a supine position without fainting (syncope). Orthostatic hypotension can be caused by low circulating blood volume, but aging is also associated with a decrease in baroreceptor sensitivity caused by hardening of the arteries (arteriosclerosis). Hardening results from deposition of collagen and other fibrous materials in the arterial wall, which lowers its compliance. Atherosclerosis is a form of arteriosclerosis associated with lipid deposition and plaque formation, which thickens the arterial walls and encroaches on the arterial lumen. The baroreceptor reflex relies on aortic and carotid artery distensibility in order to transduce changes in arterial pressure. Atherosclerosis prevents the sensory nerve endings from detecting the drop in pressure that accompanies translocation of blood to the lower extremities upon standing, and compensatory responses are thus delayed for several seconds.

Intima of a sclerotic aorta scarred by lesions.
5. Adrenal glands: SNS activation causes the adrenal glands to secrete epinephrine into the circulation. Epinephrine binds to the same receptors on blood vessels and the myocardium as does neurally derived norepinephrine.
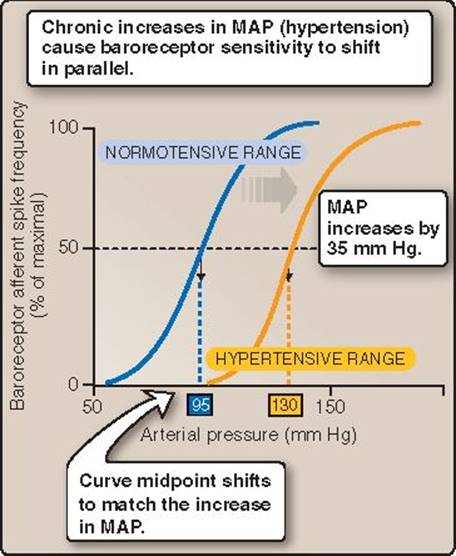
Figure 20.15
Shifts in baroreceptor sensitivity. MAP = mean arterial pressure.
E. Baroreceptor reflex limitations
The baroreceptor reflex is an extremely effective short-term control mechanism, but pressure changes that are sustained for more than a few minutes cause a parallel shift in system sensitivity (Figure 20.15). The advantage to the shift is that it allows the system to retain responsiveness over a wide range of pressures, even if MAP is increased to a level that would previously have saturated the system. The disadvantage is that although the reflex is ideal for moment-by-moment adjustments in arterial pressure, it cannot be used for long-term pressure control (>1–2 days).
IV. LONG-TERM CONTROL PATHWAYS
A drop in arterial pressure activates the baroreceptor reflex outlined above, but it also initiates pathways that require 24–48 hr to become fully effective. These pathways converge on the kidney, which is responsible for long-term control of blood pressure through regulation of vascular fullness (circulating blood volume). Because blood is principally water, this necessarily involves regulation of water output and intake, but it also requires regulation of Na+levels because this is the ion that governs how water partitions between the intracellular and extracellular compartments. These concepts are discussed in more detail in 3·III·B and 28·II and III.
A. Water output
Water output is controlled by ADH, a peptide that is synthesized by the hypothalamus and then transported to the posterior pituitary for release. It stimulates water reabsorption by the renal collecting tubule and collecting ducts. At high concentrations, ADH also increases SVR by constricting resistance vessels (Figure 20.16). Several sensors and pathways regulate ADH release including osmoreceptors, baroreceptors, and Ang - II.
1. Osmoreceptors: The brain contains a number of regions that have the potential to monitor plasma osmolality, including areas surrounding the third ventricle in close proximity to the hypothalamus (see 7·VII·C). Tissue osmolarity is a reflection of total body water and salt concentration. When osmolarity exceeds 280 mOsm/kg, the receptors cause ADH to be released into the circulation.
2. Baroreceptors: A decrease in circulating blood volume causes CVP to fall, which is sensed by the cardiopulmonary receptors. Loss of preload also causes arterial pressure to fall and triggers a baroreceptor reflex. The CNS cardiovascular control centers respond by increasing sympathetic activity and promoting ADH release.

Figure 20.16
Antidiuretic hormone (ADH) effects on blood pressure.
3. Angiotensin II: Activating the renin-angiotensin-aldosterone system (RAAS) causes circulating Ang-II levels to rise. The list of target organs for Ang-II includes the hypothalamus, where it stimulates ADH release.
B. Water intake
Water enters the body along with food, but the bulk of liquid intake occurs through drinking, driven by thirst. The sensation is triggered by decreasing blood volume and arterial pressure, suggesting a prominent role for the cardiovascular control center.
C. Sodium output
Osmoreceptors control water retention and excretion, but they sense the “saltiness” of body fluids rather than water per se. Thus, if tissue osmolality remains high, they will urge retention of water regardless of total accumulated volume. The primary determinant of circulating blood volume is Na+ concentration, which is regulated through RAAS, as described below (Figure 20.17).

Figure 20.17
Renin-angiotensin-aldosterone system (RAAS). ACE = angiotensin-converting enzyme; Ang-I = angiotensin I; Ang-II = angiotensin II; CO = cardiac output; MAP = mean arterial pressure.
1. Renin-angiotensin-aldosterone system: Renin is a proteolytic enzyme synthesized by granular cells in the wall of glomerular afferent arterioles (see 25·IV·C). The cells form a part of the juxtaglomerular apparatus (JGA), which senses and regulates Na+ recovery by the renal tubule. When the JGA is stimulated appropriately, it releases renin into the bloodstream. Here, renin breaks down angiotensinogen (a circulating plasma protein formed in the liver), to release angiotensin I. The latter serves as a substrate for angiotensin-converting enzyme (ACE). ACE is expressed by many tissues, including the kidney, but conversion largely occurs during transit through the lungs. The product is Ang-II, which constricts resistance vessels, stimulates ADH release from the posterior pituitary, stimulates thirst, and promotes aldosterone release from the adrenal cortex.
2. Aldosterone: Aldosterone targets principal cells in the renal collecting tubule epithelium (see 27·IV·B). It has multiple actions, all of which promote recovery of Na+ and osmotically obligated water from the tubule. Aldosterone acts by modifying expression of genes that encode Na+ channels and pumps, which is why it takes up to 48 hours for this pressure control pathway to become maximally effective.
3. Renin : The afferent arteriole of the renal glomerulus is a baroreceptor that triggers renin release from the granular cells when arteriolar pressure falls. Release is potentiated by the SNS, which activates following a drop in MAP.
4. Atrial natriuretic peptide: Atrial myocytes synthesize and store atrial natriuretic peptide (ANP), releasing it when stretched by high filling volumes. ANP has multiple sites of action along the length of the kidney tubule, all of which are geared toward excretion of Na+ and water. The ventricles release a related compound, brain natriuretic peptide, which has similar release characteristics and actions as ANP.
D. Sodium intake
Just as thirst stimulates water intake, salt craving triggers a need to ingest NaCl. Salt appetite is controlled through the nucleus accumbens in the forebrain and is stimulated by aldosterone and Ang-II.

Figure 20.18
Blood distribution within the cardiovascular system.
V. VENOUS RETURN
The long-term arterial pressure-control pathways are all geared toward increasing circulating blood volume. The added volume finds its way to the venous compartment, where it raises CVP and increases left ventricular preload. Preloading produces handsome payoffs in terms of ability to generate and sustain MAP. Blood localizes to the venous compartment because it comprises a system of thin-walled vessels that swell to accommodate volume with little effort. By contrast, the arterial system comprises a series of high-pressure, narrow-bore tubes that have a very limited capacity (~11% of total blood volume) as shown in Figure 20.18. Capillaries are numerous but hold even less blood than do arteries (~4% of total). The cardiopulmonary system also has a very limited capacity. The venous system typically contains >65% of total blood volume (the unstressed blood volume), creating an invaluable reservoir that can be mobilized by venoconstriction for use elsewhere should the need arise. However, the features that make veins a good reservoir also allow them to trap blood and limit VR under certain circumstances. When VR is reduced, CO is reduced also. Thus, any consideration of how the cardiovascular system functions as a unit must include an understanding of the role and limitations of the venous system.
Clinical Application 20.2: Coronary Artery Bypass Grafts
Coronary heart disease (CHD) is a leading cause of death in the western hemisphere. Patient usually present with angina or myocardial infarction caused by coronary artery occlusion, usually as a result of atherosclerosis. Treatment options may include revascularization with coronary artery bypass grafting (CABG or, familiarly, “cabbage”) surgery. Although the walls of veins are much thinner and less muscular than those of arteries, they do have considerable strength. This makes it possible to use them as surrogate coronary supply vessels during CABG. Surgery involves removing a donor vein (usually the greater saphenous leg vein) and grafting a segment between the aorta and a site distal to the occlusion. A grafted vein is reversed in orientation to allow blood to flow freely through the valves.
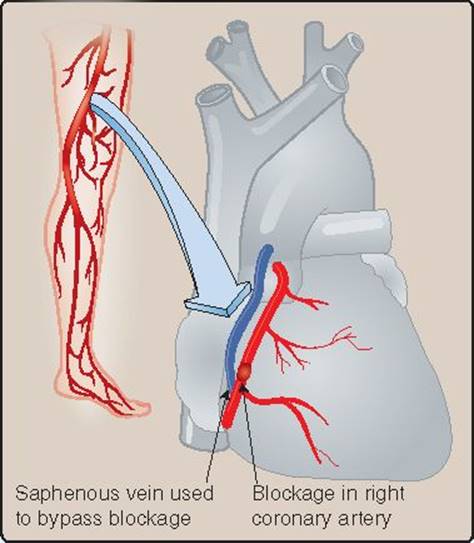
Use of veins for coronary artery bypass grafting.
A. Venous reservoir
Veins have thin walls, which allow these vessels to collapse easily when intraluminal pressures fall (Figure 20.19). Increasing venous pressures by a few mm Hg then causes veins to swell with minimal resistance. Once the system reaches capacity, the vessels have to be stretched to accommodate additional volume. The pressures required to do this are not achieved physiologically.
B. Venoconstriction
Vein walls contain layers of VSMCs that are innervated by and contract during sympathetic activation. However, whereas arteries are capable of contracting down to the point of occlusion, venoconstriction is limited by a vein's unique microanatomy.
1. Vein anatomy: The VSMCs contained within the walls of veins are attached in series with collagen filaments. The filaments are folded and coiled in a relaxed vein, slowly unfolding and tensing as the vessel fills (Figure 20.20). The filaments effectively limit the extent to which internal diameter can be reduced by venoconstriction.
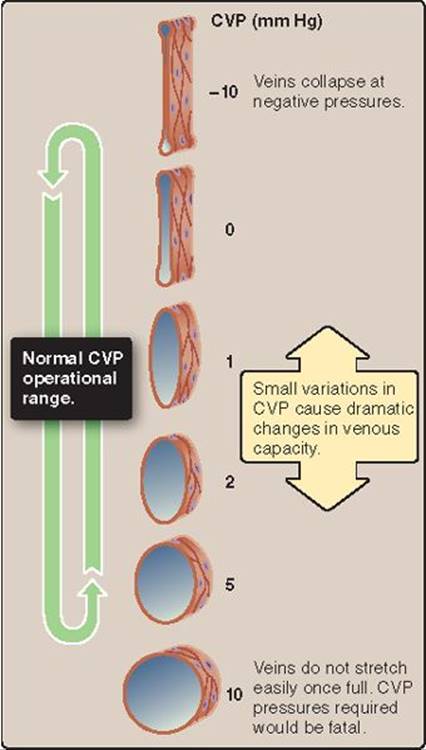
Figure 20.19
Effects of filling pressure on venous capacity. CVP = central venous pressure.

Figure 20.20
Venous reservoir and its mobilization. VSMC = vascular smooth muscle cell.
2. Effects of venoconstriction: Venoconstriction has three principal effects: it mobilizes the blood reservoir, reduces overall capacity, and decreases transit time. It has minimal effect on flow resistance.
a. Mobilization: Venoconstriction raises venous pressure by a few mm Hg and drives blood out of the reservoir. Valves ensure that blood is forced forward toward the heart, where it preloads the left ventricle and increases CO through the Frank-Starling mechanism.
b. Capacity: Venoconstriction decreases the internal diameter of veins and thereby decreases system capacity. Blood that had previously resided in veins is ultimately transferred to the capillary beds that supply active tissues.
c. Transit time: Reducing system capacity reduces the amount of time that blood takes to traverse the system and thereby increases the rate at which it can be reoxygenated and forwarded to active tissues.
d. Resistance: The venous system remains a low-resistance pathway even after sympathetic activation, and there is no significant effect on flow resistance.
C. Venous pump
The high capacity of veins and their tendency to swell in response to even mild filling pressures means that large volumes of blood can easily become trapped in the lower extremities under the influence of gravity. Venoconstriction can reduce system capacity, but, in the absence of any additional motive force, the resultant loss of VR can eventually threaten CO and the ability to maintain arterial pressure. Blood pooling in veins is normally prevented by a venous pump. Whenever skeletal muscles contract, they compress the blood vessels running between the fibers (extravascular compression). Intravenous pressures are low, so compression readily collapses the veins and expels their contents. Valves ensure that resultant flow is in the direction of the heart (Figure 20.21). Rhythmic contraction and relaxation of leg muscles effectively pumps blood upward against gravity, simultaneously “milking” blood from the pedal vasculature and ensuring continued VR.

Figure 20.21
Venous pump.
D. Cardiac output and venous return
The example above demonstrates that CO is limited by the rate at which blood traverses the vasculature. Movement through the vasculature is, in turn, dependent on CO. Thus, a true understanding of how the cardiovascular system functions in vivo requires that the interdependence between CO and VR be appreciated.
1. Return supports output: The preload-dependence of CO is defined by the cardiac function curve (Figure 20.22). Increases in left-ventricular filling pressure increase CO through length-dependent activation, and filling pressure is dependent on CVP. Changes in ventricular inotropy modify this relationship: Positive inotropes shift the curve upward and to the left, whereas negative inotropes shift the curve downward and to the right.
2. Output creates return: Quantifying how CO affects CVP requires that the heart and lungs be replaced with an artificial pump whose output can be controlled (Figure 20.23A). Prior to turning the pump on, normal circulating blood volume (5 L) must be restored. The vasculature stretches when accommodating this much blood, creating a pressure of approximately 7 mm Hg (see Figure 20.23B) known as mean circulatory filling pressure(MCFP). MCFP is defined as the pressure that exists in the vasculature when the heart is arrested, and all parts of the system have come into equilibrium. When the pump is turned on, it translocates blood from the veins to the arteries. Because the arterial compartment has a relatively small volume and outflow is limited by resistance vessels, translocation generates significant pressure within the arterial system. It simultaneously causes CVP to fall because blood is being withdrawn. Driving the pump faster causes CVP to fall further until it finally becomes negative (see Figure 20.23B). At this point, the great veins collapse and limit any additional increases in CO. The plot shown in Figure 20.23B is known as a vascular function curve.

Figure 20.22
Cardiac function curves. CO = cardiac output; CVP = central venous pressure.

Figure 20.23
Dependence of central venous pressure on cardiac output.

Figure 20.24
Vascular function curves.
3. Circulating blood volume: The vascular function curve is dependent on circulating blood volume (Figure 20.24). If blood volume increases, then MCFP necessarily increases also because the vasculature stretches to a greater degree to accommodate the extra volume. When the pump is turned on, CVP falls as before, but, because overall pressure in the system is higher, collapse of the large veins is delayed. Conversely, if circulating blood volume is decreased, then MCFP decreases, and collapse of the great veins occurs at lower output levels.
4. Venous capacity: Venoconstriction and venodilation caused by changes in SNS activity produce similar effects to changes in circulating blood volume. Initiating a baroreflex reduces venous system capacity and MCFP rises. Venodilation reduces system capacity, and MCFP falls.
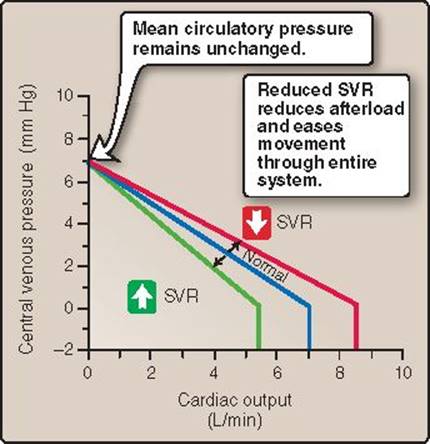
Figure 20.25
Systemic vascular resistance (SVR) effects on vascular function curves.
5. Systemic vascular resistance: Constriction and relaxation of resistance vessels has little or no affect on MCFP because the contribution of the small arteries and arterioles to overall vascular capacity is small. Changes in SVR do impact CVP, however. When resistance vessels constrict, they reduce flow through the capillary beds. This translates into less VR, and CVP falls (Figure 20.25). Conversely, vasodilation allows blood to surge through capillary beds and into the venous system, which raises CVP.
E. Heart and vein interdependence
The cardiac and vascular function curves can be combined to create a single cardiovascular function curve (Figure 20.26). The two plots overlap at an equilibrium point that defines how much CO can be supported by the vasculature for any given contractility and blood volume. In the example shown, the equilibrium point resides at a CVP of 2 mm Hg and a CO of 5 L/min. In the absence of any changes, the system cannot stray permanently from this equilibrium point because 2 mm Hg of pressure is required to support 5 L/min of output, and any increase in CO would drop CVP below 2 mm Hg (Figure 20.27). If HR were suddenly slowed to reduce CO, the reduced amount of blood being translocated from veins to arteries would cause it to dam up in the right atrium, and CVP would rise. CVP equates with preload, so SV and CO would increase on the next beat. Re-equilibration might require several beats to accomplish, but eventually CO and CVP would settle back to 5 L/min and 2 mm Hg.

Figure 20.26
Cardiovascular function curve. CO = cardiac output; CVP = central venous pressure; VR = venous return.
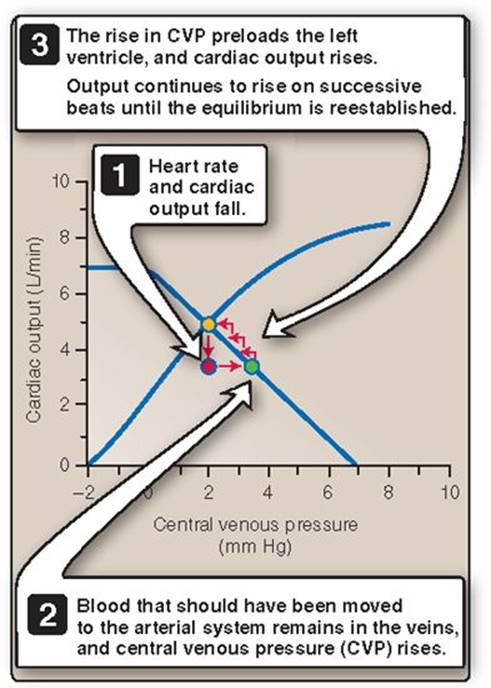
Figure 20.27
Changes in output cannot be sustained away from equilibrium.
F. Moving the equilibrium point
Sustained increases and decreases in CO require that the cardiac function curve and/or vascular function curve be modified to establish a new equilibrium point. The former is accomplished through changes in inotropy, the latter through changes in circulating blood volume.
1. Inotropy: Increasing myocardial inotropy allows the ventricle to pump out more blood on every stroke, even though CVP falls as a consequence. A new equilibrium point is created, as shown in Figure 20.28. Increases in inotropy are typically seen during exercise, for example. Conversely, an infarcted myocardium translocates less blood from the right atrium to the arterial system on every stroke. The new equilibrium point settles at a higher CVP.
2. Circulating blood volume: Transfusing a subject with blood, for example, raises CVP and increases preload, permitting a higher CO in the absence of any change in inotropy. Conversely, hemorrhage reduces preload, and the equilibrium point shifts to a lower value for CO (see Figure 20.28). Similar effects can be achieved acutely with venoconstriction and venodilation, respectively.

Figure 20.28
Cardiovascular function curves.
Chapter Summary
• The capacity of the cardiovascular system greatly exceeds its contents. Blood flow to individual organs must be carefully metered to maintain arterial pressure at sufficiently high levels to maintain flow through the entire system.
• Blood flow to the tissues is regulated by resistance vessels (small arteries and arterioles).
• All tissues can demand additional flow to support increased activity. Control is effected locally through release of metabolites and paracrine factors (e.g., endothelin, prostacyclin, endothelium-derived hyperpolarizing factor, and nitric oxide) which cause resistance vessels to constrict or dilate. Resistance vessels are also stretch sensitive, a llowing for reflex vasoconstriction during arterial pressure surges. The ability of tissues to match their own blood supply to prevailing needs is called autoregulation.
• Resistance vessels are also innervated by the sympathetic nervous system, which vasoconstricts when active. Sympathetic innervation allows the autonomic nervous system to override local controls when arterial pressure is threatened.
• The autonomic nervous system maintains arterial pressure using the baroreceptor reflex, a simple feedback pathway that monitors arterial pressure and adjusts cardiac output and vascular resistance to compensate for any changes that might occur.
• There are three main groups of pressure sensors. The primary sensors are arterial baroreceptors, located in the wall of the aorta and carotid sinus. Secondary pressure sensors include the cardiopulmonary baroreceptors, which are located in the walls of atria and in the pulmonary circulation. Chemoreceptors residing in aortic and carotid bodies in the periphery and within the central nervous system monitor pressure indirectly through flow-induced changes in H+, CO2, and O2 levels.
• The various sensors relay information to a group of cardiovascular control centers located in the brainstem. The cardioinhibitory and cardioacceleratory centers control heart rate and inotropy, whereas the vasomotor center controls blood vessels and adrenal glands. When blood pressure is low, the cardioacceleratory center increases heart rate and myocardial contractility. The vasomotor center increases vascular resistance and also forces blood out of the veins by venoconstriction. Blood pressure rises as a consequence.
• The baroreceptor reflex is used for immediate and short-term adjustments in arterial pressure. Long-term pressure control involves modulating total body water and Na+. The kidneys play a central role in both cases.
• The kidneys’ ability to retain water is controlled by antidiuretic hormone (ADH). ADH is released from the posterior pituitary in response to increases in tissue osmolarity and sympathetic activation.
• Na+ retention by the kidney is controlled locally. Baroreceptors located in the walls of renal glomerular afferent arterioles stimulate renin release when blood pressure is low. Renin proteolyses angiotensinogen to form angiotensin I, which is then converted to angiotensin II (Ang-II) by angiotensin-converting enzyme. Ang-II promotes Na+ recovery from the kidney tubule, stimulates antidiuretic hormone release, and constricts resistance vessels.
• Na+ and water retention increases circulating blood volume. The additional volume collects in the venous system and raises central venous pressure (CVP). Increased CVP increases left ventricular preload, cardiac output, and arterial pressure.
• Veins contain valves that ensure blood is forced toward the heart during venoconstriction. Valves also help move blood upward against gravity. Veins are easily compressed by skeletal muscles as they contract. Rhythmic compression of leg and feet veins when walking or running, effectively milks blood out of the lower extremities (venous pump).
• The dependence of cardiac output on venous return can be presented graphically in the form of cardiovascular function curves. They demonstrate that cardiac output can be raised or lowered physiologically through modulation of inotropy, but only if central venous pressure is sufficient to support the induced level of output.