
Oded Langer, MD, PhD
Measurement is the first step that leads to control and improvement.
If you can’t measure something, you can’t understand it.
If you can’t understand it, you can’t control it.
If you can’t control it, you can’t improve it.
—H. James Harrington
Key Points
• Correlated normality is defined as desired or undesired outcome; it is commonly used as the endpoint in clinical studies.
• The customary range of normal refers to the same spectrum of data from a single variable (e.g., glucose) that requires different thresholds for different clinical complications.
• Approximately 80% of gestational diabetes mellitus (GDM) and only 40% to 60% of pre-existing diabetic women achieve the targeted level of glycemic control.
• Spontaneous abortion and congenital malformations are associated with relatively higher glucose thresholds; therefore, prevention is more attainable.
• Fetal macrosomia/large for gestational age (LGA) and metabolic complications are associated with a lower glucose profile; therefore, prevention is less attainable.
• Delay in lung maturation in diabetic patients is negligible in the presence of good glycemic control.
• The rate of preeclampsia is related to the severity of GDM and the level of glycemic control.
INTRODUCTION AND DEFINITION OF TERMS
This chapter examines the potential to establish different glycemic thresholds to be targeted by the care provider to decrease adverse perinatal outcome from diabetic complications. These thresholds will be compared to the normal glycemic profile when possible by both the correlated and isolated definitions of normal. Outcome variables to be evaluated: large-for-gestational-age (LGA) and small-for-gestational-age (SGA) infants, metabolic complications, lung maturation, stillbirth, spontaneous abortion, congenital anomalies, and preeclampsia.
NORMAL GLYCEMIC PROFILE IN NONDIABETIC PREGNANCY
The association between abnormal glucose and adverse pregnancy outcome has become axiomatic yet, to date, there is scant evidence on glucose data and pregnancy outcome. From 1991 to 2010, there were approximately 10,300 English language academic citations on diabetes in pregnancy. Of these, 76% were primarily editorials, letters, meta-analysis, practice guidelines, reviews, and consensus reports from development conferences; only 6% provided glycemic data on patients. However, even in these academic works, the majority did not provide pregnancy outcome based on having reached/failed to reach targeted glycemic levels, method of testing, and so on.
There is scant information on the glycemic profile of nondiabetic pregnant women. The existing studies are limited because of small sample sizes and single day testing during hospital conditions (not reflective of real-life situations).1-4 Complicating this issue are investigators who use varying parameters when presenting levels of glycemia, that is, mean blood glucose values, premeal mean glucose, or postprandial values. Moreover, there is a wide range of testing methods from venous blood tested weekly to daily self-monitoring capillary blood glucose. As a result, the glycemic profile in nondiabetic pregnant women is not well defined. Three stud- ies5-7 with relatively larger sample sizes evaluated the glycemic profile in nondiabetic pregnant women. Two of the studies used self-monitoring blood glucose throughout the third trimester, whereas one study used a continuous blood glucose measuring system. The unique features of these studies included longer duration and patients not altering their lifestyles (diet and/or activities) during the study period. Therefore, the data gleaned from these studies can provide a more accurate reference for what is the normal glycemic profile in nondiabetic women during pregnancy. In most centers, when pregnant diabetic women are attended, the targeted level of glycemia is usually based on the upper limits of normal for pregnant nondiabetic populations. Therefore, using two standard deviations (SDs) above the mean (fasting plasma <100 mg/dL and 2-hour postmeal <120 mg/dL) from scant data became the targeted level for glucose control. It is no surprise then that in some complications, these thresholds are not adequate to optimize pregnancy outcome. In light of the current data on glycemic profile in nondiabetic pregnant women, the “gold” threshold for each complication needs a definition in relation to pregnancy outcome rather than a mathematical expression of two SDs above the mean (especially since most hover around the mean and not above it) (Table 14-1).
Several investigators have chosen to report their data with glycosylated hemoglobin. Here too, the lack of uniformity among the laboratories produce results in multiple thresholds of normality (range: 4.5%-8.9%). In addition, most of the studies found poor to no correlation between glycosylated hemoglobin and mean, fasting, premeal, and postmeal blood glucose values.8,9 On the basis of associations with adverse pregnancy outcomes, HbA1c measurement is not a useful alternative to an oral glucose tolerance test (OGTT). Overall, the association was significantly stronger with glucose measures than with A1c for birth weight, skin fold, and so on.10 In addition, HbA1c is a retrospective measure reflecting a 10-week period prior to the actual test result. Therefore, it cannot be used in the daily management of blood glucose surveillance with its
requirement for immediate therapeutic intervention. Moreover, hemoglobin A1c does not adequately represent the complexities of glycemic control in women with type 1 diabetes who are presumed to have achieved glycemic control in the first trimester of pregnancy.11,12 However, when a retrospective evaluation of level of glycemic control is needed for both patient consultation and risk assessment, as in cases of congenital malformations, spontaneous abortion, or a known stillbirth, HbA1c becomes a useful measure (Table 14-2).
In summary, the association between glucose boundaries maximizing perinatal outcome in the pregnant diabetic woman and the normal glycemic profile in nondiabetic women can be compared. However, it should be understood that the normal values found in the nondiabetic subject are not automatically the targeted levels that should be established to prevent a complication in pregnant diabetic women. Taking the approach that the nondiabetic profile should be targeted in pregnant diabetics may result in over- or undertreatment causing iatrogenic damage. When anticipating the achievement of targeted levels of glycemic control, the success rate will be determined by the established threshold (Figure 14-1). Furthermore, the ability to achieve success in controlling blood glucose levels will be affected by method of testing, patient compliance, level of physician commitment to achieving targeted levels of control, and type of diabetes. For example, in our patient population, when targeted levels of control were defined as <105 mg/dL, only 47% of type 1 diabetic subjects achieved this level, 60% to 70% of type 2, and 80% of GDM.
The importance of achieving the established level of glyce- mic control in the treatment of diabetes in general, and particularly in pregnancy, is well established. The Diabetes Control and Complications Trial Research Group 13 demonstrated that vascular complications (nephropathy and retinopathy) are significantly decreased with intensified therapy. With intensive treatment, there were significant reductions in microvascular and neuropathic complications reported in type 2 diabetics in the UK Prospective Diabetes Study.14 However, the levels designated “normal glyce- mia” in these studies were notably higher than targeted glycemic levels in pregnancy.
TABLE 14-1 Recommended Therapeutic Threshold in Diabetic and Nondiabetic Women
|
DCCT |
ACOG |
ADA |
4th Intl' |
Canada |
Non-DM |
|
|
Fasting |
70-120 |
60-90 |
<105 |
— |
75 |
|
|
Premeal |
70-120 |
60-105 |
— |
— |
<95 |
78 |
|
Postmeal |
||||||
|
1 h |
<130-140 |
<155 |
<140 |
<140 |
105 |
|
|
2 h |
<120 |
<130 |
<120 |
<120 |
97 |
|
|
90-120 min |
<180 |
— |
— |
— |
— |
— |
|
2-6 am |
>65 |
60-90 |
— |
— |
— |
68 |
|
Mean |
NA |
<100 |
— |
— |
— |
84 |
Abbreviations: ACOG, American Congress of Obstetricians and Gynecologists; DCCT, Diabetes Control and Complications Trial; DM, diabetes mellitus.
TABLE 14-2 The Association Between HbA1c and Blood Glucose
|
SMBG |
SD |
HbA1c |
|
87 |
-2 |
5.50 |
|
96 |
-1 |
6.25 |
|
105 |
0 |
7.0 |
|
114 |
1 |
7.75 |
|
123 |
2 |
8.5 |
|
132 |
3 |
9.25 |
|
141 |
4 |
10.0 |
|
150 |
5 |
10.75 |
|
159 |
6 |
11.5 |
|
168 |
7 |
12.25 |
|
177 |
8 |
13.0 |
|
186 |
9 |
13.75 |
|
195 |
10 |
14.5 |
Abbreviation: SMBG, self-monitoring blood glucose.

DEFINING NORMAL OUTCOME
With the goal of achieving glycemic levels that maximize normal pregnancy outcome, phrases such as “tight glycemic control,” “stringent glycemic control,” “near normoglycemia,” and “euo- glycemia” have been used interchangeably. Therefore, the intended goal for defining normal outcome needs to refer to a baseline that represents the glycemic profile of nondiabetic pregnant women whose abnormal glucose levels are reduced with treatment. Nonetheless, unresolved issues remain: Is the glycemic profile similar between obese and nonobese pregnant women? How should the glycemic profile be characterized and measured?
The ranges of normal and abnormal are the foundations of medical decision making. A diagnosis is the single most important component of medical care that dictates decisions related to treatment, prognosis, and the use of health resources. A practitioner’s ability to understand variations is fundamental to his/her making an accurate diagnosis for a specific disease. The terms normal/ abnormal appear to be almost self-explanatory. However, the range suggested for the measurement of a specific medical condition is often unsuitable for the stated goals, and the basic concept of normality is ambiguously or inconsistently applied. In addition, the transition from normal to abnormal is continuous and reversible as in the level of glucose in a diabetic patient, which may increase or decrease from normoglycemia to hypoglycemia.
In nonpregnant diabetic women, the goal of treatment is to reduce glycosolated hemoglobin (A1c) to approximately 6% to 7%. This range represents normal fasting and postprandial glucose concentrations in the absence of hypoglycemia. In treating diabetes in pregnancy, the medical team needs to identify glycemic levels to create a treatment plan. Then, achieving the targeted level of glycemic control will be pivotal in the treatment protocol with beneficial results for type 1, type 2, and GDM.15 Researchers need to balance the trade-off between sensitivity and specificity (finding all the true cases vs. misdiagnosis of some healthy individuals as having a disease). Particularly for laboratory tests, separation of normal from abnormal is inevitably arbitrary. As a result, there is a need to establish thresholds or boundaries for targeted glycemic levels appropriate to a specific diabetic complication.16-19
CORRELATED NORMALITY
There are three categories to define normal: correlated, isolated, and customary normality.20 Correlated normality is defined as desired/ undesirable outcome. For example, macrosomia versus normal size fetus; hypertension versus normal blood pressure in pregnancy in which the threshold changes in association with the desired outcome. Another example is the recent change in the diagnostic criteria for type 2 diabetes from fasting plasma glucose (FPG) of 140 to 126 mg/ dL. This change was based on the association between the proposed glucose threshold and the vascular complications (nephropathy, retinopathy) that develop in diabetic patients. The definition of what is normal using the concept of correlated normality is based on what the physician and/or the patient are willing to accept as “normal.” In the past, cesarean delivery was one of the classic measures of abnormal outcome in obstetrics. Today, legitimating cesarean delivery for women with previous cesarean delivery, increased rates of induction of labor, and the advocacy by both physicians and patients for women’s rights to cesarean section on demand rather than for medical indications have all influenced the rate of cesarean delivery. Therefore, this endpoint should not be used as an outcome measure in pregnancy but rather as a measure of practice-directed medicine that is not related to the concept of correlated normality. Correlated normality is associated with an ideal or desired state of health that requires data from other variables that need to be considered simultaneously. For example, if the desired outcome is a normal-size fetus, a thorough investigation of all other known confounding variables must be concurrently analyzed using multivariate analysis. Abnormal is a current state of illness or an inability to achieve a desired level of health. Correlated normality is the traditional method for making decisions about normal/abnormal conditions.
In the definition of isolated normality, normal is categorized as a univariate concept, emerging from boundaries set on values of the spectrum of a single variable such as glucose values. Abnormality is then based on a statistical process such as greater than two SDs above a mean value for a population or mathematical methods such as 95th percentile. By using the isolated approach, “the rate of a condition is determined prospectively by arbitrary assignment rather than by being based on a clinical demonstration of true dysfunction.” Isolated normality often uses the normal Gaussian distribution to display boundaries of normality. Therefore, what is within the boundaries is designated “normal” and anything outside of the boundaries “abnormal” regardless of the presence/absence of disease. For example, all large and small fetuses above the 90th and below the 10th percentile are considered abnormal regardless that many of them are constitutionally large or small. Inherent in this last concept of laboratory abnormality is the view that if the disease can be identified before the specific complication develops, effective treatment could prevent, or at least delay, the onset of that complication.
The customary range of normal refers to the same spectrum of data from a single variable (glucose) that requires different thresholds for different clinical phenomena. Can we identify different thresholds of glucose required to prevent a given complication? In studying gestational and pregestational diabetes, values are related to the likelihood of a particular laboratory value being associated with a subsequent adverse event developing in the future, such as plasma glucose concentrations and risk of macro- somia. Therefore, there is a need to establish thresholds or boundaries for each complication to coordinate glycemic treatment and optimize perinatal outcome.
The need to support the concept of customary normality in the treatment of GDM requires that several unresolved issues be addressed: (1) definition and methods to measure glycemia; (2) level of glycemia required to optimize maternal and fetal outcome; (3) incorporation of testing frequency and glucose variability into treatment modality; (4) determination of gly- cemic threshold for obese/nonobese pregnant diabetic women; and (5) confounding effects such as weight gain, gestational age at initiation of therapy, and therapy modality on pregnancy outcome.
Several authoritative bodies have recommended varying levels of glycemia to be targeted in diabetes in pregnancy. The source of these recommendations utilized the concept of isolated normality based on nondiabetic profiles.21-24 Moreover, adding to the lack of uniformity, investigators have used varying parameters when presenting level of glycemic control, that is, overall mean, postprandial mean, glycemic variability, or HbA1c.12,25,26 The majority of studies do not distinguish between type 1, type 2, and GDM and do not refer specifically to outcome in obese and nonobese patients. There is a wide range of testing methods from venous blood tested weekly to daily self-monitoring capillary blood glucose. Two methods that measure glucose have gained popularity, the older method of self-monitoring and continuous glucose monitoring. Continuous glucose monitoring in pregestational diabetes (type 1 and type2) reveals clear differences in the level of glycemic control. Women with type 2 diabetes spend approximately 33% less time hyperglycemic throughout pregnancy than women with type 1 diabetes.27 On the other hand, a recent randomized study comparing these two methods in pregnancy revealed a similar rate of severe hypoglycemia (approximately 16% and prevalence of LGA infants (45% vs. 34%, P = .19). The use of the more costly real-time continuous glucose monitoring compared to self-monitored plasma glucose seven times daily did not improve glycemic control and pregnancy outcome in women with pregestational diabetes.28
Some researchers report data with glycosylated hemoglobin. Here, too, the lack of standardization and consistency among laboratories has resulted in multiple thresholds of normality. The slow kinetic of glycosolated hemoglobin accumulation and physiological changes in erythrocyte formation during pregnancy means that A1c is only a limited and retrospective predictor of acute blood glucose changes. This may provide an explanation for the poor pregnancy outcomes even in women with apparently well-controlled blood glucose.11,12,29 Patients with comparable mean glucose or HbA1c values may have strikingly different daily glucose profiles (differences in number and duration of glucose excursions). Hyperglycemia may induce oxidative stress and interfere with normal endothelial function by overproduction of reactive oxygen species. This may contribute to diabetic complications through several molecular mechanisms. Glucose variability may also influence these functions.30,31
GLUCOSE MARKERS FOR THE INITIATION OF PHARMACOLOGICAL THERAPY
The controversy over gestational diabetes as a clinical entity has, in the past decade, been resolved. As a result, there have been many publications of both retrospective and randomized studies32-35 that demonstrated that untreated GDM is clearly associated with increased adverse outcome and that treatment will significantly improve pregnancy results. Needless to say, described treatments demonstrated attempts to improve glycemic levels. Furthermore, it has been confirmed that obese patients will benefit from pharmacological therapy36 and excess weight gain in pregnancy is associated with increased adverse pregnancy outcome.37-39
To begin to establish the glucose thresholds required to maximize pregnancy outcome, a thorough understanding of the pathophysiology of GDM patients is paramount. Pregnancy is characterized by a hyperinsulinemic state and a decrease in insulin sensitivity. The inability of the target organ to respond to normal insulin pregnancy-induced changes contributes to the cause of GDM. A healthy в-cell will have the ability to respond and secrete sufficient insulin to offset resistance; however, impaired в-cell secretion in conjunction with insulin resistance results in GDM. Diet and exercise regimens remain the foundation for both the prevention and the treatment of women with GDM. In studying insulin characteristics using the minimal model,40 the authors reported that a substantial number of affected patients, even after four weeks of diet therapy, failed to improve insulin secretion and sensitivity to insulin to the levels of non-GDM women.41,42 These patients require additional pharmacological therapy to achieve the targeted level of glycemic control.
Studies of hyperinsulinemic-euglycemic clamps used a tree model for insulin resistance that included fasting glucose, insulin, age, gender, and body mass index (BMI). The results demonstrated that only fasting insulin >10.6 uU/mL was a significant determinant for being insulin resistant. This elevated insulin level was associated with FPG of >97 mg/dL in the majority of cases. These support the concept of fasting plasma >95 mg/dL as a threshold for the initiation of pharmacological therapy.43 It is impractical and not cost effective to measure insulin sensitivity and secretion on every GDM patient. Therefore, it is necessary to identify the glucose thresholds that will require pharmacological therapy in addition to diet therapy. In the past, FPG of <105 mg/dL and/or postprandial values of >120 mg/dL were the recommended criteria.44-47 In our studies, we demonstrated that fasting plasma thresholds of <95 mg/dL needs to be used for insulin therapy initiation to overcome abnormal physiology. Before a care provider decides on mode of treatment, diet, or pharmacological therapy, both gestational age at initiation of treatment (to maximize the protective effect for the fetus) and the relatively short time from diagnosis to delivery (8-12 weeks) needs to be considered. This window of opportunity to alter the negative effects of the glucose abnormality is very narrow. Based on these assumptions, it was demonstrated that diet therapy prolonged for more than two weeks is not beneficial.48 The Fourth International Workshop on Gestational Diabetes recommended FPG > 95 mg/dL and/or postprandial plasma glucose >120 mg/dL during diet therapy as the criteria for insulin initiation.49-51 In addition, the American College recognized that lowering the FPG for insulin initiation results in a lower rate of macrosomia from GDM.52 In summary, the maternal glycemic profile as the criteria for pharmacological therapy (insulin or glyburide) should be based on FPG of >95 mg/ dL and when normoglycemia is not achieved.
PERINATAL MORTALITY: WHAT IS MEASURED?
A stillbirth contrasts the expectation of life with the tragedy of death. The care provider and his/her team need to address the parental issues of grief and loss while trying to provide answers to their questions about cause and chances of recurrence. Perinatal mortality remains the standard for measuring adverse outcome in pregnancy. There are more than two million intrauterine deaths defined as the demise of a fetus in the second half of pregnancy annually worldwide. Stillbirth occurs in 1 in 160 gestations in the United States, which makes it as common as infant mortality. Different definitions exist worldwide. Sweden, for example, registers all live births, irrespective of gestational age and stillbirths only after 28 completed weeks; therefore, fetal deaths before that gestational age are not included in the perinatal mortality (PNM) rate. In England and Wales, all fetal deaths between 24 and 27 completed weeks gestation, in addition to those after 28 weeks, are registered as stillbirths. This effectively changes the definition of PNM. Such variations created discrepancies in PNM rates among various countries, placing their value as a measure of perinatal care in doubt. The World Health Organization recommended that national perinatal statistics rely on weight (infants weighing at least 500 g) to avoid geographic differences. Indeed, recent analysis of PNM data in the United States by the National Vital Statistics System of the Center for Disease Control and Prevention referred to fetal deaths according to gestational age: early fetal death, 20-27 weeks gestation, and late fetal deaths >28 weeks gestation.53 The definition is further complicated by the additional stratification of neonatal death into early and late neonatal deaths: early neonatal death is defined as the death of a live-born infant during the first 7 days after birth and late neonatal death is the death of a live-born infant after 7 days but before 29 days of birth.
Because congenital anomalies are a contributing factor in overall perinatal mortality rate, it is important to control for the effect of congenital malformations when calculating fetal and neonatal death rates. In obstetrics, observational studies account for approximately 80%, whereas randomized studies account for 11%. Studies evaluating perinatal mortality from diabetes in pregnancy are under the constraints of strict ethical standards that prevent randomized studies. Therefore, in studies that evaluate perinatal mortality, it is important that both the study and the control groups be comparable in their basic characteristics, that is, the incidence of prolapse of cord, medical complications, parity, ethnicity, prenatal care, and so on. Thus, the diseases in question, for example, GDM, types 1 or 2 diabetes become the main cause for the difference in rates between the groups for perinatal outcome.
Two recent articles addressed the causes and risk factors for stillbirth.54,55 The articles identified the causes of stillbirth as attributable to obstetric conditions, placental abnormalities, genetic or structural anomalies, infection, hypertensive disorders, and maternal medical conditions. The authors described 4 broad stillbirth categories, 2 before and 2 after 28 weeks of gestation. The early deaths were associated with very preterm labor of a nonviable fetus when intervention would be inappropriate, that is, a group where African American women were disproportionately represented as were some specific obstetric complications: placental abruption, multiple pregnancies, rupture of membranes, preterm labor, and chorioamnionitis. Deaths after 28 weeks were associated with placental disorders, that is, insufficiency related to maternal vascular disease and, nearer term, cord complications. Also recorded were genetic and structural problems, infections, and maternal medical conditions. Relatively few term intrapartum deaths were associated with asphyxia. Black race/ethnicity, a previous stillbirth or mid-trimester loss, diabetes, drug addiction, smoking, obesity, multiple pregnancies, and single parenthood were variables that contributed to stillbirth. These factors are evident at the outset of any pregnancy; they do not define the overall burden of stillbirths into a specific group in which interventions can be targeted. As with preterm delivery, which also has numerous common denominators, risk forecasting is a very inexact science. The most probable sources of accurate information as to the cause of any stillbirth will be provided by placental histology, autopsy, and karyotyping. In the reports, a probable cause was found for more than 60% of all deaths, and this figure rose to 75% with an autopsy. In general, a growing proportion of stillbirths are being attributed to maternal, fetal, or placental causes, shrinking the proportion relegated to “idiopathic” or unexplained stillbirth. The leading causes of antepartum stillbirths were obstetric complications in 29% and placental pathology in 23%, although some of the causes of stillbirth varied significantly by race.54 Infection as a cause of stillbirth was also less likely in whites (7%) or Hispanics (8%), compared with blacks (25%) or other races (22%). However, hispanics and whites had higher rates of umbilical cord complications as a cause of stillbirth (13% for each), compared with blacks (4%) or other races (5%). Among the clinically indicated tests for stillbirths, the placental histology identified a cause of stillbirth 52% of the time. An autopsy found a cause in 31% of cases, and karyotype testing identified a cause 9% of the time. Eight other screening tests found a cause for stillbirth in 0.4% to 4.8% of cases, depending on the test. These included screens for antibodies, toxicology, or blood glucose; tests for syphilis, parvovirus, lupus anticoagulant, or anticardiolipin antibody; or detection of fetal blood in fetal-maternal hemorrhage.56
Karlsson and Kjellmer57 studied 179 women with pre-existing diabetes to evaluate the possible relationship between the degree of glycemic control (expressed as the mean daily blood glucose value) and perinatal mortality, not corrected for congenital anomalies. Patients were divided into three mean blood glucose groups: <100, 100 to 150, and >150 mg/dL. Perinatal mortality was 3.8%, 16%, and 24%, respectively. Although there is a continuous increase in perinatal mortality for the threshold used in this study, it would be clinically appropriate to use the correlated normality definition to identify the desired threshold (<100 mg/dL) that will result with the lowest rate of perinatal mortality.
Although the main cause of fetal death is metabolic acidosis, fetal hypoxia can occur in diabetes in pregnancy especially in type 1 diabetes and can be another explanation for fetal demise. In GDM and type 1 and type 2 diabetes, there are additional recognized risk factors associated with perinatal mortality, that is, diabetic vasculopathy, hypertension, and intrauterine growth restriction.58 In both GDM and type 2 diabetes, a “triad” effect occurs that includes the relatively older pregnant mother in comparison to the gravid nondiabetic population, the higher incidence of obesity and the presence of hypertension. These patients typically exhibit elevated insulin levels, insulin resistance, and most likely suffer from metabolic syndrome. The findings of Karlsson and Kjellmer57 on the suggested threshold associated with decreased perinatal mortality were reported in the early 1970s. Despite their findings, there were no substantial improvements in perinatal mortality. This led to the St. Vincent’s Declaration in the 1990s. However, the rate of perinatal mortality remained unchanged in type 1 diabetes. Thus, decreasing mortality still remains the objective for these patients. The question then becomes whether improvement is achievable. As noted earlier, a mean blood glucose of <110 mg/dL could be obtained in approximately 40% of patients (due to the complexity and variation of their glucose metabolism). Thus, at least 60% of these patients remain with blood glucose levels that expose them to the risk of stillbirth. Therefore, it is not surprising to find national studies reporting higher perinatal mortality in these patients.29,59-68
O’Sullivan et al.69 found that women with GDM have more perinatal losses than pregnant nondiabetic women (during the same time period), 64/1000 versus 15/1,000, respectively. Pettitt et al.70 when studying 811 Pima Indian women found a direct association between a 75 g 2-hour glucose challenge test result in the third trimester and perinatal mortality. The test results were blinded from the care providers during pregnancy. Of note is that GDM women had perinatal mortality rates similar to those with pre-existing diabetes, 43-125/1000 versus 59/1,000. The stillbirths in the GDM group occurred mostly in LGA fetuses (236/1000), suggesting that maternal hyperglycemia leading to fetal hyperinsulinemia and lactic acidosis were the causes of death. Beischer et al.71 found a higher rate of perinatal mortality in untreated GDM women in comparison to treated GDM subjects. They further suggested that reducing postprandial glucose below 140 mg/dL decreases perinatal mortality by 75%. In a previous study, these researchers72 reported perinatal mortality rates of 3.2% and 2.8% in women whose OGTT results were above the 95th percentile (hyperglycemia) and below the 5th percentile (hypoglycemia), respectively, and only 0.6% between the 5th and 95th percentiles. Schmidt et al.73 when comparing gestational diabetic women to the general population found a relative risk of 3.1 and 95% confidence interval 1.4 to 6.5 for perinatal death. We, in a large cohort study of 4757 GDM and 10,804 nondiabetic gravids, evaluated the rate of perinatal mortality.74 Seventy-nine percent of the study population achieved targeted levels of glycemic control (<105 mg/dL). The incidence of stillbirth was 4.8/1000 for the GDM and 4.2/1000 for the nondiabetic subjects. The rate of neonatal death was 5.2/1000 and 5.3/1000, respectively. Our data suggest that achievement of targeted levels of glycemic control will reduce the perinatal mortality to rates comparable to the general population. We reported similar rates of perinatal mortality in 1994 when we compared intensified and conventional management approaches to GDM.15In contrast, perinatal mortality in pre-existing diabetes was higher than in our GDM patients but with similar rates between type 1 (stillbirth: 12/1000; neonatal death: 8/1000) and type 2 diabetes (stillbirth: 13/1000; neonatal death: 5/1000). The higher rate of perinatal mortality found in pre-existing diabetes is attributable in part to the lower rate of patients achieving targeted levels of glycemic control and to the higher incidence of congenital malformations and vascular complications. However, this study demonstrates again the relative protective effect of controlling the abnormal levels of glycemia.74 Finally, Mondestin et al.75 reported a 2- to 4-fold higher risk for fetal death when comparing over 10 million nondiabetic to 271,000 diabetic patients during the years 1995 to 1997 in the United States. The relative risk for fetal death increased significantly as fetal weight increased (from 2500 g to >5000 g in 250 g increments).
The data suggest that both gestational and pre-existing diabetes are associated with increased perinatal mortality when established levels of glycemia are not realized. Since a much higher rate of GDM patients can achieve and maintain the desired level of control (over 80%), it is not surprising that even in large-scale studies, the perinatal mortality rates for pregestational and gestational women are not comparable. Although several factors may influence the perinatal mortality rate, it appears that a threshold of mean blood glucose <110 mg/dL will be a major contributor for the prevention of this complication.
SPONTANEOUS ABORTION
The risk of spontaneous abortion in women with type 1 and type 2 diabetes is substantially higher than in the general population.76-83 Only in the case of complications related to organogenesis is glycosolated hemoglobin a useful index of glucose control and predictor for the risk of spontaneous abortion and congenital anomalies. Since 50% of pregnancies are unplanned and the first pregnancy visit often occurs anytime within the first trimester, a retrospective measure of the level of glycemic control can provide a prognostic measure of quality control in counseling patients in the first trimester regarding abortion risk and congenital anomalies. HbA1c provides levels of glycemia up to 10 to 12 weeks prior to the initial measurement. The association between HbA1c and mean blood glucose level can be calculated (mean blood glucose [MBG] = %HbA1 x 33.3-86). For the sake of simplicity, any increase or decrease of 1% HbA1c translates to approximately 30 mg/dL mean blood glucose.
In the studies reporting rates of spontaneous abortion,84-87 the mean HbA1C values averaged 10%-12% and represented five to seven SDs above the normal mean (mean < 5%).65 HbA1C thresholds for increased risk for abortion in the above studies were far greater than three SDs above the mean as the upper limits of normal recommended by the American Diabetes Association (ADA) position statement. This suggests that the true threshold to decrease the risk of abortion is beyond the recommended three SDs, and using the correlated normality definition would be more accurate. The HbA1c threshold associated with spontaneous abortion translates to mean blood glucose ranges between 150 and 247 mg/dL. This is an example of the clinical usefulness of the definition of correlated normality that addresses desired outcome rather than a mathematical distribution used in isolated normality.
CONGENITAL ANOMALIES
Congenital anomalies are the main cause of fetal death in preexisting diabetes. However, studies reporting preconception care including glucose control by either self-monitoring blood glucose or HbA1C have suggested a rate of anomalies in pre-existing diabetes similar to that of the general population.81,82,88-92 Therefore, if this is the case, congenital anomalies in this group of patients is no longer the main cause of perinatal mortality. On the other hand, others have reported that overall, achieving a rate of anomalies in pre-existing diabetes comparable to that of nondiabetic subjects is an elusive task. They refer to the fact that only 40% to 60% of these patients are below the threshold required to prevent anomalies and 50% of the pregnancies are unplanned and, therefore, recognized for the first time at six to eight weeks (almost beyond the organogenesis period). Thus, although in small sample size studies in centers of excellence the rate of anomalies can be significantly decreased when patients are provided with preconception care, this is not the case on a large scale.81,82,89,90,92-94 The evaluation method of glycemic control was HbA1C, mean blood glucose, fasting blood glucose, mean premeal, or mean postprandial depending on the study.81,82,89-93 In the studies using HbA1C, the threshold ranged from six to nine SDs above the mean, which translates to mean blood glucose between 150 and 168 mg/dL.82,88,89 Studies using glucose profile (level of glycemia) to define the threshold for anomalies suggested FPG of <120 mg/dL,90,94 postprandial of <140 mg/dL,82,90 and overall mean <110 mg/dL.89 In these studies, the preconception rate of anomalies was 1% to 1.5%, and in patients above these thresholds, the rate of anomalies ranged from 6% to 12%. These glucose profile thresholds suggest that prevention of anomalies is attainable since the level of glycemia required for prevention of anomalies in type 1 and type 2 diabetes is significantly higher than the glycemic profile in nondiabetic patients. Thus, the threshold for prevention can be achieved in over 80% of pre-existing diabetic patients. Finally, as reflected in these studies (Table 14-3), the difference between glucose characteristics in thresholds that prevent anomalies to glucose characteristics above these thresholds is relatively small (e.g., postprandial 136-143 mg/dL vs. 142-163 mg/dL, respectively). Therefore, these thresholds are examples of correlated normality rather than isolated normality.
DEVIANT FETAL GROWTH: MACROSOMIA AND GROWTH-RESTRICTED FETUSES
A major paradox for investigators has been their inability to decrease the rate of macrosomia to the rate in the general population, while the rate of congenital malformations has been successfully decreased during this same timeframe with preconception counseling and glucose control. In the general nondiabetic population, using the concept of isolated normality, the rate of LGA infants (>90th percentile) is 10%. Similarly, the rate of SGA infants (<10% percentile) is also, by definition, 10% based on growth standards for a given population as is the rate of macro- somia based on fetal weight (>4000 g; 8%-10%). However, this approach does not distinguish between fetuses having diabetic fetopathy and those who are large/small (constitutional) based on mathematical locations on the statistical curve yet not marked by diabetic fetopathy. In the past three decades, the majority of studies reported rates of LGA and macrosomia of 15% to 35% and 10% to 20%, respectively,95,84-87 in GDM and type 1 and type 2 diabetes.8,96-98
The ability of a study to detect a positive association or no relationship between neonatal size and level of maternal glyce- mic control will be affected by the inclusion/exclusion criteria for confounding variables. Therefore, analysis of the association between levels of glycemia and fetal macrosomia need to address variables such as (1) gestational age at initiation of therapy (irreversible fetopathy), (2) threshold glucose values used to initiate specific interventions, (3) method of intervention (diet/pharmaco- logical), (4) glucose threshold targeted to forestall complications, (5) frequency and timing of blood glucose measurements, (6) methods of glucose measurement (self-monitoring blood glucose technique, HbA1C, laboratory), and (7) verification of glucose data used in the studies.99 The majority of researchers have reported a relatively high rate of LGA and macrosomia in type 1 and type 2 diabetes,100-102 whereas others have reported rates of macrosomia and LGA similar to those in the general population after subjects achieved the targeted levels of glycemic control.103 Landon et al.104 reported an LGA rate of 9.3% with a mean blood glucose <110 mg/dL in 43 patients with well-controlled type 1 diabetes. With mean blood glucose levels >126 mg/dl in 32 patients, the LGA rate was 34%. Roversi et al105 in 199 well-controlled subjects (verified mean blood glucose of 80 mg/dL) reported a 3.4% rate of macrosomia. We found an LGA rate in pre-existing diabetic women comparable to the rate in the general population (10%) when the mean self-monitoring blood glucose was within one to two SDs below the mean of nondiabetic pregnant women. This corresponds to mean blood glucose of 90-95 mg/dL.15 In a series of studies on gestational diabetic women, we demonstrated that two boundaries of glycemic control exist for deviant fetal growth in GDM women. When the mean blood glucose dips below the lower boundary (overtreating), the incidence of growth-restricted infants increases significantly. When the blood glucose levels exceeded the upper limits, the rate of LGA infants increased two- to threefold. The threshold for the upper boundary was found to be, based on cluster analysis, >105 mg/dL.8 In a follow-up study, we identified that a threshold of <87 mg/dL is associated with an increased risk for SGA and a threshold of >105 mg/dL is associated with an increased risk for LGA infants.97 In a large-scale study of over 2500 gestational diabetic women, these findings were reconfirmed. Using logistic regression analysis, we identified the risk factors for LGA and growth-restricted fetuses and the increased risk for deviant fetal growth in relation to increase/decrease in level of glycemia106 (Figure 14-2).
TABLE 14-3 Glucose Thresholds and Fetal Anomalies
|
Blood Glucose |
Anomalies |
Blood Glucose |
Anomalies |
|
|
Fuhrman et al.89 1983-84 (n = 292) |
Mean 95 |
0.8% |
133 |
7.5% |
|
Schafer-Graf et al. 2000 (n = 44) |
Fasting < 115 |
0.0% |
141 |
One organ |
|
166 |
Multiple organ |
|||
|
Kitzmiller et al.90 1991 (n = 84) |
Fasting 105-120 |
1.2% |
115-134 |
10.9% |
|
Postmeal 136-143 |
142-163 |
Based on current data in the literature, the threshold for the prevention of large infants is much lower than, for example, the threshold for the prevention of congenital anomalies. The threshold for the prevention of LGA and fetal macrosomia appears to be at a level of the mean to one SD below the mean (mean blood glucose <100 mg/dL). Thus, it is not surprising that researchers report normal rate of congenital anomalies (mean blood glucose <140 mg/dL) but a high rate of fetal macrosomia. In addition, although level of glycemia is a main contributor to deviant fetal growth, other metabolic fuels such as lipids and amino acids and confounding variables affect fetal growth. Since more than half of type 1 diabetic patients are beyond the range for prevention of fetal macrosomia, it is not surprising to find many studies reporting rates of 15% to 30%. Only stratification of patients by level of glycemic control enables us to identify the glucose threshold associated with this complication.

The fetal pancreas at term is more mature and has adequate reserves to maintain fetal glucose and insulin levels not seen in the preterm fetus. On the other hand, the mission to preclude macrosomia in gestational diabetes is an achievable one since the majority of these patients can reach a glycemic profile below the threshold needed to prevent macrosomia. Failure to achieve this goal in GDM will be a result of lack of control for confounding variables and failure in the management approach. In summary, a narrow threshold ranging between 87 and 105 mg/dL should be targeted for the prevention of deviant fetal growth. The recommended targeted mean blood glucose should be approximately 95 mg/dL in management of the pregnant diabetic woman.
THE OGTT AND GROWTH-RESTRICTED FETUSES The association between fetal macrosomia and GDM has been well documented. In contrast, the link between fetal growth restriction and glucose tolerance is less recognized as cause and effect. Early identification of growth-restricted fetuses remains a key factor in effecting the most favorable outcome. Previous works have shown that antenatal factors (i.e., hypertensive disorders, maternal smoking during pregnancy, antenatal steroid exposure, and intrauterine growth retardation (IUGR) condition) as well as poor caloric intake and/or a variety of postnatal illness episodes (i.e., severe intra-ventricular hemorrhage [IVH], necrotizing enterocolitis [NEC]) are associated with suboptimal intrauterine and postnatal growth. Recently, it was demonstrated that intrauterine inflammation plays a role in fetal growth restriction.107-109 Although multiple risk factors are cited as possible causes for intrauterine growth restriction, the diabetic-related metabolic causes of this condition have not yet been established.107-109
There is scant data addressing the association between growth-restricted fetuses (SGA) and the glucose metabolism (OGTT results). The association between the lower threshold of the OGTT and growth-restricted fetuses has been reported by several investigators.110-113 However, the relationship among counterregulatory hormones (human placental lactogen [HPL]), insulin, and glucose has not yet been fully defined and represents an important research priority. We, in a prospective study114 of 43 fetuses at risk for growth restriction, identified three groups. Group 1 contained normotensive mothers with SGA infants. These mothers were characterized by low plasma glucose and insulin levels but normal HPL level. Group 2 consisted of hypertensive mothers with SGA infants. In this group, the plasma glucose and insulin levels were normal, but the HPL level was lower than the norm. Group 3 contained mothers with infants approximate for gestational age. In this group, the plasma glucose, HPL, and insulin were within the normal range. We further developed a glucose index and found that a threshold of <105 mg/dL may provide a marker for identifying SGA infants of normotensive mothers (93% sensitivity, 91% specificity, positive and negative predictive values 86% and 95%, respectively). There is an apparent link between nor- motensive nondiabetic pregnant women and relative maternal hypoglycemia, hypoinsulinemia, and SGA infants. In addition, a “flat” OGTT needs to be interpreted as a possible abnormal pattern during pregnancy since it is associated with a 20-fold increase for intrauterine growth restriction in normotensive women. These patients need to be enrolled in fetal diagnostic units for surveillance of potential deviant fetal growth.
In a follow-up study, we compared the maternal and fetal glucose/insulin responses in gravids with/without risk factors for growth restriction. We reconfirmed that maternal glucose metabolism is associated with delayed fetal growth; however, the fetal glucose response was not altered.115 Our findings regarding glucose and insulin in the fetal compartment are in agreement with those of Delmis et al.116 who found no significant differences in cord blood glucose or insulin between normal-sized and growth-restricted infants. However, our results differed from those of Economides et al. and others.117-119
These investigators reported decreased fetal insulin, glucose, and insulin/glucose ratios at the time of cordocentesis in infants with abdominal circumference measurements below the fifth percentile. These studies, performed at earlier gestational ages, contrast ours done late in the third trimester.
METABOLIC COMPLICATIONS
Socrates alleged that the beginning of wisdom is the definition of terms. The rate of a given complication is ultimately affected by the definition of that condition. The actual rate of a metabolic complication is based on the concept of correlated normality; it is directly dependent on the threshold selected for that complication. For example, in the case of neonatal hypoglycemia, different definitions are in use from the arbitrary subjective administration of intravenous glucose to the neonate with/ without neonatal testing to different levels of glycemia ranging from 45 to 25 mg/dL. Moreover, the varying modes of maternal glucose measurement contribute pitfalls to the rate of fetal complications.120 Metabolic complications are a consequence of fetal hyperinsulinemia. The abnormal maternal glucose level causes cellular hyperplasia and hypertrophy of most fetal tissues resulting in fetal hyperinsulinemia (Table 14-4). Fetal hyperinsulinemia is a common denominator for fetal macroso- mia, respiratory, and metabolic complications. Therefore, we can speculate that a similar threshold will positively affect treatment outcome in all. Jovanovic et al.103 in studying 52 type 1 diabetic women who had achieved the established glycosylated hemoglobin levels reported the same incidence of neonatal complications as those patients in the nondiabetic matched control group. Karlsson and Kjellmer57 demonstrated that when mean blood glucose was <110 mg/dL, metabolic complications could be reduced to rates reported in the nondiabetic population. The study by Landon104 demonstrated that well-controlled type 1 diabetic women (mean blood glucose <110 mg/dL) had significantly less hypoglycemia and respiratory distress than those of poorly controlled women. We found similar findings in 1145 GDM women.15 We demonstrated that with a threshold of mean blood glucose <100 mg/dL, the metabolic complication rate is similar to that of the nondiabetic population; a threshold beyond this level increases the rate and the risks121 (Figure 14-3).
RESPIRATORY COMPLICATIONS
There is general agreement that fetal lung maturation is delayed in the diabetic fetus most likely mediated by the fetal hyper- insulinemia. Even when infants were matched by gestational week of pregnancy, infants of diabetic mothers were more than 20 times more likely to have respiratory distress syndrome than an infant from a normal pregnancy. Several investigators have suggested that maternal hyperglycemia delays fetal lung maturation.122-124

TABLE 14-4 Type 1: Metabolic Complications in Diabetic Women
|
>99 |
<100 |
RR |
95% CI |
|
|
Polycythemia |
18.5% |
4.2% |
5.3 |
1.6-1.8 |
|
Hyperbilirubinemia |
28.2% |
13.8% |
3.4 |
1.9-5.9 |
|
Hypocalcaemia |
10.7% |
3.4% |
3.7 |
1.5-9.3 |
|
Hypoglycemia |
36.4% |
20.3% |
3.9 |
2.3-6.7 |
|
RDS |
29.8% |
13.3% |
2.9 |
1.6-4.7 |
Abbreviations: CI, confidence interval; RDS, respiratory distress syndrome; RR, relative risk.
Moore, in a case-controlled study, reported that fetal pulmonary maturation is delayed in diabetic pregnancy by 1 to 1.5 weeks. This delay appears to be associated with an early and sustained elevation in amniotic fluid phosphalidylinositol (PI) levels at 32 to 34 weeks.125 Others have been unable to demonstrate any significant difference.126,127 We found in several studies that a threshold >105 mg/dL will result in immature lung test results in approximately 35% of the patients. However, after 37 weeks gestation, none of these infants exhibited respiratory clinical complications.122-124 Similar findings were found by Landon et al. in type 1 patients.104 However, only a few studies have distinguished between pre-existing and gestational diabetic patients. As previously mentioned, since type 1 patients are less likely to achieve the established levels of glycemic control, they are at a higher risk for developing fetal lung complications. Diabetic patients who achieve a level of glucose control <105 mg/dL after the 37th week of gestation are at the same risk for having abnormal lung testing results and complications as the nondiabetic patients. The routine use of amniocentesis for fetal lung maturity testing is not indicated in diabetic patients that are in good glycemic control (Figure 14-4).
PREECLAMPSIA
Hypertensive disorders including preclampsia have for decades been associated with diabetes in pregnancy. Several studies have reported an increased risk for hypertension and preeclamp- sia,128,129 whereas others have disputed this relationship.130 Studies have reported a relationship between the glucose tolerance test and blood pressure.131-133
One study demonstrated a linear relationship between progressive glucose intolerance and blood pressure during the third trimester, which occurred even with normotensive women.134 Furthermore, even within the normal ranges of the glucose challenge test, there was a positive correlation with preeclampsia. Women with GDM were found to be at an increased risk for hypertensive disorders.135
It has been suggested that insulin resistance precedes the clinical onset of hypertension in pregnancy.136 We demonstrated the association between hyperinsulinemia and chronic hypertension in pregnancy. However, we failed to find an association with preeclampsia.137,138

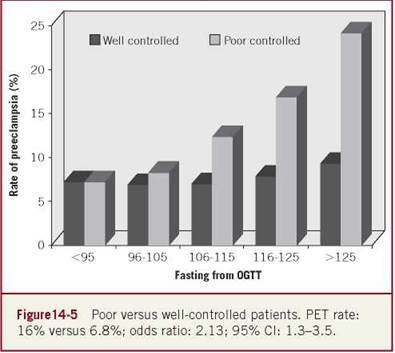
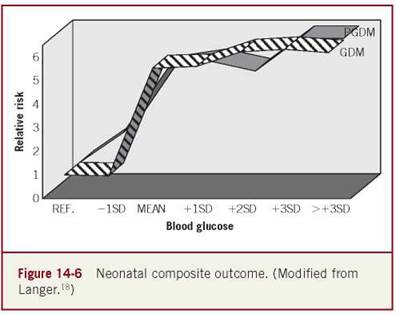
In another study of 1813 GDM women, we evaluated the relationship between level of glycemic control and the incidence of preeclampsia.139 We found that the rate of preeclampsia was 7.8% for patients with FPG of <105 mg/dL and 13.8% for patients with fasting plasma >105 mg/dL. These results demonstrate a twofold increase for patients with more severe GDM. Moreover, for the well-controlled patients (mean blood glucose <95 mg/dL), similar rates of preeclampsia were found in all GDM severity groups. In contrast, in poorly controlled patients, there was a 2.5-fold increase in the rate of preeclampsia in the more severe GDM group (fasting plasma >115 mg/dL). The rate of preeclampsia is influenced by the severity of GDM and prepregnancy BMI. Optimizing glucose control during pregnancy may decrease the rate of preeclampsia, even in those women with greater GDM severity (Figures 14-5 and 14-6).
SUMMARY
Glucose is best described as a continuous variable. Therefore, the risk to the fetus increases continually in relation to the increased level of maternal glycemia up to a level to which glucose toxicity reaches its maximum effect. In the majority of cases, such as mac- rosomia, metabolic complications, respiratory complications, and so on (Figure 14-5), the rate will generally hover around 30% or three- to fourfold increased risk for a given complication. It is not possible to identify the exact threshold of glycemia that will make an absolute demarcation between the normal and the compromised fetus. However, it is possible to identify a glucose threshold for the majority of fetuses at risk. Although some high- and low- risk fetuses will be missed at the outlying end of the threshold, the threshold provides a guideline for the practitioner that helps maximize the potential for enhanced perinatal outcome.
Despite the common recommendations of fixed criteria for glucose control, the reader needs to remember that achieving different glucose thresholds will diminish the rates for different complications. Therefore, any improvement in the abnormal diabetic profile in the patient may be beneficial. The threshold that will decrease the rate of fetal anomalies will not decrease the macroso- mia rate. Understanding this concept explains several “paradoxes” in the literature regarding infant morbidity of the diabetic mother as well as the lack of uniformity in study design that limits comparison. Finally, alteration toward improving glycemic control is always more beneficial than maintaining a questionable status quo with the admonition that “.. .a man’s reach should exceed his grasp, or what’s a heaven for?”— Robert Browning.
REFERENCES
1. Cousins L, Rigg L, Hollingsworth D, et al. The 24-hour excursion and diurnal rhythm of glucose, insulin, and C-peptide in normal pregnancy. Am J Obstet Gynecol. 1980;136:483-488.
2. Phelps R, Metzger B, Freinkel N. Carbohydrate metabolism in pregnancy: diurnal profiles of plasma glucose, insulin, free fatty acids, triglycerides, cholesterol and individual amino acids in late normal pregnancy. Am J Obstet Gynecol. 1981;140:730-736.
3. Gillmer M, Beard R, Brooke F, et al. Carbohydrate metabolism in pregnancy: diurnal plasma glucose profile in normal and diabetic women. Br Med J. 1975;3:399^04.
4. Lewis S, Wallin J, Kuzuya H, et al. Circadian variation of serum glucose, C-peptide immunoreactivity and free insulin in normal and insulin-treated diabetic pregnant subjects. Diabetologia. 1976;12:343-350.
5. Langer O, Miodovnik M, Gross B, et al. Ambulatory glucose profile of the pregnant non-diabetic. In: Proceedings of the 36th Annual Meeting of the Society for Gynecologic Investigation; 1989: 93; San Diego, CA.
6. Parretti E, Mecacci F, Papini M, et al. Third-trimester maternal glucose levels from diurnal profiles in nondiabetic pregnancies. Diabetes Care. 2001;24:1319-1323.
7. Yogev Y, Langer O, Chen R, et al. Diurnal glycemic profile in obese and normal weight non-diabetic pregnant women. Am J Obstet Gynecol. 2004;191(3):949-953.
8. Langer O, Mazze R. The relationship between glycosylated hemoglobin and verified self-monitored blood glucose among pregnant and non-pregnant women with diabetes. Pract Diabetes. 1987;4:32-33.
9. Brustman L, Langer O, Engel S. Verified self-monitored blood glucose data versus glycosylated hemoglobin and glycosylated serum protein as a means of predicting short and long-term metabolic control in gestational diabetes. Am J Obstet Gynecol. 1987;157:699-703.
10. Lowe L, Metzger B, Dyer A, et al. Hyperglycemia and adverse pregnancy outcome (HAPO) study. Diabetes Care. 2012;35:574-580.
11. Kerssen A, Evers I, deValk H, et al. Poor glucose control in women with type 1 diabetes mellitus and ‘safe’ hemoglobin A1c values in the first trimester of pregnancy. J Matern Fetal Neonatal Med. 2003;13:309-313.
12. Kerssen A, deValk H, Visser G. Do HbA1c levels and the self-monitoring of blood glucose levels adequately reflect glycemic control during pregnancy in women with type 1 diabetes mellitus? Diabetologia. 2006;49:25-28.
13. The Diabetes Control and Complications Trial Research Group: The effect of intensive treatment of diabetes on the development and progression of long-term complications in insulin-dependent diabetes mellitus. N Engl J Med. 1993;329:977-986.
14. Stratton I, Adler A, Neil H, et al. Association of glycemia with macrovascular and microvascular complications of type 2 diabetes (UKPDS 35): prospective observational study. BMJ. 2000;321:405-412.
15. Langer O, Rodriguez D, Xenakis E, et al. Intensified versus conventional management of gestational diabetes. Am J Obstet Gynecol. 1994;170:1036-1047.
16. Langer O. Is normoglycemia the correct threshold to prevent complications in the pregnancy diabetic patient? Diabetes Review. 1996;4:2-10.
17. Langer O, Conway D. Level of glycemia and perinatal outcome in pregestational diabetes. J Matern Fetal Med. 2000;9:35-41.
18. Langer O. A spectrum of glucose thresholds may effectively prevent complications in the pregnant diabetic patient. Semin Perinatol. 2002;26(3):196-205.
19. Langer O. Glycemic targets for the optimal treatment of GDM. Clin Obstet Gynecol. 2013;56(4):788-802.
20. Feinstein A. Clinical Epidemiology. Philadelphia, PA: Saunders; 1985:609-610.
21. American Diabetes Association. Standards of medical care in diabetes. Diabetes Care. 2010;33(suppl 1):S11-S61.
22. American Diabetes Association. Standards of medical care in diabetes. Diabetes Care. 2011;34(suppl 1):S11-S61.
23. ACOG Practice Bulletin. Clinical management guidelines for obstetrician-gynecologists. Medical management of abortion. Obstet Gynecol. 2001;97(4):1-14.
24. Landon M, Gabbe S. Gestational diabetes mellitus. Obstet Gynecol. 2011;118:1379-1393.
25. Mazze R, Yogev Y, Langer O. Measuring glucose exposure and variability using continuous glucose monitoring in normal and abnormal glucose metabolism in pregnancy. J Matern Fetal Neonatal Med. 2012;7:1171-1175.
26. Siegelaar S, Holleman F, Hoekstra J, et al. Glucose variability: does it matter? Endocr Rev. 2010;31(2):171-182.
27. Murphy H, Rayman G, Duffield K, et al. Changes in the glycemic profiles of women with type 1 and type 2 diabetes during pregnancy. Diabetes Care. 2007;30(11):2785-2790.
28. Secher A, Ringholm L, Andersen H, et al. The effect of realtime continuous glucose monitoring in pregnant women with diabetes: a randomized controlled trial. Diabetes Care. 2013;36(7):1877-1883.
29. Evers I, deValk H, Visser G. Risk of complications of pregnancy in women with type 1 diabetes: nationwide prospective study in the Netherlands. BMJ. 2004;328:915.
30. Brownlee M. Biochemistry and molecular cell biology of diabetic complications. Nature. 2001;414:813-820.
31. Brownlee M. The pathobiology of diabetic complications: a unifying mechanism. Diabetes. 2005;54:1615-1625.
32. Landon M, Spoong C, Thorn E, et al. A multicenter, randomized trial of treatment for mild gestational diabetes. N Engl J Med. 2009;361:1339-1348.
33. Landon M. Is there a benefit to the treatment of mild gestational diabetes mellitus? Am J Obstet Gynecol. 2010;202(6):649-653.
34. Crowther C, Hiller J, Moses J, et al. Effect of treatment of gestational diabetes mellitus on pregnancy outcomes. N Engl J Med. 2005;353:2477-2486.
35. Langer O, Yogev Y, Most O, et al. Gestational diabetes: the consequences of not treating. Am J Obstet Gynecol. 2005;192:989-997.
36. Langer O, Yogev Y, Xenakis E, et al. Overweight and obese in gestational diabetes. The impact on pregnancy outcome. Am J Obstet Gynecol. 2005;192:1768-1776.
37. Langer-Most O, Langer O. Gestational diabetes: maternal weight gain in relation to fetal growth, treatment modality, BMI and glyce- mic control. J Matern Fetal Neonatal Med. 2012;25(4):2458-2463.
38. Chengi Y, Chung J, Kurbisch-Block I, et al. Gestational weight gain and gestational diabetes mellitus: perinatal outcomes. Obstet Gynecol. 2008;112:1015-1022.
39. Artal R, Lockwood C, Brown H. Weight gain recommendations in pregnancy and the obesity epidemic. Obstet Gynecol. 2010;115:152-155.
40. Bergman R, Findgood D, Adger M. Assessment of insulin sensitivity in vivo. Endocr Rev. 1985;6:45-86.
41. Berkus M, Langer O, MacFarland M, et al. Effects of treatment on glucose metabolism during pregnancy. Am J Obstet Gynecol. 1998;178:S58.
42. Langer O. Management of gestational diabetes. Clin Obstet Gynecol. 2000;43(1):106-115.
43. Tam C, Xie W, Johnson W, et al. Defining insulin resistance from hyperinsulinemic-euglycemic clamps. Diabetes Care. 2012;35:1605-1610.
44. American Diabetes Association. Workshop-conference on gestational diabetes. Diabetes Care. 1980;3:399.
45. Freinkel N. Proceedings of the second international workshop-conference on gestational diabetes mellitus. Diabetes. 1985;34(suppl 2):1.
46. Management of diabetes mellitus in pregnancy. ACOG Technical Bulletin. 1986;92:1.
47. ACOG Practice Bulletin. Clinical management guidelines for obstetrician-gynecologists. Medical management of abortion. Obstet Gynecol. 2001;30:1-13.
48. McFarland M, Langer O, Conway D, et al. Dietary therapy for gestational diabetes. How long is long enough? Obstet Gynecol. 1999;93:978-982.
49. Langer O, Berkus M, Brustman L, et al. The rationale for insulin management in gestational diabetes mellitus. Diabetes. 1991;40(S2):186-190.
50. International Workshop on Gestational Diabetes. 1997;20(7): 1183-1197.
51. Langer O. Maternal glycemic criteria for insulin therapy in GDM. Diabetes Care. 1998;21(2):B1-B8.
52. American College of Obstetricians and Gynecologists. Management of diabetes mellitus in pregnancy. Technical Bulletin 92;ACOG 1996.
53. Barfield W, Martin J, Hoyert D. Racial/ethnic trends in fetal mortality in United States, 1990-2000. MMWR Morbid Mortal Weekly Rep. 2004;53:529-532.
54. United States Stillbirth Collaborative Research Network. JAMA. 2011;306:2459-2469.
55. Iams J, Lynch C. Stillbirths and lessons for pregnancy care. JAMA. 2011;306:2506-2507.
56. Fetal and perinatal mortality, United States 2006. National Vital Statistics Report 2012; Volume 60 (8).
57. Karlsson K, Kjellmer I. The outcome of diabetic pregnancies in relation to the mother’s blood sugar level. Am J Obstet Gynecol. 1972;112:213-220.
58. Landon M, Langer O, Gabbe S, et al. Fetal surveillance in pregnancies complicated by insulin-dependent diabetes mellitus. Am J Obstet Gynecol. 1992;167:617-621.
59. Cundy T, Gamble G, Townend K, et al. Perinatal mortality in type 2 diabetes mellitus. Diabet Med. 2000;17:33-39.
60. Casson I. Pregnancy in women with diabetes—after the CEMACH report, what now? Diabet Med. 2006;23:481-484.
61. Platt M, Stanisstreet M, Casson I, et al. St Vincent declaration 10 years on: outcomes of diabetic pregnancies. Diabet Med. 2002;19:216-220.
62. Vaarasmaki M, Gissler M, Ritvanen A, et al. Congenital anomalies and first year life surveillance in type 1 diabetic births. Diabet Med. 2002;19:589-593.
63. Penney GC, Mair G, Pearson DW; Scottish Diabetes in Pregnancy Group. Outcomes of pregnancies in women with type 1 diabetes in Scotland: a national population-based study. BJOG. 2003;110(3):315-318.
64. Boulot P, Chabbert-Buffet N, d’Ercole C, et al. French multicentric survey of outcome of pregnancy in women with pregestational diabetes. Diabetes Care. 2003;26:2990-2993.
65. Wood S, Jick H, Sauve R. The risk of stillbirth in pregnancies before and after the onset of diabetes. Diabet Med. 2003;20:703-707.
66. Luenborg J, Mathiesen E, Ovesen P, et al. Audit on stillbirths in women with pre-gestational type 1 diabetes. Diabetes Care. 2003;26:1385-1389.
67. Diabetes and pregnancy group, France. French multicentric survey of outcome of pregnancy in women with pregestational diabetes. Diabetes Care. 2003;26:2990-2993.
68. Colstrup M, Mathiesen E, Damm P, et al. Pregnancy in women with type 1 diabetes: have the goals of St. Vincent declaration been met concerning fetal and neonatal complications? J Matern Fetal Neonatal Med. 2013;26:1682-1686.
69. O’Sullivan J, Charoes D, Mahan C, et al. Gestational diabetes and perinatal mortality rate. Am J Obstet Gynecol. 1973;1:901-904.
70. Pettitt D, Knowles W, Baird H, et al. Gestational diabetes: infant and maternal complications of pregnancy in relation to third-trimester glucose tolerance in the Pima Indians. Diabetes Care. 1980;3:458-464.
71. Beischer N, Wein P, Sheedy M, et al. Identification and treatment of women with hyperglycemia diagnoses during pregnancy can significantly reduce perinatal mortality rates. Aust NZ J Obstet Gynecol. 1996;36:239-247.
72. Abell D, Beischer N. The effects of hypoglycemia and hyperglycemia on pregnancy outcome. Aust NZ Obstet Gynecol. 1976;16:75-81.
73. Schmidt M, Duncan B, Reichelt A, et al. Gestational diabetes mellitus diagnosed with a 2-h 75-g oral glucose tolerance test and adverse pregnancy outcomes. Diabetes Care. 2001;24:1151-1153.
74. Yogev Y, Most O, Langer O. Gestational diabetes mellitus: is there a risk for perinatal mortality? Am J Obstet Gynecol. 2004;191(6 suppl):S51.
75. Mondestin M, Ananth C, Smulian J, et al. Birth weight and fetal death in the United States: the effect of maternal diabetes during pregnancy. Am J Obstet Gynecol. 2002;187:922-926.
76. Miodovnik M, Lavin J, Knowles H, et al. Spontaneous abortion among insulin-dependent diabetic women. Am J Obstet Gynecol. 1984;150:372-376.
77. Kalter H. Diabetes and spontaneous abortion: a historical review. Am J Obstet Gynecol. 1987;156:1243-1253.
78. Wright A, Nicholson H, Pollock A, et al. Spontaneous abortion and diabetes mellitus. Postgrad Med J. 1983;59:295-298.
79. Miodovnik M, Mimouni F, Tsang R, et al. Elevated maternal glycohemoglobin in early pregnancy and spontaneous abortion among insulin-dependent diabetic women. Am J Obstet Gynecol. 1985;153:439-442.
80. Miodovnik M, Mimouni F, Tsand RC, et al. Glycemic control and spontaneous abortion in insulin-dependent diabetic women. Obstet Gynecol. 1986;68:366-369.
81. Greene M, Hare J, Cloherty J, et al. First-trimester hemoglobin A1 and risk for major malformation and spontaneous abortion in diabetic pregnancy. Teratology. 1989;39:225-231.
82. Rosenn B, Miodovnik M, Combs C, et al. Glycemic thresholds for spontaneous abortion and congenital malformations in insulin- dependent diabetes mellitus. Obstet Gynecol. 1994;84:515-520.
83. Driscoll S. The pathology of pregnancy complicated by diabetes mellitus. Med Clin North Am. 1965;49:1052-1057.
84. Kjos S, Henry O, Montora M, et al. Insulin-requiring diabetes in pregnancy: a randomized trial of active induction of labor and expectant management. Am J Obstet Gynecol. 1993;169:611-615.
85. Lurie S, Matzkel A, Weissman A, et al. Outcome of pregnancy in class A1 and A2 gestational diabetic patients delivered beyond 40 weeks’ gestation. Am J Perinatol. 1992;9:484-488.
86. Widness J, Cowett R, Coustan D, et al. Neonatal morbidities in infants of mothers with glucose intolerance in pregnancy. Diabetes. 1985;34:61-65.
87. Gyves M, Schulman P, Merkatz I. Results of individualized intervention in gestational diabetes. Diabetes Care. 1980;3:495-501.
88. American Diabetes Association. Position statement on preconception care. Diabetes Care. 1998;21:S56-S59.
89. Fuhrman K, Reiher H, Semmler K, et al. Prevention of congenital malformation sin infants of insulin-dependent diabetic mothers. Diabetes Care. 1983;6:219-224.
90. Kitzmiller J, Gavin L, Gin G, et al. Preconception care of diabetes: glycemic control prevents congenital anomalies. JAMA. 1991;265:731-736.
91. Pedersen L, Pedersen J. Congenital malformations in diabetic pregnancies. Acta Paediatr Scand Suppl. 1985;320:79-84.
92. Miller E, Hare J, Cloherty J, et al. Elevated maternal hemoglobin A1c in early pregnancy and major congenital anomalies in infants of diabetic mothers. N Engl J Med. 1981;304:1331-1334.
93. Mills J, Knopp R, Simpson J, et al. National Institute of Child Health and Human Development Diabetes in Early Pregnancy Study. Lack of relation of increased malformation rates in infants of diabetic mothers to glycemic control during organogenesis. N Engl J Med. 1988;318:671-676.
94. Schaefer-Graf U, Buchanan T, Xiang A, et al. Patterns of congenital anomalies and relationship to initial maternal fasting levels in pregnancies complicated by type 2 and gestational diabetes. Am J Obstet Gynecol. 2000;182(2):313-320.
95. Jacobson J, Cousins L. A population-based study of maternal and perinatal outcome in patients with gestational diabetes. Am J Obstet Gynecol. 1989;161:981-986.
96. Drexel H, Bichler A, Sailer S, et al. Prevention of perinatal morbidity by tight metabolic control in gestational diabetes mellitus. Diabetes Care. 1988;11:761-768.
97. Langer O, Levy J, Brustman L, et al. Glycemic control in gestational diabetes mellitus—how tight is tight enough: small-for-gestational age versus large-for-gestational age? Am J Obstet Gynecol. 1989;161:646-653.
98. Jovanovic-Peterson L, Peterson C, Reed G, et al. National Institute of Child Health and Human Development Diabetes in Early Pregnancy Study. Maternal postprandial glucose levels and infant birth weight: the diabetes in early pregnancy study. Am J Obstet Gynecol. 1991;164:103-111.
99. Langer O. A scientific rational for the management of diabetes in pregnancy: recent approaches using innovative computer-based technology. Diabetes Care. 1988;11:67-72.
100. William S, Leveno K, Guzick D, et al. Glucose threshold for macrosomia in pregnancy complicated by diabetes. Am J Obstet Gynecol. 1986;154:470-475.
101. Small M, Cameron A, Lunan B, et al. Macrosomia in pregnancy complicated by insulin-dependent diabetes mellitus. Diabetes Care. 1987;10:594-599.
102. Adashi E, Pinto H, Tyson J. Impact of maternal euglycemia on fetal outcome in diabetic pregnancy. Am J Obstet Gynecol. 1979;133:268-274.
103. Jovanovic-Peterson L, Durak E, Peterson C. Randomized trial of diet versus diet plus cardiovascular conditioning on glucose levels in gestational diabetes. Clin J Obstet Gynecol. 1989;161:415-419.
104. Landon M, Gabbe S, Pi ana R, et al. Neonatal morbidity in pregnancy complicated by diabetes mellitus: predictive value of maternal glycemic profiles. Am J Obstet Gynecol. 1987;156:1089-1095.
105. Roversi G, Garguilo M, Nicolini U, et al. Maximal tolerated insulin therapy in gestational diabetes. Diabetes Care. 1980;3:479^84.
106. Langer O, Yogev Y. Gestational diabetes: does an association exist between deviant fetal growth and glycemic control? Am J Obstet Gynecol. 2004;189(6)(abst):151.
107. Ramel S, Demerath E, Gray H, et al. The relationship of poor linear growth velocity with neonatal illness and two-year neurodevelopment in preterm infants. Neonatology. 2013;102:19-24.
108. Trevisanuto D, Peruzzetto C, Cavallin F, et al. Fetal placental inflammation is associated with poor neonatal growth of preterm infants: a case-control study. J Matern Fetal Neonatal Med. 2013;26(15):1484-1490.
109. Mestan K, Yu Y, Matoba N, et al. Placental inflammatory response is associated with poor neonatal growth: preterm birth cohort study. Pediatrics. 2010;125:e891-e898.
110. Sokol R, Kazzi G, Kalhan S, et al. Identifying the pregnancy at risk for intrauterine growth retardation: possible usefulness of the intravenous glucose tolerance test. Am J Obstet Gynecol. 1982;143:220-223.
111. Khouzami V, Ginsburg D, Daikoku N, et al. The glucose tolerance test as a means of identifying intrauterine growth retardation. Am J Obstet Gynecol. 1981;139:423-426.
112. Abell D. The significance of abnormal glucose tolerance (hyperg- lycaemia and hypoglycaemia) in pregnancy. Br J Obstet Gynecol. 1979;86:214-221.
113. Sabata V. Glucose tolerance tests in women with small-for-date fetuses and newborns. Biol Neonate. 1979;35:145-426.
114. Langer O, Damus K, Maiman M, et al. A link between relative hypoglycemia-hypoinsulinemia during oral glucose tolerance tests and intrauterine growth retardation. Am J Obstet Gynecol. 1986;155:711-716.
115. Piper JM, Field NT, Higby K, et al. Maternal fetal glucose metabolism and fetal growth retardation: is there an association? J Reprod Med. 1996;41:761-766.
116. Delmis J, Drazancic A, Ivanisevic M, et al. Glucose, insulin, HGH, and IGF-1 levels in maternal serum, amniotic fluid and umbilical venous serum: a comparison between late normal pregnancy and pregnancies complicated with diabetes and fetal growth retardation. J Perinat Med. 1992;20:47-56.
117. Economides DL, Nicolaides KH. Blood glucose and oxygen tension levels in small-for-gestational age fetuses. Am J Obstet Gynecol. 1989;160:385-389.
118. Economides DL, Proudler A, Nicolaides KH. Plasma insulin in appropriate-and small-for-gestational age fetuses. Am J Obstet Gynecol. 1989;160:1091-1094.
119. Hubinont C, Nicolini U, Fisk N, et al. Endocrine pancreatic function in growth retarded fetuses. Obstet Gynecol. 1991;77:541-544.
120. Adamkin D. Committee on the fetus and newborn. Pediatrics. 2011;127(3):575-579.
121. Langer O, Landon M, Gabbe S, et al. IDDM: the relationship between neonatal morbidity and glycemic control. In: Proceedings of the 38th Annual Meeting of the Society of Gynecologic Investigation; 1991; San Antonio, TX.
122. Piper J, Langer O. Does maternal diabetes delay fetal pulmonary maturity? Am J Obstet Gynecol. 1993;168:783-786.
123. Piper J, Langer O. Does maternal diabetes delay fetal pulmonary maturity? Am J Obstet Gynecol. 1993;3:783-786.
124. Piper J, Xenakis E, Langer O. Delayed appearance of pulmonary maturation markers is associated with poor glucose control in diabetic pregnancies. J Matern-Fetal Med. 1998;7:148-153.
125. Moore T. A comparison of amniotic fluid fetal pulmonary phospholipids in normal and diabetic pregnancy. Am J Obstet Gynecol. 2002;186:641-650.
126. Ojomo E, Coustan D. Absence of evidence of pulmonary maturity at amniocentesis in term infants of diabetic mothers. Am J Obstet Gynecol. 1990;163:954-957.
127. Berkowitz K, Reyes C, Saadat P, et al. Fetal lung maturation: comparison of biochemical indices in gestational diabetic and nondiabetic pregnancies. J Reprod Med. 1997;47:793-800.
128. Suhonen L, Teramo K. Hypertension and preeclampsia in women with gestational glucose intolerance. Acta Obstet Gynecol Scand. 1993;72:269-272.
129. Garner P, D’Alton M, Dudley D, et al. Preeclampsia in diabetic pregnancies. Am J Obstet Gynecol. 1990;163:505-508.
130. van Hoorn J, Dekker G, Jeffries B. Gestational diabetes versus obesity as risk factors for pregnancy-induced hypertensive disorders and fetal macrosomia. Aust NZ J Obstet Gynaecol. 2002;42:29-34.
131. Ma R, Lao T. Maternal mean arterial pressure and oral glucose tolerance test results. Relationship in normotensive women. J Reprod Med. 2001;46(8):747-751.
132. Vambergue A, Nuttens M, Goeusse P, et al. Pregnancy induced hypertension in women with gestational carbohydrate intolerance: the diagest study. Eur J Obstet Gynecol Reprod Biol. 2002;102(1):31-35.
133. Ros H, Cnattingius S, Lipworth L. Comparison of risk factors for preeclampsia and gestational hypertension in a population-based cohort study. Am J Epidemiol. 1998;147:1062-1070.
134. Goldman M, Kitzmiller J, Abrams B, et al. Obstetric complications with GDM. Effects of maternal weight. Diabetes. 1991;40(suppl 2):79-82.
135. Schaffir J, Lockwood C, Lapinski R, et al. Incidence of pregnancy-induced hypertension among gestational diabetics. Am J Perinatol. 1995;12:252-254.
136. Bartha J, Romero-Carmona R, Torrejon-Cardoso R, et al. Insulin, insulin-like growth factor-1, and insulin resistance in women with pregnancy-induced hypertension. Am J Obstet Gynecol. 2002;187:735-740.
137. Bauman W, Maimen M, Langer O. An association between hyper- insulinemia and hypertension during the third trimester of pregnancy. Am J Obstet Gynecol. 1988;159(2):446-450.
138. Langer O, Mazze R, Anyaegbunam A, et al. Linkages between chronic and pregnancy-induced hypertension and hyperinsuline- mia. In: Proceedings of the 34th Annual Meeting of the Society for Gynecologic Investigation; 1987; Atlanta, GA.
139. Yogev Y, Xenakis E, Langer O. The association between preeclampsia and the severity of gestational diabetes: the impact of glycemic control. Am J Obstet Gynecol. 2004;191:1655-1660.