
Oded Langer, MD, PhD
Information is a beacon, a cudgel, an olive branch, a deterrent, depending on who wields it and how...
—Steven D. Levitt
INTRODUCTION
The care provider's decision on the optimum time to deliver the infant in the pregnancy complicated by diabetes needs to balance between the perceived risk of late intrauterine death and shoulder dystocia and the consequences of unnecessary prematurity and cesarean section delivery. The timing of delivery will be mandated by the risk ratio of removing the fetus from the intrauterine environment compared to the risk to the mother and the fetus because of the intervention. Therefore, there is no absolute benefit for both patients. The benefit to one may result in increased risk for the other. As a rule of thumb, this equation is heavily weighted toward fetal versus maternal perspective. The maternal preconditions for planned delivery are integrally involved with the potential for damage to the fetus. For example, the failure of the mother to achieve the established levels of glycemic control may cause hyperinsulinemia in her fetus. The indications for planned delivery of a diabetic patient include macrosomia/large-for-gestational age (LGA), previous stillbirth, prevention of fetal demise, presence of hypertensive disorders, diabetic vasculopathy, poor compliance to the diabetic protocol resulting in adverse glycemic control, and reduction in potential shoulder dystocia.1
FACTORS ASSOCIATED WITH FETAL DEMISE: LGA AND GLYCEMIC CONTROL
Fetal demise, excluding congenital anomalies, is associated with the level of glycemic control and the vascular complications in the pregnant diabetic woman. A brief review of the literature2-3 reveals that approximately15%-25% of fetal death in the general population is due to diabetes in pregnancy. Today, our knowledge regarding the causes of diabetic death has expanded, but still, in certain cases, the origins are not clear. However, the high stillbirth rate (three- to fourfolds higher than the general population) indicates that diabetes per se is in large part responsible for the high rate. In a study examining the relationship between stillbirth rate and level of glycemia, 93 cases were involved, that is, 59 type 1 and 34 with type 2 diabetes. There were 73 stillbirths, 12 early neonatal deaths, 8 late neonatal deaths, and 18 attributable to congenital malformations. Sixty four of the cases were explained by antepartum asphyxia, four to intrapartum asphyxia, and three to postnatal hyaline membrane disease; only two were attributable to postnatal infection. The study provided evidence that maternal hyperglycemia not only causes fetal macrosomia but also angiopathy affecting the uteroplacental blood vessels and consequent fetal hypoxia.4 In pregnant diabetic women, Brownlee5 suggested that hyperglycemia induces intracellular production of advanced glycation end-product precursors that are responsible for damage to vascular endothelial cells. It is through this pathway that hyperglycemia activates protein kinase C (PKC); PKC decreases the expression of endothelial nitric oxide synthase and upregulates endothelin-1 that stimulates blood flow abnormalities. PKC also increases vascular endothelial growth factor, changing vascular permeability and increasing transforming growth factor § that leads to capillary occlusion. Animal models have suggested other possible mechanisms. Abnormalities in fetal apoptosis have been proposed. Diabetic embryopathy may be the result of an increased production of free radicals.6 Vasoactive agents such as endothe- lin-1 and prostaglandin E2 are raised in pregnancy affected by diabetes and may be related to induction of placental insufficiency and fetal hypoxia.7
Consequently, it is not realistic to expect that all deaths can be prevented with the currently available tools for fetal surveillance and management protocols.8,9 Current data suggest that fetal demise in the third trimester remains a major contemporary perinatal concern. Studies of type 1,10 type 2,11 and gestational diabetic mellitus (GDM)12 pregnant diabetic women reported statistically significant increased risk for fetal mortality among these women in comparison to nondiabetic controls. Fewer than 10% of the stillborns had recognizable anomalies. Therefore, maternal diabetes and failure to achieve glycemic control may cause higher rates of fetal demise than congenital anomalies.
Fetal demise in the pregnant diabetic woman is often described as “unexplained fetal death.” The demise is the result of the metabolic acidosis developed in the fetal compartment in the presence of an abnormal glucose level rather than the traditional explanation of fetal hypoxia. During the second and up to the middle of the third trimester, the risk for fetal demise is not as pronounced as during late gestation; the rates increase as the fetus's affinity to insulin is enhanced. Although insulin can be detected as early as the first trimester, the affinity to insulin action becomes significant at approximately 26-28 weeks’ gestation. This results in fetal hyperinsulinemia leading to fetal acidemia and hyperlacticemia often without evidence of fetal hypoxia. Supporting this concept, the work of Pettitt et al.13 in Pima Indians found that in 236/1000 fetal deaths, the majority occurred in LGA infants of GDM mothers. Needless to say, fetal hypoxemia and acidemia can occur in all types of diabetes, especially pregnancies associated with hypertensive disorder and microvascular complications (types 1 and 2). Maternal hyperin- sulinemia alone can be a cause for vasoconstriction leading to fetal hypoxia.14 Our data on 1004 preexisting diabetic women (358 type 1 and 746 type 2) demonstrated that 73% of stillbirths and 72% of neonatal deaths were LGA infants. In contrast, in 4757 GDM patients, only 27% of stillbirths and 28% of neonatal deaths were LGA. Overall deviant fetal growth, LGA and small-for-gestational age (SGA), was found in 61% of the stillbirths and 42% of the neonatal deaths. During the same period, the LGA rate in nondiabetic patients was approximately 12% in our population. In preexisting and gestational diabetes 85% and 67%, respectively, did not achieved targeted levels of glycemic control.15,16 During the same period, in nondiabetic patients, the rate of perinatal mortality for LGA fetuses was approximately 11% (Table 37-1).
TIMING OF DELIVERY: GESTATIONAL AGE
The view that the fetus of the mother with diabetes matures early and reaches the equivalent of term by 36 weeks gestation was championed by Peel and Oakley of King's College Hospital, London, in the late 1940s. They delivered all babies at 36 weeks based on a protocol that was diligent to the control of the mother's diabetes during pregnancy. The key outcome parameter they failed to address was the rise in neonatal death from 10.7% to 14.2%.17 White et al.18 in Boston also recommended that women with Class D, E, and F diabetes be delivered at 36 weeks, although they did allow Class B and C to reach 38 weeks and Class A to go to term. In 1979, Roversi et al.19 challenged this regimen demonstrating that it was meticulous attention to blood glucose control that was the key factor in reducing perinatal mortality and, in particular, late intrauterine fetal death. Using the maximum dose of insulin that could be tolerated by the mother, they carried 94% of the pregnancies to 38 weeks or more, 10% not being delivered until after 40 weeks. The only late fetal death occurred at 37 weeks in a woman with diabetic nephropathy. Drury et al.20 at the National Maternity Hospital in Dublin reported their experience of the first 141 diabetic pregnancies managed using a regimen of tight control and not delivering the baby before full term irrespective of the degree of severity of the diabetes unless obstetric complications necessitated intervention. This was done without the use of either cardiographic surveillance or ultrasonic assessment of fetal well-being. Spontaneous labor ensued in 57% of cases; the cesarean section rate was 20% and perinatal mortality 31/1000.
TABLE 37-1 Selected Characteristics of Patients with Diabetes Complicated with Perinatal Mortality
|
Stillbirth |
Neonatal Death |
||||
|
PGDM |
GDM |
PGDM |
GDM |
Nondiabetic |
|
|
Nulliparity (%) |
28% |
26% |
32% |
13% |
26.1% |
|
Poorly controlled |
85% |
65% |
87% |
72% |
— |
|
LGA |
73% |
27% |
72% |
28% |
11% |
|
AGA |
21% |
39% |
22% |
58% |
78% |
|
SGA |
5% |
34% |
6% |
14% |
11% |
|
Obesity |
50% |
50% |
48% |
50% |
24% |
|
History of previous stillbirth |
17% |
19% |
16% |
13% |
1.5% |
|
Hx of macrosomia |
52% |
45% |
49% |
40% |
8% |
|
Preeclampsia |
12% |
10% |
13% |
8% |
5.0% |
|
Chronic hypertension |
22% |
22% |
27% |
23% |
6.1% |
|
GDM, Gestational diabetes mellitus; PGDM, pregestational diabetes mellitus Type 1 and Type 2; AGA, appropriate-for-gestational age. |
|||||
Varied suggested times of delivery have been reported in the literature. However, this multidimensional issue must be attentive to deviant fetal growth, level of glycemic control, lung maturation, and fetal metabolism. The continuing controversy about the optimal timing of delivery for women with GDM weighs the risk of stillbirth against that of neonatal and infant morbidity and mortality. In Rosenstein's study,21 the mortality risk of a week of expectant management was defined as the risk of stillbirth versus that week plus the mortality risk experienced by infants born in the following week of gestation. Their report was based on a data set of 4,190,953 deliveries (excluding congenital anomalies) but including GDM from gestational ages 36-42 weeks. They reported that at 36-39 weeks’ gestation, women with GDM had statistically significant relative risk (RR) of stillbirth (approximately 1.45). The risk of mortality from delivery is higher than expectant management at 36 weeks’ gestation but similar at 37 weeks. In contrast, expectant management exceeds the risk of delivery at >38 weeks. The problem with this study is the use of an administrative database lacking vital data required to draw adequate conclusions such as information on glycemic control, treatment modality, and stratification of neonatal outcome such as macrosomia. In our data, 70% of stillbirths of type 2 diabetic occurred after 37 weeks’ gestation and 30% to type 1 women. Of the neonatal deaths in preexisting diabetes, 90% occurred after 37 weeks. Different associations to gestational age were found in the GDM patients in whom 62% of stillbirths and 43% of neonatal deaths occurred before 37 weeks. The majority of these neonates (82%) died within a week after delivery reflecting the severity of the neonatal disease.15,16
The current data suggest that the majority of stillbirths and neonatal deaths are the result of patients’ failure to achieve glyce- mic control, and metabolically impaired LGA infants (not excluding SGA). These data support planned intervention for delivery. On the other hand, the distribution of stillbirths throughout the third trimester challenges the recommendations of experts to initiate fetal testing in GDM late in the third trimester as over 62% of stillbirths in this group occur below 37 weeks’ gestation.
LUNG MATURATION AND IATROGENIC PREMATURITY
As described above, the fear of stillbirths in the past and even in current practice in many maternity units in the United States and Europe encouraged the policy of planned delivery of diabetic patients at approximately 34-37 weeks’ gestation. This policy significantly decreased the stillbirth rate but, in contrast, resulted in iatrogenic prematurity with the accompanying neonatal complications especially respiratory distress syndrome (RDS) (formerly known as hyaline membranous disease). These complications encouraged research in the development of fetal maturity lung testing, which is addressed at length elsewhere in the book.
In the past few decades, lung maturity testing has enabled us to significantly decrease iatrogenic prematurity and to comprehend the impact of glycemic control and the delay in lung maturation. We now have the technology to synchronize planned deliveries and lung maturity. The contemporary approach to fetal surveillance testing and the recognition of the importance of glucose control enables us to minimize planned deliveries for fear of fetal demise. On the other hand, perhaps this is an opportune time to consider planned delivery for the oversized fetus (macrosomic) in order to prevent shoulder dystocia and its accompanying complications.22 This study compared patients delivered between 36 0/7-38 6/7 weeks to a group who delivered between 39/40 weeks’ gestation. Composite outcome, RDS, treated hyperbilirubinemia, and hypoglycemia were elevated in the early delivery group. In the study, even though lung maturity was found in the early delivery group, other problems existed such as hyperbilirubinemia and hypoglycemia that are more common in premature infants. Although the authors recommended postponement of delivery until 39 weeks, this endorsement was based on nondiabetic patients. The clinician needs to weigh the diabetic risk to the fetus against all other above described risks.
In our institution, we used the following approach for lung maturity testing before delivery. In patients with imminent fetal compromise or death as reflected by specific abnormal patterns of surveillance testing23,24 or severe maternal complications that require immediate delivery/termination of pregnancy, delivery occurred without fetal lung testing. The rationale for this approach is that it is better to deliver a live baby with immature lungs than a stillbirth with mature lungs. In cases in which the indication did not pose an immediate risk to mother and fetus, for example, previous cesarean section or growth restriction but normal fetal surveillance testing results, only in the presence of positive lung maturity testing did delivery occur. If test results are negative, patients should be under strict surveillance and lung maturity testing needs to be repeated within a week.
Glycemic control should always be considered in the decision process to perform/not to perform lung maturity testing. In cases of poor glycemic control, regardless of gestational age, amniocentesis for lung maturity testing should be performed. On the other hand, in the presence of good glycemic control and reassuring dates for patients after 37 weeks’ gestation, delivery can be performed without prior testing. This approach will decrease the number of unnecessary invasive procedures performed to confirm or refute lung maturity.
FETAL OVERGROWTH OR UNDERGROWTH IN THE DIABETIC PREGNANCY
Being relatively common and easily documented, macrosomia or growth-restricted fetuses are the primary perinatal outcome most investigators refer to when addressing GDM. Growth diversity is related to relevant surrogate complications such as cesarean section, shoulder dystocia, and brachial plexus injury (BPI) and perinatal mortality.25 Clinicians managing diabetic patients, especially with severe fetal growth restriction and Doppler changes need to decide whether to deliver immediately or to strive for a longer period for maturation to occur. Within the delayed group23,24 more intrauterine deaths but fewer neonatal deaths occurred compared with the immediate delivery group. For infants who survived, the study showed that there was little difference in their cognition or motor scores or in their parents’ assessment of their behavior; these findings were similar to those of the general population. However, these results still do not benefit the decision-making process for the physician managing a patient in these conditions.
Macrosomic fetuses are born to both diabetic and nondiabetic mothers. The rate of macrosomia in nondiabetic mothers is approximately 8%-9%; in diabetic mothers, the reported rate is 20%-50%. Do all macrosomic fetuses experience the same risks or does genetic predisposition toward greater birth weight or the intrauterine environment alter both long- and short-term consequences of macrosomia? Different definitions of weight persist to define the macrosomic fetus. The American College of Obstetricians and Gynecologists has defined macrosomia as birth weight or estimated fetal weight (EFW) greater than either 4000 or 4500 g, irrespective of gestational age. Therefore, the rate of reported macrosomia will be influenced by the weight threshold used in a study. Esakoff et al.26 compared two groups of macro- somic neonates (weight >4000 g) from GDM and the other from non-GDM mothers. He found that the adjusted odds ratio (OR) was 2- to 10-folds higher for hyperbilirubinemia, hypoglycemia, and neonatal RDS; for shoulder dystocia 16.45(6.71-40.33) and BPI 41.89(4.05-433.64) for the diabetic macrosomic group in comparison to the reference group. We also evaluated 75,363 consecutive vaginally delivered infants from our departmental database (1970-1985). Gravids were stratified into diabetic and nondiabetic groups and further by weight category (> and <4000 g). The analysis revealed that the infants of the diabetic women were at higher risk compared to the nondiabetic group: (1) a fourfold risk for macrosomia; (2) overall, the risk for shoulder dystocia was 5.9 (95% CI: 4.4-8.0) for diabetic women; (3) shoulder dystocia for diabetic patients in both weight categories: <4000 g (RR 2.60; 95% CI: 1.3-5.3) and >4000 g (RR 3.4; 95% CI: 2.4-4.8). See Table 37-2.
Other major factors that influence practitioner decision making on timing of delivery are the likelihood of shoulder dystocia and the potential for permanent brachial plexus nerve palsy. Shoulder dystocia is rare with an incidence of 1-5/1000. Therefore, the average obstetrician has limited skill in addressing this complication. But, shoulder dystocia has been aptly described as “the infrequent, unanticipated, unpredictable nightmare of the obstetrician.”27 This condition is associated with high rates of morbidity and mortality and increased numbers of medical liability cases out of any proportion to the rate of its occurrence. Most lawsuits involving shoulder dystocia allege negligence as the cause of BPI, fracture of clavicle and humerus, fetal death, brain damage, and other neonatal and maternal injuries. In a review addressing the medicolegal risks of shoulder dystocia, Zylstra et al.28 retrospectively reviewed all cases over a seven-year period closed by the Boston-based ProMutual Group, a major liability insurance carrier. The most characteristic prenatal factor associated with litigation was gestational diabetes and obesity involving 38/61 cases closed with an indemnity payment. The total indemnity was $20,745,000.00 with a mean indemnity of approximately $546,000.00. The intrapartum factors associated with litigation of shoulder dystocia cases included prolonged second stage, oxytocin induction and augmentation, forceps delivery, and vacuum extraction involving 43/61 cases. These cases closed with a total indemnity payout of $25,954,100.00. The mean indemnity was approximately $603,600.00. These examples demonstrate the magnitude of the problem and the economic costs surrounding this issue. The reader should note that this data come from a single information source, in a single city, from a single state. When you consider the numerous databases, collecting data from thousands of cities in all 50 states, the documented injuries and their economic ramifications are staggering.
TABLE 37-2 Compression of Perinatal Complications by Neonatal Size
|
Nondiabetic |
Nondiabetic |
Diabetic |
Diabetic |
||
|
<4000 g |
>4000 g |
<4000 g |
>4000 g |
Total Cases |
|
|
No complications |
61.6% |
55.2% |
59.3% |
54.7% |
61.0% |
|
Preeclampsia |
6.6% |
6.8% |
12.7% |
18.0% |
6.8% |
|
Trauma |
0.5% |
1.5% |
1.1% |
3.7% |
0.6% |
|
Fetal distress |
17.8% |
24.1% |
18.1% |
33.3% |
18.3% |
|
Delivery complications |
23.5% |
31.3% |
20.8% |
44.0% |
24.1% |
|
Birth defects |
2.4% |
2.9% |
4.2% |
6.7% |
2.5% |
|
Shoulder dystocia |
0.2% |
4.2% |
0.6% |
19.0% |
0.6% |
|
Stillbirth |
1.2% |
1.2% |
4.2% |
12.2% |
1.2% |
|
Total cases |
68.115 |
5.668 |
1253 |
327 |
75.363 |
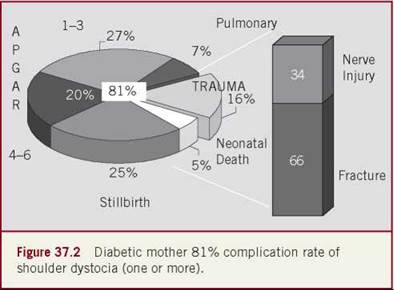
Adverse neonatal outcome involves a substantial number of neonates. We reported that in nondiabetic neonates with shoulder dystocia, 37% had one or more complications (Figure 37-1).27 The rate increased to 81% in infants of diabetic mothers (Figure 37-2). BPI occurred in about 15% (range 4%-40%) of the shoulder cases, 20% of these being permanent injuries. Therefore, overall, there are about 3% (range 3%-10%) of cases with permanent injury.29-32
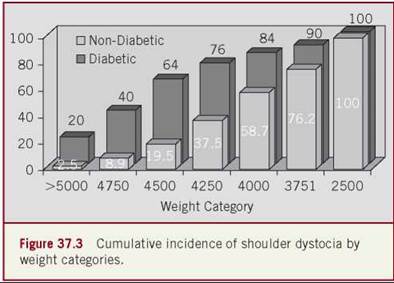
There is a significant proportion (34%-47%) of BPIs that are not related to shoulder dystocia; 4% of injuries occur after cesarean section delivery.33-37 BPI can occur without the involvement of any traction or physical force. It was reported to be associated with precipitate vaginal delivery.29 In addition, in some cases, the BPI occurs in the posterior arm and not in the anterior arm that was impacted against the symphysis pubis.29,32,33,38-40 Hypoxic- ischemic encephalopathy and even death may also be the end result of shoulder dystocia.36,40 In addition, asphyxia is more common and occurs during labor even in cases when diabetes is not present.36 Finally, some authors suggest that infection such as toxoplasmosis, coxsackievirus, mumps, pertussis, or mycoplasma pneumonia may be a cause for BPI.29 Performing serial electromyelograms within the first seven days of life to establish a prenatal rather than intrapartum etiology has been suggested. A positive electromyelogram within one week of birth would suggest antepartum causation.29,41 Just as the rate of shoulder dystocia goes up with increasing birth weight, so too does the risk of injury when shoulder dystocia occurs. Ecker et al.42 found a RR for BPI of 9.6 for infants weighing >4000 g versus <4000 g; the RR increased to 17.9 and 45.2 at birth weight thresholds >4500 and 5000 g, respectively. Increasing birth weight, maternal diabetes, and vaginal delivery were all independently associated with an increased risk for BPI. Some authors use the definition of macrosomia based on the weight cutoff of 4500 g because the risk for BPI increases from 18% (>4500 g) to 45% (>5000 g) compared to baseline. However, there is a tenfold increase in BPI in the 4000 g weight threshold. As the majority of diabetic fetuses are below the 4500-g weight category, not addressing the problem of BPI in this group will result in a high number of infants exposed to the injury (Figure 37-3 and Table 37-3).
TABLE 37-3 Rate (%) of SHD by Weight Categories
|
Weight |
Diabetic |
Nondiabetic |
|
2500-3750 |
0.5 |
0.2 |
|
3751-3999 |
1.2 |
1.0 |
|
4000-4249 |
3.0 |
2.6 |
|
4250-4499 |
6.9 |
5.0 |
|
4500-4749 |
21.8 |
7.5 |
|
4750-4999 |
35.7 |
12.9 |
|
>5000 |
38.5 |
8.9 |

The overgrown fetus of a diabetic mother is at an increased risk for serious adverse outcomes because of shoulder dystocia during vaginal delivery. Traditionally, authors have emphasized Erb's palsy as the single most significant complication when shoulder dystocia occurs. However, the prevalence of Erb's palsy is relatively low. Shoulder dystocia without Erb's palsy remains a serious complication involving bone fractures, asphyxia, and even fetal death. Cesarean delivery greatly reduces the likelihood of such outcomes and may, therefore, be used as the primary prevention approach. However, it should be noted that cesarean delivery does not eliminate the possibility of fetal and/or maternal complications (increased maternal blood loss, traumatic organ injury [ureters], infection, as well as other long-term complications). Therefore, although cesarean section rates are increasing universally, the benefit-risk ratio should be assessed for any given complication before surgery.
CAN SHOULDER DYSTOCIA BE PREDICTED?
We cannot predict shoulder dystocia with a high level of accuracy. However, we can identify risk factors that contribute to this complication. Our mission is to attempt to prevent shoulder dystocia or at minimum to significantly decrease this condition. The name of the game is prevention, not prediction. Several prenatal risk factors for the development of shoulder dystocia have been suggested. They include diabetes, maternal obesity, excessive weight gain, postdate pregnancy, previous shoulder dystocia,43-45 fetal macrosomia, and multiparty.27,30-35,46-53 Although all these factors have been suggested in univariant design studies as contributors for the risk of the complication, they are all associated with fetal macrosomia and, therefore, the question remains if it is the mac- rosomia, obesity, or a combination of both that is responsible for the occurrence of shoulder dystocia in labor.
The major dilemma for the obstetrician is the poor predictive power of methods for fetal weight assessment and particularly shoulder width in the fetus. Coupled with this is the dynamic interaction between the maternal pelvic girdle, the power of the uterine contractions, maternal expulsive efforts, and the fetal diameters that will ultimately determine whether the shoulders pass easily through the outlet of the maternal pelvis. Fetal weight alone is a poor predictor. Two parameters should be addressed when evaluating the relationship between shoulder dystocia and birth weight. First, is the complication more common in a given weight threshold? In cases with shoulder dystocia, approximately 40%-50% will occur within the infant group weighing <4000 g.27,53 The second question is which weight group will account for the largest number of shoulder dystocia cases. The number of gravid women whose fetuses weigh <4000 g are the majority, while the total number of infants weighing >4000 g is about 8%-10%. Therefore, despite the even distribution of shoulder cases, the total number of cases will be greater in the lower weight group.54-56
In diabetic patients, the majority of shoulder dystocia cases occur among macrosomic infants born vaginally. In a cohort study of nearly 75,000 nondiabetic women, the rate of macrosomic infants was 7.6% compared to 20.6% in the 1500 diabetic women. Nondiabetic women had an overall shoulder dystocia rate of 0.5% compared to 3.2% in diabetic women. The shoulder dystocia rate was 0.3% when birth weight was <4000 g in diabetic patients. Macrosomic infants of diabetic mothers had a more than threefold higher risk of shoulder dystocia than macrosomic infants of nondiabetic pregnancies (14.7% vs. 4.4%). In this study, we sought to evaluate if cesarean section delivery in a given weight category had an impact on the rate of shoulder dystocia if all patients were delivered by cesarean section at this weight threshold. We27 performed a retrospective analysis stratifying all neonates by actual birth weight within each 250-g birth weight category. The cumulative rate of shoulder dystocia in the categories >4000 g was 84% for the diabetic and 58% for the nondiabetic women. The incidence of macrosomia varies depending on glycemic control in a given population assuming rates of 8%-30% (80-300/1000). In contrast, in the nondiabetic population, which is the majority of pregnant women, using our study population, approximately 7,200 out of 75,000 live births would have to be delivered by cesarean section. In this theoretical model, we found that for diabetic patients, the rate of cesarean section would increase by 0.43% if the threshold was 4000 or greater preventing 84% of the shoulder cases. If the threshold is 4250 g, 76% of shoulder cases would be prevented. Using a higher threshold of 4500 g recommended by American College of Obstetricians and Gynecologists (ACOG)57 will increase the cesarean section rate by 0.14% but will still leave 46% unidentified shoulder cases. Therefore, the ACOG-recommended threshold does not address the main problem of how to decrease and prevent shoulder dystocia in diabetic patients. For nondiabetic patients, as approximately 50% of shoulder cases occur below 4000 g, any threshold above 4000 g that requires cesarean delivery will result in fewer cases of shoulder dystocia. To obtain the same effect of decreasing shoulder dystocia as in diabetic patients, a lower threshold of 3750 g would need to be used for the nondiabetic patients. Using this threshold increases the cesarean section rate by 17% but identifies 76% of shoulder cases. However, in nondiabetic women, using this approach will place the mother at greater risk with operative delivery than the benefit to the fetus in avoiding shoulder dystocia (Figure 37-3 and Table 37-4).
In summary, ACOG recommends that cesarean section be considered when EFW exceeds 5000 g. However, it should be noted that only 1.5% of shoulder cases weigh more than 5000 g. Moreover, 13.2% of shoulder cases will be in the 4500-4999 g weight category whereas 85.3% will be between 4000-4999 g. Therefore, these recommendations will not, in all practically, result in a change in the overall rate of shoulder dystocia in the population. ACOG also recommends that in diabetic patients cesarean section should be considered when fetal weight is >4500 g. Again, the majority of shoulder cases will be missed (Figure 37-3 and Table 37-4).
In contrast to ACOG recommendations, our policy is that recognition of risk factors (obesity, previous shoulder dystocia, etc.) for shoulder dystocia before delivery be incorporated into clinical decision making. In nondiabetic patients, trial of labor for all fetuses with weight >4000 g should be attempted with liberal policy toward cesarean section in the presence of labor abnormal- ities.27 A cesarean delivery is recommended for diabetic patients with weight estimation 4000-4250 g. The specific threshold should be determined based on level of glycemic control achieved in a given institution and the accuracy of the ultrasonography measurement. Using higher thresholds (4500 g) will not result in significantly decreasing rates of shoulder dystocia.27
TABLE 37-4 The Net Cumulative Contribution to Overall Cesarean Section by Weight Categories
|
DM |
Non-DM |
||||
|
Weight |
% C/S |
% SHD |
% C/S |
% SHD |
|
|
3750 |
0.76 |
90 |
16.8 |
76.0 |
|
|
4000 |
0.43 |
84 |
7.5 |
58.7 |
|
|
4250 |
0.26 |
76 |
3.1 |
37.5 |
|
|
4500 |
0.14 |
64 |
1.2 |
19.5 |
|
|
4750 |
0.07 |
40 |
0.4 |
8.9 |
|
|
>5000 |
0.03 |
20 |
0.1 |
2.5 |
C/S, Cesarean section.
WHY IS SHOULDER DYSTOCIA MORE COMMON IN INFANTS OF DIABETIC MOTHERS?
The anthropometric differences explain the discrepancy in the risk for shoulder dystocia between diabetic and nondiabetic women. In nondiabetic women, macrosomia is constitutional in origin, resulting in a proportionally larger infant. In contrast, for the diabetic macrosomic infant, its overgrowth is due to continuous fetal hyperinsulinemia resulting in disproportional growth and organomegaly in the majority of organs with the exception of the brain. There is a significant difference in several anthropometric measures such as abdominal and shoulder circumference as well as an increase in fetal fat mass distribution. Organ overgrowth is used as the marker to identify the fetus compromised by diabetic macrosomia.54,56,57 When comparing the macrosomic fetus of a diabetic to a nondiabetic mother, the infant is disproportionately larger, with much of the excess weight distributed in the trunk and shoulders. This increased chest-head and shoulder-head size discrepancy results in a higher risk for shoulder dystocia (Table 37-5).42,57,58
TABLE 37-5 The Relative Risk for Shoulder Dystocia by Birth Percentile
|
DM vs. Non-DM |
RR |
95% CI |
|
50 |
n.s |
n.s |
|
75 |
7.4 |
2.7-15.2 |
|
90 |
4.9 |
2.4-10.4 |
|
95 |
8.8 |
4.6-16.9 |
|
97 |
13.9 |
6.1-31.8 |
|
99 |
6.8 |
3.4-13.5 |
FETAL BODY COMPOSITION AND WEIGHT DISTRIBUTION
The body composition and weight distribution of infants of diabetic women differ from those of nondiabetic women. The fat mass accounts for a substantial portion of the variance in the birth weight between the two babies.59 Calculating a ratio between weight and length to determine if a baby is LGA may not be an accurate reflection of the differences in weight distribution. A study of LGA neonates (diabetic vs. nondiabetic mothers) reported no differences in birth weights, lengths, and body mass indices between both groups. However, the infants of diabetic mothers had a significantly greater sum of skinfold thickness (a measure of subcutaneous fat) than that of infants of nondiabetic mothers.60
The average maternal glucose concentrations or other metabolic factors characteristic of diabetic women may have influenced the variance in weight distribution. Keller et al.61 reported an asymmetrically large group of LGA neonates of type 1 diabetic mothers with abdominal circumference >90th percentile and biparietal diameters <90th percentile; symmetrically large babies had both measures >90th percentile. The HbA1c of the asymmetrical group was significantly greater than that of the symmetrical group. This may imply that the differential distribution of truncal fat in infants of diabetic mothers may be more dependent on maternal glucose concentrations than on overall constitutional fetal growth.
CESAREAN DELIVERY IN PREVENTING
SHOULDER DYSTOCIA AND FETAL INJURY
Discounting vaginal delivery for the large fetus of a diabetic mother generally precludes the potential for shoulder dystocia. Consequently, the risk of nerve and bone injury, as well as the more serious outcomes of birth asphyxia and intrapartum death as a consequence of shoulder dystocia is also eliminated. Although it is recognized that BPI can occur in the setting of cesarean delivery, the risk associated with vaginal birth is much greater.62-64 A population-based study of births in Washington State, USA, revealed no reported cases of brachial or Erb's palsy from over 13,000 consecutive cesarean deliveries.59 Therefore, in the majority of cases, performing a cesarean section will prevent Erb-Duchenne palsy and is the preferred method of delivery of the large fetus.
The practicality of elective cesarean section for prevention of shoulder dystocia is hampered by the difficulty to identify the macrocosmic fetus antenatally. Using the data from the above and other studies, Rouse et al.35,65 used a decision analysis model and estimated that 2345 cesarean deliveries will be required at a cost of $4.9 million annually to prevent one permanent injury resulting from shoulder dystocia if all fetuses suspected of weight 4000 g or more underwent cesarean delivery. They recommend that EFW greater than 5000 g in women without diabetes and estimated weight >4500 g in diabetic women be a consideration for cesarean delivery. Unfortunately, these recommendations were included in the ACOG Technical Bulletin addressing shoulder dystocia.51 Rouse et al.35,65 and the ACOG55 Technical Bulletin did not take into account that the incidence of macrosomia varies significantly depending on level of glycemic control. In programs whose participants achieved levels of glycemic control, the reported incidence of macrosomia was 3%-8%, which significantly reduced the need for elective delivery (cesarean delivery or induction). The authors quoted the costs in millions required to prevent one shoulder dystocia; however, they failed to include the cost of malpractice because of shoulder! These days, with the rise in cesarean section rates, recommendations for elective cesarean section for previous cesarean delivery and the argument advocating cesarean delivery by patient demand, the overall cesarean delivery rates will be minimally affected by the addition of cesarean delivery for fetal macrosomia of diabetic patients (0.26%-2.0% increase). The moral issue is not between what is right or wrong because we inherently understand and recognize the difference. What ultimately is being weighed is “what is ‘more’ right?” When all of us are working under the ethical mandate of first, do no harm (primum non nocere), the question if we can place a price on an infant or mother's life or on BPI remains unanswered moral dilemmas.
Rouse and Owen65,66 calculated the probability of shoulder dystocia based on birth weight in diabetic and nondiabetic pregnancies. For birth weights >4500 g, there is a 52% probability in diabetic compared to 14% in nondiabetic pregnancies. The mean probability that a neonatal BPI will persist was 6.7% (range 0%-19%). They calculated that to prevent one case of permanent BPI in babies weighting > 4500 g, it would necessitate performing 153 cesarean deliveries in diabetic and 419 in nondiabetic mothers. If a cutoff of 4000 g is used, then 169 cesarean sections would be required in diabetic versus 654 in nondiabetic women. Rouse and Owen65,66 updated their initial analysis by factoring in information from population-based studies on the frequency of BPI, both transient and persistent. These calculations suggest that an even greater number of cesarean sections need to be performed to prevent permanent palsies. However, Erb's palsy should not be the only consideration in evaluation of morbidity prevention by cesarean delivery. Although Erb's palsy is a severe complication, bone fractures, asphyxia, respiratory complications requiring neonatal intensive care admission, and neonatal and fetal demise should be considered when calculating the cost of cesarean sections performed to prevent shoulder dystocia and adverse outcome. In fact, when the composite outcome approach is used, 81% of shoulder dystocia cases from infants of diabetic mothers will be identified compared to 34% for infants of nondiabetic mothers.
Mullin et al.67 examined the results of their unit's policy of offering cesarean delivery to all diabetic women with EFW >4250 g (by sonographic or clinical means). Of 72 women meeting this fetal weight threshold during a three-year period, 61% opted for cesarean delivery. Seventeen of the remaining delivered vaginally (39% cesarean section rate in women who labored), and four of these deliveries were complicated by shoulder dystocia (24%). On the basis of previously reported rates of BPIs, the investigators calculated the number of cesarean sections needed to prevent one case of permanent Erb's palsy. In diabetic women, approximately 100-400 cesarean sections would result in avoidance of one case of permanent palsy. This number is somewhat more favorable toward a policy of prophylactic cesarean section than that estimated by Rouse. This highlights the fact that cost-benefit ratios of prophylactic cesarean sections for suspected macrosomia in diabetic women may be most meaningful when calculating for, and applied to, an individual population taking into account overall morbidity rather than a single outcome parameter. Different maternity units report varying cesarean section rates for diabetic patients from 15% to 80% or more. The number of cesarean deliveries needed to prevent shoulder dystocia and Erb's palsy will be determined by the background rate of cesarean section in a given institution. Moreover, different diabetic programs report different rates of macrosomia (poor glycemic control), which again affects the rate of shoulder dystocia. Diabetic women's ability to achieve targeted levels of glycemic control may prove to be a salient factor in decreasing the rate of this complication in pregnancy.
Theoretical models provide a foundation for clinical studies. However, there is scant information on the clinical impact of a policy of prophylactic cesarean section in reducing the frequency of shoulder dystocia events. If there is no significant decrease in shoulder dystocia rate, there cannot be an accompanying decrease in BPI and other adverse outcomes. We68 in a prospective study addressed this issue. Diabetic women were delivered by cesarean section when EFW by ultrasound was >4250 g, a threshold chosen to reduce unnecessary intervention because of sonographic error. Labor inductions of LGA fetuses with birth weights <4250 g were also performed. Although only 11% of the diabetic population was delivered by cesarean section or were induced for macrosomia, the shoulder dystocia rate among diabetic women dropped significantly on implementation of this procedure compared to the previous three years (1.5% vs. 2.8% [OR 0.5, 95% CI: 0.3-1.0]). Among macrosomic infants, the shoulder dystocia rate dropped from 19% to 7% (OR 0.3, 95% CI: 0.1-1.0). The cesarean delivery rate among diabetics rose from 21.7% to 25.1%. The results of this study demonstrated the possibility of reducing the rate of shoulder dystocia in diabetic women using prophylactic cesarean delivery for the macrosomic fetus. In this study, we found that the clinical accuracy of EFW using ultrasound for identifying macrosomic and nonmacrosomic infants was 86%. In 5.3%, macrosomia was missed; this group was delivered vaginally with a resultant 19% shoulder dystocia. In 7% of the cases, non- macrosomic infants were misdiagnosed as macrosomic and were delivered. The clinical cost of incorrect EFW by ultrasound (7%, 96/1377) was 22 cases that underwent induction of labor and 17 cases had elective cesarean section per our protocol for LGA/macrosomia. Twenty-two cases underwent induction of labor for other indications (e.g., preeclampsia); 8 cases had elective repeat section; 27 cases entered spontaneous labor. The impact of this protocol for the delivery of diabetic patients on our general obstetric population was an increased cesarean section rate of 1% and induction of labor for macrosomia 0.4%.
Several formulas based on different sonographic measurements of fetal organs have been developed to estimate fetal weight with varying accuracy and precision. For all methods, the accuracy of the fetal weight estimation decreases with increasing birth weight. Local formulas improve the EFW calculation. The combined formula can further optimize the accuracy and precision. Application of specific formulas for the small and the large fetus had the most pronounced effect in improving fetal weight estimation.69,70
In nondiabetic women, ultrasound biometry for the detection of macrosomia has a sensitivity of 22%-44%, a specificity of 99%, a positive predictive value of 30%-44%, and a negative predictive value of 97%-99%. Clinical studies have found no significant differences in absolute percent error of birth weight between infants of women with/without diabetes. The sensitivity and specificity of sonographic estimates of fetal weight in predicting birth weight of >90th percentile in diabetic pregnancies ranges from 70% to 96%, and 77% to 100%, respectively; corresponding values for predicting a birth weight of >4000 g are 33%-69% and 77%-98%, respectively. Ultrasonic estimation of fetal weight needs to take into account whether or not the mother has diabetes. Otherwise, there is a significant underestimation of fetal weight of >10% using conventional weight prediction tables.71 Diabetic pregnancies, because of the larger fetal weight, are five times more likely to be complicated by shoulder dystocia than nondiabetic pregnancies (5% vs. 1.1% for birth weights >4000 g).72
BPIs are four times more likely in diabetic pregnancies. However, because of scant long-term follow-up, the prevalence of the permanency of the injury has not been well established.65-66,73 Cesarean section rates for women with diabetes are significantly greater than for their nondiabetic counterparts in most series. Remsberg et al.73 conducted a detailed analysis of 42,071 singleton births in South Carolina, USA. Diabetic mothers compromised 3.6% of the series, 80% of which had GDM. Of the preexisting diabetic patients, 51.3% underwent cesarean delivery, as did 34.4% of those with GDM. For nondiabetic women, 22.9% of births were by cesarean section. Regression analysis demonstrated an association between diabetes and cesarean delivery that was not a result of infant size alone. The strongest reported associations were related to disproportion, previous cesarean delivery, failed induction, and malpresentation. These results and those from other studies suggest that the physician practice patterns and not mac- rosomia are the contributors to the high cesarean section rates.74-76
One major factor that contributes to cesarean section rates is the presence of a cesarean section scar. Two studies examined perinatal outcome of vaginal birth after cesarean delivery (VBAC) in women with diabetes. In the Coleman study,77 VBAC was offered if the sonographic EFA was <4000 g. Overall, the successful VBAC rate was lower in women with diabetes (64.1 vs. 73.2% [OR 1.90, 95% CI: 1.20-2.99]). This was not due to the higher induction rate in women with diabetes (OR 2.16, CI: 1.37-3.40). Women with diabetes who delivered vaginally were more likely to have an operative delivery: forceps (OR 2.71, CI: 1.15-6.45); vacuum (OR 2.59, CI: 0.89-7.73). Most importantly, there were no significant differences between the two groups in the incidence of shoulder dystocia, preeclampsia, pelvic lacerations, or prolonged hospitalization, and the only two ruptured uteri occurred in the control group. Blackwell et al.78 compared diabetic women with/without a previous cesarean section delivery. In the previous cesarean section group, the rate of repeat cesarean section doubled (56.3% vs. 26.3%) with a successful VBAC rate of 43.7%. We can deduce from these studies that in women with diabetes who have had a previous cesarean delivery it is reasonable and safe to offer both a VBAC and induction of labor.
RATIONALE FOR ELECTIVE INDUCTION OF LABOR IN DIABETES
The foundation for the decision for an elective induction of labor is based on the risk of fetal demise with continuation of pregnancy, the accelerated in utero fetal growth, and the association between fetal macrosomia, shoulder dystocia, and fetal injury. Attempted delivery at term will result in lower cesarean section rates than when pregnancy progresses and fetal weight estimation is >4000-4250 g. Thus, even with a higher rate of cesarean section in the induced group, it will still be less than the expected rate if all patients were sectioned electively. However, insufficient data are available to justify recommending either for or against induction of labor at term in pregnancies complicated by diabetes. Thus, the practitioner who elects to induce labor for his/her patient is well advised to observe the usual precautions taken by attendant on inductions for all pregnancies: taking special care to follow maternal glucose and Pitocin administration during labor; have the appropriate personnel and equipment available for the management of possible shoulder dystocia.
Confounding Factors
There is paucity of information on the risks and benefits of induction of labor for pregnancies compromised by diabetes. Any plan of management for the induction of labor of a pregnant diabetic woman will need to resolve the confounding issues of cervical ripeness, labor management, epidural anesthesia, fetal body composition, and weight distribution and estimates of fetal weight. A large matched cohort study79 compared the outcomes of labor between induced and spontaneous labor. Patients were matched for nulliparity, cephalic presentation, term gestation age, and actual birth weight between 3800 g and 4000 g. In the induced group, there was a higher incidence of cesarean delivery (for dystocia and nonreassuring fetal heart rate tracings) and increased instrumental deliveries. Bishop score was not part of the matching criteria. Because of the retrospective study design, it is possible that the spontaneous labor group had a higher Bishop score and therefore less cesarean and instrumental deliveries. In our study,80 comparing induction of labor with spontaneous labor, the influence of cervical status at the onset of induction was addressed. Women with a Bishop score81 <7 received vaginal prostaglandin as a cervical ripening agent. Regardless of the initial Bishop score, women undergoing labor induction and ripening of the cervix had a higher cesarean section rate than those with spontaneous delivery.
In another study,82 subjects and controls whose initial Bishop score was <4 received either cervical misoprostol or placebo twice during the week following enrollment. There were no statistically significant differences between the misoprostol or placebo groups with regard to the Bishop score. The rate of spontaneous labor and difference in cesarean rates were not statistically significant. The objective of Nicholson's study83 was to determine whether exposure of nulliparous women to a high rate of preventive labor induction was associated with improvement in birth health. A risk-scoring system was used to guide the frequent use of preventive labor induction in 100 nulliparous women. The birth outcomes of this group were compared with those of 352 nulliparous women who received usual care. Cesarean delivery was the primary study outcome. The Adverse Outcome Index and the rate of uncomplicated vaginal delivery were used to measure overall birth health. The exposed group experienced a higher labor induction rate (48% vs. 23.6%; P = .001), a lower cesarean rate (9% vs. 25.8%; adjusted OR, 0.36; P = .02), and better composite birth outcomes. They concluded that exposure of nulliparous women to a high preventive induction rate was significantly associated with improvement in birth health.
Although several studies have examined induction of labor for the indication of estimated macrosomia in nondiabetic women,84-87 there have been few studies conducted solely on pregnancy complicated by diabetes.88 The apprehension that higher morbidity rates are the result of delaying delivery until full-term prompted Kjos et al.88 to conduct a randomized controlled trial of 200 pregnancies complicated by GDM. Patients were assigned either to elective delivery at 38 weeks or to expectant management, which included twice weekly cardiotocography and amniotic fluid volume evaluation. In a Cochrane Review89 of this trial, they concluded that the risk of having a cesarean section was similar for both groups (RR 0.81, 95% CI: 0.52-1.26). The risk of macrosomia was reduced in the elective delivery group (RR 0.56, 95% CI: 0.32-0.98) and there were three cases of mild shoulder dystocia in the expectant management group. Because of the paucity of studies, they determined that either elective delivery at 38 weeks or expectant management is comparable.
In another study,90 insulin-requiring well-controlled type 2 and gestational diabetic women were randomized to either induction of labor or expectant management at 38 weeks. The mean gestational age difference between groups at delivery was 1 week and the mean difference in birth weight was 226 g. With the assumption that diabetic infants gain 40-60 g daily (50 g x 7 days = 350 g), no difference was found between the 2 groups. Thus, gestational age cannot provide the explanation to the three shoulder cases in the expectant management group. In addition, the small sample size exposes this study to both a and β errors.
CAN LABOR ABNORMALITIES PREDICT SHOULDER DYSTOCIA?
Several authors43-45,91-93 sought to evaluate delivery mode management decisions and the rate of shoulder dystocia recurrence for women with a prior delivery complicated by shoulder dystocia. One study91 included all vaginal deliveries complicated by shoulder dystocia from 1996 to 2001. In the initial five-year period, 205 shoulder dystocia cases (0.8%) and 36 (17.5%) neonatal injuries were identified. In the shoulder dystocia cases, 39 patients had 48 subsequent deliveries. In the trial of labor cases that resulted in vaginal deliveries, the rate of recurrence of shoulder dystocia was high—approximately 10 times higher than the rate for the general population. There is scant information reporting the association between labor abnormalities, induction of labor, and shoulder dystocia. Acker et al.53 compared the rate of shoulder dystocia in women who delivered infants weighing 3500-4000 g either in spontaneous labor or low forceps. The low forceps group had two- to threefold higher rates of shoulder dystocia in normal and abnormal labor including prolonged latent phase, protraction disorder and arrest disorder. Gross et al.31 evaluated the association between shoulder dystocia and dysfunctional labor in infants weighing >4000 g. The rate of shoulder dystocia was approximately twofold higher in the rate category >4500 g in comparison to infants weighing 4000-4499 g. However, even in the lower weight category, the rate of shoulder dystocia was 15%—38% depending on the labor abnormality. In another study, a significant association was found between active-phase abnormalities and shoulder dystocia but it included only 36 patients.94 In a retrospective analysis of 52 cases of shoulder dystocia, the authors reported no differences in labor abnormalities.95 A large study comparing 276 consecutive cases of shoulder dystocia with 600 matched controls did not identify labor patterns as predictive among any cohort even those with diabetes or macrosomia. The study found significantly higher rates of shoulder dystocia in induction of labor. This may in part be due to fetal size that itself is associated with shoulder dystocia.96 Although there is scant data addressing labor abnormalities and shoulder dystocia, it is recommended that the care provider be diligent to the occurrence of labor abnormalities and patients during induction of labor especially diabetic and/or obese women. However, the labor curve is not an absolute predictor of shoulder dystocia. Therefore, labor augmentation with careful monitoring the Pitocin administration should be the approach of choice in the presence of fetal macrosomia rather than routine cesarean delivery.
SHOULDER DYSTOCIA IN LABOR: BETWEEN A ROCK AND A HARD PLACE?!?
Shoulder dystocia is unpredictable by statistical analysis. However, several conditions, such as maternal obesity, previous and current macrosomia, previous shoulder dystocia, labor abnormality, induction of labor, and instrumental delivery are likely suspects for an impending shoulder dystocia that should set off “anticipatory alarms” for the obstetrician. “Forewarned is fore- armed”—those who know something is coming are better prepared to face it than those who do not know. In our study68 when practitioners were “asleep on the watch,” in cases not identified as macrosomic by ultrasound exam, the rate of shoulder dystocia was 19%. Although shoulder dystocia is rare, and not all cases of brachial plexus can and/or should be attributed to obstetrician mismanagement, a plaintiff's lawyer will fault for failure to estimate fetal weight, perform timely cesarean delivery, use appropriate maneuvers correctly, use of inappropriate or excessive lateral traction of fetal head, or have a pediatrician present.28,29,98 When shoulder dystocia occurs, the goal is to free the impacted shoulder as quickly as possible as the fetus can tolerate only 8-10 minutes before development of permanent neurological damage. Gherman et al.99 demonstrated that the head to shoulder interval to delivery at >7 minutes has sensitivity of 67% and specificity of 74% for predicting brain injury in a case controlled study.
Multiple maneuvers have been suggested for the release of shoulder dystocia. The obstetrician needs to master the most common maneuvers so that under duress, the maneuver becomes automatic, efficient, and hopefully effective. The maneuvers most commonly applied are the McRoberts’, suprapubic pressure, the Wood's corkscrew and extraction of the posterior arm. In our study, we found that 45% of the shoulder cases can be released with one maneuver, 39% with two, and 11% with three. The need for four maneuvers was 4% and five maneuvers for 1% of cases.97 Furthermore, the incidence of Erb's palsy and fractures range from 6% to 10% when one or two maneuvers were used and increased to over 20% when three or more maneuvers were applied. Because of its simplicity, it is reasonable to recommend performing the McRoberts’ maneuver as the initial maneuver, which requires hyperflexion and abduction of the hips causing rotation of the symphysis pubis and flattening of the lumbar lordosis that frees the impacted shoulder.100,101 Suprapubic pressure may be applied at the same time to support dislodging the impacted shoulder.102 The pressure should be directed backward and downward; anterior pressure will impact the shoulder even further. Performing an episiotomy has been debated. It is the author's opinion that a wide episiotomy should be performed in these cases if additional maneuvers are needed to create more space for the manipulations. Performing an episiotomy alone, however, will not release the impacted shoulder. Finally, when the conventional maneuvers fail to release the shoulder, the Zavanelli maneuver (cephalic replacement) is a potential option.103,104 Manipulations that include fundal pressure, frantic tugging and pulling of the head, exerting excessive strength instead of applying guarded and directed strength, and rotation of the head rather than rotation of the shoulders must never be included in the maneuver options. The approach to management of shoulder dystocia was aptly described by Hopwood's poem.105
If shoulder dystocia brings you grief,
Oblique diameter spells relief.
Extending episiotomy will be your boon
To gain posterior vaginal room.
If corkscrewing still leaves you colder,
Then gently deliver the posterior shoulder.
SUMMARY
With the currently available data, it is difficult to provide the clinician, with any degree of certainty, what the threshold should be for performing an elective cesarean delivery in women with diabetes. Shoulder dystocia in a previous delivery will influence the decision on mode of delivery unless the EFW is significantly less than that of the previous birth weight. Unless obstetric complications dictate otherwise, the uncomplicated (normal estimated birth weight, amniotic fluid volume, and metabolic control) diabetic pregnancy, both pregestational and gestational, can be allowed to go into spontaneous delivery at full term. Induction of labor and planned VBAC carry no greater risks than for a nondiabetic pregnancy. This will result with a relatively large number of patients who can undergo spontaneous vaginal delivery rather than being electively induced with the accompanying risk for this procedure. Elective cesarean section for the pregnant diabetic patient should be actively considered if the EFW is >4000-4250 g (Figure 37-4).

REFERENCES
1. Getahun D, Lawrence J, Fassett M, et al. The association between stillbirth in the first pregnancy and subsequent adverse perinatal outcomes. Am J Obstet Gencol. 2009:378.e1-378.e6.
2. Vergani P, Cozzolino S, Pozzi E, et al. Identifying the causes of stillbirth: a comparison of four classification systems. Am J Obstet Gynecol. 2008;199:319.
3. Stillbirth Collaborative Research Network Writing Group. Causes of death among stillbirths. JAMA. 2011;306:2459-2468.
4. Rackham O, Paize F, Weindling A. Cause of death in infants of women with pregestational diabetes mellitus and the relationship with glycemic control. Postgrad Med. 2009;121(4):26-32.
5. Brownlee M. Biochemistry and molecular cell biology of diabetic complications. Nature. 2001;414:813-820.
6. Akazawa S. Diabetic embryopathy: studies using a rat embryo culture system and an animal model. Congenit Anom (Kyoto). 2005;45(3):73-79.
7. Capobianco E, Jawerbaum A, White V, et al. Elevated levels of endothelin-1 and prostaglandin E2 and their effect on nitric oxide generation in placental tissue from neonatal streptozotocin-induced diabetic rats. Prostaglandins Leukot Es sent Fatty Acids. 2003;68(3):225-231.
8. Nassar N, Sullivan EA. Australia's Mothers and Babies 1999. AIHW Cat No. PER 19, Perinatal Statistics Series No. 11. Sydney, Australia: AIHW National Perinatal Statistics Unit; 2001.
9. Mondestin M, Ananth C, Smulian J, et al. Birth weight and fetal death in the United States: the effect of maternal diabetes during pregnancy. Am J Obstet Gynecol. 2002;187:922-926.
10. Colstrup M, Mathiesen E, Damm P, et al. Pregnancy in women with type 1 diabetes: Have the goals of St. Vincent declaration been met concerning fetal and neonatal complications? J Matern Fetal Neonatal Med. 2013;26:1682-1686.
11. Cundy T, Gamble G, Townend K, et al. Perinatal mortality in type 2 diabetes mellitus. Diabet Med. 2000;17:33-39.
12. Schmidt M, Duncan B, Reichet A et al. Gestational diabetes mellitus diagnoses with a 2-h 75-g oral glucose tolerance test and adverse pregnancy outcomes. Diabetes Care. 2001;24: 1151-1155.
13. Pettitt D, Knowler W, Baird H, et al. Gestational diabetes: infant and maternal complications of pregnancy in relation to third-trimester glucose tolerance in the Pima Indians. Diabetes Care. 1980;3:458-464.
14. Gerstein H, Haynes R. Evidence-based Diabetes Care. London, UK: BC Decker, Inc; 2001. pp.1^8.
15. Yogev Y, Most O, Langer O. Pre-existing diabetes: the impact of glycemic control on perinatal mortality. J Soc Gynecol Invest. 2005 (Abst).
16. Yogev Y, Most O, Langer O. Gestational diabetes mellitus: is there a risk for perinatal mortality? Am J Obstet Gynecol. 2004;191(suppl 51):6.
17. Peel J. A historical review of diabetes and pregnancy. J Obstet Gynaecol Br Commonw. 1972;79:385-395.
18. White P, Koshy P, Duckers J. The management of pregnancy complicated by diabetes and of children of diabetic mothers. Med Clin N Am. 1953;37:1481-1496.
19. Roversi GD, Gargulio M, Nicolini U, et al. A new approach to the treatment of diabetic pregnant women. Am J Obstet Gynecol. 1979;135:567-576.
20. Drury M, Stronge J, Foley M, et al. Pregnancy in the diabetic patient: timing and mode of delivery. Obstet Gynecol. 1983;62: 279-282.
21. Rosenstein M, Cheng Y, Snowden J, et al. The risk of stillbirth and infant death stratified by gestational age in women with gestational diabetes. Am J Obstet Gynecol. 2012;206:309-310.
22. Bates E, Rouse D, Mann M, et al. Neonatal outcomes after demonstrated fetal lung maturity before 39 weeks of gestation. Obstet Gynecol. 2010;116:1288-1295.
23. Langer O, Sonnendecker E, Jacobson M. Categorization of terminal fetal heart-rate patterns in antepartum cardiotocography. Br J Obstet Gynaecol. 1982;89:179-185.
24. Langer O, Vega-Rich M, Cohen W. Terminal pattern: characteristics and management. Am J Perinatol. 1985;2(4):300-304.
25. Walker D, Marlow N, Upstone L, et al. The growth restriction intervention trial: long-term outcomes in a randomized trial of timing of delivery in fetal growth restriction. Am J Obstet Gynecol. 2011;204:34.e1-34.e9.
26. Esakoff T, Cheng Y, Sparks T, Caughey A. The association between birthweight 4000 g or greater and perinatal outcomes in patients with and without gestational diabetes mellitus. Obstet Gynecol. 2009;200:672.e1-672.e4.
27. Langer O, Berkus M, Huff R, et al. Shoulder dystocia: should the fetus weighing >4,000g be delivered by cesarean section? Am J Obstet Gynecol. 1991;165:831-837.
28. Zylstra S, Greenwald L, Halloran E, et al. Cutting the medicolegal risk of shoulder dystocia. OBG Manag. 2004;16(9):78-98.
29. Gherman R, Ouzounian J, Goodwin T. Brachial plexus palsy: an in utero injury? Am J Obstet Gynecol. 1999;180:1303-1307.
30. Acker D, Sachs B, Friedman E. Risk factors for shoulder dystocia. Obstet Gynecol. 1985;66:762-768.
31. Gross S, Shime J, Farine D. Shoulder dystocia: predictors and outcome. A five-year review. Am J Obstet Gynecol. 1987;156: 334-336.
32. Gherman R, Ouzounian J, Miller D, et al. Spontaneous vaginal delivery: a risk factor for Erb's palsy? Am J Obstet Gynecol. 1998;178:423-427.
33. Gherman R, Goodwin T, Ouzounian J, et al. Brachial plexus palsy associated with cesarean section: an in utero injury? Am J Obstet Gynecol. 1997;177:1162-1164.
34. Jennett R, Tarby T, Kreinick C. Brachial plexus palsy: an old problem revisited. Am J Obstet Gynecol. 1992;166:1673-1677.
35. Rouse D, Owen J, Goldenberg R, et al. The effectiveness and costs of elective cesarean delivery for fetal macrosomia diagnosed by ultrasound. JAMA. 1996;276:1480-1486.
36. Gilbert W, Nesbitt T, Danielsen B. Associated factors in 1611 cases of brachial plexus injury. Obstet Gynecol. 1999;93:536-540.
37. Graham E, Forouzan I, Morgan M. A retrospective analysis of Erb's palsy cases and their relation to birth weight and trauma at delivery. J Matern Fetal Med. 1997;6:105.
38. Hankins G, Clark S. Brachial plexus palsy involving the posterior shoulder at spontaneous vaginal delivery. Am J Perinatol. 1995;12:44^5.
39. Dodds S, Wolfe S. Perinatal brachial plexus palsy. Curr Opin Pediatr. 2000;23:40-47.
40. Hope P, Breslin S, Lamont L, et al. Fatal shoulder dystocia: a review of 56 cases reported to the Confidential Enquiry into Stillbirths and Deaths in Infancy. Br J Obstet Gynaecol. 1998;105:1256-1261.
41. Wagner R, Nielsen P, Gonik B. Controversies in labor management: shoulder dystocia. Obstet Gynecol Clin. 1999;26(2):371-382.
42. Ecker J, Greenberg J, Norwitz E, et al. Birth weight as a predictor of brachial plexus injury. Obstet Gynecol. 1997;89:643-647.
43. Smith R, Lane C, Pearson J. Shoulder dystocia: what happens at the next delivery? Br J Obstet Gynaecol. 1994;101:713-715.
44. Ginsberg N, Moisidis C. How to predict recurrent shoulder dystocia. Am J Obstet Gynecol. 2001;184:1427-1429; Discussion 1429-1430.
45. Lewis D, Raymod R, Perkins M, et al. Recurrence rate of shoulder dystocia. Am J Obstet Gynecol. 1995;172:1369-1371.
46. Baskett T, Allen AC. Perinatal implications of shoulder dystocia. Obstet Gynecol. 1995;86:14-17.
47. Nocon J, McKenzie D, Thomas L, et al. Shoulder dystocia. Obstet Gynecol. 1985;66:762-768.
48. Nesbitt T, Gilbert W, Herrchen B. Shoulder dystocia and associated risk factors with macrosomic infants born in California. Am J Obstet Gynecol. 1998;179:476-480.
49. Sandmire H, O'Halloin T. Shoulder dystocia: its incidence and associated risk factors. Int J Gynaecol Obstet. 1988;26:65-73.
50. Bahar A. Risk factors and fetal outcome in cases of shoulder dystocia compared with normal deliveries of a similar birth weight. Br J Obstet Gynaecol. 1996;103:868-872.
51. Gonen R, Spiegel D, Abend M. Is macrosomia predictable, and are shoulder dystocia and birth trauma preventable? Obstet Gynecol. 1996;88:526-529.
52. Benedetti T, Gabbe S. Shoulder dystocia. A complication of fetal macrosomia and prolonged second stage of labor with mid pelvic delivery. Obstet Gynecol. 1978;52:526-529.
53. Acker D, Sachs B, Friedman E. Risk factors for shoulder dystocia in the average-weight infants. Obstet Gynecol. 1986;67:614-618.
54. Keller J, Lopez-Zeno J, Dooley S, et al. Shoulder dystocia and birth trauma in gestational diabetes: a five-year experience. Am J Obstet Gynecol. 1991;165:928-930.
55. ACOG Practice Bulletin. Clinical management guidelines for obstetrician-gynecologists. Number 40, November 2002. Obstet Gynecol. 2002;40(100):1045-1050.
56. Susa J, McCormick K, Widness J, et al. Chronic hyperinsulinemia in the fetal rhesus monkey: effects on fetal growth and composition. Diabetes. 1979;28:1058-1063.
57. McFarland M, Trylovich C, Langer O. Anthropometric differences in macrosomic infants of diabetic and non-diabetic mothers. J Matern-Fetal Med. 1998;7:292-295.
58. Modanlou H, Komastu G, Dorchester W, et al. Large-gestational- age neonates: anthropometric reasons for shoulder dystocia. Obstet Gynecol. 1982;60:417-423.
59. Kehl R, Krew M, Thomas A, et al. Fetal growth and body composition in infants of women with diabetes mellitus during pregnancy. Matern Fetal Med. 1996;5:273-280.
60. Vohr B, McGarvey S. Growth patterns of large-for-gestational age and appropriate-for-gestational-age infants of gestational diabetic mothers and control mothers at age 1 year. Diabetes Care. 1997;20:1066-1072.
61. Keller J, Metzger B, Dooley S, et al. Infants of diabetic mothers with accelerated fetal growth by ultrasonography: are they all alike? Am J Obstet Gynecol. 1990;163:893-897.
62. Bar J, Dvir A, Hod M, et al. Brachial plexus injury and obstetrical risk factors. Int J Gynecol Obstet. 2001;73:21-25.
63. Gregory K, Henry O, Ramicone E, et al. Maternal and infant complications in high and normal weight infants by method of delivery. Obstet Gynecol. 1998;92:507-513.
64. Mocanu E, Greene R, Byrne B, et al. Obstetrics and neonatal outcome of babies weighing more than 4.5 kg: an analysis by parity. Eur J Obstet Gynecol Reprod Biol. 2000;92:229-233.
65. Rouse D, Owen J. Prophylactic cesarean delivery for fetal mac- rosomia diagnosed by means of ultrasound. J Am Med Assoc. 1996;276:229-233.
66. Rouse D, Owen J. Prophylactic cesarean delivery for fetal macroso- mia diagnosed by means of ultrasonography—a Faustian bargain? Am J Obstet Gynecol. 1999;181:332-338.
67. Mullin P, Gherman R, Melkumian A, et al. The relationship of shoulder dystocia to estimated fetal weight. Paper presented at: 68th Annual Meeting of the Pacific Coast Obstetrical and Gynecological Society; 2001; Ashland, OR.
68. Conway D, Langer O. Elective delivery of infants with macroso- mia in diabetic women: reduced shoulder dystocia versus increased cesarean deliveries. Am J Obstet Gynecol. 1998;178:922-925.
69. Souka A, Papastefanou I, Michalitsi V. Specific formulas improve the estimation of fetal weight by ultrasound scan. J Matern Fetal Neonatal Med. 2014;27(7):737-742.
70. Deter R, Lee W, Sangi-Haghpeykar H. Individualized fetal growth assessment: critical evaluation of key concepts in the specification of third trimester size trajectories. J Matern Fetal Neonatal Med. 2014;27(6):543-551.
71. Wong S, Chan F, Cincotta R, et al. Sonographic estimation of fetal weight in macrosomic fetuses: diabetic versus non-diabetic pregnancies. Aust NZ J Obstet Gynaecol. 2001;41:429-432.
72. American College of Obstetrician and Gynecologists: Task Force on Cesarean Delivery Rates. Evaluation Cesarean Delivery. Washington, DC: American College of Obstetrician and Gynecologists; 2000.
73. Remsberg K, McKeown R, McFarland K, et al. Diabetes in pregnancy and cesarean delivery. Diabetes Care. 1999;22:1561-1567.
74. McAuliffe F, Foley M, Firth R, et al. Outcome of diabetic pregnancy with spontaneous labour after 38 weeks. Irish J Med Sci. 1999;168:160-163.
75. O'Reilly-Green C, Divon M. Receiver operating characteristics curves of sonographic estimated fetal weight for prediction of mac- rosomia in prolonged pregnancies. Ultrasound Obstet Gynecol. 1997;9:403.
76. Blackwell S, Hassan S, Wolfe H, et al. Why are cesarean delivery rates so high in diabetic pregnancies? J Perinat Med. 2000;28:316-320.
77. Coleman T, Randall H, Graves W, et al. Vaginal birth after cesarean among women with gestational diabetes. Am J Obstet Gynecol. 2001;184:1104-1107.
78. Blackwell S, Hassan S, Wolfe H, et al. Vaginal birth after cesarean in the diabetic gravida. J Reprod Med. 2000;45:987-990.
79. Cammu H, Martens G, Ruyssinck G, et al. Outcome after elective labor induction in nulliparous women: a matched cohort study. Am J Obstet Gynecol. 2002;186:240-244.
80. Xenakis E, Piper J, Conway D, et al. Induction of labor in the nineties: conquering the unfavorable cervix. Obstet Gynecol. 1997;90:235-239.
81. Bishop E. Pelvic scoring for elective induction. Obstet Gynecol. 1964;24:266-268.
82. Incerpi M, Fassett M, Kjos S, et al. Vaginally administered misoprostol for outpatient cervical ripening in pregnancies complicated by diabetes mellitus. Am J Obstet Gynecol. 2001;185:916-919.
83. Nicholson J, Stenson M, Kellar L. Active management of risk in nulliparous pregnancy at term: association between a higher preventive labor induction rate and improved birth outcomes. Am J Obstet Gynecol. 2009;200:254.e1-254.e13.
84. Gonen O, Rosen D, Dolfin Z, et al. Induction of labor versus expectant management in macrosomia: a randomized study. Obstet Gynecol. 1997;89:913-917.
85. Tey A, Eriks en N, Blanco J. A perspective randomized trial of induction versus expectant management in non-diabetic
pregnancies with fetal macrosomia. Am J Obstet Gynecol. 1995; 172:293.
86. Leaphart W, Meyer M, Capeless E. Labor induction with a prenatal diagnosis of fetal macrosomia. J Matern Fetal Med. 1997;6:99-102.
87. Friesen C, Miller A, Rayburn W. Influence of spontaneous or induced labor on delivering the macrosomic fetus. Am J Perinatol. 1995;12:63-66.
88. Kjos S, Henry O, Montoro M, et al. Insulin-requiring diabetes in pregnancy: a randomized trial of active induction of labor and expectant management. Am J Obstet Gynecol. 1993;169:611-615.
89. Boulvain M, Stan C, Irion O. Elective delivery in diabetic pregnant women. Cochrane Database Syst Rev. 2001;(2):CD001997.
90. Gemer O, Bergman M, Segal S. Labor abnormalities as a risk factor for shoulder dystocia. Acta Obstet Gynecol Scand. 1999;78:735-736.
91. Mehta S, Blackwell S, Chadha R, et al. Shoulder dystocia and the next delivery: outcomes and management. J Matern Fetal Neonatal Med. 2007;20(10):729-733.
92. Torki M, Barton L, Miller D, et al. Severe brachial plexus palsy in women without shoulder dystocia. Obstet Gynecol. 2012;120(3):539-541.
93. Allen R, Gurewitsch E. Temporary Erb-Duchenne palsy without shoulder dystocia or traction to the fetal head. Obstet Gynecol. 2005;106:1109.
94. Doumouchtsis S, Arulkumaran S. Are all brachial plexus injuries caused by shoulder dystocia? Obstet Gynecol Surv. 2009;64:615-623.
95. Combs C, Singh N, Khoury J. Elective induction versus spontaneous labor after sonographic diagnosis of fetal macrosomia. Obstet Gynecol. 1993;81:492-496.
96. Lurie S, Levy R, Ben-Arie A, et al. Shoulder dystocia: could it be deduced from the labor partogram? Am J Perinatol. 1995;12: 61-62.
97. McFarland M, Langer O, Piper J, et al. Perinatal outcome and the type and number of maneuvers in shoulder dystocia. International J. Gynecology and Obstetrics. 1996;55:219-224.
98. Calhoun B, Hume R, Walters J. Shoulder dystocia as a risk for obstetric liability. Legal Med. 2000;12-15.
99. Gherman R, Ouzounian J, Goodwin T. Obstetric maneuvers for shoulder dystocia and associated fetal morbidities. Am J Obstet Gynecol. 178(6):1126-1130.
100. Gonik B, Stringer C, Held B. An alternate maneuver for management of shoulder dystocia. Am J Obstet Gynecol. 1983;145:882-884.
101. Gherman R, Tramont J, Muffley P, et al. Analysis of McRoberts’ maneuver by X-ray analysis. Obstet Gynecol. 2000;95:43-47.
102. Resnik R. Management of shoulder girdle dystocia. Clin Obstet Gynecol. 1980;23:559-564.
103. O'Leary J, Leonetti H. Shoulder dystocia: prevention and treatment. Am J Obstet Gynecol. 1990;162:5-9.
104. Sandberg E. The Zavanelli maneuver: 12 years of recorded experience. Obstet Gynecol. 1999;93:312-317.
105. Hopwood H. Shoulder dystocia: fifteen years of experience in a community hospital. Am J Obstet Gynecol. 1982;144:162-164.