
Barbara J. Morgan & Jerome A. Dempsey
CARDIOVASCULAR SYSTEM PHYSIOLOGY
The major function of the cardiovascular system is to deliver, via the blood, oxygen and nutrients to all tissues of the body and to remove from them carbon dioxide and other waste products of cellular metabolism. In this regard, the cardiovascular system is the link between external respiration (gas exchange between the atmosphere and lungs) and cellular respiration (use of oxygen for energy production by the mitochondria). Other vital functions include, transport of heat to maintain body temperature, delivery of white blood cells to sites where they defend against foreign material, and transport of hormones from the site of release to their target organs. Thus, the cardiovascular system is a key contributor to constancy of the body’s internal milieu or homeostasis.
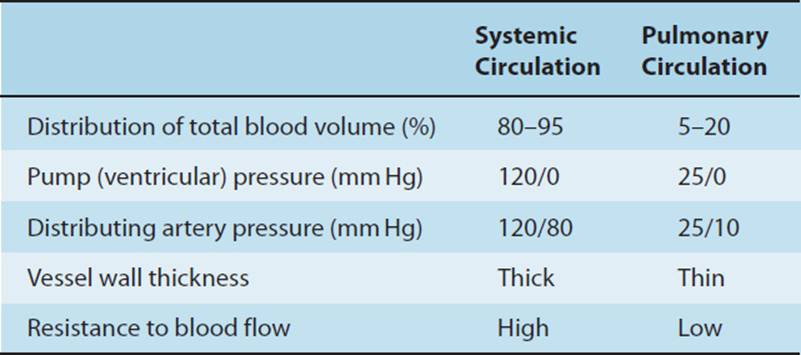
These tasks are accomplished by two interconnected yet distinct components of the cardiovascular system: the pulmonary circulation and the systemic circulation (Fig. 5-1). Each component is made up of (1) a pump (right ventricle for the pulmonary circulation, left ventricle for the systemic circulation) that provides energy to propel the blood, (2) a system of arteries and arterioles that distributes blood throughout the region each pump supplies, (3) a network of capillaries through which gases and nutrients are exchanged with the tissues supplied, and (4) a system of venules and veins that returns the distributed blood to the pump. The two components differ in the amount of the total blood volume each contains at any one point in time, the pressure of operation, thickness of vessel walls, and resistance to blood flow (Table 5-1).
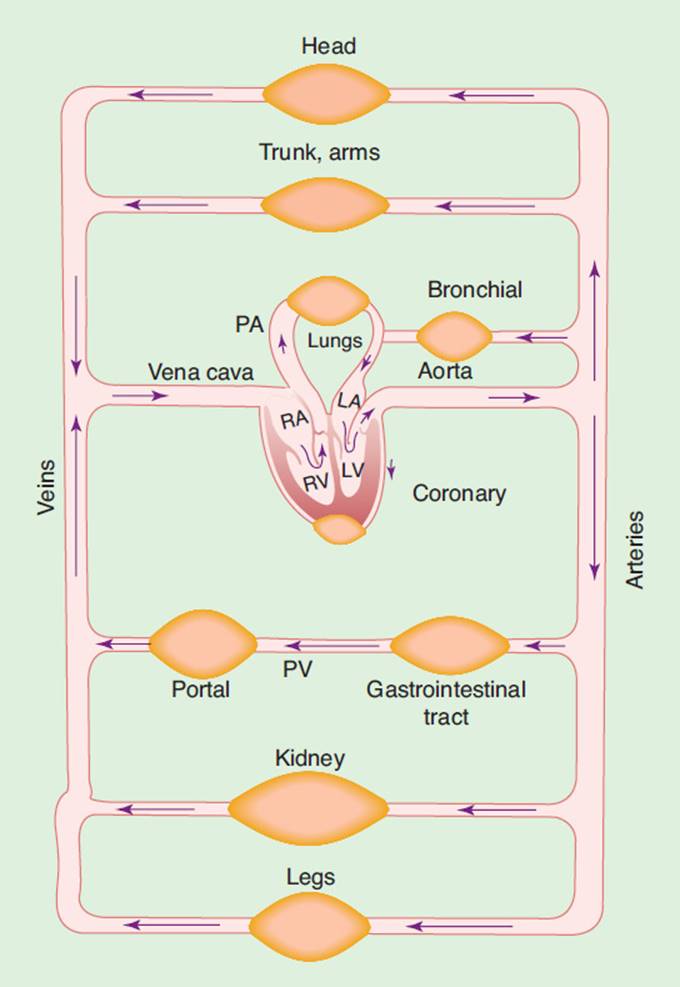
FIGURE 5-1 Schematic representation of the functional divisions of the circulatory system. Note that the pulmonary and systemic circulations are connected in series so that the blood flows through the chambers of the right heart and the lungs, then to the chambers of the left heart, and the rest of the body. RA, right atrium; RV, right ventricle; LA, left atrium; LV, left ventricle; PA, pulmonary artery; PV, portal vein. (Modified with permission from West JB, ed. Best and Taylor’s Physiological Basis of Medical Practice. 12th ed. Baltimore, MD: Lippincott Williams & Wilkins; 1991.)
TABLE 5-1 Comparison of the Systemic and Pulmonary Circulations
Blood and Its Constituents
Blood is composed of solid components—the red and white blood cells and platelets, which are suspended in a liquid component, the plasma.1 Plasma is an aqueous solution of gases, salts, carbohydrates, proteins, and lipids. In normal circumstances, the proportion of cells to plasma (the hematocrit) is approximately 45%. Normal values for the major blood constituents are shown in Table 5-2. Normal values for blood gases are shown in Table 5-3.
TABLE 5-2 Normal Values for the Major Constituents of Blood

TABLE 5-3 Blood Gas and Acid–Base Values for Healthy Subjects Under Resting Conditions

Red Blood Cells
The red blood cells (erythrocytes) are flexible, biconcave disks that contain hemoglobin, a protein that confers on the blood most of its oxygen-carrying capacity. Each molecule of hemoglobin can bind four molecules of oxygen. The amount of oxygen bound to hemoglobin at any point in time depends on the local partial pressure of oxygen (PO2) (Fig. 5-2).2 In blood perfusing the lung the high partial pressure of oxygen (100 mm Hg) allows the hemoglobin to become almost completely saturated with oxygen. In blood perfusing peripheral tissue, where the PO2 is lower (40 mm Hg), oxygen is much less tightly bound to hemoglobin, favoring the release of oxygen to the tissues. The dissociation of oxygen from hemoglobin is facilitated by conditions of increased temperature, increased partial pressure of carbon dioxide (PCO2), and decreased pH that exist in metabolically active tissue.
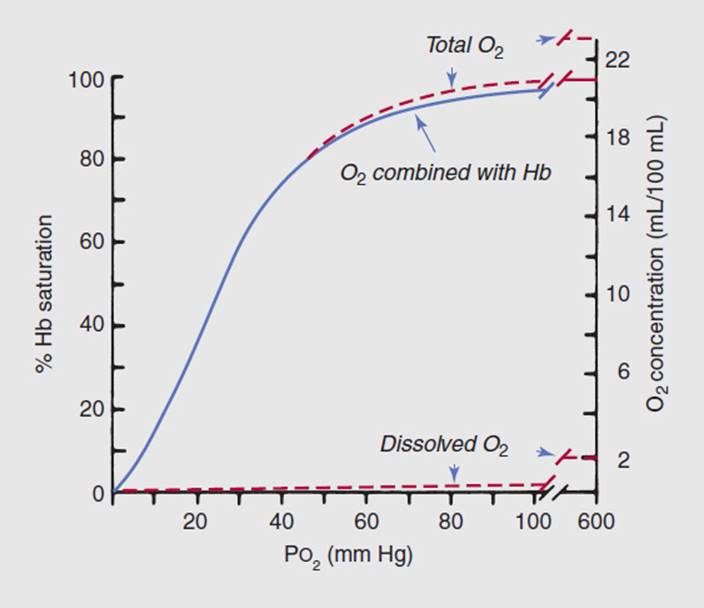
FIGURE 5-2 Relationship of PO2 to O2 content in plasma (dissolved O2), in hemoglobin (HbO2) and in whole blood (total O2 HbO2 dissolved O2). The actual numbers for HbO2 content will depend on the hemoglobin concentration. The example above is for a normal concentration of 15 g/100 mL. This PO2/% HbO2 relationship holds for conditions of normal blood pH (7.40) and temperature (37°C). (Used with permission from West JB. Respiratory Physiology—The Essentials. 5th ed. Baltimore, MD: Lippincott Williams & Wilkins; 1995.)
White Blood Cells
The main function of the white blood cells (leukocytes) is to protect against invasion by foreign organisms and substances. The five types of leukocytes are neutrophils, eosinophils, basophils, monocytes, and lymphocytes, all of which originate from hemopoietic tissue of the bone marrow and spleen. Many of the white blood cells responsible for the body’s defense mechanisms are phagocytic; that is, they contain enzymes that are capable of digesting foreign material. T lymphocytes and B lymphocytes orchestrate the cell-mediated and humoral immune responses, respectively.
Platelets
The platelets play a major role in the body’s response to hemorrhage. Platelets aggregate at the site of blood vessel injury, thereby creating a plug that can completely occlude the damaged vessel. Platelets make additional contributions to hemostasis by releasing serotonin (a vasoconstrictor chemical) and thromboplastin (a blood-clotting protein).
Plasma Proteins
The plasma proteins are responsible for a variety of important functions.1 The clotting proteins are essential for hemostasis; others participate in the immune response; and still others transport lipid molecules, vitamins, hormones, and trace metals. Albumin, the most plentiful of the plasma proteins, is the primary protein responsible for the plasma’s colloid osmotic pressure (also called oncotic pressure). The colloid osmotic pressure is a major determinant of the movement of fluid across the capillary wall. Albumin and most of the other plasma proteins are manufactured in the liver.
Heart As a Pump
The right and left ventricles function as two pumps connected in series: The right ventricle pumps blood into the lungs for the exchange of CO2 and O2, and the left ventricle pumps blood to all other tissues of the body (Fig. 5-1). Because of this serial arrangement, the amounts of blood pumped per unit time by the right and left ventricles are (must be) equal. An equal amount of flow can be generated at a much lower pressure in the pulmonary circulation because vascular resistance is lower than in the systemic circulation. This lower resistance is due to the shorter, wider, and more highly distensible vessels in the pulmonary circulation.
Determinants of Pump Function
How well (or poorly) the heart performs its crucial pumping role has a major impact on the health of the individual. Rhythmic, coordinated pumping of the cardiac chambers depends on the unique physical and electrical properties of the “working” myocytes that generate the energy to propel blood and the “conduction” myocytes that are responsible for the spread of electrical impulses through the heart.
In myocardial cells, as in all excitable tissues, an action potential is generated when the electrical voltage difference across the cell membrane is reduced to a threshold level.3 The working myocytes, which have more negative resting membrane potentials, are referred to as fast-response cells because their action potentials are characterized by a rapid upstroke. The conduction cells located in the sinoatrial (SA) and atrio-ventricular (AV) nodes have less negative resting membrane potentials and are referred to as slow-response cells because their action potentials have gradual upstrokes (Chapter 4, Fig. 4-10). The cells of the heart’s conduction system are capable of spontaneous depolarization because their resting membrane potentials are close to threshold and because their membrane potentials are inherently unstable. These electrical characteristics of conduction system cells are the basis of automaticity and rhythmicity (the ability of the heart to initiate its own beat at a regular rate)—two inherent traits of the heart. Cardiac contraction is initiated when action potentials that arise in conduction cells spread across the working cells of the myocardium.
The myocardium, because of its multicellular structure, behaves like a syncytium. Gap junctions between adjacent cells allow cell-to-cell propagation of electrical impulses. An action potential arriving at the myocardial cell membrane depolarizes the membrane and triggers the chain of events that culminates in myocardial contraction. Calcium ion flux is the physiological basis for this excitation–contraction coupling. Depolarization of the cell membrane increases its permeability to calcium ions. In addition, the action potential is transmitted to the interior of the cell along T-tubule membranes where it mobilizes stored calcium ions from the sarcoplasmic reticulum. The resultant increase in intracellular calcium concentration initiates actin–myosin binding, cross-bridge formation, and sarcomere shortening. The magnitude of the increase in intracellular calcium concentration determines the number of cross-bridges formed and therefore the strength of the resulting contraction. During repolarization of the cell membrane, calcium is extruded from the cell and resequestered in the sarcoplasmic reticulum and, as a result, actin and myosin filaments disengage and sarcomeres lengthen.
Coordinated pumping of the upper and lower chambers—The heart functions most efficiently as a pump when atrial and ventricular contractions have the appropriate temporal relationship. That is, the ventricles discharge optimum stroke volumes only if the time delay between atrial and ventricular contraction is sufficient to allow filling of the ventricles prior to systole.
Coordinated contraction and relaxation of myocardial cells in the upper and lower chambers is ensured by the heart’s conduction system, the principal components of which are the SA node, the AV node, the bundle of His and bundle branches, and the Purkinje fibers (Chapter 4, Fig. 4-10). Action potentials arising in the SA node are propagated through the atrial myocardium to the AV node—the sole route of impulse conduction from the atria to the ventricles. The relatively slow conduction velocity that is characteristic of AV nodal tissue accounts for a brief pause between atrial and ventricular contraction. From the AV node, impulses travel through the bundle of His to the bundle branches that innervate the left and right ventricles. The terminal elements in the conduction system are the Purkinje fibers. Their relatively fast conduction velocities ensure rapid spread of the wave of depolarization throughout the ventricular mass.
As mentioned earlier, the term automaticity refers to the inherent ability of myocardial cells to generate action potentials without depolarizing input from an external source.3 All portions of the heart’s conduction system contain automatic cells. Even though any one of them is capable of initiating a cardiac cycle, the SA node normally assumes the role of pacemaker because it has an inherent discharge rate that is faster than that of other conduction system cells. The other potential pacemakers become hyperpolarized when they are paced at rates faster than their own inherent rates—a phenomenon known as overdrive suppression. Under pathological conditions, conduction system cells outside of the SA node can assume the pacing role when SA node function is depressed, when pathways from the SA node are blocked, or when these cells become “irritable” (ie, their own rhythmicity is enhanced). In these circumstances, the cells responsible for initiating the heartbeat are referred to as ectopic pacemakers. Cardiac rhythm disturbances arise when the heart’s conduction system is damaged by disease or when ectopic pacemakers usurp the pacing function.
When the coordinated pumping of the heart’s chambers is compromised by rhythm disturbances, deterioration in pump function almost always ensues. When the atria and ventricles do not contract in sequential fashion, for example, in atrial fibrillation or complete heart block (Chapter 10), loss of atrial contribution to ventricular filling leads to a decrement in ventricular pump performance. Frequent premature contractions can result in life-threatening hypotension due to inadequate ventricular filling time.
Adequacy of coronary blood supply—The heart is dependent on the coronary arteries for its own blood supply (Chapter 4, Fig. 4-11). When the coronary blood supply is inadequate to meet the myocardium’s metabolic demands, for example, when the arterial lumen is narrowed by atherosclerotic plaque (Chapter 6), pump function can be compromised in several ways. The resultant ischemia has a negative effect on the contractile state of the myocardium and predisposes the heart to serious rhythm disturbances. Complete, prolonged blockage of a coronary artery (eg, in myocardial infarction) results in myocardial cell death. The necrotic cells in the affected area are eventually replaced with a firm scar; however, the noncontractile scar tissue does not contribute to the heart’s pumping function. Such loss of myocardium negatively affects the contractile state of the myocardium.
Unidirectional flow of blood through the heart—Unidirectional flow of blood through the heart is ensured by two sets of valves that operate reciprocally (Chapter 4, Fig. 4-9). The atrioventricular valves (mitral and tricuspid) control blood flow from the atria to the ventricles. The semilunar valves (aortic and pulmonic) control flow out of the ventricles. These valves, which consist of thin fibrous tissue flaps, or leaflets, open and close passively in response to changes in the chamber pressure. That is, when myocardial contraction raises the pressure within a given chamber above the downstream pressure, the valve opens. When contraction ceases and pressure within the chamber drops below the downstream pressure, the valve closes. The leaflets of the atrioventricular valves are attached to papillary muscles in the ventricular walls by strong bands of fibrous tissue called chordae tendineae. The chordae are “tethers” that prevent bulging of the leaflets and the regurgitation of blood back into the atria during ventricular contraction.
Malfunctioning valves can compromise pump performance by interfering with the forward flow of blood. A valve that fails to close completely is said to be incompetent or insufficient. An incompetent valve is leaky; that is, it allows regurgitation of a portion of the stroke volume into the upstream chamber. When a stenotic valve fails to open fully, it forces the upstream chamber to contract more vigorously in order to discharge the stroke volume. When valvular dysfunction is present for months or years, the myocardium undergoes hypertrophy to compensate for the pressure or volume overload caused by the faulty valve, and cardiac output is maintained at relatively normal levels. In contrast, when valvular dysfunction occurs acutely, such as when a papillary muscle ruptures as a result of myocardial infarction, a life-threatening reduction in pump performance may occur.
Events of the Cardiac Cycle
The period of time between successive heartbeats is the cardiac cycle. Figure 5-3 shows the temporal relationships between the electrical and mechanical events of the cardiac cycle, the heart sounds, and changes in ventricular volume.4 Note that Fig. 5-3 shows only left atrial, left ventricular and aortic pressures, and left ventricular volume. The relationships depicted here also exist in the right heart during the cardiac cycle; however, the operating pressures are much lower (Table 5-1).

FIGURE 5-3 Mechanical and electrical events of the cardiac cycle. ICP, isovolumic contraction period; IRP, isovolumic relaxation period; ECG, electrocardiogram. (Used with permission from Smith JJ, Kampine JP. Circulatory Physiology—The Essentials. 3rd ed. Baltimore, MD: Lippincott Williams & Wilkins; 1998.)
Electrical events—The cardiac cycle is initiated when the action potentials that arise in the SA node cause a wave of depolarization that spreads first through the atria (Chapter 4, Fig. 4-10). The impulses are then conducted to the AV node and finally to the ventricles. The electrical fields created by summation of action potentials in myocardial cells are conducted through the electrolyte-containing fluids of the body and can be recorded from the body surface as the electrocardiogram (ECG) (Fig. 5-3). By convention, deflections on the ECG tracing are called the P, Q, R, S, and T waves. The first positive deflection (relative to the tracing’s baseline) of the cardiac cycle, the P wave, represents atrial depolarization. The first negative deflection, the Q wave, is normally small and may not always be seen. The positive deflection after the Q wave (or the second positive deflection if no Q wave is present) is the R wave. The S wave is the negative deflection after the R wave. The QRS complex represents ventricular depolarization. After a pause, the T wave follows the S wave. The T wave represents ventricular repolarization.
Ventricular systole—Close inspection of the ventricular volume tracing in Fig. 5-3 reveals that ventricular systole consists of three parts: an isovolumic contraction period (ICP), a rapid ejection period, and a slower ejection period. During the ICP, ventricular pressure rises, but there is no change in ventricular volume because the mitral and aortic valves are closed. Once the aortic valve opens, the period of rapid ejection begins. Ventricular and aortic pressures rise to a peak in this period, and approximately two-thirds of the ventricular volume is emptied into the aorta. During the subsequent slower ejection period, ventricular and aortic pressures begin to fall. When ventricular pressure falls below aortic pressure, the aortic valve closes. Closure of the aortic valve marks the beginning of the isovolumic relaxation period (IRP) during which ejection of blood ceases and ventricular pressure falls dramatically.
Note that the ventricle does not empty completely during systole. The residual volume (end-systolic volume) is roughly equal to the amount of blood ejected from the ventricle during systole. The ejection fraction, that is, the percentage of the end-diastolic volume ejected during the subsequent systole, is a clinically useful index of cardiac pump function. Ejection fraction is increased in situations where force of contraction is augmented (eg, during exercise) and is reduced in situations where force of contraction is diminished (eg, cardiomyopathy, ischemic heart disease).
Ventricular diastole—The IRP is the initial phase of ventricular diastole. When ventricular pressure falls below atrial pressure, the mitral valve opens and diastolic filling of the ventricle commences. A period of rapid filling occurs immediately after the valve opens, followed by a period of more gradual filling, called diastasis. Ventricular filling is completed when the P wave that initiates the next cardiac cycle causes atrial contraction, which leads to a further increase in ventricular volume and pressure. This atrial contribution to ventricular filling, which has been termed the atrial kick, is important mainly during fast heart rates, when time for ventricular filling is limited.
Regulation of Cardiac Output
The preceding sections outlined several aspects of normal physiology that enable the heart to function as an efficient pump. The end product of this pumping function, the cardiac output, must be adequate to meet metabolic needs of the tissues of the body in a wide variety of conditions that threaten homeostasis. The major determinants of cardiac output are preload, afterload, contractile state (by virtue of their influence on stroke volume), and heart rate. Cardiac output is the product of stroke volume and heart rate. The cardiac index, a clinically useful indicator of pump performance in individuals of varying sizes, is calculated by dividing the cardiac output by body surface area. The normal value for cardiac index in an adult is 3 L/min/m2.
Stroke volume—Stroke volume, the amount of blood pumped with each heartbeat, is influenced both by intrinsic factors (ie, those determined by properties of the heart muscle itself) and by extrinsic factors (ie, those imposed by neural stimulation, hormones, drugs, and disease). The most important intrinsic regulator of stroke volume is myocardial cell length. Within physiological limits, the force generated by the contracting myocardium increases in direct proportion to its precontraction length (the Frank-Starling mechanism).5 A family of curves that depict the relationship between end-diastolic volume and ventricular performance is shown in the left-hand portion of Fig. 5-4. The particular curve on which the ventricle operates at any point in time is determined by the contractile, or inotropic, state of the myocardium (right-hand portion of Fig. 5-4). Factors that increase contractility will cause the curve to shift up and to the left. Factors that have a negative influence on contractility will shift the curve down and to the right. The Frank-Starling mechanism is analogous to the length–tension relationship in skeletal muscle. As is the case with skeletal muscle, when the heart muscle is stretched beyond the length that is optimal for myofibrillar cross-bridge formation, force generation decreases. The dashed lines in the two lower curves illustrate this situation. The clinical concept of preload refers to the effect of myocardial stretch prior to contraction (ie, the end-diastolic volume) on stroke volume. In patients with ventricular dysfunction due to disease, many pharmacologic treatments are aimed at optimizing ventricular performance by altering preload (Chapter 8).
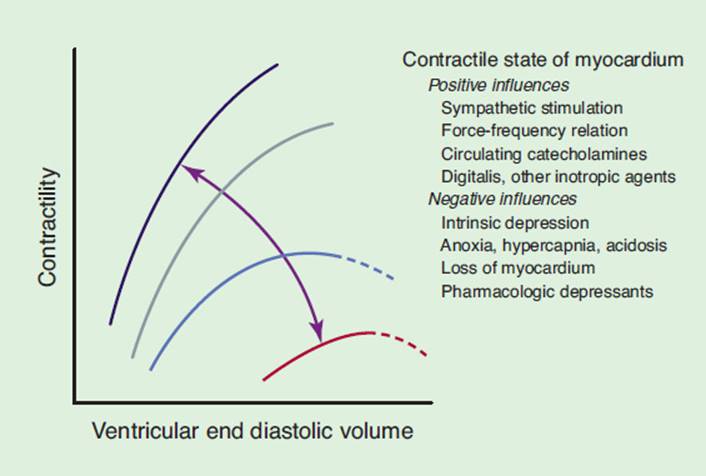
FIGURE 5-4 Determinants of myocardial contractility and ventricular performance. End diastolic volume. (Used with permission from Braunwald E, Ross J, Sonnenblick EH. Mechanisms of Contraction of the Normal and Failing Heart. 2nd ed. Philadelphia, PA: Lippincott Williams & Wilkins; 1976.)
Another intrinsic regulatory mechanism is the force–frequency relationship, whereby increases in the heart rate, per se, cause increases in myocardial force generation. The physiologic basis for the relationship between frequency and force is an increase in the amount of calcium ions available for excitation–contraction coupling that occurs at high heart rates.
The load against which the ventricles must pump to eject blood is referred to as afterload—another intrinsic regulator of pump performance.4 Increases in afterload can have a negative effect on pump performance. For example, when pressure in the aorta is increased suddenly, the left ventricular stroke volume falls. In the healthy heart, the reduction in stroke volume is only temporary because compensatory mechanisms come into play. In patients with ventricular dysfunction, high afterload has a significant deleterious effect on cardiac output. In the clinical setting, the systemic arterial pressure provides an estimate of left ventricular afterload. Pharmacological treatment aimed at afterload reduction is a commonly used strategy for treatment of ventricular dys-function (Chapter 8).
A chronic state of intrinsic depression can occur when myocardial cells are damaged by exposure to adverse loading conditions, toxins, and infectious processes. After myocardial infarction (Chapter 6), necrosis of cells and subsequent replacement with scar tissue can depress the contractile state, provided that sufficient numbers of cells are lost. Insufficient blood supply to myocardial tissue depresses inotropic state because of the anoxia, hypercapnia, and acidosis caused by ischemia.
Factors extrinsic to the heart also serve as important regulators of the inotropic state.3 The neurotransmitter norepinephrine, released locally when the sympathetic nerves fire, increases inotropic state. Release of acetylcholine from the parasympathetic nerve terminals produces a negative inotropic effect, mainly in the atria. Catecholamine hormones epinephrine and norepinephrine, which are released into the blood stream by the adrenal glands, circulate to the heart and positively influence contractility. Pharmacologic agents such as digitalis, amrinone, and isoproterenol increase inotropic state, whereas barbiturates, calcium antagonists, and anesthetic agents decrease inotropic state (Chapter 8).
Heart rate—Because cardiac output is the product of heart rate and stroke volume, the heart rate contributes importantly to the heart’s function as a pump. In situations when a change in cardiac output is necessary (eg, during exercise), the heart rate is regulated by neural, chemical, and intrinsic mechanisms.
Neural regulation of the heart rate is under the control of the sympathetic and parasympathetic divisions of the autonomic nervous system (Fig. 5-5).4 Parasympathetic fibers, which travel to the heart via the vagus nerve, innervate the SA node, the AV node, and atrial muscle. When these nerve fibers are activated, they slow the heart rate and decrease the rate of conduction through the AV node. Sympathetic neurons from the thoracic cord travel to the heart in the superior, middle, and inferior cardiac nerves. They innervate the heart’s conduction system as well as the atrial and ventricular muscles. When the sympathetic nerves fire, they increase heart rate and the rate of conduction through the AV node. In addition to their effects on heart rate, parasympathetic and sympathetic neural impulses regulate cardiac output by decreasing and increasing, respectively, the force of myocardial contraction.
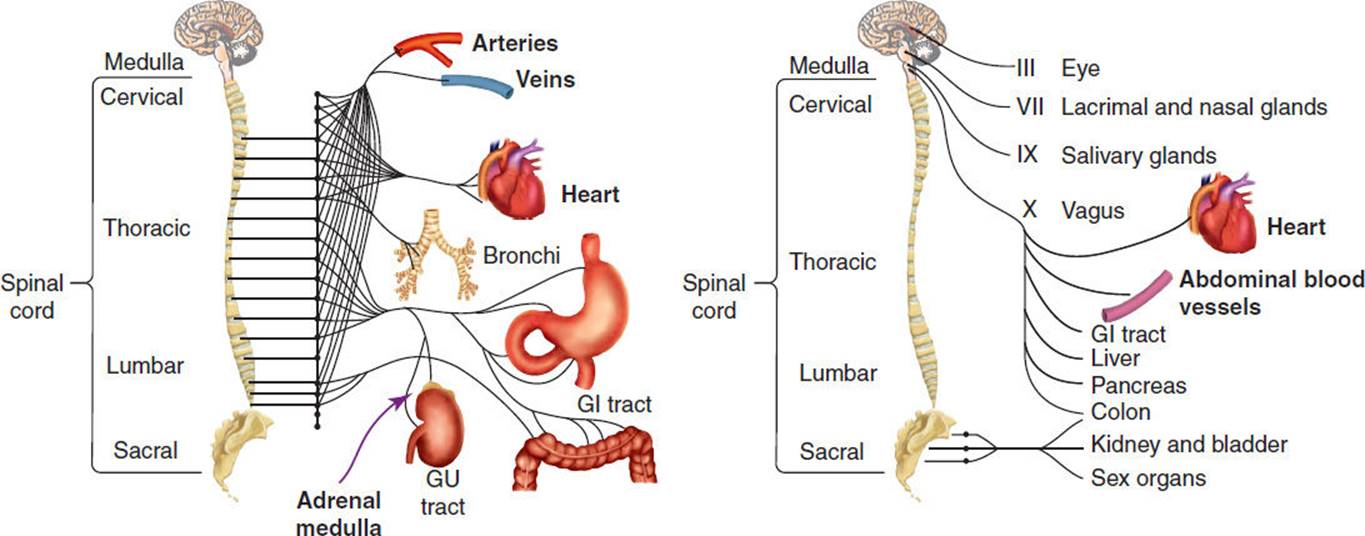
FIGURE 5-5 Sympathetic (left) and parasympathetic (right) divisions of the autonomic nervous system and the structures innervated by each division. GI, gastrointestinal; GU, genitourinary. (Modified with permission from Smith JJ, Kampine JP. Circulatory Physiology—The Essentials. 3rd ed. Baltimore, MD: Lippincott Williams & Wilkins; 1998.)
The most important natural chemical regulators of cardiac output are the catecholamines (norepinephrine and epinephrine) secreted by the adrenal glands. When these hormones bind to β-adrenergic receptors in the SA node and myocardial cells, they increase heart rate and the force of contraction. In the clinical setting, pharmacologic agents are used to regulate (either increase or decrease) the heart rate and force of contraction (Chapter 8).
In addition to the neural and chemical regulators of heart rate, two intrinsic factors play a small role in heart rate control. The stretch of the SA node and increased body temperature both increase heart rate. The primary determinants of the heart’s performance as a pump are preload, afterload, heart rate, and contractility.
The Arterial Systems
Arteries comprise the distributing systems for the pulmonary and systemic circulations. Within the systemic circulation, the various vascular beds are arranged as parallel circuits (Fig. 5-1).1 One or more large arteries supply each organ or type of tissue (eg, the kidney or skeletal muscle). These arteries divide multiple times within the organ and eventually give rise to arterioles, the primary resistance vessels in the systemic circulation. The arterioles are thick-walled, muscular vessels that regulate distribution of blood flow to the capillary beds via changes in their caliber. Arteriolar diameter is controlled by sympathetic neural activity, circulating hormones, locally produced metabolites, and local mechanical factors that influence vascular smooth muscle tone. Because of the parallel arrangement of the systemic circuits, the amount of flow through each vascular bed can be controlled separately, according to the level of tissue activity. For example, after a large meal, large amounts of blood are diverted to the gastrointestinal tract to support the process of digestion. At the same time, blood flow to nonessential (for the moment) vascular beds is reduced.
The pulmonary circulation comprises the pulmonary trunk, the right and left pulmonary arteries, and their divisions within each lung.1 The pulmonary arteries are well supplied with sympathetic and parasympathetic nerve fibers; however, this innervation does not play an important role in regulating pulmonary vascular resistance. Instead, the vascular smooth muscle of the pulmonary bed is responsive to local chemical influences. Hypoxic vasoconstriction of the pulmonary vasculature is a local phenomenon that occurs in regions of the lung that contain oxygen-poor air. This mechanism is important in maintaining high pulmonary vascular resistance during fetal life when only a small fraction of the cardiac output circulates through the pulmonary bed. After birth, when the infant’s first breath oxygenates previously hypoxic alveoli, pulmonary vascular resistance falls dramatically due to reversal of hypoxic vasoconstriction. In postnatal life, hypoxic vasoconstriction is beneficial when a portion of the lung becomes hypoxic due to bronchial obstruction. In this case, hypoxic vasoconstriction redistributes blood flow away from the hypoxic region toward adequately ventilated areas of the lung, thereby minimizing the deleterious effect of the obstruction on gas exchange. However, when the entire lung is hypoxic (eg, at high altitude or in pulmonary disease), sustained hypoxic vasoconstriction results in pulmonary hypertension and, eventually, right ventricular dysfunction.
Hemodynamics
Blood flow through the cardiovascular system is influenced both by events in the central circulation (the driving pressure generated by the pump) and by the peripheral circulation (the resistance to flow generated by the arterioles). Ohm’s law, originally used to describe the factors that govern flow of electrical current, can also explain the relationships among pressure, flow, and resistance in the circulatory system.3 The following formula shows that blood flow (F) through a vascular bed is directly proportional to the pressure gradient across the bed (ΔP) and is inversely proportional to the resistance (R) offered by the arterioles:

The pressure at the inlet of any bed is roughly equal to the mean arterial pressure (one-third pulse pressure + diastolic pressure). The pressure at the outlet of the bed is equal to its venous pressure. These same principles can be applied to the circulatory system as a whole. Flow (cardiac output) is directly proportional to the pressure gradient (aortic pressure minus right atrial pressure) and inversely proportional to total peripheral resistance (the sum of the reciprocals of resistances in the individual vascular beds).
Poiseuille’s law states that laminar flow through a rigid cylinder varies directly with the pressure gradient and inversely with the radius and length of the tube and the viscosity of the fluid.3 Of course, blood flow through the cardiovascular system does not meet the criteria specified by Poiseuille; nevertheless, the following formula, based on Poiseuille’s law, is useful for explaining the relationship among factors that influence vascular resistance:

where n = blood viscosity, L = vessel length, and r = vessel radius. Note that the radius term in this equation is raised to the fourth power. This means that even very small changes in the radius can result in large changes in resistance.
The term vasoconstriction refers to an increase in vascular resistance. Conversely, vasodilation refers to a decrease in resistance. Note that increases and decreases in blood flow do not always imply vasodilation and vasoconstriction. According to Ohm’s law, these changes can also occur “passively” secondary to changes in perfusion pressure. Blood flow through a vascular bed is equal to perfusion pressure divided by resistance. The primary determinant of resistance is vessel caliber.
Regulation of Arterial Flow
The caliber of arterioles, the primary resistance vessels in the systemic circulation, is determined by the net effect of multiple, simultaneous constrictor and dilator influences. These neural, chemical, and mechanical factors are summarized in Fig. 5-6.

FIGURE 5-6 Summary of the neural, chemical, and mechanical factors that determine the caliber of resistance arterioles. Constrictor influences (shown in black) are opposed by dilator influences (shown in gray). Ang II, angiotensin II; AVP, arginine vasopressin; Epi, epinephrine; ANP, atrial natriuretic peptide; BNP, brainc natriuretic peptide; NE, norepinephrine; NPY, neuropeptide Y; TXA2, thromboxane; ET-I, endothelin-I; NO, nitric oxide; PGI2, prostacyclin.
Arterioles throughout the body are innervated by sympathetic, noradrenergic nerve fibers.3 When these nerves fire, norepinephrine is released from storage granules into the synaptic cleft. The released norepinephrine then binds to postsynaptic β-adrenergic receptors on vascular smooth muscle, thereby triggering vasoconstriction. Sympathetic vasoconstrictor neurons that innervate arterioles in skeletal muscle and many other vascular beds are tonically active and contribute importantly to maintaining blood pressure homeostasis. Sympathetic vasoconstrictor impulses originate from vasomotor centers in the brainstem. Reflexes arising in the peripheral sensory receptors (eg, baroreceptors and chemoreceptors) modulate the level of central sympathetic outflow in response to perturbations of homeostasis. In addition to this neural mechanism, the radius of arterioles is decreased by increases in the local concentrations of vasoconstrictor hormones (eg, angiotensin, vasopressin). Neural and humoral vasoconstrictor mechanisms both contribute importantly to the maintenance of blood pressure and blood volume (eg, during the shift from supine to upright posture).
Conversely, the radius of the resistance vessels increases and vasodilation occurs when sympathetic stimulation is withdrawn. In addition, local accumulation of vasodilator substances (eg, adenosine) plays an important role in the vasodilation that is produced by an increase in an organ’s metabolic rate (eg, exercise-induced vasodilation in skeletal muscle).
The vascular endothelium plays an important role in the local regulation of vascular smooth muscle tone.3 The endothelium participates in vasodilator responses, vasoconstrictor responses, and in vascular adaptations to long-term stimuli. It releases at least two potent vasodilator substances, nitric oxide and prostacyclin, in response to changes in chemical concentrations within the blood. This mechanism is thought to be the basis for the endothelium’s role in metabolically mediated vasodilation. Vascular endothelium also mediates flow-induced vasodilation. The endothelial monolayer is in direct contact with blood flowing through the vessel lumen and therefore is subject to increased shear stress when flow increases. Nitric oxide and prostacyclin are released from the endothelium in response to an increase in shear stress. The vascular endothelium also produces locally active vasoconstrictor substances (eg, endothelin-1 and thromboxane) that participate in the regulation of arteriolar tone; however, nitric oxide seems to be the most important endothelial factor under normal conditions. In addition to its role in the regulation of vascular tone, the endothelium also plays a crucial role in preventing blood coagulation via its inhibitory effects on platelet aggregation (Chapter 6).
Myogenic contraction and relaxation are intrinsic qualities of vascular smooth muscle that contribute importantly to basal tone in the arterioles. Myogenic vasoconstriction occurs in response to stretch of vascular smooth muscle; that is, when transmural pressure at the arteriolar level rises, vascular smooth muscle is stimulated to contract. When transmural pressure falls, vasodilation occurs.
Because vascular beds in the systemic circulation are arranged as parallel circuits, the resistance in each bed can be regulated separately. The resultant differential distribution of the cardiac output is essential for maintaining homeostasis under a wide range of metabolic and environmental conditions.
The Capillary Exchange System
Capillaries are narrow vessels constructed of a single layer of endothelial cells. Flow through the capillaries is continuous, nonpulsatile, and relatively slow due to the large cross-sectional area of the capillary bed. Thus, the capillary bed is well suited for exchange of gases, nutrients, and waste products between blood and tissues. These substances cross the capillary walls either by diffusion or by filtration and reabsorption, depending primarily on their lipid solubility.
Diffusion of Gases and Molecules
Lipid-soluble molecules, such as O2 and CO2, diffuse directly through the lipoprotein membrane of the capillary endothelium.3 The rate of diffusion is proportional to the difference in gas partial pressures on either side of the membrane and to the area of interface, and inversely proportional to membrane thickness. The following formula illustrates the relationships between the factors that influence the rate of diffusion:

where A = area of the sheet of tissue, D = diffusion constant (based on properties of the tissue and the gas), ΔP = pressure gradient across the sheet of tissue, and T = thickness of the tissue.
Water-soluble molecules, such as inorganic ions, proteins, and glucose, travel through pores located between the endothelial cells. The process of filtration and reabsorption aids the movement of these water-soluble substances.
Transcapillary Movement of Fluid
In addition to the exchange of gases, nutrients, and waste products, there is a constant movement of fluid across the capillary wall that is caused by the forces shown in Fig. 5-7.4 At the arterial end of the capillary, the intravascular pressure is high (~30 mm Hg), relative to the pressure of the fluid in the inter-stitial space (~0 mm Hg), and is higher than the colloid osmotic pressure exerted by the plasma proteins. This pressure gradient causes the fluid to move out of the capillary into the interstitial space (filtration). At the venous end of the capillary, the intravascular pressure is still high relative to interstitial pressure, but both pressures are lower than the colloid osmotic pressure, which pulls fluid back into the capillary (reabsorption). Normally, 85% of the fluid that is filtered is reabsorbed. The remainder is drained from the area via the lymphatic system. Thus, there is no accumulation of fluid in the interstitial space. When the balance among filtration, reabsorption, and drainage is upset, edema formation occurs. Conditions that promote edema formation include venous hypertension (which limits reabsorption by raising intravascular pressure at the venous end of the capillary), blockage of lymphatic drainage vessels, decreased plasma protein concentration, and increased permeability of the capillary wall.

FIGURE 5-7 Forces responsible for the movement of fluid at the capillary level. At the arterial end of the capillary, the relatively high intravascular pressure (PC) promotes filtration or movement of fluid out of the capillary. At the venous end of the capillary, the relatively high osmotic pressure exerted by plasma proteins promotes reabsorption. Nearly all of the filtered fluid is reabsorbed; the remainder drains into the lymphatic system.
The Lymphatic System
Lymphatics are tiny, extremely thin-walled vessels that are not connected in series with the arteries and veins.4 A primary function of the lymphatic system is to return excess tissue fluid to the intravascular compartment. The lymph vessels accomplish this task by collecting fluid that has been filtered but not reabsorbed at the capillary level (Fig. 5-7) and returning it to the central circulation via a system of regional water-sheds. Lymph vessels in peripheral tissue combine to form collecting ducts that are lined with smooth muscle and equipped with one-way valves that ensure unidirectional flow. As the lymph is propelled toward the central circulation, it flows through a series of successively larger vessels that merge to form the thoracic ducts that empty into the subclavian veins. On its route from peripheral tissue to the central circulation, lymph passes through at least one regional lymph node. These nodes contain filtration systems lined with phagocytic cells that engulf and neutralize bacteria and other foreign material (Chapter 22).
The Venous System
Blood is returned to the heart from the periphery through the systemic veins.4 These veins are compliant, thin-walled vessels that contain valves to ensure one-way flow of blood. Because they are highly compliant, the veins act as reservoirs for blood; therefore, they are referred to as capacitance vessels. At any one time, approximately 60% of the total blood volume is contained within the systemic veins.
Regulation of Venous Flow and Volume
Through active and passive changes in their capacity, the veins regulate the amount of venous return to the heart. The volume of blood stored in a venous bed is dependent on the pressure gradient across the bed and the level of “tone” present in smooth muscle of the vessel wall.6
The splanchnic veins are richly innervated by sympathetic vasoconstrictor fibers. When these nerves are activated, the resulting venoconstriction reduces the capacitance of the splanchnic venous bed, thereby increasing venous return to the heart. This mechanism contributes importantly to the maintenance of cardiac output during postural shifts in blood volume. The cutaneous veins, also under sympathetic control, participate in temperature regulation by constricting under cold conditions and dilating in the heat. In contrast, veins in skeletal muscle do not receive sympathetic innervation. When a muscle contracts, however, blood is squeezed out of the veins contained within it. Working in concert with competent venous valves, this “muscle pump” greatly facilitates venous return. Incompetence of the venous valves, for example, that caused by varicose veins, results in excessive venous pooling during gravitational stress and renders the muscle pump less effective in aiding venous return to the heart.
Breathing can also affect venous return. When the diaphragm descends during inspiration, intrathoracic pressure decreases and intra-abdominal pressure rises. The gradient between the abdomen and thorax is thus increased, causing blood to flow from the inferior vena cava into the right heart. The systemic veins act as a reservoir for blood. Through active and passive changes in their capacity, they continuously regulate central blood volume and cardiac filling pressures.
Special Characteristics of the Regional Circulations
The factors responsible for regulation of blood flow are not the same in all organs and vascular beds. In fact, there are marked regional differences in circulatory control mechanisms. In this section, regulation of coronary, pulmonary, skeletal muscle, and cerebral blood flow will be discussed.
Coronary Blood Flow
The left and right coronary arteries and their major branches are epicardial; that is, they lie on the surface of the heart. The epicardial arteries branch to form the endocardial coronary arteries that penetrate the heart muscle at right angles. The majority of the heart’s venous blood drains into the right atrium via the cardiac veins and the coronary sinus.
As blood traverses the coronary vascular bed, extraction of oxygen from it is nearly complete, even at resting levels of myocardial oxygen consumption (M O2). Consequently, the oxygen content of blood in the coronary sinus is approximately one-third of that found in the venous drainage of resting skeletal muscle. Because of this high degree of extraction, increases in MO2 must be accommodated by increases in the rate of oxygen delivery via coronary blood flow.
Mechanical and metabolic factors are the primary determinants of the rate of blood flow through the coronary arteries.3 The coronary arteries are compressed by contraction of the heart muscle during systole; therefore, they fill mainly during diastole. Diastolic pressure, then, is the primary determinant of coronary perfusion pressure. Any condition that produces an increase in the work of the heart (eg, exercise, emotional stress) also causes an increase in the rate of coronary blood flow. Metabolic by-products of cardiac muscle contraction are thought to be responsible for this close coupling between myocardial metabolism and coronary blood flow. Although the specific chemical mediators of this response have not been identified, adenosine is thought to play an important role in metabolic vasodilation.
In the coronary circulation, unlike the peripheral circulation, the autonomic nervous system seems to have little direct influence on blood flow. Nevertheless, alterations in sympathetic and parasympathetic outflows to the heart can influence coronary blood flow indirectly because they affect heart rate and force of contraction—the two primary determinants of the myocardium’s metabolic rate. The double product, an estimate of (MO2) that is useful clinically, is calculated by multiplying heart rate by systolic blood pressure.
Autoregulation is an intrinsic regulatory characteristic of the coronary vascular bed and other beds (eg, the cerebral circulation) that have low levels of neural control. When perfusion pressure in one of these vascular beds is either increased or decreased, local resistance vessels adjust their caliber appropriately so that the impact on blood flow is minimized. Because of autoregulation, blood flow to vital organs remains relatively constant over a wide range of perfusion pressures. Although the mechanisms responsible for autoregulation are not completely understood, myogenic and flow-dependent processes are thought to be involved.
The Pulmonary Circulation
Pulmonary circulation is unique because it is the only vascular bed that receives all of the cardiac output all of the time. The pulmonary vessels—arterioles, capillaries, and venules—are highly distensible and thin walled, containing comparatively little smooth muscle.3 The average resistance in the pulmonary vasculature is only approximately 1/10 of that in systemic circulation. The pulmonary arterioles at the entrance to the gas-exchange area of the lungs are of muscular type and they respond primarily to local hypoxia and hypercapnia. In contrast to arterioles in the systemic circulation, the pulmonary arterioles are not under significant neural (sympathetic) control.
The pulmonary microcirculation includes an extensive interdigitating capillary network, likened more to a sheet of blood rather than to individual channels. The pulmonary capillary bed has a huge surface area and yet contains only 70 to 90 mL of blood under resting conditions. This capillary blood volume can expand more than threefold with only very small changes in pressure as pulmonary blood flow increases. In pulmonary circulation, capillary hydrostatic pressure is lower than in systemic circulation (approximately 7 mm Hg vs 30 mm Hg); therefore, filtration pressure is very low. This is an important mechanism for keeping the lungs “dry.” Nevertheless, there is a small outward flow of fluid ([H11011]10–20 mL/h) from the pulmonary capillaries into the interstitium of the alveolar wall and then into the perivascular and peribronchiolar spaces of the lung. The lymphatic system of the lungs transports this filtered fluid from the interstitium to the hilar lymph nodes. The flow of lymph will increase substantially if capillary hydrostatic pressure and filtration increase. This lymphatic “storm sewer” prevents accumulation of fluid in the interstitial space that can lead to alveolar flooding (pulmonary edema) and impairment in gas exchange. A common cause of pulmonary edema is increased capillary filtration pressure due to failure of the left ventricle to discharge blood. Other causes of pulmonary edema are increased capillary permeability and decreased lymphatic clearance.
Vascular resistance in pulmonary circulation—unlike systemic circulation—is not controlled to a significant extent by extrinsic neural influences; nor does the smooth muscle in pulmonary arterioles exhibit autoregulation of blood flow. Nevertheless, there is a significant amount of smooth muscle in the pulmonary arteries, arterioles, and veins. A number of factors may act locally on this smooth muscle; however, the partial pressure of oxygen (PO2) in the alveolar gas is the most important minute-by-minute regulator of local pulmonary vascular resistance. If alveolar PO2 falls below approximately 65 to 70 mm Hg, for example, because of underventilation in a specific region, adjacent arterioles will constrict. Local blood flow is thereby reduced and shifted to portions of the lung with higher ventilation and higher alveolar PO2. (Note that this hypoxic vasoconstriction in the lung is the opposite of what occurs in the systemic vasculature, where local hypoxia relaxes the local resistance of vessels, thereby causing vasodilation.) Accumulation of CO2 in underventilated lung regions will also cause localized pulmonary arteriolar vasoconstriction.
Skeletal Muscle Blood Flow
Skeletal muscle is unusual among body tissues because it can increase its resting metabolic rate by as many as 50-fold, as evidenced by increases in the arteriovenous O2 content difference across the muscle’s vascular bed. If homeostasis is to be maintained, this large increase in metabolism necessitates a proportionately large increase in blood flow. Flow and metabolic rate are well matched in skeletal muscle by a combination of neural, chemical, and mechanical regulatory factors. The relative contributions of these factors depend on the level of muscle activity. When the muscle is at rest, arterioles in skeletal muscle exhibit a relatively high level of baseline resistance that is determined by myogenic tone and tonic levels of sympathetic vasoconstrictor outflow. In contrast, during muscle contraction, chemical and mechanical vasodilatory factors become much more important and can override the vasoconstrictor effects of sympathetic nerve stimulation.7
Metabolic by-products of contraction would seem to be the ideally suited chemical regulators of skeletal muscle blood flow; however, the specific chemical(s) responsible for exercise vasodilation have not been identified. The difficulty arises, in part, because almost all of the substances released into the interstitial space during muscle contraction (eg, potassium, adenosine, CO2, lactate) produce vasodilation. In addition, an exercise-induced increase in many of these vasodilator stimuli is transient, whereas vasodilation is maintained throughout the period of muscle contraction. Thus, it appears that separate mechanisms may be responsible for initiating and maintaining metabolic vasodilation.
By-products of muscle contraction may exert their relaxing effect on vascular smooth muscle, at least in part, by stimulating the release of nitric oxide from the endothelium. In addition, the endothelium contributes to exercise hyperemia via flow-mediated vasodilation.
Mechanical factors also exert local control over skeletal muscle blood flow. When a muscle contracts and shortens, blood vessels within it are compressed. Thus, blood flow to a muscle is impeded while the muscle is contracting. During rhythmic muscle activity, reductions in blood flow that occur during the contraction phase are counterbalanced by increases in flow during the relaxation phase. In contrast, during sustained (isometric) muscle contraction, blood flow to the working muscle can become severely limited.6
A contraction-induced increase in extravascular pressure within the skeletal muscle decreases transmural pressure in the arterioles of the muscle vascular bed. This drop in trans-mural pressure causes relaxation of vascular smooth muscle via a local myogenic mechanism. The resultant myogenic vasodilation is thought to contribute importantly to exercise hyperemia. Conversely, when transmural pressure across the arteriolar wall increases, for example, when intravascular pressure rises, vascular smooth muscle is stimulated to contract and myogenic vasoconstriction occurs.
Because the skeletal muscle vascular bed is so large (approximately 40% of the total body mass), it is a major contributor to total peripheral resistance and, therefore, plays a key role in blood pressure regulation.6 The skeletal muscle bed, along with the splanchnic and renal circulations, participates importantly in baroreflex responses to orthostatic stress. Reductions in blood flow through inactive muscle, produced by reflexes arising in contracting muscle, are important for the redistribution of blood from inactive to active tissue that occurs during exercise.
Cerebral Blood Flow
The cerebrum is supplied with blood by the anterior, middle, and posterior cerebral arteries. These vessels are branches of the circle of Willis that arises from the basilar and internal carotid arteries. Venous drainage occurs via sinuses that empty into the jugular veins.3
The blood–brain barrier is a unique feature of the cerebral circulation. Capillaries within the central nervous system have very tight junctions between adjacent endothelial cells. This feature prevents the movement of large molecules and highly charged ions from the blood to the brain and spinal cord, and as a result, circulating hormones do not participate in the regulation of cerebral blood flow.
The cerebral vessels, unlike those in other organs, are contained within a rigid structure—the cranium. Because of this rigidity and because the brain is relatively incompressible, a balance must exist among arterial inflow, venous outflow, and extravascular fluid volume. Although regional differences in blood flow can be observed in response to evoked changes in brain activity (eg, sensory stimulation, talking, reading, problem solving), the rate of total cerebral blood flow remains remarkably constant over a large range of behavioral and environmental conditions. Maintenance of cerebral blood flow within a narrow range is advantageous to the individual because brain tissue is highly dependent on aerobic metabolism; ischemia lasting only a few minutes causes irreversible tissue damage.
Autoregulation and local chemical influences are of primary importance in the control of cerebral blood flow. The cerebral vessels show excellent autoregulatory capacity within the arterial pressure range of approximately 60 to 160 mm Hg. Increases and decreases in arterial pressure within this range trigger local vasoconstriction and vasodilation, respectively, that maintain blood flow at the baseline level. When mean arterial pressure falls below the autoregulatory range, the resultant decrease in cerebral blood flow results in syncope. When pressure rises above this range, increased blood flow, cerebral edema, and disruption of the blood–brain barrier ensue. Both myogenic and metabolic mechanisms are thought to play an important role in autoregulation.
Even though autoregulation is a strong controller of cerebral blood flow, it can be overridden by changes in arterial PCO2. Hypercapnia causes marked cerebral vasodilation; conversely, hypocapnia causes vasoconstriction. Potassium ions, low pH, and adenosine are potent vasodilators that are thought to be responsible for the coupling of blood flow with metabolism in the cerebral circulation.
The cerebral vessels receive sympathetic nervous system innervation. Electrical stimulation of these nerves causes vasoconstriction in cerebral vessels; however, this neural mechanism does not appear to regulate cerebral blood flow under physiological conditions. In acute hypertensive episodes, sympathetic vasoconstriction may protect the brain from arterial pressure increases that exceed the autoregulatory range.
The Fetal Circulation
The heart and blood vessels begin to develop in the third to fourth week of gestation. The formation of cardiovascular structures is essentially complete by week 7, and the fetal heart begins to beat by week 12. During fetal life, the lungs are not functional gas-exchange organs; therefore, the fetus must be supplied with oxygen by the maternal cardiovascular system via the placenta. In addition, the placenta performs the absorption and excretion functions of the lungs, gastrointestinal tract, and kidneys. Because of these special requirements, the structure and function of fetal circulation differ from the postnatal circulation in several important ways.
Cardiovascular Structure and Function in the Fetus
The fetus is supplied with oxygenated blood from the placenta via the umbilical vein.1 Approximately half of this blood is routed to the liver; the remainder flows through a bypass tract, the ductus venosus, into the inferior vena cava. There it mixes with the unoxygenated blood from the lower extremities and rejoins the stream of oxygenated blood that perfused the liver. The majority of blood from the inferior vena cava flows into the left atrium through the foramen ovale, an opening normally present only during fetal life, where it is pumped into the systemic circulation. The remainder of blood from the inferior vena cava empties into the right atrium where it mixes with deoxygenated blood from the superior vena cava. The right ventricle then pumps this blood; however, because of the high pulmonary vascular resistance that exists before birth, only a small fraction of the right ventricle’s stroke volume enters the pulmonary circulation. The remainder bypasses the lungs via the ductus arteriosus, a fetal connection between the pulmonary artery and the descending aorta. The head and upper extremities are supplied with blood from the ascending aorta. A portion of blood in the descending aorta supplies the lower extremities, and the remainder is returned to the placenta via two umbilical arteries.
Oxygen delivery to the fetus is facilitated by the presence of fetal hemoglobin. This protein has a higher affinity for oxygen than does adult hemoglobin. In addition, the hemoglobin concentration in fetal blood is higher than that in adult blood. As a result of these two factors, oxygen saturation in the fetus is maintained at adult levels, even though the PO2 in arterial blood is less than half of that of an adult.
Changes That Occur at Birth
At birth, several structural changes prepare the newborn for life outside the uterus. First when the umbilical cord is cut and blood flow through the umbilical veins ceases, the ductus venosus closes. The asphyxia produced by the stoppage of umbilical flow stimulates the respiratory centers in the neonate’s brainstem. The resultant lung inflation and oxygenation of the alveoli causes a dramatic fall in pulmonary vascular resistance, which allows a large increase in pulmonary blood flow. The increased flow of blood from pulmonary circulation into the left atrium raises pressure in the left atrium more than that in the right atrium, thereby closing the flaplike covering of the foramen ovale. Closure of the umbilical arteries substantially increases the resistance to left ventricular outflow and aortic pressure. When the aortic pressure rises above the pulmonary artery pressure, blood flow through the ductus arteriosus is reversed, and in 1 to 2 days the ductus closes. Persistence of fetal structures (ie, patent foramen ovale and patent ductus arteriosus) into postnatal life can result in a significant “shunt” of unoxygenated blood to the systemic circulation, thereby producing arterial hypoxemia and cyanosis in the infant.
PULMONARY SYSTEM PHYSIOLOGY
The pulmonary system’s primary function is to exchange O2 and CO2 between tissues, blood, and environment. In this regard, the lung is the only line of defense for O2 and CO2 homeostasis. In addition, the pulmonary system plays an important role in maintaining the acid–base balance. The lung is solely responsible for regulating CO2 levels; thus, it is the body’s major excreter of acid. The pulmonary system contributes to temperature homeostasis via evaporative heat loss from the lungs (this is not a major thermoregulatory mechanism in humans; however, it is very important in many animals). The lung also has nonrespira-tory functions. It is the only organ that always receives all of the cardiac output; therefore, it is an ideal site for filtering and metabolizing toxic substances in the blood.
Gas Transport from Atmosphere to Tissue
Fulfilling the needs of metabolizing tissues for O2 delivery and CO2 elimination requires a high degree of coordination among several discrete functions. The steps in gas transport can be thought of in terms of these functions (Fig. 5-8B) and by the resultant changes in the partial pressures of O2 and CO 2at each step (Fig. 5-8A).

FIGURE 5-8 (A) Partial pressures of O2 and CO2 at each of the steps in their transport between ambient air and tissue. (B) Schematic representation of the functional links in O2 and CO2 transport. 1 = neural control; 2 = the pump; 3 = ventilation; 4 = pulmonary gas exchange; 5 = blood gas transport; and 6 = tissue gas exchange.
Partial Pressures
O2 and CO2 levels in air and blood are expressed as partial pressures. The pressure exerted by each individual gas in a gas mixture is independent of the pressures of other gases; that is, each gas exerts a pressure proportional to its concentration. Thus, the partial pressure of a gas (P) equals the fractional concentration of the gas times the barometric pressure (PB). For example, in dry atmospheric air, the O2concentration is 21% and the nitrogen concentration is 79%. Thus, at sea level:
PO2 (mm Hg) = 0.21 × 760 mm Hg = 160 mm Hg
and
PN2 (mm Hg) = 0.79 × 760 mm Hg = 600 mm Hg.
As air travels through the nasal passages and upper airways, it is warmed to 37°C and it becomes completely saturated with water vapor. At body temperature, water vapor exerts a pressure of 47 mm Hg (PH2O). In order to represent accurately the partial pressures presented to the lungs for gas exchange (ie, after warming and humidification), PH2O is first subtracted from the barometric pressure. Thus, for inspired, tracheal gases at sea level,
PO2 = 0.21 × (760 – 47) mm Hg = 150 mm Hg
and
PN2 = 0.79 × (760 – 47) mm Hg = 563 mm Hg.
Note that inspired, tracheal PO2 is fixed (ie, unless supplemental O2 is administered, an individual changes altitudes or rebreathes his or her own exhaled air). In contrast, the PO2 (and PCO2) in alveolar gas and that in arterial, capillary, and venous blood are affected by many factors of health and disease. The following discussion briefly considers the determinants of PO2 and PCO2 at each of the four major steps in gas transport from the atmosphere to tissue mitochondria.
Steps in O2 and CO2 Transport
Step 1: Inspired (tracheal) to alveolar air gradient—The difference between tracheal and alveolar partial pressures is determined solely by the level of alveolar ventilation (A) in relation to metabolic requirements (O2 consumed or CO2 produced). Thus, for a given oxygen uptake (O2) or carbon dioxide production (CO2) the higher the ventilatory rate, the higher the alveolar PO2 and the lower the alveolar PCO2. Conversely, the lower the ventilatory rate, the higher the alveolar PCO2, and the lower the alveolar PO2.
This matching of alveolar ventilation to metabolic requirement occurs without conscious effort because of three aspects of the pulmonary system physiology. First, the body contains a neurochemical control system made up of sensory receptors and a medullary integrator that detects deviations in blood gas homeostasis and makes appropriate adjustments in efferent neural signals to the muscles of respiration. Second, this special group of skeletal muscles in the upper airways, chest wall, and abdomen respond appropriately to coordinated efferent signals from the medullary integrator. Finally, the mechanical properties of the lungs allow the production of required flow rates and volumes with a minimum of effort from the respiratory pump muscles.
Step 2: Alveolar-to-arterial PO2 difference—The difference in alveolar (PAO2) and arterial (PAO2) partial pressures of oxygen is determined by the ability of the lungs to oxygenate the mixed venous blood that is returned to the lungs. This ability depends on the rate of diffusion between the alveoli and pulmonary capillaries and on the uniformity with which blood perfusing the pulmonary capillaries is matched with ventilation of the alveoli. Note that in the normal situation as shown in Fig. 5-8A, the O2 gradient between alveolar gas and arterial blood is small ([H11011]5–10 mm Hg).
Step 3: Gas transport by the blood—The third step depends critically on the ability of hemoglobin to bind O2 tightly at high PO2 (ie, as blood leaves the lungs) and also to release O2 readily at lower PO2 (ie, as blood traverses the capillaries of active tissue). CO2 transport from tissue back to the lung and its subsequent release is also dependent on the ability of the red blood cells to carry CO2.
Step 4: Exchange of gases between capillary and tissue mitochondria—The final step in gas transport occurs almost entirely by diffusion. Factors governing the rate of diffusion have been discussed earlier in this chapter.
Pulmonary Ventilation and Alveolar Gases
Inspiration occurs when the respiratory muscles generate subatmospheric pressures in the pleural space and the alveoli; expiration occurs when the lungs recoil and pleural and alveolar pressures become less negative.2 Normal values for the volume of air inhaled and exhaled under resting conditions (O2 consumption and CO2 production = 200–300 mL/min) by a healthy adult with a body weight of 70 kg are as follows: The volume of air inspired with each breath, or tidal volume (VT), equals 500 mL (range = 300–800 mL), and the average breathing frequency (fb) is 15 breaths/min (range = 10–20 breaths/min). The product of tidal volume and frequency is total minute ventilation (I), which averages 7.5 L/min (range = 4–10 L/min). The level of I will change in accordance with changing tissue metabolic requirements (O2 and CO2), the primary determinants of which are body mass, diet, and level of activity.
Alveolar Versus Dead-Space Ventilation
A portion of each breath does not participate in gas exchange; this volume is termed the dead space.2 Anatomical structures that lack gas-exchange surfaces are the pharynx, larynx, and the conducting airways. The volume of this airway (or anatomical) dead space in milliliters is approximately equal to the individual’s ideal body weight in pounds. The VT is composed of the dead-space volume (VDS) plus the alveolar volume (VA). For a 70-kg human, the average VT (500 mL) is made up of VDS (150 mL) plus VA (350 mL). Alveolar ventilation (A) is the product of VA and the breathing frequency.
Effect of breathing pattern on dead-space ventilation—Alveolar ventilation depends not only on the level of I but also on the pattern of breathing. Because a dead-space volume accompanies each breath, a rapid, shallow breathing pattern (ie, high fb, small VI) provides less alveolar ventilation than the same I produced by slow, deep breathing. High breathing frequencies are commonly observed in the individual with restrictive lung disease who has stiff (noncompliant) lungs that are difficult to expand to a normal VT. In these instances, the patient’s ventilatory control system has to “make a choice,” either to allow alveolar hypoventilation (with consequent CO 2retention and hypoxemia) or to increase I above normal levels to achieve an adequate A (with consequent increase in effort and energy expenditure). Obviously, neither choice is ideal!
Other causes of increased dead-space ventilation—In addition to the dead space contained within conducting airways, a portion of I may be “wasted” when there is an uneven distribution of ventilation relative to perfusion throughout the lung. An extreme example of increased dead-space ventilation occurs when completely unperfused alveoli are ventilated (eg, when a pulmonary embolus blocks blood flow to a portion of the lung). In a less extreme example, dead-space ventilation is also increased when normally perfused alveoli are overventilated (eg, when a partially obstructed airway in one portion of the lung results in overventilation elsewhere).
In healthy individuals, the anatomical plus alveolar dead space occupies only approximately 30% of the VT. In contrast, in patients with nonuniform structural abnormalities of the lungs, 60% to 70% of each VT may be composed of dead-space volume. When dead-space volume is increased, the energy costs involved in providing adequate A can be quite high. Dead-space ventilation may be increased (1) by increased breathing frequency because of the oxygen-poor, carbon dioxide–rich volume of gas inspired from the conducting airway or (2) by overventilation of alveoli with respect to their perfusion.
Determinants of Alveolar PO2 and PCO2
An increase in tissue metabolic activity results in increased levels of CO2 and decreased levels of O2 in the mixed venous blood that is returned to the lung. O2 and CO2, then, represent the metabolic load to which A must respond. The alveolar air can be thought of as a compartment of gas lying between the atmospheric air and the blood in the pulmonary capillaries. O2 is constantly being removed and CO2 is constantly being added to this reservoir by the blood flowing through the alveolar capillaries. During inspiration, alveolar PO2 rises because fresh air is added to the alveolar gas. During expiration, alveolar PO2decreases and alveolar PCO2 increases because fresh air is no longer being added, yet the blood flowing through the pulmonary capillaries continues to exchange gases with the alveolar air.
In addition to these within-breath variations in alveolar gas tensions, PAO2 and PACO2 vary in different areas of the lung (depending on the ventilation–perfusion distribution) and they vary from breath to breath. Of practical significance are the mean values for PAO2 and PACO2, averaged throughout all alveoli and over many breaths. These mean values for PAO2 and PACO2 can be calculated using the alveolar air equation.2 The concept underlying this equation is that the alveolar gas compartment is affected by the supply of fresh air to its A in relation to the amount of O2 removed (O2) and CO2 added (CO2). The alveolar air equation for calculating PACO2 is
PACO2 = CO2/A × K.
Because variations in inspired PO2 must be taken into account, the alveolar air equation for O2 is
PAO2 PIO2 – O2/A × K.
In both equations, K is a constant (863) used to standardize gas volumes and temperatures and partial pressures.
Alveolar hyperventilation occurs when more O2 is supplied and more CO2 is removed than the metabolic rate requires; in this case, alveolar and arterial PO2 rises and PCO2 falls. Alveolar hypoventilation occurs when less O2 is supplied and less CO2 removed than the metabolic rate requires; in this case, alveolar and arterial PO2 decrease and PCO2 rises. Alveolar and arterial PCO2 levels are almost always identical. Normally, near sea level, an alveolar and arterial PCO2 of approximately 40 mm Hg (±3 to 4 mm Hg) is maintained by adjusting ventilation appropriately for metabolic CO2 production. The alveolar or arterial PCO2 expresses the ratio of CO2 production (CO2) to alveolar ventilation (A) and defines under any physiologic condition whether the individual is hypoventilating, hyperventilating, or ventilating normally.
Mechanical Characteristics of the Lung and Chest Wall
The mechanics of the lungs and thorax play a crucial role in the physiology of breathing. For example, mechanical factors determine how much one is “willing” or “able” to ventilate, the breathing pattern, and the energy cost of breathing. In addition, mechanical factors contribute importantly to the perception of breathing effort. Moreover, lung and chest wall mechanics affect the distribution of inspiratory gas throughout the lungs, which, in turn, is a major determinant of gas exchange and arterial PO 2(PAO2).
Lung Volumes and Capacities
The lung volumes that define total lung capacity (TLC) and its subdivisions are shown in Fig. 5-9.2 The TLC and vital capacity define the maximum limits for each breath. The starting point for each breath is the functional residual capacity (FRC) or end-expiratory lung volume. The residual lung volume is the lowest possible lung volume achievable via forced expiration.

FIGURE 5-9 Normal lung volumes. In a 70-kg adult, average values are as follows: tidal volume = 0.4–0.7 L; functional residual capacity = 2.5 L (or 40%–50% of TLC); TLC = 5–7 L; residual volume = 1–2 L (or 20%–25% of TLC); vital capacity = 4–6 L. These volumes vary among healthy people according to weight, height, age, and gender. (Used with permission from West JB. Respiratory Physiology—The Essentials. 5th ed. Baltimore, MD: Lippincott Williams & Wilkins; 1995.)
Respiratory Muscles
Inspiratory muscle contraction expands the chest cavity outward and causes pleural pressure to become more subatmospheric. This pressure change is transmitted to the interior of the lungs so that alveolar pressure also becomes subatmospheric. The pressure difference between the alveoli and the airway opening (ie, mouth and/or nose) induces airflow into the lungs from the atmosphere. Following activation of the inspiratory muscles, the lungs expand until their recoil (inward) force equals the opposing (outward) force of the chest wall plus that of the contracting inspiratory muscles. When these forces come into balance, inspiration ceases. Expiration occurs passively as the result of inspiratory muscle relaxation.
Two sets of respiratory muscles act in coordinated fashion to produce ventilation: (1) those of the chest wall and abdomen that cause volume and pressure changes inside the thorax and (2) those that dilate and stiffen the collapsible, extrathoracic upper airway so that it can remain patent as negative pressure is generated within the chest.
Upper Airway Muscles
The extrathoracic airway includes the larynx, pharynx, and the oral and nasal cavities (Chapter 4, Fig. 4-7). The upper airway is most susceptible to collapse at the level of the soft palate and at the base of the tongue. Neural outflow to palatal and tongue muscles is particularly important in maintaining airway patency and minimizing airway resistance during inspiration.
In the larynx, the sole abductor muscle is the posterior cricoarytenoid. This muscle is innervated by somatic fibers that originate from the nucleus ambiguus in the ventrolateral medulla and reach their destination via the recurrent laryngeal nerve. The larynx, when denervated, acts as a one-way valve that allows expiration but not inspiration. Therefore, the vocal folds must be actively abducted by the posterior cricoarytenoid during inspiration.
Oral, nasal, and pharyngeal muscles are innervated by cranial nerves VII, IX, X, and XII. These muscles act as constrictors or dilators of the upper airway and they also contribute importantly to nonrespiratory functions. Along with the larynx, they are involved in swallowing, vocalization, coughing, and sneezing. The control of these muscles is complicated and poorly understood; however, their role in stabilizing the upper airway during inspiration is vital.
Diaphragm and Rib Cage Muscles
The diaphragm, which is innervated by the phrenic nerves arising from spinal segments C3 through C5, is a thin, dome-shaped muscle that separates the thoracic and abdominal cavities (Chapter 4, Fig. 4-5). It is a musculotendinous sheet, consisting of muscle bundles that originate from the lower ribs and insert on a flat central tendon. The diaphragm is responsible for generating most of the negative pleural and alveolar pressure during inspiration; therefore, it is the principal muscle of inspiration.
During inspiration, the dome of the diaphragm flattens as myofibrils shorten. Diaphragmatic contraction increases the cephalocaudal, anteroposterior, and lateral dimensions of the thorax, thereby increasing intrathoracic volume and decreasing intrathoracic pressure. As it contracts and descends, the diaphragm compresses the abdominal contents. This compression resists the diaphragm’s descent and creates positive pressure in the abdominal compartment. As a result, the abdominal wall is pushed outward. The lower ribs remain caudal to the diaphragm, even as it descends, and positive abdominal pressure causes the lower rib cage to be displaced outward. Thus, the abdominal contents act as a fulcrum for the diaphragm.
The human rib cage consists of 12 ribs on each side that articulate with the thoracic vertebrae (Chapter 4, Figs. 4-3 and 4-4). The motion of the ribs with respect to the thoracic vertebrae is similar to the motion of a bucket’s handle with respect to the bucket. Normally, each rib is tilted approximately 30 degrees below the horizontal plane. During inspiration, upward rotation of the ribs increases the cephalocaudal dimension of the thorax.
The principal inspiratory muscles of the rib cage are the external intercostals, which are so oriented that their contractions rotate the ribs (“bucket handles”) upward toward the horizontal plane. The rib cage muscles are innervated by the intercostal nerves that arise from spinal segments T1 through T12. The accessory muscles of inspiration include the stern-ocleidomastoid and the scalene muscles, which are attached to the first two ribs and to the sternum. When the position of the head is fixed, contraction of these muscles lifts the rib cage, thereby increasing the cephalocaudal dimension of the thorax. The serratus anterior and pectoralis muscles can also function as accessory muscles of inspiration. By virtue of their attachments to the ribs and sternum, they expand the thorax in the anteroposterior plane when the position of the arms is fixed.
In normal quiet breathing, the intercostal muscles may contribute up to half of the active inspiratory volume change; the diaphragm produces the rest. The muscles of the rib cage also contribute to inspiration by preventing inward (paradoxical) movement of the chest wall. Inward movement during inspiration can be seen in the newborn, whose rib cage is very compliant. This may also occur when the rib cage loses stiffness because of activation failure of the intercostal muscles, such as in spinal cord injury or in REM (rapid eye movement) sleep. Conversely, under conditions where the diaphragm is paralyzed, the rib cage muscles must accomplish the entire work of breathing. As pleural pressure decreases in such individuals, the diaphragm is sucked up into the thorax (paradoxical motion of the diaphragm) and the abdominal wall moves in.
The diaphragm’s ability to generate tension in response to motoneuron activation depends critically on its length. Tension is maximal at the diaphragm’s usual (“optimal”) fiber length that occurs at approximately the normal resting lung volume (ie, FRC). As the diaphragm muscle fibers are progressively shortened by increasing lung volume, the force that can be generated by the diaphragm falls, reaching zero at approximately 40% of the diaphragm’s normal resting length which is achieved at TLC.
The diaphragm’s function as an inspiratory muscle is also dependent on its shape. The diaphragm is normally curved, with the convexity facing cephalad and the concavity facing caudad. Its ability to convert developed tension into a pressure difference between the thoracic and the abdominal compartments depends on that curvature. Imagine what would happen if the diaphragm were a completely flat sheet of muscle separating the thorax from the abdomen. In this situation, no amount of force exerted by muscle contraction in that plane could produce a pressure difference between the diaphragm’s top and bottom surfaces! A less extreme example of how the diaphragm’s shape determines function is seen in patients with severe emphysema. In such individuals, lung hyperinflation creates a low, flat, shortened diaphragm that is susceptible to fatigue because it must operate at a substantial mechanical disadvantage.
In normal circumstances, the diaphragm is a highly fatigue-resistant skeletal muscle. It contains a large volume of mitochondria and high levels of oxidative enzymes. The diaphragm is rich in myoglobin and its high capillary density keeps diffusion distances for O2 very short. In addition, the diaphragm is very sensitive to locally produced vasodilator metabolites, thereby ensuring that it has adequate levels of blood flow to meet metabolic demands during repeated contractions. Thus, this key inspiratory muscle is capable of generating high levels of force output, even over long periods of time, without fatigue. Nevertheless, the diaphragm does fatigue under certain conditions. For example, it is possible to demonstrate diaphragm fatigue when requirements for force production are very high and sustained, such as during repetitive inspiratory efforts against high resistance. Fatigue can also be demonstrated when blood flow to the diaphragm is limited in combination with high-force output, such as during very high-intensity endurance exercise.
CLINICAL CORRELATE
In the clinical setting, diaphragm fatigue occurs when the capacity for force generation is compromised, such as in neuromuscular diseases or when diaphragm length is shortened (eg, by lung hyperinflation) or in malnourished states where atrophy occurs in all skeletal muscles.
Muscles of Expiration
The most important expiratory muscles are the abdominals, which are innervated at spinal levels T6 through L1. During expiration, abdominal muscle contraction depresses the lower ribs, pulls down the anterior part of the lower chest, and compresses the abdominal contents. The resultant increase in intra-abdominal pressure forces the relaxed diaphragm upward, causing its fibers to lengthen and thereby decreasing rib cage volume. During expiration, the abdominal muscles are assisted by the internal intercostals, which depress the ribs and move them inward. Contraction of the internal intercostal muscles also stabilizes the rib cage and prevents bulging of the intercostal spaces during forceful expiratory maneuvers.
Expiratory muscles are normally inactive during quiet breathing because expiration is achieved passively via elastic recoil of the lungs. Nevertheless, the expiratory muscles are critical for performing forceful expiratory maneuvers (eg, coughing) and are readily activated during even mild exercise. In heavy exercise, when breathing frequency is increased and expiratory time greatly shortened, active expiration is crucial for maintaining end-expiratory lung volume so that the diaphragm and other inspiratory muscles can work at their optimal lengths.
Mechanics of Breathing
In order to inflate the lungs, the inspiratory muscles must perform two types of work: (1) They must overcome the tendency of the lungs to recoil inward, that is elastic work, and (2) they must overcome resistance to flow offered by the airways.2 The following discussion of breathing mechanics will describe these processes.
Lung distensibility—In terms of its elastic properties, a lung can be likened to a balloon. While inflated, there is a tendency of the lung to recoil or collapse. In order to keep the lung inflated, a pressure difference between the alveolar pressure (PA) and the intrapleural pressure (Ppl) must be maintained. This distending force is provided by the elastic properties of the chest wall (which causes a tendency to recoil outward) and by the action of the inspiratory muscles.
Compliance is the term used to describe distensibility or the ease with which the lung can be inflated. It is defined as a change in volume for a given change in pressure. In the normal range of VT, the lung is remarkably distensible, as illustrated by the linear portion of the compliance curve of a normal lung in Chapter 9, Fig. 9-6A. However, as the lung volume approaches TLC, the lung is much stiffer (its compliance is smaller), as shown by the flatter slope of the upper portion of the compliance curve. This relationship of compliance to lung volume has substantial implications in determining how we “select” our breathing frequencies, tidal volumes, and endexpiratory lung volumes.
Compliance curves for individuals with emphysema and pulmonary fibrosis are different. With emphysema, a disease in which elastic tissue is progressively lost from the alveolar walls, compliance is high, and therefore small changes in translung pressure cause large volume changes. In contrast, in pulmonary fibrosis the lung is very “stiff”; that is, compliance is reduced and changes in translung pressure produce smaller than normal changes in volume.
Determinants of elastic characteristics of the lung—One factor responsible for the lung’s elastic behavior (ie, the tendency to recoil to its resting volume after distention) is the network of elastin and collagen fibers in the alveolar walls and the surrounding blood vessels and bronchi.2 In the geometrical arrangement of these fibers, lung tissue is like a nylon stocking in which individual fibers are difficult to stretch, whereas the entire stocking is very distensible because of its knitted construction. Changes in the structure and/or the amounts of these elastic tissues account for the loss of elastic recoil and increased lung compliance that occurs with normal aging and with emphysema.
Surface tension, created by the presence of an interface between air in the alveoli and the watery alveolar tissue, is responsible for much of the lung’s elastic recoil. The strong attractive forces between molecules in the liquid phase maintain the size of the air–liquid interface at the smallest possible area. As a result, each alveolus has a spherical liquid lining layer that is pulled inward toward the center of curvature of the alveolus. Because this surface force acts like an “elastic tension,” a greater pressure is required to expand the alveolus than would be necessary if the alveolar liquid lining layer were not present.
Physiological importance of surfactant—Surface tension is kept at an optimal level because of a chemical called surfactant, which is synthesized by alveolar type II cells and secreted in the alveolar lining fluid.2 Its production is stimulated by the stretch of alveolar epithelium that occurs with a change in lung volume. If one breathes at a constant small VT for a long period of time, surfactant will not be produced and the lung will become less and less compliant, requiring more work to expand. Surprisingly, a single large inspiration that occurs periodically (eg, a sigh or a yawn) is sufficient to restore the normal surfactant layer and thereby keep compliance normal and alveoli open (surfactant also reduces the tendency for alveolar collapse [atelectasis] at low lung volumes).
In the fetal lung, surfactant production begins at between 28 and 32 weeks of gestation. In preterm infants born prior to this time, absence of surfactant results in low-compliance, difficult-to-inflate lungs and areas of atelectasis. These babies are hypoxemic and the work of breathing is greatly increased. Prior to 1980 this respiratory distress syndrome in the newborn was responsible for a significant fraction of infant mortality in the United States. In recent years, surfactant replacement therapy has contributed to a dramatic fall in mortality of preterm infants.
Interaction Between Lung and Chest Wall
The functional “chest wall” includes the rib cage, diaphragm, and abdominal wall. The chest wall components must work together to move the lung and to produce a breath.
Figure 5-10 (left) shows the elastic forces that act on the lung and chest wall to determine lung volume at the end of a normal expiration, defined as “relaxation volume” (or FRC). Under these static conditions, there is an equal tendency for the chest to increase in volume (spring out) as there is for the lung to decrease in volume (recoil inward). Thus, at FRC the chest wall opposes lung collapse.
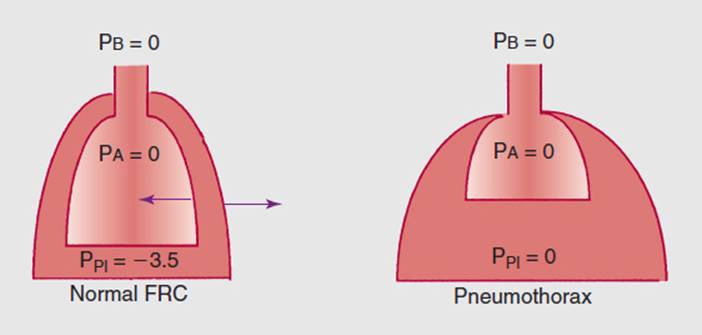
FIGURE 5-10 In a normal lung at functional residual capacity (FRC) (left), the tendency of the lung to recoil inward is exactly balanced by the tendency of the chest to expand outward. This causes pleural pressure (Ppl) to be subatmospheric. Pneumothorax (right) removes the lung–chest wall couple and allows the lung to collapse, the chest to spring out, and Ppl to go to zero. PA, alveolar pressure; PB, body surface (atmospheric) pressure.
The critical importance of this coupling of lung and chest wall forces is illustrated in Fig. 5-10 (right), which shows the effect of breaking the liquid seal between the parietal and visceral pleura. Pneumothorax occurs when the chest wall is punctured, allowing air to enter the pleural space. Under these conditions the lung shrinks down to its resting (minimal) volume while the chest wall expands to its resting (maximal) volume.
Volume-Related Changes in Recoil Pressures of Lung and Chest Wall
Transmural pressures of the lung/chest wall system vary throughout the respiratory cycle. Beginning at FRC, inspiration occurs when active muscle force is applied to the relaxed chest wall. The outward force of inspiratory muscle contraction, added to the normal recoil of the chest wall, decreases alveolar pressure so that it is negative with respect to atmospheric pressure. When the glottis is open, air flows down the pressure gradient from atmosphere to alveoli, causing an increase in lung volume. Flow continues to increase lung volume until the recoil force of the lung offsets the sum of the muscle force and recoil force of the chest wall, resulting in an alveolar pressure of zero (relative to atmospheric pressure).
Expiration is initiated when the inspiratory muscles relax and eliminate the outward muscle force, thereby allowing passive relaxation of the respiratory system back toward FRC. The positive recoil pressure of the lung then results in reduced alveolar volume and an alveolar pressure that exceeds atmospheric pressure, causing expiratory airflow. Expiration continues until lung volume is reduced to FRC, where the recoil pressures of the respiratory system are again balanced at zero.
Resistance to Airflow
Thus far, mechanical factors that influence the elastic work of breathing have been discussed. Now, the additional force that must be applied to cause air to flow into the lung (ie, the pressure required to overcome frictional resistance to airflow) will be outlined.
Poiseuille’s Law has been used to describe airflow through the airway tree. Accordingly,

By rearranging this equation,

Airway resistance is usually expressed in centimeters of water pressure per liter per second of airflow. The factors affecting airway resistance, which are analogous to the factors affecting resistance to blood flow in the cardiovascular system, can be described by the equation:
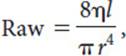
where η = viscosity of gas, l = length of the tube, and r = radius of the tube. Clearly, the radius of the airway is the major determinant of airway resistance. Because the radius term is raised to the fourth power, even very small changes in radius greatly affect airway resistance.
Sites of Airway Resistance
Normally, 70% to 80% of the total airway resistance is provided by the large airways (>2 mm diameter).2 Resistance in the smaller airways is very low because flow is laminar, not turbulent, at that level. In addition, the airways distal to the terminal bronchioles branch in such a manner that the radius of successive branches remains nearly constant. The total cross-sectional area of the smallest airways exceeds that of the “parent” airway; therefore, the resistance of the distal airways is very low even though the individual radii are very small.
Factors Affecting Airway Caliber
Airways are distensible, collapsible tubes whose radii are determined by neural, chemical, and mechanical factors. Caliber of the extrathoracic upper airway is regulated mainly by tonic and phasic activation of many pairs of skeletal muscles and also by the degree of local vascular engorgement. In the intralobar airways, contraction and relaxation of bronchial smooth muscle cells regulate caliber. Bronchial smooth muscle is under autonomic nervous system control; increases in parasympathetic outflow cause bronchoconstriction, whereas sympathetic stimulation causes bronchodilation. In the clinical setting, inflammation of the airway epithelium is a major cause of increased airway resistance. The vascular engorgement and excessive secretion production that accompany inflammation can cause narrowing of the airway lumen. In addition, locally released chemical mediators (eg, histamine) can reduce airway caliber by triggering smooth muscle contraction.
Airway Resistance During Inspiration Versus Expiration
Caliber of the intrathoracic airways is also affected by a mechanical factor (ie, transmural pressure across the airway wall). When the pressure surrounding the outside of the airway (PA) is more negative than airway pressure (Paw), airway radius increases. Conversely, when PA is positive relative to Paw, airway radius decreases. These within-breath fluctuations in transmural pressure and airway radius are responsible for the characteristic shape of the flow–volume loop (Fig. 5-11).

Figure 5-11 Flow–volume loops (inspiration down, expiration up). In curve A, maximal inspiration was followed by a maximum forced expiration. In B, both inspiration and expiration were submaximal. In C, inspiratory effort was even less than in B, and expiration was initially slow and then forced. In all three cases, the descending portions of the expiratory curves are almost superimposed on each other.
The relationship between respiratory flow rate and lung volume is represented as an X–Y plot in Fig. 5-11. Note the flow–volume relationship for inspiration has a different shape from that for expiration. Although flow rate remains relatively constant throughout a maximal inspiration to TLC, a maximal expiratory effort from TLC causes flow rate to rise rapidly to a peak and then to decline as lung volume falls over most of the remaining forced expiration. A remarkable feature of this maximal flow–volume envelope is that it is virtually impossible to penetrate it, regardless of how forcefully one exhales. Even if the individual exerts huge expiratory efforts with their accompanying increases in intrathoracic pressure, the descending portion of the flow–volume curve takes virtually the same path.
The reason for this remarkable behavior is “dynamic” compression of the airways caused by positive intrathoracic pressure. During forced expiration, the positive pressure in the pleural space acts not only on the alveoli but also on the outside of the airway walls, thereby promoting airway compression. Figure 5-11 shows that the maximum flow rate during forced expiration is effort-independent; more forceful expiratory efforts do not result in greater airflow.
Gas Transport by the Blood
O2 consumption by tissue requires O2 delivery, which is determined by the product of cardiac output and the O2 content in each unit of blood, and O2 extraction by the tissue (ie, the difference in O2 content between incoming arterial blood and the outgoing venous blood). These relationships are defined by the Fick equation2:
O2 = Cardiac output × (arteriovenous O2 content difference).
Loading and Unloading of O2
The blood carries O2 in two forms: dissolved in plasma and bound to hemoglobin (Hb). Oxygen dissolves in plasma in proportion to its solubility constant and to the oxygen concentration in the gas phase with which it comes in contact. The solubility of O2 in plasma is 0.003 mL/100 mL/mm Hg PAO2. Therefore, if PAO2 is 100 mm Hg, 0.3 mL of O2 will be dissolved in each 100 mL of plasma. Note that this amount of O2 content is only one-sixth of that required, at a normal cardiac output, to supply even basal metabolic requirements. Thus, Hb is absolutely necessary to supply metabolizing tissue with the O 2it requires.
Association and Dissociation of Hb with O2
Each molecule of Hb contains four iron-porphyrin heme groups, each of which can bind one molecule of O2. Oxygen binding to Hb is proportional to the PO2 of the blood; however, because of interaction among heme groups within each hemoglobin molecule, the binding is not linear. As each O2 molecule binds to Hb, it increases the affinity of the remaining heme sites for additional O2 molecules. The relationship between binding of oxygen and PO2 is shown in Fig. 5-2, where it is assumed that the pH is 7.4 and the temperature is 37°C.2
The upper portion of the curve represents arterial blood after it leaves the lung. Usually, the lower, steeper part of the curve represents systemic tissue capillary blood or venous blood. Note that at PO2 above approximately 80 mm Hg, the saturation changes little; however, at PO2 below approximately 50 mm Hg, the saturation drops more steeply.
Memorization of a few key points on the curve provides the clinician with immediate insight into how seriously systemic O2 transport is threatened by varying levels of arterial hypoxemia. The points to remember are
•the normal values for mixed venous blood (75% saturation and 40 mm Hg PO2);
•the normal values for arterial blood (97% saturation and 90–95 mm Hg PO2);
•the “shoulder” of the curve where saturation (and content) begin to fall precipitously (90% saturation and 55–65 mm Hg PO2).
Calculation of O2 Content of Whole Blood
Oxygen content of whole blood can be calculated if the PAO2 and the Hb concentration are known.
•First, determine the oxygen-carrying capacity (HbCC) of fully saturated Hb, which varies directly with the Hb concentration:
HbCC = Hb (g/100 mL) × 1.39 mL O2/g Hb.
Note that 1.39 mL O2/g Hb is a fixed value for all normal hemoglobin. In normal circumstances (15 g Hb):
HbCC = 15 × 1.39 = 20.9 mL O2/100 mL.
•Second, determine the percentage of HbO2 saturation, given the PAO2. The HbO2 dissociation curve (Fig. 5-2) must be consulted to obtain this value. HbO2 content can then be calculated according to the following formula:
HbO2 content = HbCC × % HbO2 saturation.
For normal arterial blood, at Pao2 = 90 mm Hg,
HbO2 content = 20.9 × 97% = 20.2 mL O2/100 mL.
•Third, to calculate the whole blood O2 content, the amount of O2 dissolved in plasma must be added to the HbO2 content. The plasma O2 content is the product of PAO2 and the solubility constant (0.003 mL O2/100 mL/mm Hg). Thus, in normal circumstances,
plasma O2 content = 90 mm Hg × 0.003 = 0.27 mL O2/100 mL.
The whole blood O2 content can then be calculated as follows:
whole blood O2 content = (HbCC × %HbO2saturation) + (plasma O2 content).
So, for the normal example in arterial blood,
whole blood O2 content = (20.9 × 97) + (0.27) = 20.5 mL O2/100 mL.
Shape of the HbO2 Dissociation Curve
The sigmoid shape of the HbO2 dissociation curve has many physiological advantages—all geared toward delivery of O2 in sufficient amounts to maximize the capillary to tissue diffusion gradient and thereby ensure tissue oxygenation.2 For example, in Fig. 5-2, contrast the loss of O2 content along the flatter versus the steeper portions of the dissociation curve. Along the upper part of the curve, lung function must fail substantially (ie, PAO2 must fall more than 30 mm Hg) before O 2saturation, O2 content, and therefore systemic O2 transport are significantly reduced. In contrast, at the steeper portion of the curve, Hb binds O2 less tightly, which means that as the Hb loses O2 by diffusion to the metabolizing tissue from beginning to end of the tissue capillary, the PO2 falls much less (than on the flatter portion of the curve).
Unloading O2 at the tissue occurs at a rate demanded by tissue mitochondria. This unloading of O2 from Hb occurs in the arterioles and capillaries. Passive diffusion of O2 is the primary process by which O2moves from blood to tissue. In skeletal muscle, myoglobin may facilitate the diffusion process.
Position of the HbO2 Dissociation Curve
The following conditions shift the HbO2 dissociation curve to the right: increased temperature, carbon dioxide concentration, and hydrogen ion concentration (decreased pH). Changes in these variables in the opposite direction shift the curve to the left.2
Shifts in the HbO2 dissociation curve can facilitate or impede oxygen delivery to tissue, especially during periods of increased metabolic activity. For example, exercising muscle generates heat, CO2, and acidic metabolites, all shifting the HbO2 dissociation curve to the right. Thus, in normal circumstances during exercise, Hb unloads O2 at the muscle at higher capillary PO2 than it does when the dissociation curve is not right-shifted. As a result, the gradient for O2 diffusion from blood to tissue is increased and O2 delivery is improved.
Leftward shifts in the HbO2 dissociation curve also occur. For example, humans hyperventilate at high altitudes, causing pH to increase. Also, fetal hemoglobin has an increased O 2affinity at any given PO2. Leftward shifts are beneficial under these conditions of O2 deficiency.
Carriage of CO2
Resting metabolism results in the production of approximately 200 mL CO2/min in a 70-kg adult. It is important for the body to dispose of this promptly because CO2 combines spontaneously with the water in plasma to produce carbonic acid. Thus, the resting CO2 would produce approximately 13 mol of H+ in a 24-hour period, which is an enormous acid load. Therefore, CO2 must be continuously removed from the body via the lungs.
CO2 is transported to the lungs by the venous blood in three forms: dissolved in plasma, bound to plasma proteins and hemoglobin, and as bicarbonate (HCO3–).2 The first two forms each account for only approximately 5% to 10% of the total CO2 carried, whereas the third form accounts for approximately 90% of all CO2 carried in the blood.
The first step in CO2 transport is the spontaneous hydration of CO2 to carbonic acid (H2CO3) by the reaction:
CO2 + H2O ↔ H2CO3 ↔ HCO3- + H+.
This reaction occurs mainly within red blood cells, where it is catalyzed by carbonic anhydrase. The second step in this process, the ionic dissociation of carbonic acid to H+ and HCO3 is rapid, not requiring a catalyst. As concentrations of the ions rise, HCO3– diffuses out of the red cell but H+ cannot do this because the cell membrane is relatively impermeable to cations. Thus, in order to maintain electrical neutrality, Cl– ions diffuse into the cell from the plasma. Some of the hydrogen ions are removed from the solution by combining chemically with the large amount of hemoglobin present within the red cell and to a lesser extent with the plasma proteins. This “buffering” effect of Hb contributes importantly to pH regulation, especially in venous blood where the deoxygenated Hb has a greater ability to buffer H+than does oxygenated Hb.
These reactions occur within the circulation of metabolizing tissue and account for the addition of CO2 to venous blood. When the venous blood returns to the lung, the entire process is reversed. CO2 diffuses from red cells through plasma and into alveolar gas where the CO2 concentration is lower. There is a net shift of bicarbonate into the red cell, which is converted to CO2 and a net shift of chloride out.
Pulmonary Gas Exchange
Arterial hypoxemia, (ie, a reduction in PAO2 below normal) can be caused by alveolar hypoventilation (which reduces PAO2) or by widening the difference between alveolar and arterial PO2. In humans, the alveolar to arterial PO2difference is governed primarily by the uniformity of ventilation () to perfusion ( ) distribution (
 ) ratio.2 Alveolar to capillary diffusion disequilibrium may also play a small role in special circumstances.
Distribution of Ventilation and Perfusion: Ventilation Distribution
Interregional factors are the most important determinants of ventilation distribution in healthy individuals. In a normal, upright lung, inspired ventilation is distributed more toward the lung bases than toward the lung apex.2 This occurs because alveoli at the top of the lung are more expanded than those at the bottom, mainly because the weight of the lung below pulls down on them and distends them. Because the lung is less stiff at low lung volumes, the less distended lower regions of the lung are easier to expand (and therefore, to ventilate) than the more distended regions in the upper portions of the lung. Thus, because of gravity, approximately two times as much inspired ventilation is delivered to the bottom versus the top regions of the upright lung. In contrast, intraregional nonuniformities in ventilation distribution are the major cause of mismatch and arterial hypoxemia in individuals with lung disease. These nonuniformities are caused by variations in resistance and compliance in different regions of the lung. Thus, a unit with narrowed airways and increased resistance will take longer to fill with air during inspiration. Even at normal breathing frequencies, inspiratory time (TI) may not be sufficient for every terminal respiratory unit to achieve the same volume expansion during inspiration. Nonuniformity of ventilation distribution can result from alterations in local distensibility or resistance to airflow. The magnitude of the nonuniformity in these expanding units during inspiration will depend on the breathing frequency, that is, the time available for filling.
Distribution of Ventilation and Perfusion: Perfusion Distribution
Blood flow distribution in the upright lung is (like inspired ventilation) directed primarily to the lung bases, which receive five times more flow than the apices. Blood flow distribution in the low-resistance pulmonary circulation is primarily under passive (ie, nonneural) control; thus, this interregional effect is purely due to gravity.2 Given that the pulmonary artery pressure is relatively low (15 mm Hg), there is an insufficient pressure head to push blood up to the top of the upright lung throughout the entire cardiac cycle. Therefore, blood flow at the apices will be reduced (with respect to the bases), especially during diastole.
When cardiac output increases during exercise, the pulmonary circulation accommodates the increased blood flow by recruiting and distending capillaries, and as a result there is a substantial reduction in pulmonary vascular resistance. Thus, interregional blood flow during exercise is much more evenly distributed among lung regions than it is at rest.
Even in the healthy lung, not all maldistribution of perfusion is due to gravity. A likely source of within-region perfusion nonuniformity is simply the random structural differences in the diameter, length, and branching angles of the vessels. In disease states, structural heterogeneity of vessel and airway caliber is the major cause of maldistribution.
Hypoxia-induced pulmonary vasoconstriction is a local mechanism that provides an extremely effective and “low cost” means of causing a more uniform distribution of perfusion to ventilation, thereby preventing arterial hypoxemia. Hypoxic vasoconstriction is most effective when the involved area of the lung is relatively small (ie, <20% of total lung mass). In such circumstances, blood flow can be redistributed without large effects on pulmonary vascular resistance. In contrast, if all or a majority of the lung is made hypoxic (eg, global alveolar hypoventilation, high altitudes), the resultant widespread vasoconstriction will cause pulmonary vascular resistance to rise markedly. If global hypoxia is sustained, hypertrophy of the pulmonary artery smooth muscle and chronic pulmonary hypertension will occur. Under conditions of chronic, global hypoxia, hypoxic vasoconstriction is of little or no help in maintaining alveolar to arterial O2 exchange because all areas of the lung are hypoxic; that is, there are no well-oxygenated areas available for perfusion.

FIGURE 5-12 Effect of altering the ventilation-perfusion ratio on PO2 and PCO2 in a lung unit. Note that mixed venous blood has a PCO2 = 45 and a PO2 = 40 mm Hg in all three units.
Importance of Ratio
Figure 5-12 demonstrates how altering the ratio of a lung unit affects its gas exchange.2 Three lung units (A, B, and C) are shown, all with inspired tracheal PO2 = 150 mm Hg and PCO2 = 0 mm Hg. The mixed venous blood entering each of the units has a PO2 = 40 mm Hg and PCO2 = 45 mm Hg. Lung unit A has a normal of nearly 1.0. In this unit, PAO2 is determined by the balance between addition of O2by ventilation and its removal by blood flow. PACO2 is determined in an analogous manner. In lung unit B,  is reduced by blocking its ventilation while leaving its blood flow intact. It is clear that the PAO2in the unit will fall and PACO2 will rise so that eventually the PO2 and PCO2 in the alveolar gas and end-capillary blood are the same as that of mixed venous blood. In lung unit C, is increased by obstructing its blood flow. Now the alveolar O2 rises and CO2 falls, eventually reaching the composition of tracheal inspired gas.
Effect of Inequality on Gas Exchange
The reason the lung with uneven has difficulty oxygenating arterial blood is illustrated for the upright lung in Fig. 5-13.2 Here, PAO2 at the apex is 40 mm Hg greater than at the base. At the same time, the major share of blood flow leaving the lung comes from the lower areas where PAO2 is the lowest. This combination of greatest flow and lowest PO2 has the effect of depressing the PO2 in the mixed arterial blood out-flow. In contrast, the expired alveolar gas comes more uniformly from the apex and base because the between-region differences in ventilation are much less than those for blood flow. The result is that the mean alveolar PO2 is approximately 101 mm Hg and the arterial blood PO2 is 97 mm Hg; the 4 mm Hg difference between alveolar and arterial O2 is due to nonuniformities.

FIGURE 5-13 Depression of PAO2 by ventilation–perfusion inequality. In this diagram of the upright lung, only two groups of alveoli at the apex and base are shown. The relative sizes of the airways and blood vessels indicate their relative ventilations and blood flows. Because most of the blood comes from the poorly oxygenated base, depression of the PAO2 is inevitable.
Another reason for mean PAO2 to be less than mean PAO2 is that not all of the mixed venous blood is exposed to alveolar gas for oxygenation. One to two percent of the total cardiac output bypasses the alveolar capillaries and directly enters the left ventricle, some via the bronchial airway circulation and some via the intracardiac thebesian veins. This small amount of “anatomical shunt” of blood with mixed venous O2 composition also reduces the PAO2and widens the alveolar to arterial PO2 difference to approximately 10 mm Hg.
In disease states, maldistribution can have devastating effects on arterial blood gases. Wasted ventilation occurs clinically when a large blood clot (pulmonary embolism) obstructs a pulmonary artery. Immediately after the occlusion, all perfusion is diverted to the unaffected lung, but half of the ventilation still goes to the affected lung. Clearly, the ventilation to the affected lung is wasted because it is ineffective in oxygenating any of the mixed venous blood. This wasted ventilation greatly increases the alveolar dead-space ventilation. In addition, the overall efficiency of lung ventilation is decreased, because more than half the power used in breathing moves air that serves no useful purpose.
Shunt refers to a communication between two parts of the cardiovascular system that allows passage of blood from the venous to the arterial circulation without participating in gas exchange. Shunt occurs in the lung when there is a substantial and selective airway obstruction (eg, aspiration of a foreign body into a main stem bronchus or airway disease causing obstruction of a specific area of the lung). In this circumstance, a significant fraction of the pulmonary blood flow does not participate in gas exchange. The effect on PAO2 is substantial.
Alveolar–Capillary Diffusion
Fick’s law states that the rate of transfer of a gas through a sheet of tissue is proportional to the tissue area and to the difference in gas partial pressure between the two sides, and inversely proportional to the tissue thickness. The large area of the blood–gas barrier in the lung (50–100 m2) and its thinness (<1/2 m) make it an ideal surface for diffusion.
The blood entering the pulmonary capillary normally has a PO2 of approximately 40 mm Hg (ie, that of mixed venous blood). Across the blood–gas barrier, less than a micrometer away, is the alveolar gas with its PO2 of 100 mm Hg. Oxygen moves down this large pressure gradient, and PO2 in the blood rises so rapidly that it very nearly reaches equilibrium with PAO2 in the time it takes for a red cell to traverse one-third of the capillary length. Thus, in normal circumstances, the difference in PO2 between alveolar gas and end-capillary blood is immeasurably small (ie, a mere fraction of a millimeter of mercury).
The average transit time of a red cell through the pulmonary capillary bed, as through any vascular bed, is determined by the ratio of the size of the capillary bed (ie, the “sink,” divided by the rate of blood flow into the capillary bed):

The pulmonary capillary blood volume consists of the “sheet” of blood contained in the alveolar walls and exposed to alveolar gas. It averages 80 mL in the resting human. Pulmonary blood flow consists of the entire cardiac output; therefore,

This is clearly sufficient time for equilibration of mixed venous and alveolar PO2. During heavy exercise, however, blood flow increases to approximately four times the resting level. If the pulmonary capillary bed were not capable of expanding as pulmonary blood flow increased, then

This might not be sufficient time to reach full equilibrium of mixed venous and alveolar PO2. In normal circumstances, however, this failure to equilibrate does not occur because the low-resistance pulmonary vasculature is capable of expanding its capillary blood volume during exercise to its maximum morphologic capacity (200–250 mL, or three times the resting value) by recruiting more capillaries. So,

Thus, during exercise, marked reductions in transit time are prevented, and sufficient time is provided for diffusion equilibrium.
Neurochemical Regulation of Breathing
A complex control system is responsible for regulating ventilation so that (1) alveolar gases are precisely regulated to meet tissue needs for O2 and CO2; (2) ventilatory movements are integrated with other body movements, such as speech, coughing, chewing and swallowing, and posture and locomotion; and (3) the energy required to provide the needed ventilation is not excessive. A related critical need is that ventilation must remain, as much as possible, an involuntary act of which we are unaware. A schematic of the respiratory control system and its components is shown in Fig. 5-14.8

FIGURE 5-14 Schematic representation of major components of the ventilatory control system: the central oscillator and pattern generator, the sensory inputs, and the distribution of respiratory motor output to the thoracic pump muscles and the airways.
Central Integration and Rhythm Generation
Contraction of the respiratory muscles produces the tidal flow of gas within the pulmonary system. Rhythmic phrenic nerve activity emerging from the central nervous system (CNS) is the source of diaphragmatic electrical activity. Without input from the CNS, normal ventilation ceases. Note that this occurs in marked contrast to the cardiovascular system, where the heart can contract and pump blood, even when isolated from the CNS.
Location of Respiratory Neurons
The breathing controller is located in the pons and medulla, portions of the brain that are continuous with the spinal cord. These regions of the brainstem also contain the cardiovascular (vasomotor) centers, and it is at this level that cranial nerves IX through XII, which contain most of the sensory information about breathing, enter the CNS.
Groups of neurons in the dorsal and ventral portions of the medulla show activity that is synchronous with inspiration and expiration. The inherent rhythm of these neurons activates the bulbospinal, premotor neurons in the medulla that integrate the basic rhythm with other inputs from sensory and higher centers. The premotor neurons, in turn, relay the neural signals to β-motoneurons in the spinal cord, resulting in rhythmic breathing. The external inputs to the medullary respiratory controller from the pons and peripheral sensors influence the speed of the respiratory cycle (ie, breathing frequency) and the strength of the respiratory muscle output (tidal volume).
Descending Pathways to Respiratory Muscles
The main “pump” muscles of respiration—the diaphragm, intercostals, and abdominal muscles—are rhythmically activated by spinal β-motoneurons. In humans, phrenic motoneurons occupy a column lying in the third through fifth cervical segments. The β-motoneurons that innervate the internal and external intercostals occupy motor columns that extend the entire length of the thoracic spinal cord. The abdominal muscles, which have an expiratory function, have β-motoneurons occupying the lower thoracic and upper lumbar spinal cord segments.
The pharyngeal and laryngeal “respiratory” muscles are activated by the motoneurons of cranial nerves IX through XII. Activity in these nerves precedes phrenic activity; thus, its function is to prepare (ie, dilate and stiffen) the upper airway prior to each inspiration.
Neural pathways that exert voluntary control over breathing are important for speaking, singing, and breath-holding. These corticospinal pathways bypass, in a large part, the medullary respiratory network.
Afferent Inputs
Sensory inputs to the medullary integrator neurons are essential for generating a breath that is large enough to affect pulmonary gas exchange. These inputs act primarily as feedback regulators.
Chemoreceptors—Mammals have two types of chemoreceptors: One set peripherally located and affected by arterial blood composition and the other in the medulla, bathed by the brain interstitial fluid.8
The carotid bodies, located bilaterally at the bifurcations of the common carotid arteries, sense changes in PO2, PCO2, and pH of the arterial blood. Sensory information is carried from the carotid chemoreceptors to the brainstem medullary neurons via cranial nerve IX. This mechanism augments respiratory muscle activity in response to hypoxia-induced carotid chemoreceptor stimulation (Fig. 5-15). Note that the ventilatory response to hypoxia is curvilinear; at normal PACO2 the response becomes quite brisk at 60 mm Hg PAO2. This PAO2 corresponds to the “shoulder” of the HbO2 dissociation curve, below which O2 saturation drops severely and tissue hypoxia probably occurs. Note also that decreased PO2 and increased PCO2 both stimulate ventilation via the carotid body and that, when applied together (ie, “asphyxia”), they have a multiplicative effect on ventilatory output. The carotid chemoreceptors also respond briskly to other perturbations, especially metabolism-induced changes in pH (ie, acidosis or alkalosis).

FIGURE 5-15 Effects of hypoxia on minute ventilation. As PAO2 is reduced (by gradually reducing inspired PO2), ventilation increases in a hyperbolic fashion and this effect of hypoxia is enhanced by increasing PACO2. Thus, in the lowest response curve arterial, PCO2 is maintained at 35 mm Hg and at the highest curve at 55 mm Hg (by adding CO2 to inspired gas as the PO2 is reduced).
Although the medullary chemoreceptors have not yet been isolated anatomically, they are believed to lie on the ventrolateral surface of the medulla. The medullary chemoreceptors are very sensitive to changes in the pH of brain interstitial fluid, especially when the pH change is caused by an increase or a decrease in PCO2. Note that the chemical environment of the medullary chemoreceptors has a closely regulated ionic composition. This regulation is due, in part, to the selective permeability of the cerebral blood vessels (ie, the blood–brain barrier). Because of the blood–brain barrier, metabolic acids and bases in the plasma enter the brain interstitial fluid very slowly. In contrast, CO2crosses readily and alters the pH of the interstitial fluid very quickly and substantially (it is a poorly buffered fluid because of its low protein content).
The ventilatory response to increased CO2 in the arterial blood and the brain is due to stimulation of both the peripheral carotid chemoreceptors and the central medullary chemoreceptors. If PCO2 is reduced to below normal levels (hypocapnia), chemoreceptor activity will be reduced and ventilation will be decreased. This inhibitory effect of hypocapnia on ventilation is a common cause of apnea during sleep.
Sensory inputs related to locomotion and changing metabolic rate—At the onset of muscular exercise, ventilation increases immediately. With each increment in exercise intensity, ventilation increases in proportion to the changing O2 and CO2 so that PACO2 and PAO2 are tightly controlled near resting levels. It is only with very heavy exercise that ventilation increases out of proportion to CO2, and as a result, PACO2 falls.9
What can account for this very fast ventilatory response at exercise onset and the near-perfect match of ventilation to metabolic rate required during steady-state exercise? Because chemoreceptors see no change or “error signal” (in arterial PCO2, PO2, or pH), these chemical factors cannot play a major role in stimulating ventilation. Instead, at least two types of stimuli and receptors are probably involved.
Neurons located in the motor areas of the higher CNS perform the dual roles of (1) initiating movement by means of neural impulses reaching the spinal cord via corticospinal tracts and (2) simultaneously stimulating medullary respiratory neurons via direct corticomedullary pathways. This means that stimulating breathing during exercise is considered a feedforward mechanism because ventilation is increased without knowledge of feedback from the periphery.
Receptors in limb skeletal muscles are responsive to tension, stretch, and metabolic stimuli such as changes in pH and potassium. These receptors are activated by muscle contraction and, in turn, exert a positive feedback influence on the ventilatory response via afferent pathways in the spinal cord. This influence explains at least a portion of the increase in ventilation during muscular exercise.
Metabolic rate (CO2 production, in particular) influences breathing so that A tracks changes in tissue CO2 production. As a result, the average PACO2 is tightly regulated within narrow limits. For example, increased carbohydrate ingestion (which increases CO2 and the respiratory exchange ratio), changes in body mass, hypo- and hyperthyroidism, and renal dialysis all alter the amount of tissue CO2 production and all also cause corresponding changes in A. The exact nature of the stimulus and location of receptor sites responsible for this coupling of A to CO2 in the resting subject remain unknown.
Mechanical feedback—Whereas most of the sensors mentioned previously are concerned with providing adequate A, receptors in the chest wall and lung are concerned with “how” we take individual breaths, that is, with the optimization of the mechanical work. As discussed previously, mechanical impedances offered by the lung and airways must be overcome by the respiratory muscles in order to produce volume expansion of the lungs and gas flow through the airways. To keep respiratory muscle work to a minimum, receptors in the muscles are sensitive to their own rate and magnitude of tension development and relay this activity to the medulla via the spinal cord or phrenic nerve afferents.10 Receptors in the lung and airways also sense the rate and magnitude of lung stretch. This input, which is relayed to the medulla via the vagus nerves, has substantial effects on the breathing pattern.
The pulmonary stretch receptors affect breathing pattern—During inspiration, vagal afferent fibers from the pulmonary stretch receptors (PSRs) fire in proportion to lung volume, thereby inhibiting medullary inspiratory neurons, so that expiration can begin. Thus, vagal feedback is an important inhibitory “off-switch” to determine breathing pattern; however, it is not the only mechanism available to terminate inspiration. Pontine neurons also signal medullary neurons to make the switch from inspiration to expiration.
In adult humans, PSRs seem to be less sensitive than those in other mammals; that is, the lung volume at which PSRs exert their inhibitory effect is much higher. Thus, PSRs play little role during normal tidal ventilation in the human at rest, but become important during exercise to ensure that VT is constrained to the linear and more compliant part of the pressure–volume relationship for the respiratory system.
Many other types of lung mechanoreceptors, present in the airways and lung parenchyma, affect a wide variety of respiratory responses. Other receptors served by the vagus nerves include the irritant receptors that are stimulated by inhaled chemicals and particulates and by changes in bronchiolar smooth muscle tone. Stimulation of these receptors elicits cough and bronchoconstriction. They also respond to airway narrowing or closure and, accordingly, they are responsible for the augmented inspirations or “sighs” which we take periodically to maintain patent airways. In addition, J-receptors located in the lung parenchyma have afferent fibers that travel in the vagus nerves. These fibers elicit tachypnea (rapid, shallow breathing) when stimulated by increased interstitial fluid pressure (eg, in pulmonary edema).
Chest wall proprioceptors play an important role in “load compensation.” Like all skeletal muscles, the respiratory muscles of the chest wall develop forces that depend on their starting length (preload) and their afterload. Preload varies with body posture and afterload is a function of the magnitude of lung and chest wall expansion and the resistance to airflow. Receptors in the chest wall reflexively modify motor nerve discharge to the respiratory muscles in such a manner that ventilation changes are minimized, despite varying preloads and afterloads.
Phrenic afferents—When the diaphragm is overworked to the point of showing signs of fatigue, end products of metabolism such as lactic acid and hydrogen and potassium ions begin to accumulate in the muscle’s interstitial space. These metabolites activate muscle receptors with small, unmyelinated phrenic afferents, and as a result, phrenic efferent activity is inhibited. As a result, the diaphragm no longer works at the same high level and further fatigue is avoided.
Distribution of efferent outputs—As mentioned previously, many different respiratory muscles are important to taking a breath. By distributing motor output to the various muscles, the medullary controller coordinates their actions very precisely.
Inspiration is accomplished primarily by phrenic activation and diaphragmatic contraction, but intercostal muscles also play a major role, especially if the level of ventilation is increased. Thus, the “load” is shared and the diaphragm is spared. Activation of intercostal muscles also helps (along with the rib cage) to stiffen the chest wall. This allows the diaphragm to contract and create a negative pleural presence without inward movement of the thoracic wall. In some pathological conditions (eg, obstructive lung disease), the diaphragm is shortened and flattened because of hyperinflation and therefore must work from a mechanical disadvantage. In these cases, accessory muscles of respiration, such as the scalenes and sternocleidomastoids, assist with inspiration by lifting the rib cage.
The greatest and most variable site of resistance to airflow is the upper extrathoracic airway. The calibers of the pharynx and larynx are controlled by abductor muscles innervated by hypoglossal motor nerves that originate from the medulla in close proximity to the respiratory controller neurons. This arrangement means that just prior to the activation of the chest wall inspiratory muscles, the airway is stiffened and the orifice diameter increased. Like the chest wall, these respiratory muscles of the upper airway are under both feedforward and feedback control. For example, during exercise the pharyngeal and laryngeal orifices are fully abducted during both inspiration and expiration, beginning with the first augmented breath (probably a feedforward mechanism). If upper airway narrowing occurs during sleep, increased negative pressure in the airway triggers a reflex activation of upper airway dilator muscles, so that further collapse is prevented (a feedback mechanism).
Conscious Perception of Breathing Effort: Dyspnea
Muscle spindle afferents originating in the chest wall and vagal afferents from the lung, project to the cerebellum and cerebral cortex, as well as to the medulla. Furthermore, medullary inspiratory and expiratory neurons also project to the higher CNS. It is likely that such connections form the anatomical pathways by which feedback from respiratory movements and loads and even chemoreceptor stimuli are perceived consciously.
In normal circumstances, sensory inputs to the brain from the pulmonary system do not enter the individual’s awareness, even when VT and force production increase substantially (eg, during moderate exercise). In contrast, an unpleasant perception of breathing, dyspnea, seems to arise when either the drive to breathe is excessive or a mechanical impediment to ventilation exists. Increased drive occurs when the medullary respiratory neurons are bombarded with feedback inputs from chemoreceptors or from feedforward inputs from the motor cortex. Mechanical impediments to breathing occur with airway obstruction or restriction of lung volume. Dyspnea is most likely to occur when there is a discrepancy between the neural drive to breathe and the level of ventilation achieved.11
Control of Breathing in the Newborn
The transition from placental gas exchange during intrauterine life to air breathing brings with it multiple, rapid changes in the newborn’s pulmonary system.12 Consider, for example, that functional alveoli multiply at a rate of approximately 200 per minute over the first year of life, that thousands of neural synapses turn over each day in the CNS, and that the PAO2 almost doubles within the first few breaths of postnatal life. Thus, all feedback and feedforward systems in the ventilatory control system are affected by birth and maturation, in addition to concomitant changes in the mechanical characteristics of the lung and chest wall. The following events are known to occur with maturation in the infant.
•The carotid bodies appear to be more vital for maintaining adequate ventilation in the newborn, as shown by the marked apneas and significant mortality caused by carotid body denervation at birth. Carotid sinus nerve activity has been shown to be significant in the fetal animal and the carotid body response to hypoxia increases over the first few weeks of life.
•Mechanoreceptor feedback from lung stretch and upper airway narrowing are much stronger in newborn than adult humans. Brief apneas and periodicities in breathing pattern are common in the first weeks of life, as are frequent augmented inspirations (or sighs)—the latter serving to homogenize the distribution of ventilation and to increase surfactant production during the transition to air breathing. Brief apneas are accompanied by profound brachycardia in the newborn, signifying a powerful diving reflex.
•The infant’s ribs are cartilaginous and extend at near right angles (rather than obliquely as in the adult) from the vertebral column, thereby providing a more circular ribcage shape. The area of apposition of the diaphragm on the ribs is also very small and the diaphragm is relatively flat. Thus, the rib cage expands slightly on inspiration and the diaphragm is mechanically disadvantaged.
•The relative compliances of the rib cage and lungs in the newborn means that passive FRC is reduced to approximately 10% of TLC (rather than 50% as in the adult). Accordingly, in order to preserve an adequate end-expiratory lung volume (and oxygen reservoir), the infant “actively” regulates an end-expiratory lung volume by showing a strong continued postinspiratory activity of the diaphragm during early expiration, along with a strong adduction of the upper airway. Both these mechanisms oppose the normal elastic recoil of the lungs, prolong expiration, and maintain a high endexpiratory lung volume.
•Body temperature is highly labile and more subject to environmental temperature in the newborn, and the infant quickly changes tissue heat production as environmental temperature changes. With hypoxia, the newborn also reduces the metabolic rate in order to preserve ATP production in the face of a reduced O2 supply. This hypometabolic response probably explains the infant’s ventilatory response to hypoxia, which consists of a brisk initial hyperventilation, followed quickly by ventilatory depression.
•An infant spends more than twice as much time in REM (rapid eye movement) sleep as does an adult, and this is believed to be important to the neuronal maturation of the central nervous system. It also means that most skeletal muscles, including the intercostal muscles, are atonic much of the time and when this atonicity is added to the already highly compliant cartilaginous rib cage structure, the rib cage will (paradoxically) be sucked in with each diaphragmatic inspiration. Thus, in REM sleep, for any given VT the infant must augment the amount of diaphragmatic effort.
Despite the maturation required of most key mechanical and neural characteristics of the ventilatory control system, full-term and even the great majority of preterm infants survive and thrive while this maturation is taking place (ie, during the first 1–2 years of life). Rarely does the control system fail, as it apparently does in sudden infant death syndrome (SIDS). Some scientists have attributed this breakdown to an immature, unstable ventilatory control system that allows apneas to worsen and persist, upper airways to obstruct, and arousal mechanisms to fail. On the other hand, not all evidence supports this apnea hypothesis of SIDS. Clearly, the pathogenesis of this extremely difficult-to-study malady must be multifactorial.
SUMMARY
In this chapter we have reviewed the basic concepts of cardiovascular and pulmonary physiology for the entry-level physical therapy practitioner. To provide a framework for understanding the pathophysiology of these two systems, we have emphasized the regulatory mechanisms responsible for maintenance of tissue homeostasis. Knowledge of how pathology affects function in patients with cardiovascular and pulmonary disease is a basic, essential component of patient–client management.
REFERENCES
1.West JB, ed. Best and Taylor’s Physiological Basis of Medical Practice. 12th ed. Baltimore, MD: Lippincott Williams & Wilkins; 1991.
2.West JB. Respiratory Physiology—The Essentials. 5th ed. Baltimore, MD: Lippincott Williams & Wilkins, 1995.
3.Berne RM, Levy MN. Cardiovascular Physiology. 7th ed. St Louis, MO: Mosby; 1997.
4.Smith JJ, Kampine JP. Circulatory Physiology—The Essentials. 3rd ed. Baltimore, MD: Lippincott Williams & Wilkins; 1998.
5.Braunwald E, Ross J, Sonnenblick EH. Mechanisms of Contraction of the Normal and Failing Heart. 2nd ed. Boston, MA: Little, Brown; 1976.
6.Rowell LB. Human Cardiovascular Control. New York: Oxford University Press; 1993.
7.Rowell LB, Shepherd JT, eds: Handbook of Physiology: Exercise: Regulation and Integration of Multiple Systems. New York: Oxford University Press for the American Physiological Society; 1996.
8.Feldman JL, Smith JC. Neural control of respiratory pattern in mammals: an overview. In: Dempsey JA, Pack AI, eds. Regulation of Breathing. New York: Marcel Dekker; 1995:39-69.
9.Dempsey JA, Forster HV, Ainsworth DM. Regulation of hyperpnea, hyperventilation, and respiratory muscle recruitment during exercise. In: Dempsey JA, Pack AI, eds. Regulation of Breathing. New York: Marcel Dekker; 1995:1065-1134.
10.Jammes Y, Speck DF. Respiratory control by diaphragmatic and respiratory muscle afferents. In: Dempsey JA, Pack AI, eds. Regulation of Breathing. New York: Marcel Dekker; 1995:543-582.
11.Shea SA, Banzett RB, Lansing RW. Respiratory sensations and their role in the control of breathing. In: Dempsey JA, Pack AI, eds. Regulation of Breathing. New York: Marcel Dekker; 1995: 923-957.
12.England SJ, Miller MJ, Martin RJ. Unique issues in neonatal respiratory control. In: Dempsey JA, Pack AI, eds. Regulation of Breathing. New York: Marcel Dekker; 1995:797-827.