Crimi Ettore
R. Hess Dean
M. Bigatello Luca
Modern ventilators provide a continuous graphic display of the basic physiologic determinants of ventilation, i.e., pressure, flow, and volume. They also have the capability of performing diagnostic maneuvers to measure important physiologic variables such as plateau pressure and auto–positive end-expiratory pressure (PEEP) at the bedside. In addition, recognition of abnormal ventilator waveforms allows detection of conditions such as endobronchial intubation, missed triggering, and patient–ventilator dyssynchrony. This chapter focuses on the use of the waveforms displayed on ventilator screens to improve bedside assessment and management of patients with acute respiratory failure requiring mechanical ventilation.
Basics of Ventilator Monitoring
Ventilators can provide continuous measurement and display of pressure, flow, and volume. The ability of ventilators to display graphics and numeric data on their screen has become possible in recent years due to the availability of cost-effective sensor–transducer devices and the proliferation of microelectronic and digital technology. What used to be limited to expensive and delicate instruments used in the physiology laboratory is now compacted at relatively low cost in critical care ventilators.
How Ventilators Measure Pressure, Volume, and Flow
Airway pressure is measured in most ventilators by solid state transducers, such as piezoresistive or strain gauge transducers. Although airway pressure is best measured distal to the endotracheal tube (tracheal pressure) or at the airway, these locations tend to interfere with patient care and are not practical for continuous clinical monitoring. Hence, pressure transducers are generally located inside the ventilator at the inspiratory and expiratory valves, alternating measurements at the expiratory limb during inspiration and at the inspiratory limb during exhalation. These systems are reasonably accurate for clinical purposes but have potential flaws; for example, they will not accurately indicate proximal airway pressure if obstruction or kinking of the breathing circuit occur.
Gas flow to and from the patient during spontaneous and mechanical ventilation can be measured by various techniques (1,2). Screen and orifice pneumotachographs measure the pressure drop across a known resistance (a screen or an orifice) and derive the flow according to Ohm's law:
![]()
and its modifications to account for laminar versus turbulent flow (2). Thermal cooling pneumotachographs estimate flow from the amount of heat loss produced by the flow across the device, applying the principle of thermal convection. They oppose minimal resistance to flow and show a rapid response to flow changes, but their accuracy is decreased by turbulence and moisture. Turbine spirometers work by vane displacement, where flow rate is derived from the rotations of the turbine blades. These devices are less accurate than pneumotachographs, particularly at low gas flow, but are sturdy and easy to clean; they have been of widespread use in anesthesia machines, but have been superseded by the newer pneumotachographs. As is the case for pressure measurements, most ventilators measure flow at the inspiratory and expiratory valves rather than at the airway. Flow sensors are calibrated for air/oxygen mixtures. Thus, inaccuracies can occur in the presence of other gases, such as heliox (3), unless the ventilator is designed to make appropriate corrections, as is the Viasys AVEA (Viasys Healthcare, Yorba Linda, CA).
Tidal volume is generally measured by time integration of the flow trace. When gas flow, as in most cases, is not measured at the proximal airway, there is a difference between volume output from the ventilator and the volume delivered to the patient due to the compressible volume of the ventilator circuit. The compressible volume is the volume of gas that is lost in the compliant structures of the system, mainly the corrugated tubing of the ventilator circuit. The size of this volume is determined by two main factors: the inspiratory pressure and the compliance of the tubing. Current ventilators compensate for this lost volume in different ways (4); commonly, they measure the compliance of the breathing circuit at the time of the initial automatic setup, and they calculate a factor in the range of 3 to 4 mL/cm H2O, which is automatically added to the set tidal volume. Additional potential sources of error in volume measurements include gas conditioning by heating and humidification, which increases gas volume after the inspiratory flow sensor, as well as differences between the inspired and expired flow/volume due to oxygen consumption. Generally, these are small inaccuracies that fall within the margin of error of the flow sensors (±10%).
|
|
|
Figure 131.1. A: Flow and airway pressure (Paw) waveforms in a mechanically ventilated patient with chronic obstructive pulmonary disease, showing the performance of an end-inspiratory and an end-expiratory pause. (Modified from Putensen C, Mutz NJ, Putensen-Himmer G, et al. Spontaneous breathing during ventilatory support improves ventilation-perfusion distributions in patients with acute respiratory distress syndrome. Am J Respir Crit Care Med. 1999;159:1241. with permission.) B: Diagram of a typical airway pressure waveform during mechanical ventilation. The difference between peak inspiratory pressure (PIP) and plateau pressure (Pplat) is determined by airways resistance and end-inspiratory flow. The difference between plateau pressure and positive end-expiratory pressure (PEEP) is determined by compliance and tidal volume. (From Fisher D, Hess D. Respiratory monitoring. In: Bigatello LM, ed. Critical Care Handbook of the Massachusetts General Hospital. 4th ed. Philadelphia, PA: Lippincott Williams & Wilkins; 2006:33–52, with permission.) |
Additional Monitoring Functions
Common functions present in microprocessor-driven ventilators include the ability to perform diagnostic maneuvers that can be used to assess important physiologic variables at the bedside. The most common of these functions are the end-inspiratory and end-expiratory pauses (Fig. 131.1).
· An end-inspiratory pause is used to estimate alveolar pressure, respiratory compliance, and airways resistance. During volume-controlled ventilation with constant inspiratory flow, a manual or programmed end-inspiratory pause generates a characteristic pattern where the peak inspiratory pressure (PIP) is followed by a rapid descent to a plateau—the inspiratory plateau pressure (Pplat). When the inspiratory pause is of sufficient duration (0.5–2 seconds), it ensures cessation of gas flow and equilibration between the pressure at the proximal airway and alveolar pressure. Measurement of the Pplat requires full patient relaxation and the absence of spontaneous breathing efforts, because the consequent changes in intrathoracic pressure due to respiratory muscle activity would affect Pplat and invalidate compliance measurements. The presence of a leak in the system (within either the patient or the ventilator) will also not permit reaching a stable Pplat. The end-expiratory pause maneuver should be limited to a single breath at the time to avoid unnecessary prolongation of the inspiratory time and the development of auto-PEEP in patients at risk.
· An end-expiratory pause is used to estimate auto-PEEP when the lungs fail to empty to functional residual capacity (FRC) at end expiration. An end-expiratory pause of sufficient duration allows equilibration between alveolar and proximal airway pressure, and just as for the Pplat, this measurement is invalidated by the presence of spontaneous breathing efforts and by air leaks (5).
Additional monitoring functions, not universally available on ventilators, include the measurement of airway occlusion pressure (P0.1) and the maximum inspiratory pressure (Pimax).
· The P0.1 is the value of negative airway pressure generated in the first 100 ms of an occluded inspiratory effort. Since the early part of inspiration is largely independent of the subject's voluntary effort, the P0.1 is used as an index of ventilatory drive (6). Some ventilators can perform this measurement automatically, with seemingly equal accuracy as the manual measurement (7).
· The Pimax is the most negative pressure generated during a maximal inspiratory effort against an occluded airway. It is an index of the strength of the inspiratory muscles and has been used as an index of readiness for ventilator weaning. The off-ventilator manual measurement technique uses a one-way valve, allowing exhalation but not inspiration and an occlusion for about 15 to 20 seconds, provided that no arrhythmias or desaturation occur (8). Some ventilators allow this measurement to be performed electronically by occluding both inspiratory and expiratory valves for a set time. Relevant differences between the manual and ventilator method include the starting lung volume, which is the residual volume (the subject is coached to exhale fully prior to the maneuver) in the manual method, and FRC in the automatic method.
Specific Uses
Breath Delivery
Delivery of a ventilator breath is determined by the interaction between the machine's operation and the patient's physiology, which is described by the equation of motion of the respiratory system, discussed in more detail in Chapter 130:
![]()
Where Pappl is the pressure applied to generate the breath, Pvent is the pressure applied by the ventilator, Pmus is the pressure generated by the respiratory muscles, VT is the tidal volume, C is the compliance, [V with dot above] is the gas flow, and R is the airway resistance. In essence, when a pressure (from the respiratory muscles, the ventilator, or both) is applied to the respiratory system, it generates a gas flow through the airways that is opposed by their resistance and causes a change in the volume of the respiratory system that is proportional to its compliance. Understanding the interaction between ventilator (P, VT, and [V with dot above]) and patient (C and R) variables greatly aids the understanding of the principles of ventilation. In the previous chapter (Chapter 130), we used this approach to describe how the ventilator delivers different types of breaths. Here, we will use the same basic approach to describe how these breaths can be affected by changes in ventilatory settings, changes in physiologic variables, and specific disease states. For example, if the ventilator measures pressure, volume, and flow at multiple times during the breath delivery, an iterative technique can be used to calculate resistance and compliance (least squares technique) (9). Note, however, that this technique assumes that the patient is making no active breathing effort (Pmus = 0).
Typical Pressure, Flow, and Volume Traces
Typically, a ventilator screen will display two graphic traces of pressure, flow, or volume over time. Most ventilators allow multiple graphic and numeric options that include displaying continuous measurements as well as—or as an alternative to—ventilator settings, alarm limits, and operational information. Graphic options may include adjusting scales, sweep speed, color coding of various ventilatory modes and breathing cycle phases, freezing of a desired screen, and performing precise measurements with a cursor. By convention, inspiratory events are displayed as positive and expiratory events as negative, and the baseline is the zero flow, volume, or pressure (or PEEP). Numerous typical traces obtained during different modes are shown in Chapter 130.
Loops
In addition to the time-based graphics of pressure, volume, and flow, ventilators can often display these variables as pressure over volume and flow over volume. These graphics are referred to as loops, and have been used to visualize and diagnose specific clinical situations.
· Dynamic pressure–volume curves display volume changes as a function of the inflating pressure. The inspiratory phase of the loop reflects how the ventilator delivers inspiratory flow, whereas the shape of the expiratory portion depends primarily on the patient's respiratory mechanics. These loops are obtained under dynamic conditions (no interruption of flow), and therefore one has to be cautious to interpret them as an indication of the respiratory compliance, particularly at the beginning of inspiration of a pressure-controlled breath when the inspiratory flow rate is high and variable. However, they may provide useful information regarding the state of lung inflation at end inspiration when the inspiratory flow rate has reached minimal or zero value (Fig. 131.2).
· Endotracheal tube malposition and kinking can be detected from changes in the flow–volume and pressure–volume loops. Typically, endobronchial intubation causes a flattening of the expiratory portion of the flow–volume loop (intrathoracic obstruction). Dynamic recording of pressure–volume loops can also aid in early detection of distal migration of a double-lumen tube during anesthesia for lung resections, as illustrated in Figure 131.3 (10).
· Expiratory flow limitation. In the presence of increased expiratory airway resistance (e.g., asthma, chronic obstructive pulmonary disease [COPD]), expiratory gas flow can be significantly impeded, causing air trapping and increased work of breathing. In this situation, the expiratory portion of the flow–volume loop assumes a curvilinear pattern: the flow decays rapidly after the beginning of exhalation and subsequently tapers off, ending with a prolonged low flow rate phase (Fig. 131.4). In addition, when expiratory flow persists through the end of exhalation, the flow–volume loop becomes truncated, indicating the presence of flow limitation and consequent auto-PEEP (11,12,13). Observation of the expiratory flow–volume loop can be used to assess response to a bronchodilator (Fig. 131.5).
· Air leaks cause a loss of volume with each breath, as well as a difference between the delivered and the exhaled tidal volume. Air leaks can occur within the ventilator system (e.g., at the ventilator circuit), between the ventilator and the patient (e.g., at connections between a thoracostomy tube and a drainage device), and within the patient, such as in the presence of a bronchopleural fistula. Regardless of their location, air leaks cause a characteristic failure of the flow–volume loop to close at the end of expiration, because a portion of the inspired tidal volume does not return to the site of volume measurement on the exhalation side (Fig. 131.6).
|
|
|
Figure 131.2. Pressure–volume loop showing hyperinflation as abrupt increase of pressure at the end of inspiration. (From Nilsestuen JO, Hargett KD. Using ventilator graphics to identify patient–ventilator asynchrony. Respir Care. 2005;50:202–234, with permission.) |
|
|
|
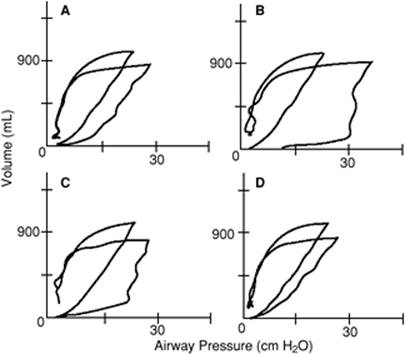
Figure 131.3. Pressure–volume curve during two-lung (narrower loops) and one-lung (wider loops) ventilation, using a double-lumen endotracheal tube. A: Baseline recording; on one-lung ventilation, the airway pressure is slightly higher than on two-lung ventilation for a similar volume, as expected. B: Acute change in inspiratory airway pressure. C: Partial reversal of the increase in airway pressure, as the endotracheal tube is withdrawn. D: Nearly full return to baseline after further withdrawal of the tube. (From Simon BA, Hurford WE, Alfille PH, et al. An aid in the diagnosis of malpositioned double-lumen tubes. Anesthesiology. 1992;76:862–863, with permission.) |
Changes in Breath Delivery
Volume-controlled Ventilation (VCV)
During VCV, airway pressure waveforms can be affected by changes in the ventilator settings and changes in the patient's respiratory mechanics, as illustrated by equation [2]. Figure 131.7 shows how a change in peak inspiratory flow rate can affect the shape of the airway pressure trace during VCV at constant flow.
|
|
|
Figure 131.4. Flow–volume loops during mechanical ventilation. A shows a normal pattern (shorter arrow) and an expiratory obstruction pattern (longer arrow). Note how the expiratory flow is truncated at end expiration and does not reach the zero-flow line. (Modified from Dhand R. Ventilator graphics and respiratory mechanics in the patient with obstructive lung disease. Respir Care. 2005;50:246–261, with permission.) B also shows expiratory flow obstruction, where the flow decreases rapidly after the first few milliseconds and then continues for the rest of exhalation at a very slow rate, without ever reaching the zero-flow line. |
|
|
|
Figure 131.5. Flow–volume loops showing a response to pharmacologic bronchodilation. The expiratory limb is up in this figure (down in the previous figure) and it shows the concavity characteristic of flow limitation. The administration of a bronchodilator increased the peak expiratory flow rate and reduced the degree of concavity. (From Dhand R. Ventilator graphics and respiratory mechanics in the patient with obstructive lung disease. Respir Care. 2005;50:246–261, with permission.) |
|
|
|
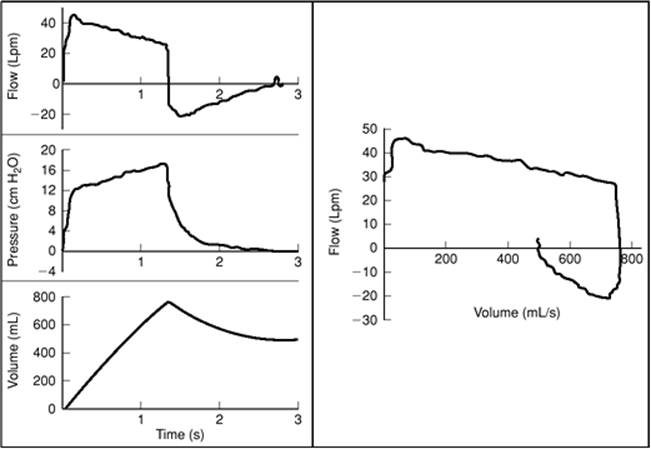
Figure 131.6. Detection of an air leak by ventilator waveform analysis. On the left, traces of flow, airway pressure, and volume. Note in the flow trace, the area under the curve (i.e., tidal volume) is smaller during exhalation, indicating a loss of volume. Also note the volume trace that does not reach baseline. On the right, the flow–volume loop fails to close at end exhalation. (Modified from Lucangelo U, Bernabe F, Blanch L. Respiratory mechanics derived from signals in the ventilator circuit. Respir Care. 2005;50:55–65, with permission.) |
Patient factors can affect waveforms during VCV through changes in the patient's effort and/or respiratory mechanics (14). The relationship between patient effort and mechanical support during VCV has been studied extensively (15). The combination of a fixed, insufficient inspiratory flow rate and a protracted delay can make triggering inefficient and ventilatory support ineffective in patients with high ventilatory demands. In these situations, the inspiratory pressure waveform acquires a characteristic upward concavity, indicating that the patient is still exerting a significant negative pressure during inspiration (Fig. 131.8). Analysis of the airway pressure trace under these circumstances may aid in estimating the amount of additional respiratory work performed by the patient (see also the section on patient–ventilator dyssynchrony below).
During VCV, the breath can also be delivered with a descending ramp flow waveform. With such a flow pattern, the set peak inspiratory flow is reached early during the breath, after which the flow decreases in a linear fashion to a very low level—or zero—at end inspiration. For the same peak flow setting of a constant flow waveform, the descending ramp requires a substantially extended inspiratory time to provide the same area under the curve (the tidal volume). The descending ramp flow pattern also affects the shape of the pressure waveform, which increases more rapidly at the beginning of inspiration, resulting in a lower PIP, which approaches the Pplat (Fig. 131.9). The lower PIP is one reason why clinicians often favor the descending ramp over the constant flow waveform; in addition, the longer inspiratory time results in a higher mean airway pressure, which may be associated with enhanced lung recruitment (typically, in patients with ALI/ARDS [acute lung injury/acute respiratory distress syndrome]) and a higher PaO2, although the benefit is generally marginal. On the other hand, the longer inspiratory time may be a disadvantage of the descending ramp with respect to the constant flow waveform when a patient is at risk of developing auto-PEEP (typically, in patients with COPD and asthma) because it lengthens the inspiratory time and shortens the expiratory time. In addition, using the decelerating flow waveform takes away the advantage of a constant inspiratory flow, which is necessary for bedside determination of compliance and resistance.
|
|
|
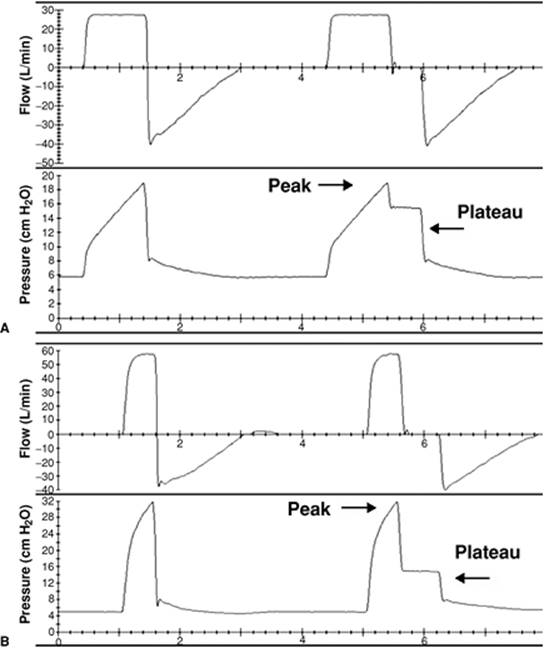
Figure 131.7. Changes in inspiratory airway pressure trace with different peak inspiratory flow rates during volume-controlled ventilation. A: Peak inspiratory flow rate = 30 L/min, tidal volume 500 mL. B: Peak inspiratory flow rate = 60 L/min, tidal volume 500 mL. The higher flow rate is associated with higher peak inspiratory airway pressure (but not plateau inspiratory pressure) and a shorter inspiratory time; the tidal volume is the same by default. |
|
|
|
Figure 131.8. Examples of inadequate peak inspiratory flow rate during volume-controlled ventilation. The arrows point to the scooped appearance of the airway pressure waveform due to the patient's own inspiratory effort. (Modified from Nilsestuen JO, Hargett KD. Using ventilator graphics to identify patient-ventilator asynchrony. Respir Care. 2005;50:202–234, with permission.) |
|
|
|
Figure 131.9. Volume-controlled ventilation delivered with a descending ramp flow waveform. Note that peak inspiratory pressure is virtually the same as the plateau inspiratory pressure. Also note the rapid pressure increase at the start of inhalation. |
Changes in respiratory mechanics can significantly affect the airway pressure trace during VCV. Secretions, endobronchial intubation, and bronchospasm are common causes of acute elevation of peak airway pressure, which is often the first sign for the clinician of the occurrence of one of these acute events. Changes in compliance can occur due to pulmonary edema, increased abdominal pressure, and increased intrathoracic pressure (Fig. 131.10).
|
|
|
Figure 131.10. Airway pressure, flow, and volume waveforms during volume-controlled ventilation with normal (A) and decreased (B) respiratory system compliance. As the compliance decreases, the peak inspiratory pressure increases and the morphology of the airway pressure curve changes from concave to linear. (Modified from Lucangelo U, Bernabe F, Blanch L. Respiratory mechanics derived from signals in the ventilator circuit. Respir Care. 2005;50:55–65, with permission.) |
Pressure-controlled Ventilation (PCV)
During PCV, inspiratory airway pressure increases rapidly to the set value, resembling a square or rectangular wave. This airway pressure waveform is due to the unique way that inspiratory flow is delivered during pressure-controlled modes. The inspiratory flow rate is variable and is the result of a combination of several factors: the capability of the ventilator, the patient's effort, and the patient's respiratory mechanics (see also Chapter 130) (16). Once the set inspiratory pressure is reached, the flow rate decreases exponentially to maintain the set pressure for the desired time, and the decay of the flow rate (descending ramp) is largely determined by the time constant of the respiratory system, i.e., resistance times compliance. Therefore, the inspiratory flow waveform during PCV is variable (e.g., if the patient makes a greater effort, more flow will be delivered), and its analysis may be of use in understanding the individual patient's mechanics, as well as optimizing ventilatory settings. Figure 131.11shows how the duration of the PCV breath may affect the size of tidal volume for a given set inspiratory pressure. When the breath ends before the inspiratory flow has reached the zero line, the tidal volume can be increased by prolonging the inspiratory time. Note also the change in the airway pressure trace, which did not reach a full plateau until the change was made and a new inspiratory pause (zero flow) created.
Changes of respiratory mechanics affect the flow waveform of PCV significantly (Fig. 131.12) and, with it, the efficiency of this mode of ventilation. Patients with a low compliance and normal resistance (fast time constant, such as in ALI/ARDS) show a steep descent of the inspiratory phase and will tend to have a low tidal volume. On the contrary, patients with a high compliance and high resistance (slow time constant, such as in asthma and COPD) show a flat slope and will tend to have problems of dyssynchrony in addition to tidal volume size. In addition, during PCV, inspiratory flow is increased by patient effort, which will increase the flow rate and the tidal volume delivered.
|
|
|
Figure 131.11. Effects of changes in the inspiratory time during pressure-controlled ventilation. As the duration of inspiration is progressively increased from the first breath on, the tidal volume increases (arrows). Once the inspiratory time is sufficiently long that the inspiratory flow reaches the zero line before the end of inspiration, no further volume is gained (last breath). (Modified from Lucangelo U, Bernabe F, Blanch L. Respiratory mechanics derived from signals in the ventilator circuit. Respir Care. 2005;50:55–65, with permission.) |
|
|
|
Figure 131.12. Changes of ventilator waveforms during pressure-controlled ventilation. An abrupt increase in airway resistance (second breath) causes a decrease in peak inspiratory flow rate and tidal volume. The arrows indicate the set end of inspiration: following the increase in resistance, the decay of the inspiratory flow rate is significantly slower and no longer reaches the zero-flow line before the end of inspiration, hence decreasing the tidal volume. |
|
|
|
Figure 131.13. Two pressure support ventilation traces obtained with different expiratory sensitivity. In A, the breath ends when the inspiratory flow rate reaches 5% of the peak inspiratory flow (i.e., low sensitivity): The tidal volume (V) is approximately 300 mL, the esophageal pressure (Pes) change approximately 5 cm H2O, and all breaths are synchronous. In B, the breath ends at 45% of the peak inspiratory flow rate (i.e., high sensitivity): At the same level of inspiratory pressure (Paw) and a similar tidal volume, there is significant patient–ventilator dyssynchrony, demonstrated by an attempted (all breaths) or successful (second breath) triggering effort during early mechanical exhalation. (Modified from Tokioka H, Tanaka T, Ishizu T, et al. The effect of breath termination criterion on breathing patterns and the work of breathing during pressure support ventilation. Anesth Analg. 2001;92:161–165, with permission.) |
Pressure Support Ventilation (PSV)
With PSV, airway pressure during inspiration approximates a square wave in a way similar to PCV. However, the duration of a PSV breath is variable. Once the set inspiratory pressure is reached, the inspiratory flow decays similar to PCV (see above), except that the breath ends not at a set time, but when the inspiratory flow reaches a certain percentage of the peak inspiratory flow, generally 20% to 25%. Traces illustrating this standard feature of PSV are shown in Chapter 130. In addition, some ventilators allow adjustments of the cycling-off criterion, also called expiratory sensitivity. A higher percentage of the peak inspiratory flow shortens the inspiratory time, potentially improving synchrony in patients with long respiratory time constants (e.g., COPD) who may otherwise take too long to reach the 25% default setting. A lower percentage setting may increase the tidal volume if a sufficient inspiratory flow is still present at that point during inspiration, which may increase tidal volume and improve synchrony in patients with long respiratory time constants (Fig. 131.13) (17).
PSV allows two other criteria to end inspiration designed to minimize the chance of patient–ventilator dyssynchrony: a pressure-cycling and a time-cycling criterion. Figure 131.14 shows how inspiration can be terminated when the inspiratory pressure plateau rises above the set pressure by a certain level, generally 1 to 3 cm H2O (18). A similar result can be reached with the second backup criterion, a time set duration of inspiration similar to PCV. This feature is particularly helpful in the presence of leaks; a leak of sufficient proportion may cause the inspiratory flow never to reach the predetermined cycling-off level, thus maintaining a constant flow as in continuous positive airway pressure (CPAP).
The rise time (or pressurization rate) is the time required for the ventilator to reach the pressure control level at the beginning of the inspiratory phase. A faster rise time delivers more flow at the beginning of inspiration, which may relieve dyspnea in patients with high respiratory drive (Fig. 131.15). This feature can be expressed in absolute time: the higher the setting, the slower the rise time; or in percentage rate: the higher the setting, the faster the rise time (19).
|
|
|
Figure 131.14. Termination of pressure support ventilation breaths by a pressure criterion. Once the set pressure is reached and maintained to begin a plateau, a further increase in pressure cycles the ventilator off. This setting is intended to decrease patient–ventilator dyssynchrony when a patients forces the end of inspiration (i.e., generates a positive airway pressure [Paw]) while the mechanical inspiration is not yet completed. This occurs typically in patients with long time constants, such as in COPD and asthma. (From Branson RD, Campbell RS. Pressure support ventilation, patient-ventilator synchrony, and ventilator algorithms. Respir Care. 1998;43:1045–1047, with permission.) |
|
|
|
Figure 131.15. Effects of a progressive increase of the inspiratory pressurization rate during pressure support ventilation, from breath A to breath E. Note the different shapes of the flow and airway pressure (Paw) traces, and the variable esophageal pressure gradient (Poes), which suggests that the optimal (i.e., lowest inspiratory work) was obtained at the intermediate setting (breath C). (From Chiumello D, Pelosi P, Croci M, et al. The effects of pressurization rate on breathing pattern, work of breathing, gas exchange and patient comfort in pressure support ventilation. Eur Respir J. 2001;18:107–114, with permission.) |
Bedside Uses of Physiologic Measurements and Graphic Display
Assessment of Respiratory Mechanics
The electronic performance of end-inspiratory and end-expiratory pauses allows the measurement of respiratory compliance and resistance at the patient's bedside. The ventilator has to be set in the VCV mode, with a constant inspiratory flow pattern. Care must be paid to minimize the patient's own respiratory efforts, which would invalidate the measurements. This may be accomplished by overriding the patient's own drive by transiently hyperventilating, administering a short-acting sedative-hypnotic, or even by inducing pharmacologic neuromuscular blockade. A thorough risk–benefit evaluation has to be made before resorting to these interventions.
Compliance
Respiratory compliance (including both lungs and chest wall) is typically reduced in cases of atelectasis, pulmonary edema (cardiogenic and noncardiogenic), pneumonia, pulmonary fibrosis, pleural effusions, pneumothorax, and fibrothorax, and it is increased with asthma and emphysema. Respiratory compliance can be measured by applying an end-inspiratory pause. Following an end-inspiratory pause, the airway pressure trace should clearly show the PIP and Pplat (Fig. 131.1). The difference between Pplat and PEEP is due to the tidal volume and the respiratory compliance (20).
|
|
|
Figure 131.16. Idealized inflation pressure–volume (P-V) curves during passive mechanical ventilation. On the left, a normal trace, with a value of approximately 80 mL/cm H2O. On the right, a P-V curve of a patient with acute respiratory distress syndrome, showing a lower and no longer linear compliance, with two distinct inflection points. ARDS, acute respiratory distress syndrome; FRC, functional residual capacity. (Modified from Fisher D, Hess D. Respiratory monitoring. In: Bigatello LM, ed. Critical Care Handbook of the Massachusetts General Hospital. 4th ed. Philadelphia, PA: Lippincott Williams & Wilkins; 2006:33–52, with permission.) |
|
|
|
Figure 131.17. Acute lung injury in a transplanted lung. A: Computed tomogram showing severe emphysema of the right (native) lung and diffuse edema and consolidation of the left (transplanted) lung. B: Ventilator waveforms, compatible with a two-compartment model. The initial part of the breath, coming from the transplanted lung (seen best in the expiratory flow trace) has a fast time constant; the second part of the breath has a very slow time constant, because of the high resistance and high compliance of the emphysematous native lung. |
![]()
This measurement is often called static compliance, meaning that the measurement was performed in conditions of no flow, or more likely, a very low flow (quasi-static conditions) achieved by the end-inspiratory pause (21). In contrast, a dynamic compliance is measured by the relationship between volume and airway pressure throughout inspiration, and it is often estimated using the PIP as the driving pressure, which includes the pressure contribution due to resistance. Also, the term chord compliance is sometimes used, indicating that the compliance measured at two lung volumes (such as above) is generally not linear (see below; chord is a line segment connecting two points on a curve). The static compliance measured with an end-inspiratory pause is relatively simple and valid for routine clinical use, but it also has several limitations:
· It is measured at just one lung volume. Although under normal circumstances, the pressure–volume (P-V) relationship of the respiratory system is linear within a physiologic range of lung volumes, pathologies such as ALI/ARDS may alter the P-V relationship so that compliance may vary significantly within a relatively narrow range of lung volumes (see below and Fig. 131.16) (22).
· It assumes the respiratory system as a single compartment which, in many cases, underestimates the complexity of regional compliances. In ALI/ARDS, pneumonia, or pneumothorax, the regional variation is significant (Fig. 131.17).
· It does not distinguish between lung and chest wall, the two mechanical components of the respiratory system. This distinction requires measuring intrathoracic (or pleural) pressure as described below. In the absence of a pleural pressure measurement, a significant contribution of the chest wall to a decreased compliance value can be suspected in the presence of abdominal distention, tight chest bandages, scars, and large pleural effusions (23).
Resistance
Common causes of increased resistance include bronchospasm, pulmonary edema, increased bronchial secretions, a low FRC, and a small inner diameter of an endotracheal tube. Following an end-inspiratory pause, inspiratory airway resistance can be estimated from the difference between PIP and Pplat (24,25):
![]()
|
|
|
Figure 131.18. Measurement of inspiratory (RI) and expiratory (RE) resistance in a fully relaxed patient, based on the measurement of the time constant (τ), which equals compliance times resistance; one τ is the time necessary to inhale or exhale 63% of the final lung volume. The respiratory system compliance was 40 mL/cm H2O; the inspiratory τ (time at 63% of inspiratory volume, horizontal line) was 0.6 s, and the expiratory τ (time at 63% of inspiratory volume, horizontal line) was 1 s. Values of RI and RE are shown. (From Nims RG, Conner EH, Comroe JH Jr. The compliance of the human thorax in anesthetized patients. J Clin Invest. 1955;34:744–750, with permission.) |
For example, with a difference of 10 cm H2O between PIP and Pplat and a dialed inspiratory flow rate of 60 L/min, R will be 10 cm H2O/L/second. Measured as such, R reflects the resistance to ventilation imposed by the airways as well as the respiratory equipment, mainly the endotracheal tube.* However, the resistance of clean endotracheal tubes is known, and one can use this knowledge (26,27) and clinical judgment (presence of secretions within the tracheal or tracheostomy tube) in estimating the airway versus equipment contribution to resistance. Resistance changes with the flow rate, lung volume, and phase of respiration. Inspiratory resistance is typically lower than expiratory resistance due to the increased diameter of the airways during inspiration, particularly in patients with obstructive disease and dynamic airflow limitation (28). Airways resistance can also be estimated from the time constant (τ = R × C) of the respiratory system. This method permits one to calculate both inspiratory (RI) and expiratory (RE) resistance in fully relaxed patients (Fig. 131.18).
Auto-PEEP
Auto-PEEP is the result of incomplete emptying of the lung at end expiration, causing an increase in end-expiratory volume and alveolar pressure (28,29,30,31). This phenomenon is due to insufficient expiratory time and/or increased expiratory airflow resistance, in addition to decreased elastic recoil pressure, and it occurs chiefly in patients with asthma and COPD. Figure 131.19 shows a characteristic flow trace occurring in the presence of expiratory flow limitation and an end-expiratory pause to measure static auto-PEEP (Fig. 131.1). Following this maneuver, most ventilators will display a value that may correspond to the total PEEP, i.e., the absolute value measured, or to the auto-PEEP that will be calculated by subtracting the applied PEEP from the measured total PEEP. Because PEEP set on the ventilator can counterbalance auto-PEEP in patients with flow limitation, the measurement of auto-PEEP should ideally be made with the PEEP set on zero in patients with obstructive lung disease.
Intrathoracic or Pleural Pressure (Ppl)
Pleural pressure is estimated by measuring the pressure in the midesophagus with an esophageal balloon catheter. Pleural pressure can be used to estimate lung and chest wall compliance to assess auto-PEEP and work of breathing during assisted modes of ventilation and to evaluate diaphragm dysfunction (21). The measurement of pleural pressure is of great value in the study of respiratory mechanics and can be used by experienced clinicians at the bedside (Fig. 131.20). However, its measurement is generally not performed and displayed by current ventilators, and it is obtained by using dedicated portable monitors or by means of home-built systems of recording that include sensor–transducers, analog-to-digital converters, a computer, and appropriate waveform analysis software (32).
|
|
Pressure–Time Waveforms
Measuring the overall pressure changes of the respiratory system throughout a breath (dynamic compliance, see above) may be a useful indicator of the mechanical behavior of the respiratory system during mechanical ventilation (33,34,35,36). For example, pressure changes measured over time under conditions of constant flow can provide information on alveolar recruitment and overdistention. A constant slope of the airway pressure suggests that there is no change in compliance during tidal ventilation; a progressive increase of the slope (upward concavity) indicates an increase in compliance (i.e., lung recruitment); and a progressive decrease in the slope (downward concavity) suggests a decrease in compliance (i.e., overdistention) (35,36) (Fig. 131.21).
|
|
|
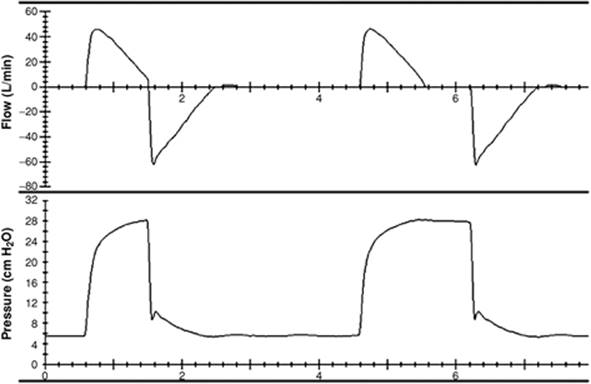
Figure 131.19. Airway pressure and flow traces in a patient with expiratory flow limitation from emphysema. The expiratory flow (top trace, inspiration is up and expiration is down) has an immediate sharp decrease in rate, then continues at a slow rate throughout expiration, and does not reach zero flow. During the last breath, an end-expiratory pause shows the presence of auto-PEEP. |
Pressure–Volume (P-V) Curves in ALI/ARDS
ALI/ARDS is a syndrome of low lung compliance, but the measured value of compliance is the averaged approximation of different regional mechanics caused by inhomogeneous distribution of alveolar collapse and edema, as well as chest wall compliance and patient position (37,38). Compliance measurement at various lung volumes at the bedside has been advocated as a means to better evaluate the recruitment status of the lung and to assist in choosing the appropriate ventilator settings (39). The construction of a P-V curve over a range of lung volumes can be carried out in various ways. The manual method with a supersyringe is relatively simple but flawed, with low reproducibility and with the problem of having to disconnect the patient from the ventilator to perform the maneuver (22). Alternatively, a P-V curve can be performed automatically in selected ventilators without disconnecting the patient from the breathing circuit. The multiple occlusion method performs repeated end-inspiratory breath occlusions at different lung volumes, and the constant flow technique measures the change in airway opening pressure with a constant slow flow (≤10 L/min) (40,41). Several authors have used the analysis of the P-V curve to guide ventilator settings in patients with ALI/ARDS (42,43,44,45,46,47). Accordingly, setting the PEEP above the lower inflection point may optimize lung recruitment and reduce end-expiratory barotrauma. Setting the inspiratory airway pressure below an upper inflection point may avoid alveolar overdistention and inspiratory barotrauma (Fig. 131.16). Despite the theoretical appeal of this approach, its clinical use remains controversial. First, the two inflection points are often not as clear as one would like them to be, which will result in incorrect application of the physiologic principle behind this approach (48). Second, recent studies seem to indicate that the level of PEEP does not make a significant difference in the outcome of patients with ALI/ARDS, and that a low inspiratory pressure (most of the time incompatible with a high PEEP) may be the most important ventilatory variable associated with a better outcome (49).
|
|
|
Figure 131.20. Flow, airway pressure, and esophageal pressure traces during pressure-controlled ventilation. At each breath, the esophageal pressure shows negative swings of approximately 10 cm H2O, indicating active inspiratory efforts. |
|
|
|
Figure 131.21. Analysis of the inspiratory pressure over time (P-t) curve under conditions of constant flow. The coefficient b describes the shape of the P-t curve. When b is <1 (left), the P-t trace has a concavity facing up, indicating an increasing compliance throughout inflation, related to ongoing alveolar recruitment. When b is >1 (right), the P-t trace has a concavity facing down, indicating a decreasing compliance, related to alveolar overdistention. When b = 1 (middle), the P-t curve is linear, indicating a constant compliance throughout inflation and hence minimal alveolar stress. (Modified from Ranieri VM, Zhang H, Mascia L, et al. Pressure-time curve predicts minimally injurious ventilatory strategy in an isolated rat lung model. Anesthesiology. 2000;93:1320–1328, with permission.) |
Patient–Ventilator Dyssynchrony
Dyssynchronous interactions between the patient's own effort and the machine's support may occur at any time in the course of mechanical ventilation for acute respiratory failure. Dyssynchrony may worsen gas exchange, cause hemodynamic instability, and generate additional mechanical load that may hinder ventilator weaning.
· Insufficient gas flow support can occur when the patient's ventilatory demand is higher than the inspiratory flow rate supplied by the ventilator. Increased inspiratory work during volume-assisted mechanical ventilation was demonstrated two decades ago (15), using the airway pressure trace to estimate the additional work of breathing imposed by ineffective machine support. By superimposing two airway pressure traces obtained during VCV at identical settings, with the patient fully relaxed and actively triggering the breath, the authors were able to extrapolate the amount of respiratory work performed by the patient (Fig. 131.22). Modern ventilators allow continuous assessment of these parameters, greatly enhancing our ability to identify optimal mechanical support. Patient–ventilator dyssynchrony can occur at multiple levels during the breathing cycle, and can be related both to patient's pathology and/or ventilator shortcomings. We will include here a few examples and we refer to other inclusive reviews (50,51,52,53).
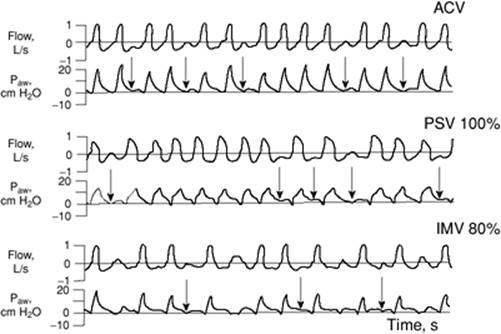
· Missed triggering due to dynamic hyperinflation and auto-PEEP can occur with any mode of ventilatory support (54). Common to this phenomenon is the finding of the expiratory flow trace aiming toward the zero-flow line, as if to start a breath, but not going over it for several additional milliseconds, after which a breath is eventually initiated. These “humps” on the expiratory flow trace (Fig. 131.23) indicate attempts to trigger a breath that do not generate sufficient pressure to overcome auto-PEEP. The significance of this phenomenon is at least twofold. First, it constitutes wasted respiratory work, i.e., no tidal volume is generated. Second, it may mislead the clinician reading the ventilator display to underestimate the true neural respiratory rate that the patient is trying to develop.
|
|
|
Figure 131.22. Airway pressure waveforms during controlled mechanical ventilation in the absence (top) and presence (bottom) of inspiratory muscle activity. In the bottom view, the shaded area represents the active work performed by the patient's inspiratory muscles. (From Marini JJ, Rodriguez RM, Lamb V. The inspiratory workload of patient-initiated mechanical ventilation. Am Rev Respir Dis. 1986;134:902–909, with permission.) |
|
|
|
Figure 131.23. Ineffective triggering during different modes of ventilatory support: assist-control ventilation (ACV), pressure support ventilation (PSV), and intermittent mandatory ventilation (IMV). In each of the three modes recorded, several attempts to trigger the ventilator (arrows on the airway pressure [Paw] trace) are unsuccessful. Note the expiratory flow trace aiming toward the zero-flow line, as if to start a breath, but not going over it for several additional milliseconds, after which a breath is eventually initiated. (Data from Leung P, Jubran A, Tobin MJ. Comparison of assisted ventilator modes on triggering, patient effort, and dyspnea. Am J Respir Crit Care Med. 1997;155:1940–1948.) |
· Inadequate inspiratory time can cause a discrepancy between the patient's own ventilatory pattern and the one set on the ventilator. This phenomenon can occur during PSV and can be aided by changing the expiratory sensitivity parameter (Fig. 131.13). It can also occur during volume-controlled ventilation (21,55). During volume-controlled ventilation in a spontaneously breathing patient, an insufficient inspiratory time or excessively low tidal volume may result in double triggering, i.e., a second ventilatory cycle starts immediately after the previous one (Fig. 131.24). This phenomenon occurs because the patient's neural inspiration is longer than what is provided at that time by the ventilator; the patient's high demand is sufficient to close the expiratory valve early in exhalation and trigger a second inspiration before exhalation is completed.
Summary
Modern ventilators measure and display physiologic information during mechanical ventilation. The observation of the pressure, volume, and flow traces may help clinicians to measure respiratory mechanics, adjust ventilator settings, and detect equipment abnormalities. In addition, it offers the opportunity to learn and teach applied respiratory physiology at the bedside.
|
|
|
Figure 131.24. Double triggering during volume-controlled ventilation. Several breaths (arrows) start immediately after the previous breath, without allowing full exhalation. This phenomenon is characteristic of situations where the ventilator provides insufficient inspiratory flow, time, or volume to satisfy the patient's demand. (From Thille AW, Rodriguez P, Cabello B, et al. Patient-ventilator asynchrony during assisted mechanical ventilation. Intensive Care Med. 2006;32:1515–1522, with permission.) |
Tips and Pearls
1. The appropriate use of the end-inspiratory and end-expiratory pause functions on the ventilator can provide measurement and display of basic respiratory mechanics of use during mechanical ventilation for acute respiratory failure.
2. During volume-controlled ventilation, peak inspiratory airway pressure is determined by tidal volume, inspiratory flow rate, resistance, compliance, and PEEP.
3. With a large air leak from the lungs, the expiratory volume will be lower than the inspiratory volume.
4. Flow–volume loops can be used to assess endotracheal tube malposition, expiratory flow limitation, air leaks, and response to bronchodilators.
5. Attention to analysis of the pressure and flow waveforms during the most common modes of ventilation can reveal the presence of expiratory flow limitation, auto-PEEP, and missed breath triggering.
6. Insufficient inspiratory flow delivery during volume-controlled ventilation can be taxing to the patient and can be detected by the presence of an upward concavity in the early part of the pressure trace.
7. The value of the respiratory rate displayed on the ventilator screen may be deceiving. Missed triggering may occur due to expiratory flow limitation; the real respiratory rate is higher than the displayed respiratory rate. Double triggering may occur due to a set tidal volume that is too small, or a set inspiratory time that is too short for the patient's neural drive, and results in a higher respiratory rate.
8. Esophageal pressure changes reflect pleural pressure changes.
References
1. Sanborn WG. Monitoring respiratory mechanics during mechanical ventilation: where do the signals come from? Respir Care. 2005;50:28–52.
2. Sullivan WJ, Peters GM, Enright PL. Pneumotachographs: theory and clinical application. Respir Care. 1984;29:736–749.
3. Hess DR. Heliox and noninvasive positive-pressure ventilation: a role for heliox in exacerbations of chronic obstructive pulmonary disease? Respir Care. 2006;51:640–650.
4. Hess D, McCurdy S, Simmons M. Compression volume in adult ventilator circuits: a comparison of five disposable circuits and a non-disposable circuit. Respir Care. 1991;36:1113–1118.
5. Gottfried SB, Reissman H, Ranieri VM. A simple method for the measurement of intrinsic positive end-expiratory pressure during controlled and assisted modes of mechanical ventilation. Crit Care Med. 1992;20:621–629.
6. Brenner M, Mukai DS, Russell JE, et al. A new method for measurement of airway occlusion pressure. Chest. 1990;98:421–427.
7. Kuhlen R, Hausmann S, Pappert D, et al. A new method for P0.1 measurement using standard respiratory equipment. Intensive Care Med. 1995;21:554–560.
8. Marini JJ, Smith TC, Lamb V. Estimation of inspiratory muscle strength in mechanically ventilated patients: the measurements of maximal inspiratory pressure. J Crit Care. 1986;1:32–38.
9. Stahl CA, Moller K, Schumann S, et al. Dynamic versus static respiratory mechanics in acute lung injury and acute respiratory distress syndrome. Crit Care Med. 2006;34:2090–2098.
10. Simon BA, Hurford WE, Alfille PH, et al. An aid in the diagnosis of malpositioned double-lumen tubes. Anesthesiology. 1992;76:862–863.
11. Jubran A, Tobin MJ. Use of flow-volume curves in detecting secretions in ventilator-dependent patients. Am J Respir Crit Care Med. 1994;150:766–769.
12. Brown K, Sly PD, Milic-Emili J, et al. Evaluation of the flow-volume loop as an intra-operative monitor of respiratory mechanics in infants. Pediatr Pulmonol. 1989;6:8–13.
13. Dhand R. Ventilator graphics and respiratory mechanics in the patient with obstructive lung disease. Respir Care. 2005;50:246–261.
14. Kondili E, Prinianakis G, Georgopoulos D. Patient–ventilator interaction. Br J Anaesth. 2003;91:106–119.
15. Marini JJ, Rodriguez RM, Lamb V. The inspiratory workload of patient-initiated mechanical ventilation. Am Rev Respir Dis. 1986;134:902–909.
16. Bernasconi M, Ploysongsang Y, Gottfried SB, et al. Respiratory compliance and resistance in mechanically ventilated patients with acute respiratory failure. Intensive Care Med. 1988;14:547–553.
17. Tokioka H, Tanaka T, Ishizu T, et al. The effect of breath termination criterion on breathing patterns and the work of breathing during pressure support ventilation. Anesth Analg. 2001;92:161–165.
18. Branson RD, Campbell RS. Pressure support ventilation, patient–ventilator synchrony, and ventilator algorithms. Respir Care 1998;43:1045–1047.
19. Chiumello D, Pelosi P, Croci M, et al. The effects of pressurization rate on breathing pattern, work of breathing, gas exchange and patient comfort in pressure support ventilation. Eur Respir J. 2001;18:107–114.
20. D'Angelo E, Calderini E, Torri G, et al. Respiratory mechanics in anesthetized paralyzed humans: effects of flow, volume, and time. J Appl Physiol. 1989;67:2556–2564.
21. Truwit JD, Marini JJ. Evaluation of the thoracic mechanics in the ventilated patients, I: primary measurements. J Crit Care. 1988;3:133–150.
22. Harris RS. Pressure-volume curves of the respiratory system. Respir Care. 2005;50:78–98.
23. Ranieri VM, Giuliani R, Mascia L, et al. Chest wall and lung contribution to the elastic properties of the respiratory system in patients with chronic obstructive pulmonary disease. Eur Respir J. 1996;9:1232–1239.
24. Lucangelo U, Bernabe F, Blanch L. Respiratory mechanics derived from signals in the ventilator circuit. Respir Care. 2005;50:55–65.
25. Hess D, Tabor T. Comparison of six methods to calculate airway resistance during mechanical ventilation in adults. J Clin Monit. 1993;9:275–282.
26. Rossi A, Gottfried SB, Higgs BD, et al. Respiratory mechanics in mechanically ventilated patients with respiratory failure. J Appl Physiol. 1985;58:1849–1858.
27. Polese G, Lubli P, Poggi R, et al. Effects of inspiratory flow waveforms on arterial blood gases and respiratory mechanics after open heart surgery. Eur Respir J. 1997;10:2820–2824.
28. Smith TC, Marini JJ. Impact of PEEP on lung mechanics and work of breathing in severe airflow obstruction. J Appl Physiol. 1988;65:1488–1499.
29. Marini JJ, Culver BH, Kirk W. Flow resistance of exhalation valves and positive end-expiratory pressure devices used in mechanical ventilation. Am Rev Respir Dis. 1985;131:850–854.
30. Ranieri VM, Grasso S, Fiore T, et al. Auto-positive end-expiratory pressure and dynamic hyperinflation. Clin Chest Med. 1996;17:379–394.
31. Blanch L, Bernabe F, Lucangelo U. Measurement of air trapping, intrinsic positive end-expiratory pressure, and dynamic hyperinflation in mechanically ventilated patients. Respir Care. 2005;50:110–123.
32. Benditt JO. Esophageal and gastric pressure measurements. Respir Care. 2005;50:68–75.
33. Bates JH, Rossi A, Milic-Emili J. Analysis of the behavior of the respiratory system with constant inspiratory flow. J Appl Physiol. 1985;58:1840–1848.
34. Lichtwarck-Aschoff M, Kessler V, Sjostrand UH, et al. Static versus dynamic respiratory mechanics for setting the ventilator. Br J Anaesth. 2000;85:577–586.
35. Ranieri VM, Zhang H, Mascia L, et al. Pressure–time curve predicts minimally injurious ventilatory strategy in an isolated rat lung model. Anesthesiology. 2000;93:1320–1328.
36. Grasso S, Terragni P, Mascia L, et al. Airway pressure–time curve profile (stress index) detects tidal recruitment/hyperinflation in experimental acute lung injury. Crit Care Med. 2004;32:1018–1027.
37. Bigatello LM, Davignon KR, Stelfox HT. Respiratory mechanics and ventilator waveforms in the patient with acute lung injury. Respir Care. 2005;50:235–245.
38. Pelosi P, Cereda M, Foti G, et al. Alterations of lung and chest wall mechanics in patients with acute lung injury: effects of positive end-expiratory pressure. Am J Respir Crit Care Med. 1995;152:531–537.
39. Amato MB, Barbas CS, Medeiros DM, et al. Effect of a protective-ventilation strategy on mortality in the acute respiratory distress syndrome. N Engl J Med. 1998;338:347–354.
40. Lu Q, Vieira SR, Richecoeur J, et al. A simple automated method for measuring pressure–volume curves during mechanical ventilation. Am J Respir Crit Care Med. 1999;159:275–282.
41. Servillo G, Svantesson C, Beydon L, et al. Pressure–volume curves in acute respiratory failure: automated low flow inflation versus occlusion. Am J Respir Crit Care Med. 1997;155:1629–1636.
42. Matamis D, Lemaire F, Harf A, et al. Total respiratory pressure–volume curves in the adult respiratory distress syndrome. Chest. 1984;86:58–66.
43. Hickling KG. The pressure–volume curve is greatly modified by recruitment. A mathematical model of ARDS lungs. Am J Respir Crit Care Med. 1998;158:194–202.
44. Hickling KG. Best compliance during a decremental, but not incremental, positive end-expiratory pressure trial is related to open-lung positive end-expiratory pressure: a mathematical model of acute respiratory distress syndrome lungs. Am J Respir Crit Care Med. 2001;163:69–78.
45. Pelosi P, Goldner M, McKibben A, et al. Recruitment and derecruitment during acute respiratory failure: an experimental study. Am J Respir Crit Care Med. 2001;164:122–130.
46. Crotti S, Mascheroni D, Caironi P, et al. Recruitment and derecruitment during acute respiratory failure: a clinical study. Am J Respir Crit Care Med. 2001;164:131–140.
47. Hickling KG. Reinterpreting the pressure–volume curve in patients with acute respiratory distress syndrome. Curr Opin Crit Care. 2002;8:32–38.
48. Harris RS, Hess DR, Venegas JG. An objective analysis of the pressure–volume curve in the acute respiratory distress syndrome. Am J Respir Crit Care Med. 2000;161:432–439.
49. Brower RG, Lanken PN, MacIntyre N, et al. Higher versus lower positive end-expiratory pressures in patients with the acute respiratory distress syndrome. N Engl J Med. 2004;351:327–336.
50. Nilsestuen JO, Hargett KD. Using ventilator graphics to identify patient–ventilator asynchrony. Respir Care. 2005;50:202–234.
51. Georgopoulos D, Prinianakis G, Kondili E. Bedside waveforms interpretation as a tool to identify patient–ventilator asynchronies. Intensive Care Med. 2006;32:34–47.
52. Younes M, Riddle W. Relation between respiratory neural output and tidal volume. J Appl Physiol. 1984;56:1110–1119.
53. Younes M. Patient–ventilator interaction with pressure-assisted modalities of ventilator support. Semin Respir Med. 1993;14:299–322.
54. Leung P, Jubran A, Tobin MJ. Comparison of assisted ventilator modes on triggering, patient effort, and dyspnea. Am J Respir Crit Care Med. 1997;155:1940–1948.
55. Hess DR, Medoff BD, Fessler MB. Pulmonary mechanics and graphics during positive pressure ventilation. Int Anesthesiol Clin. 1999;37:15–34.
56. Thille AW, Rodriguez P, Cabello B, et al. Patient–ventilator asynchrony during assisted mechanical ventilation. Intensive Care Med. 2006;32:1515–1522.