Michael J. Banner
Immediate Concerns
Major Problems
Work of breathing per minute, or power of breathing (POB), reflects the balance between patient spontaneous breathing demand (driven by metabolic and neural factors) and the support provided by the ventilator. Increases in respiratory muscle loading and, thus, POB result primarily from increased physiologic elastance and resistance. Because compliance is the reciprocal of elastance, as total compliance (lungs and chest wall) decreases, elastic loading of the respiratory muscles increases. The total resistive load is affected by physiologic airways and breathing apparatus resistances. Elastance, resistance, or both can significantly increase the POB or load on the respiratory muscles, predisposing to muscle fatigue (loss of the force-generating capacity of the muscles), carbon dioxide retention, and hypoxemia.
Ventilatory support may be applied to partially or totally unload respiratory muscles. High levels of ventilatory support totally unload the muscles and, if applied for too long a period, may lead to atrophy. Conversely, too little support risks muscle fatigue. Unfortunately, in either case, the duration of mechanical ventilation may be needlessly prolonged for reconditioning/training if respiratory muscle atrophy is present or to provide needed rest if the muscles are fatigued. Optimization of ventilatory support to each patient's unique needs requires information of the load on the respiratory muscles as well as gas exchange. This manuscript will focus on POB measurements as my approach to assess the load on the muscles and to provide a quantitative and goal-oriented method for appropriately setting pressure support ventilation (PSV).
Stress Points
1. Respiratory muscles are force generators, and the diaphragm accounts for 70% of normal tidal volume (VT).
2. The diaphragm has high endurance capability well suited to low-tension, high-repetition activity (breathing). However, it can be readily fatigued by increased air flow resistance and duration of respiratory muscle contraction.
3. Imposed POB against a highly resistant ventilator circuit and endotracheal tube leads to fatigue. Patients with an already increased physiologic POB because of respiratory disease tolerate such increases poorly.
4. Bedside measurement of POB, including breath-by-breath analysis, and separation into its component parts are possible with a commercially available bedside monitor.
5. Inaccurate assessments of respiratory muscle loads by using parameters like respiratory muscle pressure (Pmus) may result because of failure to assess chest wall compliance and its contributions.
6. Factors that load the respiratory muscles include increases of inspiratory flow rate and minute ventilation, physiologic dead space volume–to–tidal volume ratio (VD/VT), intrinsic positive end-expiratory pressure (PEEP), breathing apparatus resistance, and the ventilator response time. Many of these factors can be altered favorably by careful adjustment and replacement of highly resistant elements of the circuit (particularly the endotracheal tube).
7. Respiratory muscle fatigue results from an imbalance of energy supply and demand.
8. Inferences as to POB, such as increased spontaneous breathing frequency (f) and tidal volume (VT) alone can be misleading.
9. Successful weaning from mechanical ventilation often requires a decrease in the imposed POB to a tolerable level. PSV is uniquely capable to decrease or eliminate this workload when titrated in accordance with measured POB.
Essential Diagnostic Tests and Procedures
1. Most patients can be followed by conventional assessment. However, when weaning, extubation, or both are difficult or seemingly impossible, measurements of airway pressures, VT, and POB with its component parts may be useful in assessing the patient and guiding ventilatory therapy.
2. Spontaneous and breathing patterns (f and VT), as well as the use of accessory respiratory muscles such as the sternocleidomastoid (SCM) muscle, should be continuously monitored, but their limitations for predicting and assessing diaphragmatic fatigue, as detailed in this chapter, should be well understood.
Initial Therapy
1. Decrease the imposed POB to zero using PSV as the first step. This workload is of no value for muscle conditioning and predisposes to fatigue.
2. Add additional PSV as necessary to reduce the physiologic workload (elastance and resistance) to clinically acceptable levels (i.e., POB of approximately 5–10 joules/minute).
3. Use the largest internal diameter endotracheal tube that is unlikely to result in airway damage. A 1.0-mm increase of the inside diameter is associated with significantly less resistive imposed work (parenthetically to be noted is that less air is needed for cuff inflation with larger tubes, thereby decreasing the risk of cuff-induced tracheal damage).
4. Do not reduce PSV below the level that eliminates imposed POB. To do so reloads the respiratory muscles, predisposing to fatigue.
5. In difficult cases, use clinical parameters to supplement—but not to replace—direct noninvasively measured POB.
Respiratory Muscles
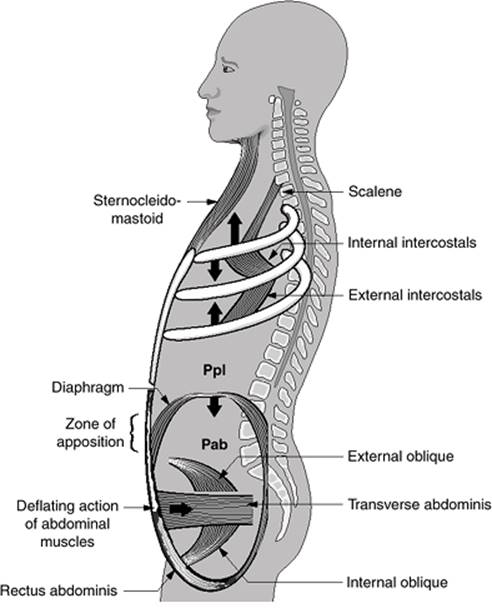
Respiratory muscles are the force generators that drive the respiratory system (1). Regarded as the primary inspiratory muscle, the diaphragm accounts for approximately 70% of normal VT exchange. Other inspiratory muscles that account for the balance of tidal ventilation are the external intercostals, parasternals, and scalenes (2). The SCM muscles are major accessory inspiratory muscles that have a predominantly pump-handle action on the rib cage, elevating the first ribs and sternum (Fig. 20.1). During quiet breathing, they are usually inactive, but are always active during exercise and conditions of respiratory muscle loading.
The internal intercostal and abdominal muscles are involved with exhalation. On contraction, the internal intercostal muscles lower the ribs, thus deflating the lungs. The external abdominal oblique, internal abdominal oblique, transverse abdominis, and rectus abdominis (1,2) (Fig. 20.1) are the most important and powerful expiratory muscles. When these muscles contract, the abdominal wall is pulled inward, causing increased intra-abdominal pressure that forces the diaphragm cephalad into the thoracic cavity (3). Concomitantly, the lower ribs are pulled downward and medially. The net effect of these actions is deflation of the rib cage. Normally, exhalation is a passive process and the abdominal muscles are inactive. With increased muscle loads (e.g., increased airway resistance), however, the abdominal muscles are recruited and exhalation becomes an active, energy-consuming process.
The Diaphragm
Because the diaphragm is the primary muscle of inspiration, the physiologic characteristics and responses of this muscle during conditions of loaded and unloaded breathing are described.
Muscle Fiber Types
The adult diaphragm is composed of three types of skeletal muscle fibers: Type 1 (≤60%), type 2A (≤20%), and type 2B (≤20%) (4). Skeletal muscle fibers are differentiated on the basis of (a) velocity of shortening (fast and slow fibers), and (b) the major pathway to form adenosine triphosphate (ATP) (oxidative and glycolytic fibers) (5). In general, muscle fibers are composed of two contractile protein filaments: Myosin (thick filament) and actin (thin filament). Fibers containing myosin with high ATPase activity (enzyme that catalyzes the hydrolysis of ATP to adenosine diphosphate [ADP], releasing chemical energy stored in ATP) are classified as fast fibers; those containing myosin with lower ATPase activity are slow fibers. In general, the more energy that is available for contraction, the greater is the velocity of muscle fiber shortening.
|
|
|
Figure 20.1. Diagrammatic representation of inspiratory and expiratory muscles; arrows indicate direction of action. Pab, abdominal pressure; Ppl, intrapleural pressure. (Modified from Roussos C. Chest. 1985;88:S125.) |
Force Generation and Fatigue
Muscle fibers differ in terms of size and force development. Glycolytic fibers are larger in diameter than oxidative fibers. A greater force or tension can be developed by a large-diameter muscle fiber. Consequently, a type 2B fiber (strength oriented) can generate more force than a type 1 fiber during contraction (4,5). Fibers also differ in their ability to resist fatigue (muscle fails as a force generator). Type 2B fibers fatigue rapidly, whereas type 1 fibers are resistant to fatigue (endurance oriented), a characteristic that allows them to maintain contractile activity for long periods. Type 2A fibers have an intermediate capacity to resist fatigue (4,6).
Endurance and Strength
In general, the diaphragm is an endurance-oriented (low-tension, high-repetition activity), not strength-oriented (high-tension, low-repetition activity), muscle because most of the muscle mass is composed of type 1, slow oxidative fibers. In fact, it is capable of impressive feats of endurance. An Olympic marathon runner can maintain high minute ventilation of approximately 50 L/minute several hours per day for many days in succession. Despite this endurance performance, the diaphragm can be fatigued in a matter of minutes by an increased resistance to flow rate or increased duration of muscle contraction (4).
The duration of diaphragmatic contraction is the duty cycle of the breath taken as the ratio of inspiratory time to total respiratory cycle time (TI/Ttot). Normally, the TI/Ttot ratio is approximately 0.33 (7). The diaphragm, although contracting rhythmically from minute to minute, requires time to recover before contraction resumes. Impingement on this recovery time by an increase in respiratory rate, duration of contraction, or both predisposes to respiratory muscle fatigue. An increase in respiratory rate, as in acute respiratory failure, causes a greater reduction in expiratory time than inspiratory time, thus increasing TI/Ttot and contributing to the development of fatigue (6,7). In patients with severe respiratory muscle loading, we have measured TI/Ttot ratios as high as 0.50 to 0.60.
Measurement of Work of Breathing
The load on the respiratory muscles is a reverse force that opposes the contractile force of the muscles and may be assessed by measuring the work of breathing per breath, that is, by integrating the change in esophageal pressure (Pes) and VT (8,9).
Work = ∫ Pes VT
POB, the rate at which work is done, is a better assessment of respiratory muscle loads than work per breath because it is a measure over time, not for an individual breath. Because of wide variations in breath-to-breath work measurements, at times this method of assessing respiratory muscle workloads is difficult to interpret. POB is determined by averaging work per breath data over 1 minute.
The total respiratory muscle work performed by a spontaneously breathing, intubated patient connected to a mechanical ventilator includes imposed and physiologic components (Table 20.1). Imposed POB (work per minute performed by the patient to breathe spontaneously through the endotracheal tube, ventilator breathing circuit, and demand-flow system) is an additional flow-resistive workload superimposed on the physiologic work (10,11,12). Imposed POB may equal or exceed the physiologic work under some conditions (13,14,15).
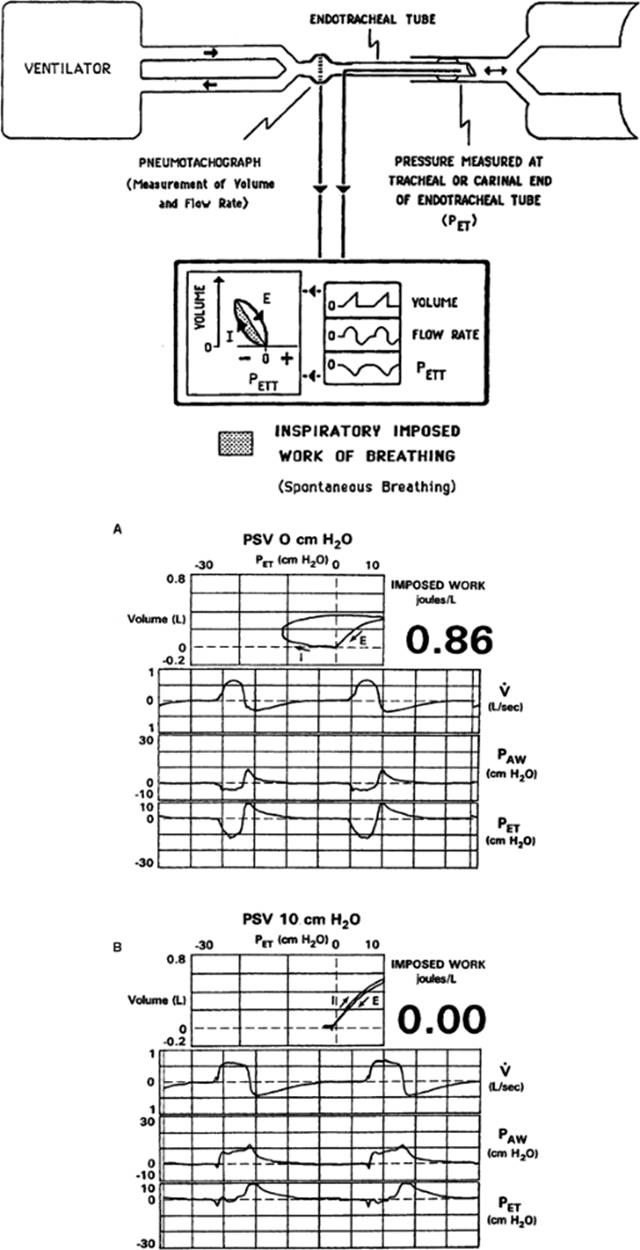
Imposed POB of the ventilator and endotracheal tube, a series resistance, is assessed by integrating the change in pressure measured at the carinal end of the endotracheal tube and VT (16). Pressure at the carinal or tracheal end of the tube is measured by inserting a narrow (1-mm outside diameter), air-filled catheter through the tube and positioning it at the carinal end. VT is measured by integrating the flow signal from a miniature flow sensor (pneumotachograph) positioned between the Y piece of the breathing circuit and the endotracheal tube. These data are, in turn, averaged over 1 minute to determine imposed POB (Fig. 20.2). Imposed POB should be nullified to zero by using appropriate levels of PSV (Fig. 20.2A).
|
Table 20.1 Work per breath to determine power of breathing performed by a spontaneously breathing, intubated patient (see Fig. 20.3) |
|
|
Physiologic work per minute or power of breathing includes elastic (work required to overcome the elastic forces of the respiratory system during inflation) and flow-resistive (work required to overcome the resistance of the airways and tissues to the flow of gas) components, and is approximately 4 to 8 joules/minute (8,17). Based on studying over 500 adults in a 10-year span, a clinically acceptable range for total POB appears to be about 5 to 10 joules/minute.
The Campbell Diagram
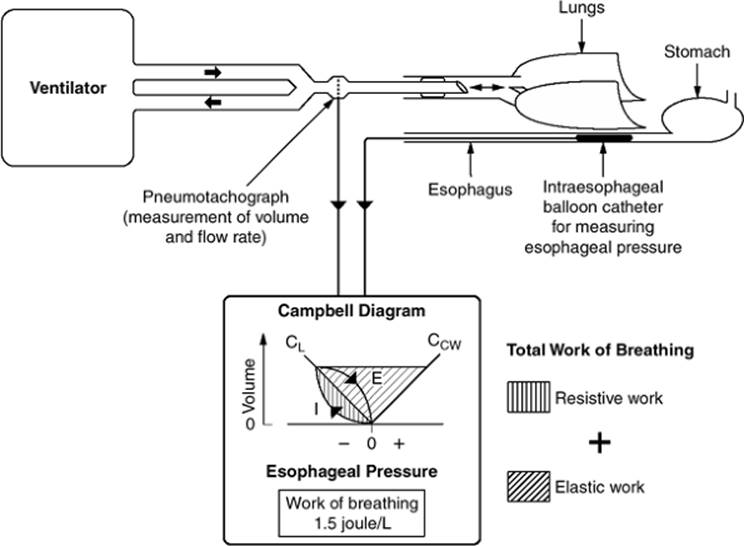
POB performed by the patient on the respiratory system (physiologic power of breathing) and the ventilator and endotracheal tube (imposed power of breathing) during spontaneous ventilation is calculated by integrating the changes in esophageal pressure (indirect measurement of intrapleural pressure) and volume. Intraesophageal pressure is measured with a balloon catheter positioned in the middle to lower third of the esophagus. Correct position is confirmed using an occlusion test as described by Baydur et al. (18) (i.e., after occlusion of the airway opening, the change in pressure at the airway opening and in the esophagus are nearly the same during spontaneous inspiratory efforts). VT is measured as described previously. Data from these measurements and measurement of chest wall compliance are processed and the work of breathing calculated using the Campbell diagram (9,19,20) (Fig. 20.3). Work per breath measurements are then averaged over 1 minute to compute POB.
Chest Wall Influence on Power of Breathing Measurements
To calculate work of breathing so as to determine POB using the Campbell diagram, chest wall compliance must first be measured. Accuracy in measuring chest wall compliance requires a relaxed and mechanically ventilated patient. To measure chest wall compliance, one approach is to administer adequate sedation (1–2 mg of intravenous midazolam) or induce pharmacologic paralysis to induce relaxation, and then the mechanical ventilator rate is increased transiently to approximately 10 to 12 breaths/minute. Under conditions of mechanical inflation with a preselected VT and a relaxed patient, esophageal pressure increases. The changes in esophageal pressure and volume are integrated to produce a pressure–volume loop that moves in a counterclockwise direction. The slope of this pressure–volume loop is interpreted as chest wall compliance. Measured chest wall compliance values for adult patients who were diagnosed with acute respiratory failure averaged 0.109 ± 0.037 L/cm H2O (21). Subsequently, when the patient resumes breathing spontaneously, total POB (physiologic plus imposed) is then computed using the Campbell diagram as previously described.
|
|
|
Figure 20.2. Work imposed by the breathing apparatus is determined during spontaneous breathing by measuring change in pressure at the tracheal or carinal end of the endotracheal tube (PET) and change in volume (tidal volume) between the Y piece of the ventilator breathing circuit and the endotracheal tube. PET and the change in volume are directed to a respiratory monitor and are integrated to display a pressure–volume (work) loop and provide real-time calculations of the inspiratory imposed work of breathing (i.e., the shaded area of the loop). I, inhalation; E, exhalation (see Fig. 20.2A). Recordings of imposed work of breathing obtained by integrating the changes in pressure at the tracheal or carinal end of the endotracheal tube (PET) and volume at the Y piece of the ventilatory breathing circuit for a patient intubated with an 8.5-mm internal diameter endotracheal tube and connected to a ventilator (7200a, Puritan-Bennett) while breathing spontaneously with zero end-expiratory pressure. Inspiratory flow rate ([V with dot above]) and airway pressure (PAW) are measured at the Y piece of the breathing circuit (see Fig. 20.2). The pressure–volume loop moves in a clockwise direction during inhalation (I) and exhalation (E), and the area circumscribed within the loop to the left of zero pressure is imposed work. A: No pressure support ventilation (PSV) is applied. Notice the value of imposed work and that PET decreases by a greater amount than PAW during spontaneous inhalation because of the resistance of the endotracheal tube. B: PSV of 10 cm H2O is applied, and imposed work decreases to zero. PAW increases to a greater level, and PET does not decrease during inhalation compared with A. Notice that volume increases from approximately 0.35 L in A to 0.50 L in B as a result of PSV. A minimal level of PSV is that which corresponds to zero imposed work of breathing. |
Alternative Measurements
Measurement of the area enclosed within an esophageal pressure–volume loop during spontaneous breathing underestimates the work per breath, and thus POB, because the area of the loop includes only the resistive work (physiologic plus imposed) and a small portion of the elastic work (see Fig. 20.3). Some investigators fitted a right triangle to the esophageal pressure–volume loop to infer elastic work; however, this approach also underestimates elastic work of breathing (22). Measurement of the pressure change at the Y piece of the ventilator breathing circuit tubing or at the carinal end of the endotracheal tube and the change in volume during spontaneous breathing allows calculation only of the work imposed by the ventilator and ventilator plus the endotracheal tube, respectively (11,16). Thus, accurate measurement of the total POB (physiologic plus imposed) requires monitoring equipment with appropriate hardware and software to use the Campbell diagram.
Using Pmus, the sum of elastic pressure (VT divided by respiratory system compliance) and resistive pressure (flow rate times total resistance, which is respiratory system resistance plus endotracheal tube resistance) alone to predict work per breath via a conversion factor has been advanced (23). However, in our experience this is an inaccurate method of predicting work of breathing per breath. This method does not take into consideration the effects of decreased chest wall compliance on increasing elastic work and, thus, total work per breath.
We measured total work per breath (imposed plus physiologic work) with an esophageal balloon catheter using the Campbell diagram, as well as calculating POB on over 200 adults receiving PSV while simultaneously calculating Pmus.
We found that Pmus was a poor predictor of work per breath (r2 = 0.42). Because this approach resulted in both over- and underestimations of the work of breathing per breath, it is not recommended for use in clinical practice for patients attached to life-support ventilators.
Noninvasive Measurement of Power of Breathing
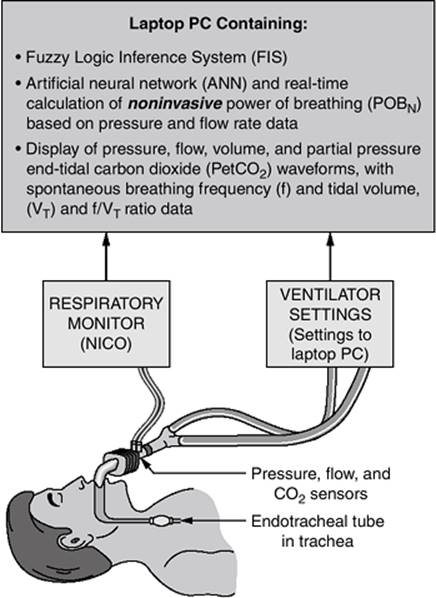
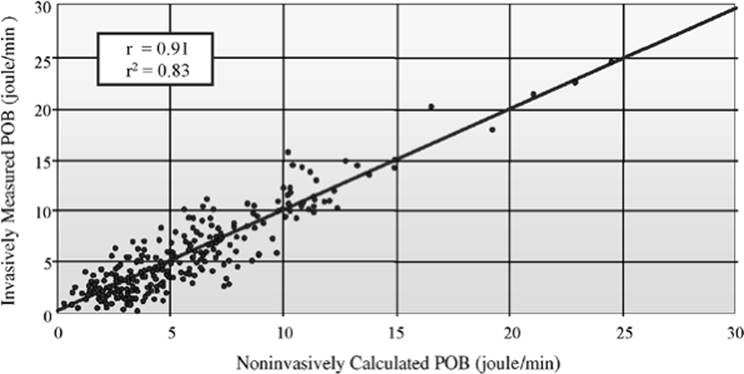
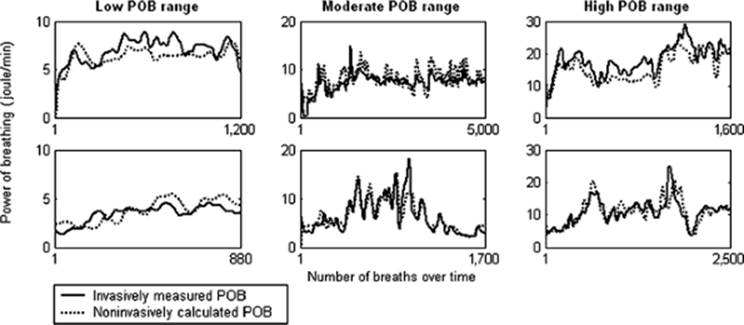
Power of breathing can be calculated noninvasively (POBN) with reasonable clinical accuracy for patients receiving ventilatory support by using an artificial neural network (ANN) (24). An ANN is a contemporary computational tool used for predicting, as in predicting a physiologic parameter for example. In one clinical study (24), data from an esophageal balloon catheter and airway pressure/flow sensor were used to measure POB invasively as defined above. A pretrained ANN provided real-time calculation of POBN. The ANN used five parameters, each readily determined from pressure and flow tracings obtained at the airway opening of an individual patient to predict POB (i.e., spontaneous minute ventilation, intrinsic positive end-expiratory pressure [PEEPi], inspiratory pressure trigger depth, inspiratory flow rise time, and Pmus) (Fig. 20.4). Invasive POB and POBN were measured at various levels of PSV, ranging from 5 to 25 cm H2O. POBN was highly correlated with invasive POB (r = 0.91, p <0.002) (Figs. 20.5 and 20.6). A Bland–Altman plot comparing POBN and invasive POB revealed that bias was zero and precision was clinically acceptable at 2.2.
|
|
|
Figure 20.3. Clinical method of measuring the patient's work of breathing (physiologic plus imposed work). Work is computed using the Campbell diagram, which relates the change in volume plotted over the change in esophageal pressure (inference of intrapleural pressure) during spontaneous inhalation (I) and exhalation (E). The change in volume is measured at the connection between the Y piece of the breathing circuit and the endotracheal tube with a miniature pneumotachograph (flow sensor). Esophageal pressure (Pes) is measured with an intraesophageal balloon positioned in the middle to lower third of the esophagus. The Pes–volume loop moves in a clockwise direction; the slope of the loop is lung compliance (CL). Chest wall compliance (CCW) is obtained previously by mechanically ventilating a relaxed patient. Under these conditions the Pes–volume loop moves in a counterclockwise direction (not shown); the slope of the loop is CCW. (This compliance value is stored in the monitor's computer memory and is used to construct the Campbell diagram.) Inspiratory resistive work of breathing includes the physiologic resistive work on the airways and the imposed resistive work on the endotracheal tube and ventilator breathing circuit (vertical lines). Elastic work of breathing is the triangular-shaped area subtended by the lung and chest wall compliance curves (diagonal lines). Total measured work of breathing, the sum of resistive and elastic work, is 1.5 J/L in this example. (From Banner MJ, Kirby RR, Gabrielli A, et al. Partially and totally unloading the respiratory muscles based on real time measurements of work of breathing: a clinical approach. Chest. 1994;106:1835.) |
This method obviates the need for inserting an esophageal balloon catheter, and thus greatly simplifies measurement of power of breathing. It could be fully automated into mechanical ventilators. POBNmay be a clinically useful tool for consideration when setting PSV to unload the respiratory muscles.
Loading Factors
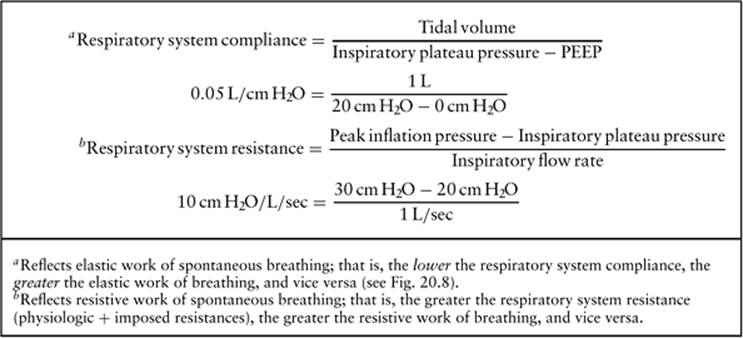
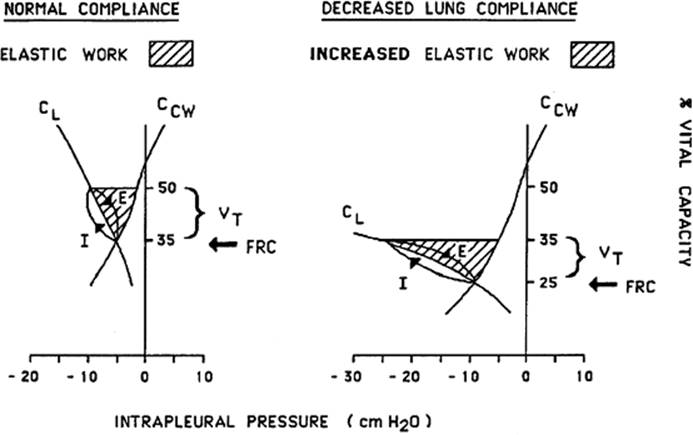
For healthy, asymptomatic individuals, the load on the respiratory muscles results from normal impedance (compliance and resistance) and ventilation loads (25). Increases in respiratory muscle loading result from a variety of physiologic and breathing apparatus factors. Physiologic factors include decreases in lung or chest wall compliance, or both, secondary to pulmonary abnormalities (Figs. 20.7 and 20.8, and Table 20.2) or bronchoconstriction, leading to peripheral, widespread narrowing of the airways that increase elastic and resistive loading, respectively. To assess these factors, respiratory system compliance and resistance can be measured with the patient attached to a ventilator.
|
|
|
Table 20.2 Calculations of respiratory system compliance and resistance (see Fig 20.7) |
Spontaneous inspiratory flow rate demand affects resistive POB directly. This relationship can be explained by an analogy of the Ohm Law of electricity (i.e., change in pressure equals inspiratory flow rate demand multiplied by airway resistance). Assuming a fairly constant airway resistance over a range of flow rates, increases in the patient's peak inspiratory flow rate demand result in greater changes in pressure. Because work = ∫ ∫Pes VT, a greater change in pressure with the same change in volume produces greater work per breath, and thus POB (17).
Minute Ventilation
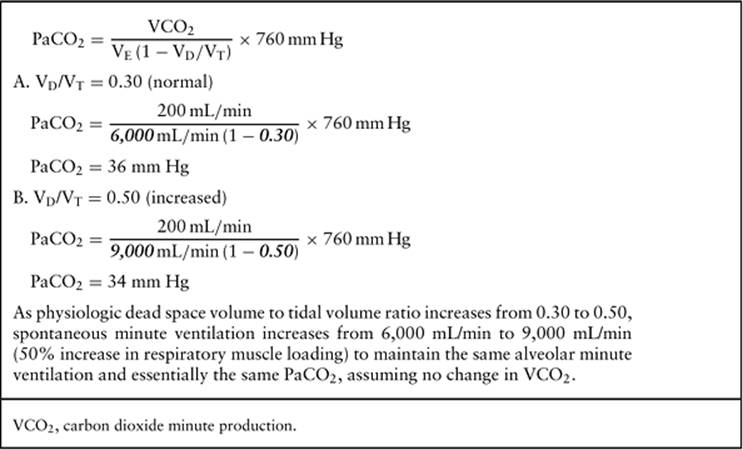
Increases in the VD/VT ratio and minute ventilation also are forms of respiratory muscle loading that lead to increased POB (25). Under both conditions, the respiratory muscle pump is forced to work harder per minute (power) to meet the metabolic demands and maintain appropriate oxygen and carbon dioxide exchange. Assuming no change in oxygen consumption and carbon dioxide minute production, an increase in VD/VT from 0.3 to 0.5, typical of adults with acute respiratory failure in my experience, requires the respiratory muscle pump to work proportionately harder by increasing exhaled minute ventilation by 50% to maintain the same alveolar minute ventilation and appropriate carbon dioxide elimination to control PaCO2 (Table 20.3).
|
|
|
Figure 20.4. Schematic representation of a patient with acute respiratory failure attached to a ventilator and connected to respiratory monitoring equipment (NICO, Respironics) containing an artificial neural network (ANN) for the noninvasive determination of power of breathing (POBN). |
Intrinsic Positive End-expiratory Pressure
Increased levels of PEEPi, or auto PEEP, as a result of increased expiratory airway resistance, inadequate exhalation time, or both, is another form of respiratory muscle loading. PEEPi must be counterbalanced by an equivalent change in alveolar pressure before air can flow into the lungs (26). Consider a patient with dynamic hyperinflation and a PEEPi level of 5 cm H2O breathing room air spontaneously. Intra-alveolar pressure must decrease by at least 6 cm H2O (instead of 1 cm H2O under normal conditions) so that alveolar pressure falls below ambient pressure. A pressure gradient between the mouth and alveoli must occur for air to flow into the lungs. Under these conditions, a greater decrease in pleural pressure is required than normal, and a greater POB results.
Breathing Apparatus
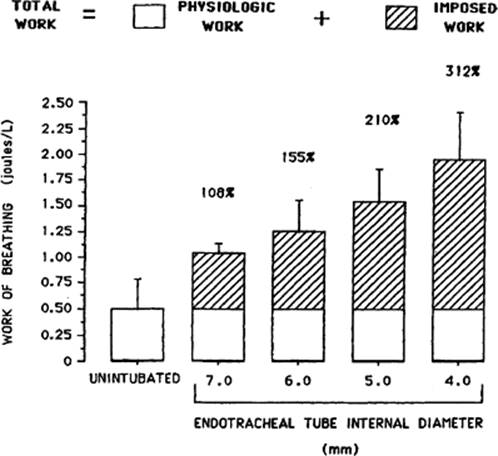
Several breathing apparatus factors affect the imposed work of breathing. The endotracheal tube is probably the most significant resistor in the breathing apparatus (11,12,27,28,29). Breathing through a narrow internal diameter endotracheal tube attached to a highly resistive demand-flow continuous positive airway pressure (CPAP) system requires a large change in pressure to move a specific volume. An increased resistive workload is imposed by the apparatus (30,31) (Fig. 20.9).
Ventilator Response Time and Automatic and Variable Inspiratory Pressure Assist
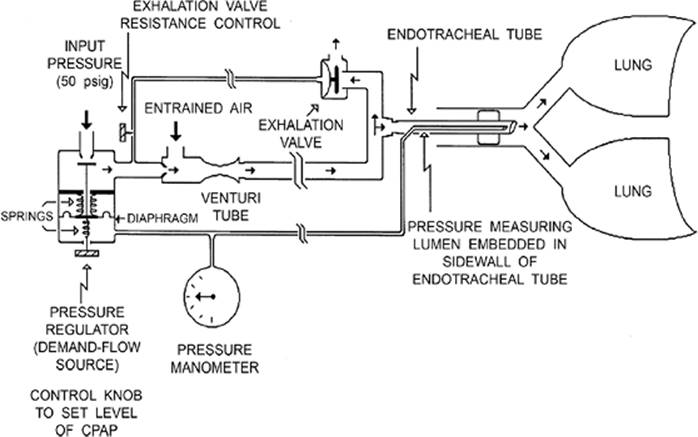
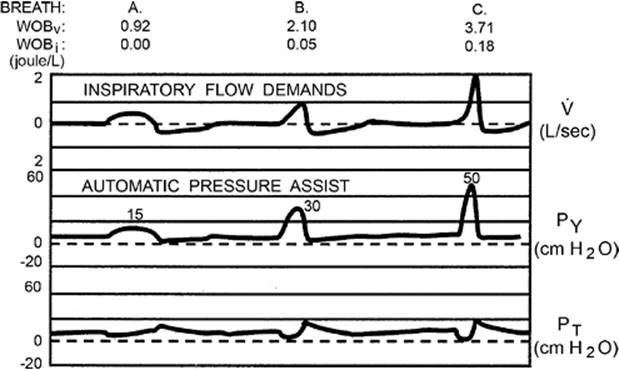
The response time of the ventilator (time delay from the initiation of spontaneous inhalation to the onset of flow in the airway) directly affects the imposed POB. It is partly affected by the method of triggering the system “on,” and partly by the ventilator's sensitivity/trigger setting. The response characteristics of a ventilator's demand-flow CPAP system are improved by moving the pressure-measuring/triggering site physically closer to the respiratory muscles (i.e., at the tracheal or carinal end of the endotracheal tube) (32). Significantly less imposed work results from pressure-triggering the system on at the carinal end of the endotracheal tube compared with the conventional method of pressure-triggering from inside the ventilator or using flow-by (flow-triggered) initiation (33,34). During spontaneous inhalation, automatic and variable inspiratory pressure assist results when using tracheal pressure rather than breathing-circuit Y-piece pressure to control the operation of the ventilator, which, in turn, acts to decrease imposed resistive work of breathing to nearly zero (35). This is described as a closed-loop tracheal pressure ventilator control system (Figs. 20.10 and 20.11).
|
|
|
Figure 20.5. Relationship between directly or invasively measured power of breathing requiring the use of an intraesophageal balloon catheter (y axis) and noninvasively predicted/calculated power of breathing (POB) (x axis) using the nonlinear multilayer Perceptron artificial neural network model is shown. A highly significant correlation (r = 0.91, p <0.002) between the two was found. The model was a very good predictor of POB as evidenced by the high value for the coefficient of determination, r2 = 0.83, p <0.002. (From Banner MJ, Euliano NR, Brennan V, et al. Power of breathing determined noninvasively using an artificial neural network in patients with respiratory failure. Crit Care Med. 2006;34:1052–1059.) |
|
|
|
Figure 20.6. Examples of trend plots of patients with low, moderate, and high values of power of breathing (POB) while treated with pressure support ventilation are shown. Two patients are shown in each category. Note that noninvasively predicted/calculated POB tracked in a nearly identical manner with invasively measured POB for all three categories of patients. The artificial neural network used for predicting/calculating POB appears to be accurate over wide ranges of POB as might be expected in clinical practice. (From Banner MJ, Euliano NR, Brennan V, et al. Power of breathing determined noninvasively using an artificial neural network in patients with respiratory failure. Crit Care Med. 2006;34:1052–1059.) |
With pressure-triggering from inside the ventilator or with flow-by triggering, an initial pressure drop across the endotracheal tube must be generated by the patient before flow is initiated. This effort results in significant increases in imposed work. By contrast, pressure-triggering at the carinal end of the endotracheal tube effectively decreases the resistance by the endotracheal tube during spontaneous inhalation, thus decreasing the imposed POB.
|
|
|
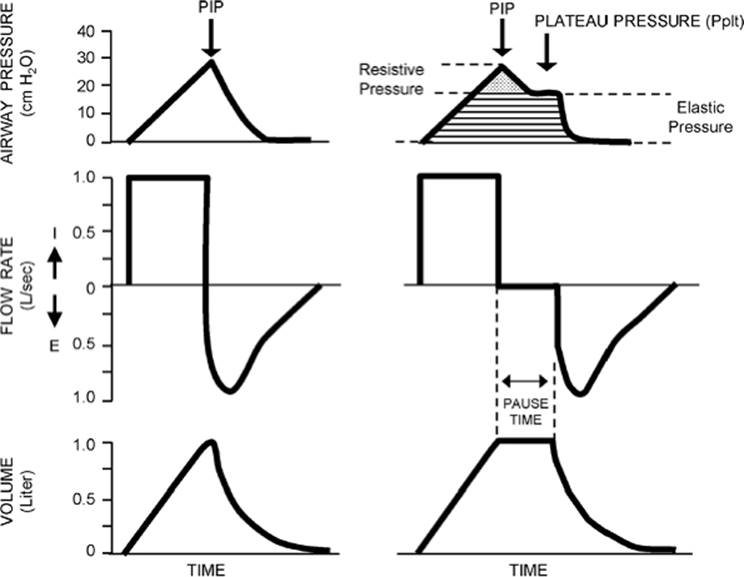
Figure 20.7. Pressure at the Y piece of the breathing circuit, referred to as “airway pressure”; flow rate during inhalation (I) and exhalation (E); and tidal volume are shown during a conventionally applied ventilator breath (left) and then using an end-inspiratory pause (EIP) (right). An EIP is used for the purpose of measuring respiratory system compliance (CRS) and resistance (RRS). The patient should be perfectly relaxed for these measurements. Peak inflation pressure (PIP) is the maximum pressure generated following tidal volume inhalation. At the end of the preselected EIP time, usually about 0.5 seconds, PIP decreases to the static elastic recoil pressure or plateau pressure (Pplt) of the respiratory system. PIP is the sum of the resistive (endotracheal tube and physiologic airways series resistance) and elastic pressures (lung and chest wall elastance). CRS and RRS are calculated based on these data (see Table 20.2). |
|
|
|
Figure 20.8. Elastic work of breathing varies inversely with lung compliance (CL). Functional residual capacity (FRC) is defined as the intersection of the lung and chest wall compliance (CCW) curves. Under conditions of normal lung compliance (left), a change in intrapleural pressure occurs accompanied by a change in tidal volume (VT) during spontaneous inhalation (I) and exhalation (E). The pressure–volume loop moves in a clockwise direction. Elastic work of breathing is the area indicated by the diagonal lines. Decreases in CL result in increased elastic work of breathing; notice flattened CL curve and increased elastic work area (diagonal lines) (right). In addition to decreased lung volume (decreased FRC), a greater change in intrapleural pressure is required to exchange a smaller tidal volume, a characteristic of acute respiratory failure. |
The sensitivity/trigger setting on the ventilator directly affects the imposed POB. At a higher setting, a greater change in pressure is required to trigger the system on, thereby increasing the POB (35).
Clinical Implications of Respiratory Muscle Loading
Fatigue
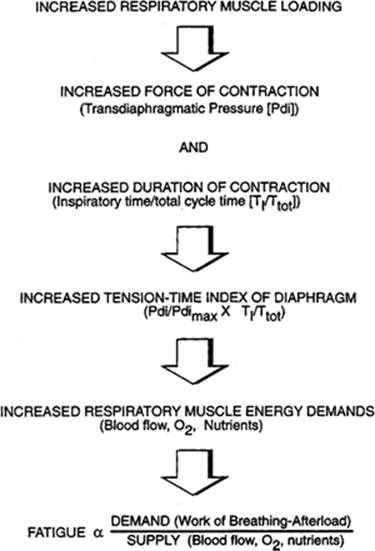
Increased respiratory muscle loading results in increases in the force and duration of diaphragmatic contraction, and leads to an increased tension-time index of the diaphragm (TTdi) (7). TTdi is the product of transdiaphragmatic pressure over the maximum transdiaphragmatic pressure (Pdimax) and the ratio of inspiratory time to total cycle time (TTdi = Pdi/Pdimax × TI/Ttot). The TTdi is similar to the tension-time index for the heart and gives a useful approximation of muscle energy demands (6,7). During spontaneous breathing, the change in transdiaphragmatic pressure is normally about 10 cm H2O and the TI/Ttot ratio is 0.33, effecting a TTdi of 0.03 (TTdi = 10 cm H2O/100 cm H2O × 0.33). With increased respiratory muscle loading, Pdi may increase to 30 cm H2O and TI/Ttot to about 0.5, resulting in a TTdi of 0.15. Breathing patterns with a TTdi of about 0.15 to 0.20 are called fatiguing to indicate that the diaphragm will, in time, fail (6,7). Presumably, when the demand of the diaphragm exceeds 0.15 to 0.20, sufficient energy supplies are not available (6,7). This threshold TTdi is related to the limitation of blood perfusion and oxygen delivery to the muscle (Fig. 20.12).
|
|
|
Table 20.3 Effect of increased physiologic dead space volume, as assessed by the dead space volume to tidal volume ratio (Vd/Vt), on exhaled minute ventilation (VE) |
|
|
|
Figure 20.9. Influence of endotracheal tube size on imposed and total work of breathing. Before intubating a group of piglets (N = 8; weight, approximately 10 kg), the mean physiologic work, as measured using the method described by Campbell, was 0.5 J/L. Subsequently, all animals breathed through endotracheal tubes of 7-, 6-, 5-, and then 4-mm internal diameter, which were sequentially inserted into their tracheas. Imposed work of the endotracheal tube (diagonally striped columns) is superimposed on the physiologic work (open columns), yielding the total work of breathing on the respiratory muscles. The narrower the endotracheal tube was, the greater the imposed and, thus, total work of breathing. Total work increased by 312% with the narrowest internal diameter endotracheal tube, predisposing to respiratory muscle fatigue. (From Widner L, Banner MJ. A method of decreasing the imposed work of breathing associated with pediatric endotracheal tubes [abstract]. Crit Care Med. 1992;20;S82.) |
Energy Supply and Demand
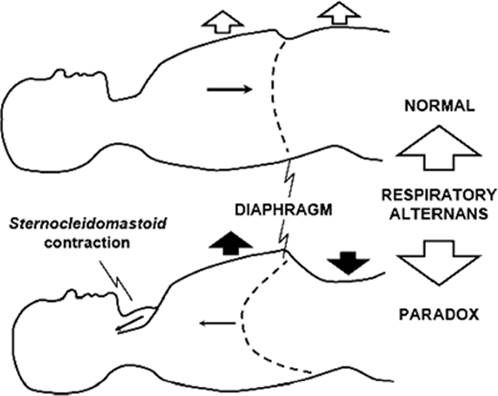
Respiratory muscle fatigue develops for the same reasons that one develops angina pectoris: Demand for energy exceeds the supply of energy (6,36). Energy supply refers to the proportion of cardiac output, blood perfusion, oxygen, and nutrients to the respiratory muscles that directly affect the synthesis of ATP. Respiratory muscle fatigue develops when ATP hydrolysis exceeds ATP synthesis as a result of an imbalance between energy supply and demand. Under conditions of increased muscle loading, respiratory muscle energy demands increase. Increases in muscle blood flow demand and oxygen consumption predispose to the development of muscle ischemia, fatigue, and respiratory failure (36,37). VT decreases and increases in dead space to VT ratio, and arterial carbon dioxide levels result when the respiratory muscles fail as force generators. Clinically, diaphragmatic fatigue is associated with abdominal paradox (abnormal inward movement of the diaphragm during spontaneous inhalation) and respiratory alternans (Fig. 20.13).
Breathing Pattern
Frequency
When pulmonary mechanics deteriorate, the respiratory muscles are loaded and POB increases. As a result, the breathing pattern changes (Table 20.4). These changes are vagally mediated by afferent or sensory fibers (load sensors) in the lungs and respiratory tract. Three types of afferent fibers modulate the breathing pattern: (a) slowly adapting receptors (SARs); (b) rapidly adapting receptors (RARs) (also termed deflation, cough, or irritant receptors), both of which are pulmonary stretch or mechanoreceptors; and (c) chemosensitive or C-fiber endings (38). SARs are found in the bronchial smooth muscle fibers, RARs are situated in the superficial layers of the respiratory tract mucosa, and C fibers are found in the airway epithelium (38).
|
|
|
Figure 20.10. Pneumatically powered tracheal pressure control (TPC) system employs closed-loop feedback control by using tracheal pressure from the carinal or distal end of the endotracheal tube to control system operation during spontaneous breathing. Inspiratory assist pressure provided at the Y piece of the breathing circuit is automatic and variable on demand during spontaneous inhalation. That is, the greater the patient's inspiratory effort demand-flow is, the lower the tracheal pressure signal, the more the pressure regulator (demand-flow valve) opens, and the greater the inspiratory pressure assist measured at the Y piece of the breathing circuit. The greater the pressure assist or pressure support ventilation–like effect is, the greater the work by the system to minimize imposed resistive work of breathing (see Fig. 20.11). Note: The exhalation valve closes during inhalation and opens partly during exhalation to function as a threshold resistor so as to maintain the preselected level of continuous positive airway pressure (CPAP). |
Central Nervous System Modulation
The mechanoreceptors monitor changes in pulmonary mechanics and thoracic gas volume (functional residual capacity) (39,40). After a decrease in lung compliance (increase in respiratory muscle load), an increase in discharge activity occurs. Similar responses result after increases in total resistance. C-fiber endings are activated by many substances produced in the lungs such as histamine, bradykinin, and some prostaglandins. Some sympathetic afferents also may be activated in response to increases in mechanical loads. Afferent discharge signals from the sensory fibers are directed by the vagus nerve to the central respiratory controllers in the central nervous system (CNS), modifying their output signals, which in turn modify the breathing pattern (3).
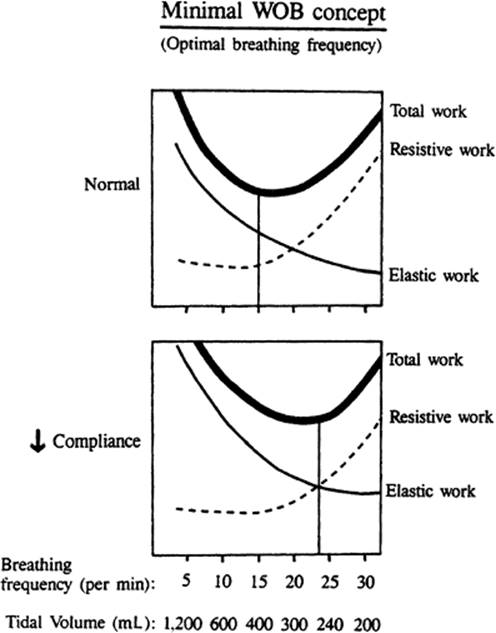
Stimulation of these receptors produces patterns of rapid, shallow breathing and an optimal breathing frequency to minimize large changes in intrapleural pressure (41). Patients with loaded respiratory muscles breathe at a faster rate and a smaller VT to minimize the POB, the so-called “minimal POB” or “least average force” concept, producing the most energy-efficient combination of breathing frequency and VT (17,41,42). When the frequency is too low, much elastic work is required to produce large VTs; when the frequency is too high, much resistive work is required (as well as useless work to ventilate the dead space with each breath) (17) (Fig. 20.14). This mechanism also functions to protect the respiratory muscles from exhaustive, fatiguing contractions that can lead to muscle fiber splitting, hemorrhage, and self-destruction (3).
|
|
|
Figure 20.11. Operation of the tracheal pressure control (TPC) system as shown in Figure 20.10 illustrates the automatic and variable inspiratory pressure assist to minimize imposed resistive work of breathing (WOBi). Data for work of breathing by the ventilator assisting inhalation (WOBv) are also shown. Peak inspiratory flow rate demands for breaths “A,” “B,” and “C” are 0.5, 1.0, and 2 L/second, respectively. TPC responds automatically by providing inspiratory assist in proportion with the demands at 15, 30, and 50 cm H2O, respectively, to decrease WOBi to nearly zero for all conditions. Breathing circuit pressure measured at the Y piece (PY), not pulmonary airway pressure as reflected by tracheal pressure (PT), is increased. The greater the patient's inspiratory flow rate demand is, the greater the inspiratory pressure assist to minimize WOBi, and vice versa. |
Inferred Work of Breathing
Spontaneous breathing frequency and tidal volume are used as inferences of the POB (43). An abnormal adult respiratory muscle workload is inferred when the spontaneous respiratory rate is greater than 25 to 30 breaths/minute; a breathing rate of 15 to 25 breaths/minute is inferred to mean that workload is tolerable and in a more normal range. These inferences, however, seem to be inaccurate and misleading with regard to the POB (44,45). Although patients breathing between 15 and 25 breaths/minute often demonstrate an apparently acceptable breathing pattern, the respiratory muscle workloads may vary from fatiguing to normal to zero (44,45).
|
|
|
Figure 20.12. Increased respiratory muscle loading and the subsequent effects leading to fatigue are shown. Fatigue is defined as loss of the force-generating capacity of the respiratory muscles. |
Inappropriate Respiratory Muscle Unloading when Using Conventional Method for Setting Pressure Support Ventilation
A primary goal of mechanical ventilatory support for spontaneously breathing patients with respiratory failure is reduction of excessive POB. Appropriate respiratory muscle unloading to decrease power of breathing is thought to be achieved by setting PSV using the following conventional method:
· Spontaneous breathing frequency 15 to 25 breaths/minute
· Tidal volume 6 to 8 mL/kg ideal body weight
· Absence of SCM contraction
· Appearance of breathing comfortably and no apparent anxiety or adverse cardiovascular effects
|
|
|
Figure 20.13. Abdominal paradox refers to the paradoxical inward movement of the abdomen during spontaneous inhalation (bottom). Normally, the abdomen moves outward during inhalation, like the chest (top). As diaphragmatic fatigue occurs (diaphragm fails as force generator), the diaphragm is no longer able to contract and move downward to displace the abdominal viscera and move the abdomen outward. The inward abdominal movement during inhalation is a response to the passive and cephalad diaphragmatic movement due to the negative intrathoracic pressure induced by contraction of accessory respiratory muscles like the sternocleidomastoid muscles, for example. Respiratory alternans is the manifestation of the alternating activity of the diaphragm and the intercostals and accessory respiratory muscles. When the diaphragm, working against a fatiguing load, fails, the accessory respiratory muscles assume a greater share of the work of breathing. Subsequently, when these muscles in turn fail, the diaphragm, now rested, resumes its activity and the cycle repeats. Hence, respiratory alternans is characterized by normal alternating with paradoxical breathing. These signs with tachypnea reflect early diaphragmatic fatigue and may actually precede acute hypercapnia. |
We evaluated the effects on respiratory muscle workloads using this method of applying PSV in 115 adults (55 males, 60 females, weight 81 ± 18 kg, age 55 ± 11 years) with varying degrees of respiratory failure from various etiologies (e.g., pneumonia, sepsis, trauma, congestive heart failure) (institutional review board [IRB] approved). A combined pressure/flow sensor, positioned between the endotracheal tube and Y piece of the ventilator, was directed to a respiratory monitor (NICO, Respironics and Convergent Engineering). The following were measured continuously after using the aforementioned method for setting PSV: POBN, spontaneous f and VT, and level of PSV. Patients were monitored for their entire time they were on ventilatory support. The intensive care unit (ICU) staff were blinded to measurements. POBN respiratory monitors were continuously checked by a research respiratory therapist who did not intervene with clinical management decisions. PSV was combined with intermittent mandatory ventilation (IMV) (6 ± 3/minute), PEEP (8 ± 4 cm H2O), and FIO2 (0.55 ± 0.15).
|
Table 20.4 Manifestations of loaded respiratory muscles and fatiguea |
||
|
||
|
|
||
|
Figure 20.14. Minimal work of breathing (WOB): Optimal breathing frequency concept as described by Otis (17) and Sant' Ambrogio and Sant' Ambrogio (41). Total WOB (thick line) consists of resistive (dashed line) and elastic work (thin line). Under normal conditions (top), patients adopt a breathing frequency and tidal volume combination, which corresponds to minimal total WOB; that is, for adults, an optimal breathing frequency and tidal volume are approximately of 12 to 15/minute and 500 mL, respectively. Elastic work is excessive at lower breathing frequencies and higher tidal volumes. Conversely, resistive work increases at higher breathing frequencies and lower tidal volumes. The body adopts a motion that strains it the least. Under conditions of decreased compliance (increased elastance), the respiratory muscles are loaded (bottom), and a breathing frequency of 12/minute and tidal volume of 500 mL are no longer optimal because elastic work, and thus total WOB, are increased. The optimal breathing frequency and tidal volume combination corresponding to minimal total WOB are a frequency of approximately 25/minute and a tidal volume of about 250 mL. Thus, a rapid, shallow breathing pattern is a compensatory, energy-efficient breathing strategy to minimize WOB. |
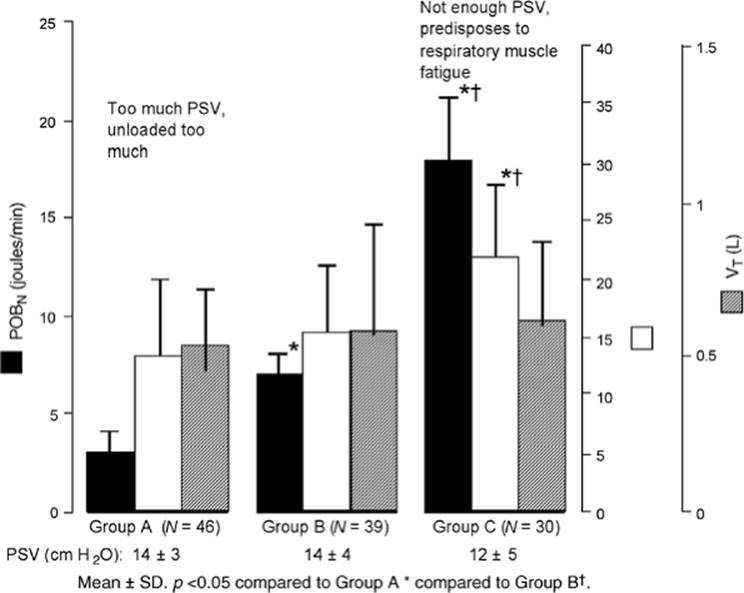
Patients were divided into three respiratory muscle workload groups: Group A: POBN <5 joules/minute; group B: POBN >5 and <10 joules/minute; and Group C: POBN >10 joules/minute. Data were analyzed using analysis of variance (ANOVA); α was set at 0.05. (Group A represents patients whose workload is negligible, predisposing to respiratory muscle disuse atrophy. Group B represents patients in a clinically appropriate range based on studying over 500 adults. Group C represents patients whose workload per minute may be in a fatiguing range.)
It was revealed that approximately the same level of PSV was applied to all groups (i.e., 12–14 cm H2O by setting PSV using the conventional method as previously defined). Although f and VT were in appropriate ranges most of the time for all groups, group A was unloaded too much, predisposing to the development of disuse atrophy (largest group); group C was not unloaded enough, predisposing to muscle fatigue; and group B (only 12% of patients) was unloaded appropriately (Fig. 20.15). For 66% of our patients (N = 76) whose level of PSV was set based on the conventional method of inferring workloads, the respiratory muscles were either unloaded too much or not unloaded enough. These findings support the need to include both respiratory muscle load (POBN) and tolerance (f, VT) measurements to ensure appropriate unloading when using PSV (i.e., a combined load and tolerance strategy is advocated).
We contend that the breathing pattern alone is not an accurate predictor of POB. The breathing pattern reflects tolerance for the load on the respiratory muscles, where POBN reflects the magnitude of the load. Both breathing pattern and POBN data should be used in a complementary manner when selecting a level of PSV to unload the respiratory muscles.
Data also suggest that the perceived inspiratory effort sensation during spontaneous breathing (how the patient feels, degree of comfort) is not related to the presence of fatiguing or nonfatiguing diaphragmatic contractions (46).
Decreasing Respiratory Muscle Loads (Power of Breathing)
Therapeutic Objectives
Objectives of therapy for loaded or fatigued muscles include the following: (a) decrease energy demand (POB), and (b) increase energy supply (oxygen, blood flow, and nutrient delivery) to the respiratory muscles. PSV is advocated to unload the respiratory muscles, decrease the POB, and decrease the energy demands of patients with decreased compliance and increased resistance (47,48). It also augments spontaneous breathing by potentially decreasing the work imposed by the resistance of the breathing apparatus to zero (10,28).
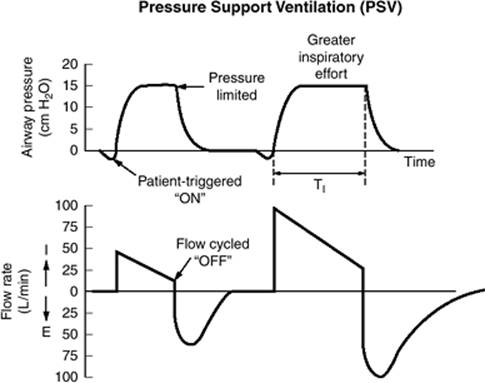
In the PSV mode, the ventilator is patient-triggered on, and an abrupt rise in airway pressure to a preselected positive pressure limit results from a variable flow rate of gas from the ventilator. As long as the patient maintains an inspiratory effort, airway pressure is held constant at the preselected level. Gas flow rate from the ventilator ceases when the patient's inspiratory flow rate demand decreases to a predetermined percentage of the initial peak mechanical inspiratory flow rate (e.g., 25%). The ventilator is thus flow-cycled “off” in the PSV mode.
Once the preselected inspiratory pressure limit is set, the patient interacts with the pressure-assisted breath and retains control over inspiratory time and flow rate, expiratory time, breathing rate, VT, and minute volume (Fig. 20.16). Patient work decreases, and ventilator work increases at incremental levels of PSV (21,27). Decreasing the load on a muscle to an appropriate level decreases the force and duration of muscle contraction (tension-time index) (6), energy demand, muscle ischemia, and fatigue. For a patient with increased respiratory muscle load or POB (e.g., 15 joules/minute), a clinician may also unload the respiratory muscles to a more appropriate range, which appears to be about 5 to 10 joules/minute using PSV. This range is based on studying over 500 adults treated with PSV.
|
|
|
Figure 20.15. Noninvasively measured power of breathing (POBN), spontaneous breathing frequency (f) and tidal volume (VT), and level of pressure support ventilation (PSV) for three groups of patients based on their range of POBN. PSV was set based on evaluation of f, VT, accessory muscle use, and appearance of breathing comfortably with no apparent anxiety or adverse cardiovascular effects. The level of PSV applied to all groups was about the same at 12 to 14 cm H2O. Although f and VT were within clinically acceptable ranges for all groups, the respiratory muscle workloads as assessed by POBN were significantly different. Group A patients received too much PSV and were unloaded too much, predisposing to disuse respiratory muscle atrophy. Group B patients were unloaded in an appropriate clinical range (about 5–10 joules/minute). Group C patients did not receive enough PSV and were not unloaded enough, predisposing to respiratory muscle fatigue. |
|
|
|
Figure 20.16. Airway pressure and flow waveforms are depicted for pressure support ventilation (PSV). After the ventilator is patient-triggered “on,” an abrupt rise in pressure ensues to a preselected limit, and a decelerating inspiratory flow waveform results. When the inspiratory flow rate decreases to a predetermined percentage of the initial peak inspiratory flow rate (e.g., 25%), the ventilator flow cycles “off.” On the right, a greater inspiratory effort, a longer inspiratory time (TI), and higher peak inspiratory flow rate demand are illustrated at the same level of PSV. The clinician sets the level of PSV, while the patient interacts with the pressure-supported breath and retains control over breathing rate, TI, flow rate, and tidal volume. |
Partial and Total Respiratory Muscle Unloading
The level of PSV may be set to partially or totally unload the respiratory muscles (21,48,49). During partial unloading, PSV is increased until the patient's POB is decreased to a tolerable range. My goal usually is 5 to 10 joules/minute, an appropriate range for physiologic POB. During inhalation with PSV, positive pressure actively assists lung inflation. A portion of the POB is provided, relieving and unloading the respiratory muscles of the increased workload, and decreasing the force and duration of muscle contraction. Work is performed in part by the patient and in part by the ventilator (i.e., a work-sharing approach). Partial respiratory muscle unloading is appropriate to provide a nonfatiguing workload and promote muscle conditioning.
Titration of Pressure Support Ventilation
The level of PSV may be set to provide appropriate, or optimal, respiratory muscle loads. The exact level of this load is not known, but some authorities suggest that near-normal workloads are well tolerated (21,50). In a carefully done study, Brochard et al. (50) report that at a PSV of approximately 15 cm H2O, an optimal muscle load corresponded to a patient work of breathing of 0.52 ± 0.12 joules/L. (This is proportional to a POB range of 5–10 joules/minute.) An optimal load was defined as that which maintained maximal diaphragmatic electrical activity without fatigue (specifically, the lowest level of PSV at which no reduction in the ratio of high- to low-frequency components of the diaphragm's electromyographic signal occurred). A reduction of 80% or less of the initial high/low ratio is defined as incipient diaphragmatic fatigue (51).
Patient Characteristics
Physiologic patient characteristics should also be considered. Weak, malnourished, and chronically ill patients will not tolerate normal workloads as well as physically powerful individuals with short-term illness. The latter patients may be able to generate twice the normal work range without developing fatigue. Because the tolerance may vary, setting the level of PSV so that the POB is in an appropriate range of 5 to 10 joules/minute is a reasonable initial guideline (24).
Available evidence suggests that total unloading, allowing fatigued respiratory muscles to rest and recover, is appropriate (4,6,52). The time for respiratory muscle recovery after chronic fatigue is estimated to be at least 24 hours (6). A reasonable approach is to totally unload the respiratory muscles of such patients for approximately 24 hours by using high levels of PSV (e.g., >30 cm H2O). Subsequently, when appropriate, PSV may be decreased so that the patient POB is in a normal, tolerable range and the respiratory muscles are partially unloaded (27).
My experience and that of others (14) suggests that all intubated, spontaneously breathing patients in respiratory failure should receive a minimal level PSV that reduces imposed POB to zero (Figs. 20.2 and 20.2A) (10). Additional PSV may be required to decrease the abnormally high physiologic work associated with the disease process to a normal level (21). Subsequently, as the patient's respiratory status improves, PSV may be decreased while ensuring that the POB is in a nonfatiguing range. PSV should not be decreased to zero or below the level required to decrease imposed work to zero. To do so functionally reloads the respiratory muscles and risks fatigue. Extubation at the level of PSV results in zero imposed POB; that is, about 10 cm H2O for most adults seems reasonable.
|
Table 20.5 NONINVASIVE power of breathing (POBN) in relation to typical variables used when considering extubation and removal from ventilatory support |
||||||||||||||||||||||||||||||||||||||||||||||||||||||
|
||||||||||||||||||||||||||||||||||||||||||||||||||||||
Power of Breathing as a Criterion for Extubation
POB, the rate at which work is done per minute, is a better assessment of respiratory muscle workload than work of breathing per breath because it is a measure over time, not for an individual breath. Spontaneous breathing f, VT, f/VT ratio, minute ventilation (MV), PaO2/FIO2 ratio, PaCO2, and SCM use are used typically when evaluating a patient's readiness for extubation. We hypothesized that POB may be another parameter for predicting successful extubation. To test this hypothesis, we studied adults with respiratory failure who were candidates for extubation.
We evaluated 25 adults (15 males, 10 females, age 56 ± 19 years, weight 80 ± 25 kg) in an IRB-approved study where POB was measured in real time and noninvasively (POBN), without the need of an esophageal balloon, using a monitor (NICO, Respironics, Convergent Engineering) (1). Data from a combined pressure/flow sensor, positioned between the endotracheal tube (sizes ranged from 6–8 mm internal diameter) and ventilator circuit, were directed to the monitor. All patients were studied immediately prior to extubation using minimal ventilator settings (intermittent mandatory ventilation 0 per minute, pressure support ventilation 10 cm H2O, continuous positive airway pressure 5 cm H2O, and FIO2 0.4). An arterial blood gas was obtained. Data were analyzed using a Mann-Whitney U test; α was set at 0.05 for statistical significance.
It was found that POBN ranged from 2 to 10 joules/minute for patients successfully extubated (N = 20) and 10 to 23 joules/minute for those failing extubation (N = 5), requiring reintubation and ventilatory support. POBN was significantly lower, and related breathing parameters were significantly different for patients successfully extubated (Table 20.5).
POBN values >10 joules/minute were associated with failed extubation. A critical value for POBN to predict successful extubation may be about 10 joules/minute (53). A larger sample size is needed to thoroughly evaluate these pilot data findings for determining a critical value. POBN data coincided with typically used breathing parameters for assessing readiness for extubation; that is, when f, VT, f/VTratio, PaO2/FIO2 ratio, and PaCO2 data were clinically acceptable, and in the absence of SCM activity, patients were successfully extubated. It appears that POBN may be a parameter to consider for predicting extubation from ventilatory support.
Noninvasive Power of Breathing for Weaning
Maintaining patients in a normal POBN range may be appropriate when the decision to “wean to extubation” is not contemplated and spontaneous ventilation is allowed. Under this ventilatory support condition, PSV can be applied to maintain POBN in a normal range and low IMV rates are applied, assuming the patient is hemodynamically stable. Still others may need to have their respiratory muscles totally unloaded, requiring high levels of PSV (>20 cm H2O).
When the decision is made to “wean to extubation,” a patient's respiratory muscle endurance and ventilatory reserve need to be probed. The PSV level may be set to maintain POBN at about 5 to 10 joules/minute so as to assess the patient's workload tolerance. It is not so much the amount of POBN performed; rather, a patient's ability to tolerate a specific respiratory muscle workload is the important concept. When assessing workload tolerance, it has been reported that breathing pattern parameters (f, VT, f/VT ratio, MV, accessory respiratory muscle use) do not always correlate, and are not good predictors of work of breathing. It is not implied that breathing pattern parameters should be ignored. On the contrary, these parameters provide useful diagnostic information and should be used. POBN and breathing pattern data should be used in a complementary manner when assessing respiratory muscle workload tolerance (54).
The aforementioned range of POBN levels appears appropriate for patients with acute forms of respiratory failure and need to be evaluated in patients with chronic forms of respiratory failure, as in chronic obstructive pulmonary disease (COPD).
Multiple Noninvasive Power of Breathing Range Concept
1. Initial phases of ventilatory support
A. Maintain POBN in a low range (0–2 joules/minute) for patients whose respiratory muscles are fatigued—total unloading (about 24 hours) promotes respiratory muscle rest and recovery.
B. Maintain POBN in a normal range (5–10 joules/minute) when allowing spontaneous breathing—use when the patient is weak and still has substantial pulmonary disorders.
2. Weaning phase of ventilatory support
Probe the patient's reserve by maintaining POBN at a higher range (up to 12 joules/minute). This allows for a relatively prolonged assessment of a patient's respiratory muscle tolerance and endurance.
Summary
Respiratory muscle loads of intubated patients receiving ventilatory support may be visualized as a continuum; muscles at one end are highly loaded and at the other end are totally unloaded, predisposing to fatigue and atrophy, respectively. The terms, nosocomial respiratory failure and iatrogenic ventilator dependency (14), describe the inappropriate prolongation of ventilatory support. This problem may result from respiratory muscle fatigue (caused by increased muscle loading from breathing through a highly resistive apparatus, increased physiologic work, or insufficient ventilatory support) or muscle atrophy (as a result of total unloading of respiratory muscles by too high levels of PSV) (14).
With either fatigue or atrophy, the respiratory muscles become weak, failing as force generators. Hypoventilation, hypercapnia, and failure to wean often result, thus prolonging the need for ventilatory support. Fatigue or atrophy can occur, in part, from lack of assessing and adjusting respiratory muscle afterload, thereby failing to perceive their often subtle onset. Measurement of the POBN provides objective and tested data that can be used to set ventilator modes such as PSV to prevent either occurrence, and may expedite eventual weaning and extubation.
References
1. Roussos C, Macklem P. The respiratory muscles. N Engl J Med. 1982;307:786.
2. De Troyer A. Respiratory muscles. In: Crystal RG, West JB, eds. The Lung: Scientific Foundations. New York: Raven Press; 1991:869.
3. Roussos C. Function and fatigue of respiratory muscles. Chest. 1985;88:5124.
4. Braun NMT, Faulkner J, Hughes RL. When should respiratory muscles be exercised? Chest. 1983;84:76.
5. Vander AJ, Sherman JH, Luciano DS. Human Physiology. 5th ed. New York: McGraw-Hill; 1992:283.
6. Grassino A, Macklem PT. Respiratory muscle fatigue and ventilatory failure. Ann Rev Med. 1984;35:625.
7. Jenkins FH, Olsen GN. Chronic obstructive lung disease and acute respiratory failure. In: Klein EF, ed. Acute Respiratory Failure: Problems in Critical Care. Vol 1, no 3. Philadelphia: JB Lippincott; 1987:466.
8. Milic-Emili J. Work of breathing. In: Crystal RG, West JB, eds. The Lung: Scientific Foundations. New York: Raven Press; 1991:1065.
9. Banner MJ, Jaeger MJ, Kirby RR. Components of the work of breathing and implications for monitoring ventilator-dependent patients. Crit Care Med. 1994;22:515.
10. Banner MJ, Kirby RR, Blanch PB. Decreasing imposed work of the breathing apparatus to zero using pressure support ventilation. Crit Care Med. 1993;21:1333.
11. Bersten All, Rutten AJ, Vedig AE. Additional work of breathing imposed by endotracheal tubes, breathing circuits, and intensive care ventilators. Crit Care Med. 1989;17:671.
12. Bolder PM, Healy EJ, Bolder AR. The extra work of breathing through adult endotracheal tubes. Anesth Analg. 1986;65:853.
13. Kirton O, Banner MJ, Axelrod A. Detection of unsuspected imposed work of breathing: case reports. Crit Care Med. 1993;21:790.
14. Civetta JM. Nosocomial respiratory failure or iatrogenic ventilator dependency. Crit Care Med. 1993;21:171.
15. Kirton OC, DeHaven B, Morgan J, et al. Endotracheal tube flow resistance and elevated imposed work of breathing masquerading as ventilator weaning intolerance [abstract]. Chest. 1993;104S:133S.
16. Banner MJ, Kirby RR, Blanch PB. Site of pressure measurement during spontaneous breathing with continuous positive airway pressure: effect on calculating imposed work of breathing. Crit Care Med. 1992;20:528.
17. Otis AB. The work of breathing. In: Fenn WO, Rahn H, eds. Handbook of Physiology: A Critical, Comprehensive Presentation of Physiological Knowledge and Concepts. Section 3: Respiration. Washington, DC: American Physiological Society; 1964:463.
18. Baydur A, Behrakis P, Zin WA. A simple method for assessing the validity of the esophageal balloon technique. Am Rev Respir Dis. 1982;126:788.
19. Campbell EJM. The Respiratory Muscles and the Mechanics of Breathing. Chicago: Year Book Medical Publishers; 1958.
20. Agostoni E, Campbell EJM, Freedman S. Energetics. In: Campbell EJM, Agostoni E, Davis JN, eds. The Respiratory Muscles: Mechanics and Neural Control. Philadelphia: WB Saunders; 1970:115.
21. Banner MJ, Kirby RR, Gabrielli A, et al. Partially and totally unloading the respiratory muscles based on real time measurements of work of breathing: a clinical approach. Chest. 1994;106:1835.
22. Zapletal A, Samanek M, Paul T. Lung Function in Children and Adolescents. New York: S Karger Publishers; 1987.
23. Nelcor. Puritan Bennett 840 Operations and Technical Reference Manual. Addendum, PAV+ option. Carlsbad, CA: Nelcor; 2006:20–23.
24. Banner MJ, Euliano NR, Brennan V, et al. Power of breathing determined non-invasively using an artificial neural network in patients with respiratory failure. Crit Care Med. 2006;34:1052–1059.
25. Maclntyre NR, Leatherman NE. Mechanical loads on the ventilatory muscles. Am Rev Respir Dis. 1989;139:968.
26. Marini JJ. Breathing effort and work of breathing during mechanical ventilation. In: Banner MJ, ed. Positive-Pressure Ventilation: Problems in Critical Care. Vol. 4, no. 2. Philadelphia: JB Lippincott; 1990:184.
27. Brochard L, Rua F, Lorino H. Inspiratory pressure support compensates for the additional work of breathing caused by the endotracheal tube. Anesthesiology. 1991;75:739.
28. Fiastro JF, Habib MP, Quan SF. Pressure support compensates for inspiratory work due to endotracheal tubes and demand continuous positive airway pressure. Chest. 1988;93:499.
29. Shapiro M, Wilson RK, Casar G. Work of breathing though different sized endotracheal tubes. Crit Care Med. 1986;14:1028.
30. LeSouef PN, England SJ, Bryan AC. Total resistance of the respiratory system in preterm infants with and without an endotracheal tube. J Pediatr. 1984;104.
31. Widner L, Banner MJ. A method of decreasing the imposed work of breathing associated with pediatric endotracheal tubes [abstract]. Crit Care Med. 1992;20:S82.
32. Kacmarek RM, Shimada Y, Ohmura A. Optimizing mechanical ventilatory assist tube. J Pediatr. 1984;104:108.
33. Banner MJ, Blanch PB, Kirby RR. Imposed work of breathing and methods of triggering a demand-flow, continuous positive airway pressure system. Crit Care Med. 1993;21:183.
34. Messinger G, Banner MJ, Gabrielli A, et al. Tracheal pressure triggering a demand-flow CPAP system decreases work of breathing [abstract]. Anesthesiology. 1994;81:A272.
35. Banner MJ, Blanch PB. Gabrielli A. Tracheal pressure control provides automatic and variable inspiratory pressure assist to decrease imposed resistive work of breathing. Crit Care Med. 2002;30:1106–1111.
36. Tobin MJ, Skorodin M, Alexis CG. Weaning from mechanical ventilation. In: Taylor RW, Shoemaker WC, eds. Critical Care: State of the Art. Vol. 12. Fullerton, CA: Society of Critical Care Medicine; 1991:373.
37. Bellemare F, Wight D, Lavigne CM, et al. Effect of tension and timing of contraction on blood flow of the diaphragm. J Appl Physiol. 1983;54:1597.
38. Cohen CA, Zagelbaumm G, Gross D, et al. Clinical manifestations of inspiratory muscle fatigue. Am J Med. 1982;73:308.
39. Barnes PJ. Neural control of airway smooth muscle. In: Crystal RG, West JB, eds. The Lung: Scientific Foundations. New York: Raven Press; 1991:903.
40. Sant' Ambrogio G, Sant' Ambrogio FB. Reflexes from the airway, lung, chest wall, and limbs. In: Crystal RG, West JB, eds. The Lung: Scientific Foundations. New York: Raven Press; 1991:1383.
41. Sant' Ambrogio G. Information arising from the tracheobronchial tree of mammals. Physiol Rev. 1982;62:531.
42. Otis AB, Fenn WO, Rahn HL. Mechanics of breathing in man. J Appl Physiol. 1950;2:592.
43. Maclntyre NR. Weaning from mechanical ventilatory support: volume-assisting intermittent breaths versus pressure-assisting every breath. Respir Care. 1988;33:121.
44. Banner MJ, Kirby RR, Kirton OC, et al. Breathing frequency and pattern are poor predictors of work of breathing in patients receiving pressure support ventilation. Chest. 1995;108:1338.
45. Kirton O, Banner MJ, DeHaven CB, et al. Respiratory rate and related assessments are poor inferences of patient work of breathing [abstract]. Crit Care Med. 1993:S242.
46. Silas SL, Simpson SQ, Levy H. Rapid shallow breathing index does not correlate with airway occlusion pressure or work of breathing [abstract]. Chest. 1993;104:1305.
47. Bradley TD, Chartrand DA, Fitting JW, et al. The relation of inspiratory effort sensation to fatiguing patterns of the diaphragm. Am Rev Respir Dis. 1986;134:1119.
48. Maclntyre NR. Respiratory function during pressure support ventilation. Chest. 1986;89:677.
49. Maclntyre NR, Nishimura M, Usada Y. The Nogoya conference on system design and patient-ventilator interactions during pressure support ventilation. Chest. 1990;97:1463.
50. Brochard L, Had A, Lorino H. Inspiratory pressure support prevents diaphragmatic fatigue during weaning from mechanical ventilation. Am Rev Respir Dis. 1989;139:513.
51. Gross D, Grassino A, Ross WRD, et al. Electromyogram pattern of diaphragmatic fatigue. J Appl Physiol. 1979;46:1.
52. Murciano D, Aubier M, Lecoguie Y, et al. Effects of theophylline on diaphragmatic strength and fatigue in patients with chronic obstructive pulmonary disease. N Engl J Med. 1984;311:349.
53. Bonett S, Banner MJ, Euliano NR, et al. Power of breathing as a predictor of for extubation from ventilatory support [abstracted]. Respir Care. 2005;50:1521.
54. Gabrielli A, Lyon AJ, Euliano N, et al. Respiratory monitor recommends appropriate pressure support ventilation settings to unload respiratory muscles [abstracted]. Crit Care Med. 2006;33:A113.