Johannes H. van Oostrom
Brian Fuehrlein
Richard J. Melker
Pulse oximetry is a standard of care and is ubiquitous in operating rooms, inpatient hospital wards, physicians' offices, and emergency medical service (EMS) transport units. Obtaining an oxygen saturation noninvasively from a pulse oximeter probe is often the first step in the decision-making process of caring for a patient.
History
Stokes (1) reported that the colored substance in blood carries oxygen. This was followed by Hoppe-Seyler (2), who first crystallized this substance and coined the term hemoglobin. Additionally, it was shown that the pattern of light absorption changes when shaken with air (2).
Hertzman (3) described using photoelectric plethysmography of fingers and toes as a dynamic analysis of the peripheral circulation. The device consisted of a beam of light directed from an ordinary automobile headlight bulb on the finger or toe placed above a shielded photoelectric cell of the photoemissive type, purchased from the radio trade. The photoelectric oscillations with variations in the blood content of the digit were recorded by a string galvanometer or suitable oscillograph after amplification. Movements of the arm were minimized as transmission to the finger would compromise the reading; a comfortable saddle or sling was necessary to secure the arm to achieve the desired muscle relaxation that affects finger volume. This method was also used over the nasal septum, and the values were compared.
Millikan et al. (4) first coined the term oximeter and described a method for the continuous measurement of arterial saturation. A small unit placed over the shell of the ear contained a lamp, two color filters, and two barrier-type, light-sensitive cells, with which the transmission of either green or red light was measured. The green reading was dependent on how much total hemoglobin was between the lamp and the photocell, and was used to measure the degree of vasodilation, or “blood thickness” in the ear. This enabled one to choose the correct direct reading calibration scale for the estimation of arterial oxygen saturation, as measured in the red reading. This method has an accuracy of 5% in the top half of its range and 8% in the bottom half. In 1942, Goldie (5) developed a device for the continuous measurement of oxygen saturation of circulating blood in humans.
These devices led to Wood and Geraei (6), who improved upon these to develop a method for photoelectric determination of arterial oxygen saturation in humans. Prior instruments were required to be preset to known arterial saturation values, and could not be conveniently used in patients who had arterial hypoxia, nor could they be used for the actual determination of arterial oxygen saturation. The older devices could only be used for qualitative changes in saturation. As a result of these shortcomings, Wood and Geraei (6) developed a device that could measure, and follow continuously, the absolute value of arterial oxygen saturation from a pickup unit attached to the pinna of the human ear. This new design consisted of a photoelectric earpiece that allowed simultaneous measurement of the transmission of red and near-infrared light through either the normal heat-flushed ear or the bloodless ear. Then, by calculation, the light transmission of the blood alone in these spectral regions could be determined, and in turn the percentage of oxygen saturation of this blood content could be derived. While this device was used in clinical physiologic laboratories, its use did not spread.
After this promising beginning, oximetry research went dormant until 1972, when Aoyagi (7) began his work. Aoyagi and his group wanted to build upon the theories and success of the Wood oximeter, and created a dye densitometry method in which two wavelengths of light were used; the ratio of the two optical densities was calculated to obtain a dye curve. This curve was expected to correspond to dye concentrations in blood. It was during this series of experiments that the importance of the pulsatile variations was first reported. After investigating the effect of this pulsatile component, using mathematical analysis of the Beer-Lambert law, it was concluded that calculating the ratio of two optical densities compensates for the pulsations. It was at this point that Aoyagi derived three main conclusions:
1. If the optical density of the pulsating portion is measured at two appropriate wavelengths and the ratio of the optical densities is obtained, the result must be equivalent to Wood's ratio.
2. With this method, arterial blood is selectively measured, and the venous blood does not affect the measurement. Therefore, the probe site is not restricted to the ear.
3. With this method, the reference for optical density calculation is set for each pulse. Therefore, an accidental shift of probe location introduces a short artifact and quick return to normal measurements.
Continuing his work on oximeters until 1975, Aoyagi had, by 1975, developed a technique very similar to modern-day pulse oximeters. Two wavelengths of light, 630 nm and 900 nm, were chosen. From the transmitted light intensity data, the pulsation amplitude (AC) and the total intensity (DC) were obtained, and the ratio, AC/DC, was calculated. This ratio was obtained at both wavelengths of light to create a ratio of ratios that corresponded to SaO2.
In 1980, Minolta developed OXIMET using two optical fibers and precision optics. They adopted the finger as the probe site and proved that pulse oximetry was accurate (7). Nellcor followed this in 1983 with development of the N-100. This was a convenient pulse oximeter that used high-performance light-emitting diodes (LEDs), a highly sensitive and accurate photodiode, and a microcomputer. These technologic advances led to the widespread clinical use of pulse oximeters in the 1980s.
As pulse oximeters have continued to improve, active research is being conducted in several key areas:
· Accuracy as it relates to optimum alarm-level setting
· A quick response time to desaturation
· Eliminating the problems associated with weakened pulses
· Eliminating motion artifact (7)
Theory
Oximetry is based on the Beer-Lambert law of optical wavelength-dependent absorption of light energy. The Beer-Lambert law describes that light intensity (I) decreases exponentially when transmitted through a measurement compartment. The rate of the exponential decrease depends on the concentration of material inside the measurement compartment (C) and a wavelength-dependent absorption coefficient (a). In addition, the decrease depends on the optical pathlength (L) of the compartment:
![]()
For simplicity, we can define absorbance (A) as:
![]()
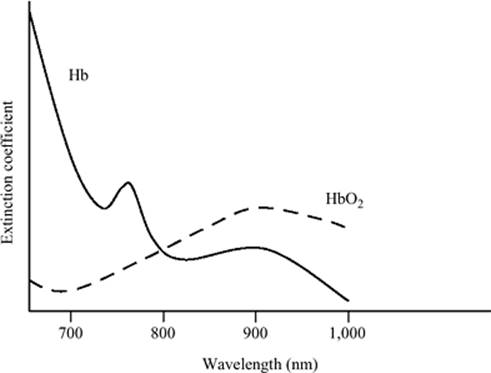
The wavelength-dependent absorption coefficient (a) varies by wavelength of the emitted light, and depends on the material the light is transmitted through. Since we are interested in oxygenated hemoglobin and reduced hemoglobin, we can study the magnitude of those absorption coefficients. Figure 21.1 shows these data.
If we define Co as the relative concentration of oxygenated hemoglobin (compared to the total amount of hemoglobin) and Cr as the relative concentration of reduced hemoglobin, we can then define the total absorbance of light at a given wavelength as:
![]()
where W is the weight of hemoglobin per unit volume. Note that Co + Cr = 1.0.
In Figure 21.1, it is seen that at a wavelength of 805 nm, the coefficient for oxygenated hemoglobin (ar) equals the coefficient for reduced hemoglobin (ar). A measurement at this wavelength will give us a value for WL:
![]()
If we now measure at any other wavelength, we can solve an equation for the relative concentration of oxygenated hemoglobin (Co):
![]()
All the absorption coefficients a are constants that depend on the physical media and wavelength. We can thus group those together and rewrite this equation as:
![]()
|
|
|
Figure 21.1. Absorption versus wavelength changes for oxygenated hemoglobin (HbO2) and reduced hemoglobin (Hb) |
This shows that we can measure the relative concentration of oxygenated hemoglobin by looking at the ratio of the absorbance (which we can measure) and adjusting with some known constants.
While in the laboratory setting we can tightly control the pathlength, L, and use a laser light at exactly 805 nm, this is not true in an in vivo setting. If we want to apply this method to a sensor that emits light through a finger or earlobe, there are significant issues to consider.
For example, if we use a finger as our measurement compartment, Eq. 2 will generally hold, but we need to add the absorption of other materials in the finger:
![]()
Since we are only interested in Aarterial, the other absorbance values need be eliminated. This can be done by taking the time derivative of Atotal. The time derivative of the venous and tissue components will be zero. The pulsatile part of Atotal is the arterial component, and the time derivative will be nonzero; this is where the “pulse” in pulse oximetry comes from: It analyzes only the pulsatile portion of the absorbance.
When using a finger sensor, we do not have the ability to choose any wavelength we want. Generally, LEDs are used, which can only be made in a limited number of wavelengths. Wavelengths that are typically used are 660 nm (red light) and 910 nm (infrared light). We can then define a ratio, R, as the ratio of the derivative of absorbances at two different wavelengths:
![]()
Applying similar logic as in the 805-nm case, we can derive an equation for Co:
![]()
where constants k are a combination of the (oxygenated and reduced) absorption coefficients a at the two wavelengths. While these coefficients are only dependent on the physical optical properties of hemoglobin, in practice, the constants k in Eq. 9 are determined empirically by pulse oximeter manufacturers, and are generally unpublished.
Reasons for Errors
Pulse oximetry fundamentally relies upon adequate perfusion of the vascular bed being monitored. Without sufficient blood flow, oxygen content cannot be adequately analyzed. Decreased perfusion may be caused by a variety of factors including hypotension, medications, ambient temperature, poor circulation, and so forth. Clinicians will often search multiple fingers, toes, and earlobes for a site that can provide a saturation value. Decreased perfusion, leading to the inability of the pulse oximeter to provide a saturation value, is very common. While central site probes may never be ubiquitous, their utility in patients with poor peripheral perfusion cannot be understated. Since these central sites reflect carotid artery flow, they will rarely experience errors due to poor perfusion of the vascular bed.
Pulse oximeters are calibrated using saturation curves of healthy adult volunteers. They are, therefore, the most accurate at high saturation levels and less so at low saturation levels. Unfortunately, from the clinical standpoint, the low saturation levels are where they are the most useful to us. Nonetheless, this is rarely of major consequence, as the clinical difference between a saturation of 83% and 80% is usually very minimal.
It is clinically important to be able to detect rapid hemoglobin desaturation with minimal delay. There is often, regrettably, a delay in this detection. The calculation of oxygenation is a moving average of user-preset length. The delayed response time problem for pulse oximetry–detected desaturations can be partially overcome by reducing the average setting to the shortest duration, usually 2 seconds (8). However, because of an increased likelihood of false alarms and artifact, this is seldom done clinically. To overcome the problem of delayed response time, it is necessary to develop processing algorithms sensitive enough to detect changes quickly, while allowing for artifact rejection and avoiding false alarms; this is an area of active research.
|
Table 21.1 Reasons for artifactual measurement in pulse oximetry |
||||||||||||||||||||
|
Other sources of error have been explored by Trivedi et al. (9). The researchers looked at very common sources of error, including ambient light and motion artifact. Error rates with excess ambient light were as high as 63% for heart rate and 57% for saturation. For motion artifact, simulated with 2-Hz and 4-Hz tremors, all tested pulse oximeters showed clinically significant error rates in saturation with both movement artifact rates. Error rates were low in the 2-Hz motion for heart rate calculations; however, all devices failed at 4-Hz motion. Other investigators have also reported on the errors and false alarms associated with movement artifact (10,11,12,13). Additional sources of error include darkly pigmented skin (14), nail polish, thermal injuries to fingers and/or toes, and inaccessibility of the extremities.
Another very common problem encountered is the lack of compatibility between probes and devices of the various manufacturers. van Oostrom and Melker (15) compared the accuracy of nonproprietary probes designed for use with a variety of pulse oximeters with that of their corresponding proprietary probes. A controlled signal was used on the Human Patient Simulator to simulate apnea. Statistical significance was not found in most of the comparisons, but in some instances the proprietary probes were closer to arterial oxygen than the nonproprietary probes. Whether or not the manufacturer of the probe is the same as the manufacturer of the pulse oximeter may have importance. Table 21.1 summarizes the various reasons for errors (16).
As can be seen from Eq. 2, the intensity of light measured at the detector varies by pathlength changes caused by the arterial pulsations. All other parameters in the equation are constant (at least within several minutes). As pathlength changes are caused by volume changes at the sensor site, it is for this reason that volume artifacts are a frequent problem. Other errors can be caused by light interference from sources outside of the measurement system or electrical interference, and will typically show up in the plethysmogram as additional waveform fluctuations. The effects of this noise are a distorted plethysmogram and can cause incorrect heart rates and saturations to be calculated. One last source of errors is the patient him- or herself: Carboxyhemoglobin present in the blood can cause an inaccurate calculation of saturation.
Alternate-site Probes
The standard location to measure pulse oximetry is the finger. Such probes are common and work well for most normal cases, but other sites are also possible. The nasal septum was explored as a possible monitoring site in 1937 (17). Groveman et al. (18) also explored the nasal septum, believing that it represents a constant picture of the internal carotid circulation and reflected cerebral flow. Cucchiara and Messick (19) showed that plethysmography from the nasal septum failed to estimate cerebral blood flow during carotid occlusion. In 1991, the nasal septum was explored during hypothermia (20). Fourteen patients were monitored every 20 minutes during major abdominal procedures. The nasal septum probe was superior to the finger probe in detecting a pulse during hypothermia. The authors concluded that monitoring at the nasal septum was more reliable than monitoring at the finger in hypothermic patients. They acknowledged several limitations, including use during nasal intubation, in patients with extremely small nostrils, or in the presence of a nasogastric tube.
Buccal probes have been evaluated as an alternative probe site. They were prepared by taping a malleable metal bar securely over the back of a disposable Nellcor finger probe and bending the metal bar and probe around the corner of a patient's mouth (21). It was determined that buccal SpO2 was greater than finger SpO2 and agreed more closely with SaO2. The authors determined that buccal pulse oximetry is a viable alternative to the finger. Limitations included longer preparation time, difficult placement, and possible dislodgement during airway maneuvers.
Awad et al. (22) demonstrated that the ear plethysmographic waveform is relatively immune to vasoconstriction. They also determined that the photoplethysmographic width has a good correlation to cardiac output. They concluded that the ear is more suitable for monitoring hemodynamic changes than the finger.
Generally, any site that has an arterial bed and is thin enough to safely transmit red and infrared light through can be used for pulse oximetry. Several monitoring locations have become standard of care, including the fingers and toes. A flexible earlobe probe is also used quite frequently when the fingers and toes are inaccessible. Since finger probes work quite well for the majority of patients, it is unlikely that alternate-site probes will ever become ubiquitous. Since the nasal septum, nares, cheek, and ear measure oxygenation from central sites and reflect the blood flow of the carotid arteries, their potential for measuring other physiologic parameters is only beginning to be explored.
Overcoming Limitations
Errors and interference on pulse oximetry can largely be eliminated or prevented. Volume/movement artifact can be reduced by ensuring that the measurement site is kept in place or moved slowly. Massimo developed probes that use a third light source (23); with this additional measurement, it is possible to estimate nonarterial volume changes due to movement artifact. This allows for compensation for those artifacts and creates a more stable signal that is not as susceptible to motion artifact. Light interference can largely be eliminated by covering the measurement site by using a properly sized probe, or by external means such as towels or other covers. Patient-related artifacts can be reduced by fully understanding the patient's physiology, and by proper selection of the measurement site.
Photoplethysmography
Photoplethysmography is the measurement of volume changes with light transmission. The photoplethysmograph (PPG) is displayed on most pulse oximeter devices; however, it is frequently ignored as oxygen saturation and pulse rate are the numbers of interest. There is an abundance of physiologic information that can potentially be extracted from this rarely used and noninvasively obtained signal.
Fundamentals
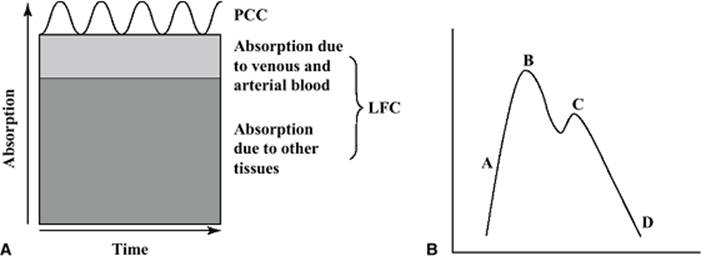
There are two main frequencies of variation in the value of light hitting the photodiode, and both are affected by absorption of the light by blood and various tissues. The low-frequency component (LFC)—or nonpulsatile component—represents the baseline amount of light hitting the detector. This value is affected by the total path traveled by the light. Skin, bone, cartilage, adipose, blood, and so forth, all absorb light, and it is this relatively constant path that results in a baseline amount of light hitting the detector. This baseline amount fluctuates at a lower frequency than the heart rate. Since the biologic tissues in the path of the light are constant, with the exception of venous and arterial blood, the changes in the LFC correspond to changes in baseline blood volume in the path of the light. The majority of this baseline blood resides in the venous system.
The pulsatile cardiac component (PCC) corresponds to changes in the arterial blood volume with each heartbeat. The magnitude of change of the PCC with each heartbeat is related to stroke volume, and the area under the curve of each heartbeat is related to the volume of blood entering the vascular bed with each beat (24). The PCC is therefore a representation of flow into a vascular bed while the LFC is a representation of changes in venous volume (Fig. 21.2A).
The typical pulse oximeter displays a processed waveform (Fig. 21.2B). Since the raw data collected by the device correspond to light hitting the photodiode, which is inversely related to blood volume, the waveform must be inverted to resemble an arterial pressure waveform. If the PPG was displayed as raw data and not inverted, point A would represent increasing light hitting the photodiode, corresponding to a decrease in blood volume, and point B would correspond to the point of maximum light hitting the photodiode, or the point of least blood in the vascular bed being monitored. The steepness of the flow of the inflow phase A may be used as an indicator of ventricular contraction, and the amplitude of the phase may be used as an indicator of stroke volume (24). The vertical position of the dicrotic notch can be used as an indicator of vasomotor tone. Under most circumstances, the notch descends to the baseline during increasing vasodilation and climbs toward the apex with vasoconstriction (24).
|
|
|
Figure 21.2. A: A graphic representation of the low-frequency component (LFC) and pulsatile cardiac component (PCC) from a typical finger probe. The PCC is typically less than 5% of the total signal acquired. B: A typical display of a processed pulse oximeter waveform. A represents the rate of maximum volume increase, B represents the point of maximum volume, C is the “dicrotic notch,” and D is the minimal basal volume. |
Signal Processing
Prior to the advent of powerful personal computers, many researchers printed the PPG waveform and measured various parameters with a ruler; more recent efforts involve elaborate mathematical and signal processing models. Bhattacharya et al. (25) employed a novel concept aimed at detection of the dominant nonsinusoidal period and the extraction of the associated periodic component. This detection and extraction was performed with a moving window to accommodate the variations of the physiologic oscillations. They also characterized the system with a nonlinear dynamic system.
Goldman et al. (23) from the Masimo Corporation published a detailed description of their signal extraction for error reduction. Massimo Signal Extraction Technology (SET) uses a new conceptual model of light absorption for pulse oximetry and employs discrete saturation transformed to isolate individual saturation components in the optical pathway. Johansson (26) processed the PPG signal using a 16th-order bandpass Bessel filter and a 5th-order bandpass Butterworth filter; a neural network analysis was then performed. Nilsson et al. (27) employed three separate methods for the evaluation of the PPG (called the blood volume pulse) for changes caused by exercise. First, they derived a single parameter from the distribution found in the average histogram of the time-aligned beats. Their second approach analyzed the ratio observed between the first harmonic and higher harmonics in the signal. The third approach evaluated the dicrotic notch depth directly from the PPG waveform. The significance of these findings will be elaborated below.
Uses of the Photoplethysmograph
The PPG is a noninvasively obtained window into many physiologic parameters. Since a pulse oximeter probe can be placed by those with minimal or no training and are found in virtually every aspect of medical care, there are many active research projects exploring the potential uses of the PPG.
Several researchers have attempted to construct mathematical relationships between the PPG and various indices of arterial mechanics. Kato et al. (28) measured the PPG from a finger pulse oximeter and pressure at the ipsilateral radial artery simultaneously. The authors concluded that a four-element, two-compartment model can be applied to the PPG to determine peripheral vascular wall mechanics. Chowienczyk et al. (29) determined that PPG assessment may provide a useful method to examine vascular reactivity. Millasseau et al. in 2002 (30) concluded that contour analysis of the digital volume pulse (DVP) provides a simple, reproducible, noninvasive measure of large artery stiffness, and in 2003 (31) determined that indices of pressure wave reflection and large artery stiffness can be used as an index of vascular aging. Bortolotto et al. (32) concluded that the second derivative of the PPG and the pulse wave velocity can both be used to evaluate vascular aging in hypertensives.
Other researchers are exploring the use of the PPG for noninvasively determining respiratory rate. Changes in intrathoracic pressure during the respiratory cycle displace venous blood, affecting the LFC. These changes also affect cardiac return, changing the amplitude of the PCC. During spontaneous breathing, subatmospheric pressure during inspiration draws air and blood together into the lungs; blood is drawn from the vena cava into the right heart and pulmonary vascular bed. A minor decrease in peripheral venous pressure (PVP) ensues. Soon thereafter, the expiratory pressure normalizes the system. During positive pressure ventilation, the inspiration is drawn by positive pressure, which raises intrathoracic pressure and reduces venous return to the right heart. Simultaneously, and very briefly, blood forced from the low-pressure pulmonary vascular bed increases return to the left heart as well as stroke volume (33). This is followed by a decrease in cardiac output as venous return into the central circulation drops off. The extent of the fluctuations caused by positive pressure ventilation depends on the state of filling of the peripheral vascular bed, the intrathoracic pressure changes, peripheral vasoconstrictor activity, and central blood volume (24). Since positive pressure ventilation often accompanies general anesthesia, which causes vasodilation and damped vasomotor response, respiratory fluctuations are emphasized. It was also discovered that early hypovolemia may be reflected in an exaggerated respiratory wave before other more classic signs of decreased urine output, tachycardia, or hypotension (24).
Nilsson et al. (34) extracted the cardiac and respiratory related components, applied a mathematic algorithm, and developed a new PPG device for monitoring heart rate and respiratory rate simultaneously; their study determined that the PPG has the potential for respiratory rate monitoring. Nilsson et al. (27) hypothesized that the filling of peripheral veins is a major mechanism behind the LFC signal, and found that a correlation exists in the amplitudes of the LFC in the PPG and the respiratory variations in peripheral venous pressure (p <0.01). Leonard et al. (35,36) concluded that baseline respiratory rate was easily identified from a pulse oximeter PPG using wavelet transforms. The study of Foo and Wilson (37) determined that the respiratory rate obtained from the PPG was significantly related to that estimated by a calibrated air pressure transducer during tidal breathing in the absence of motion artifact (p <0.05). Nilsson et al. (27) concluded that respiration can be monitored by the PPG with high sensitivity and specificity regardless of anesthesia and ventilatory mode. Leonard et al. (38) continued their work by developing a fully automated algorithm for the determination of respiratory rate from the PPG.
Researchers have also been exploring the relationship between the PPG and volume status. Perel et al. (39) found that the difference between systolic pressure at end-expiration and the lowest value during the respiratory cycle (d-Down) correlated to the degree of hemorrhage. It also correlated with the cardiac output and the pulmonary capillary wedge pressure. Thus, the changes in systolic pressure with respiration, as demonstrated by arterial pressure waveforms (systolic pressure variation [SPV]) and its d-Down component, are accurate indicators of hypovolemia in ventilated dogs subjected to hemorrhage. Rooke et al. (40) also concluded that SPV and the d-Down appear to follow shifts in intravascular volume in relatively healthy, mechanically ventilated humans under isoflurane anesthesia. Building on this principle, Partridge (41) attempted to use pulse oximetry as a noninvasive method to assess intravascular volume status. The study showed that the PPG correlated with the systolic pressure variation (r = 0.61), which was previously shown to be a sensitive indicator of hypovolemia. Shamir et al. (42) investigated ventilation-induced changes in the PPG after removing and reinfusing 10% of the estimated blood volume in 12 anesthetized patients. The plethysmographic SPV was measured as the vertical distance between maximal and minimal peaks of waveforms during the ventilatory cycle and expressed as a percentage of the amplitude of the PPG signal during apnea. This was measured during five consecutive mechanical breaths before apnea and the mean value was obtained for analysis. The 10% loss of estimated blood volume resulted in increased heart rate without changes in mean arterial pressure. Both the PPG waveform changes and the SPV from the arterial blood pressure tracing increased significantly after blood withdrawal (p <0.01). The changes in the PPG correlated with the changes in the SPV. After volume replacement, heart rate decreased while arterial pressure remained unchanged. There were no significant changes in the PPG waveform or the SPV with volume replacement. Fuehrlein et al. (43) investigated the use of PPG for volume status changes during blood donation and hemodialysis. They concluded that the PPG could be used to detect changes in volume status and vascular instability during hemodialysis and blood donation.
Future Directions of Pulse Oximetry
Compared to many other medical technologies, the use of pulse oximetry for oxygen saturation monitoring has been relatively unchanged for many years. Researchers are exploring central sites as an alternative to the fingers or toes for specific patient populations. Investigators are also continuously working to improve saturation calculation algorithms to improve response time while minimizing false alarms and artifact.
The future of PPG monitoring looks very bright. Considering their ubiquity, their ease of use, and the fact that they are noninvasive, the medical community would embrace new pulse oximetry technology. Research projects are currently focused on the use of the PPG for arterial mechanics, respiratory rate, and volume status measurements.
References
1. Stokes G. On the reduction oxygenation of the colouring matter of the blood. Philosoph Mag. 1864;28:391.
2. Hoppe-Seyler F. Uber die chemischen und optischen Eigenschaffen des Blutfarbstoffs. Arch Pathol Anat Physiol. 1864;29:233–251.
3. Hertzman A. Photoelectric plethysmography of the fingers and toes in man. Proc Soc Exp Biol Med. 1937;37:529.
4. Millikan G, Papenheimer J, Rawson A. Continuous measurement of oxygen saturation in man. Am J Physiol. 1941;133:390.
5. Goldie E. Device for continuous indication of oxygen saturation of circulating blood in man. J Sci Instrument. 1942;19:23–25.
6. Wood E, Geraei J. Photoelectric determination of arterial saturation in man. J Lab Clin Med. 1949;34:387–401.
7. Aoyagi T. Pulse oximetry: its invention, theory and future. J Anesth. 2003;17:259–266.
8. Grace R. Pulse oximetry: gold standard or false sense of security? Med J Austr. 1994;160(10):638–644.
9. Trivedi N, Ghouri A, Shah N, et al. Effects of motion, ambient light and hypoperfusion on pulse oximeter function. J Clin Anesth. 1997;9:179–183.
10. Reich D, Timcenko A, Bodian C, et al. Predictors of pulse oximetry data failure. Anesthesiology. 1996;84:859–864.
11. Moller J, Johannessen N, Espersen K, et al. Randomized evaluation of pulse oximetry in 20,802 patients: 1. Design, demography, pulse oximetry failure rate and overall complication rate. Anesthesiology. 1993;78:436–444.
12. Runciman W, Webb R, Barker L, et al. The Australian Incident Monitoring Study: the pulse oximeter: applications and limitations: an analysis of 2000 incident reports. Anesth Intens Care. 1993;21:543–550.
13. Lawless S. Crying wolf: false alarms in a pediatric intensive care unit. Crit Care Med. 1994;22:981–985.
14. Jubran A. Pulse oximetry. Crit Care. 1999;3:R11–17.
15. van Oostrom J, Melker R. Comparative testing of pulse oximeter probes. Anesth Analg. 2004;98:1354–1358.
16. van Oostrom JH, Mahla ME, Gravenstein D. The Stealth Station Image Guidance System may interfere with pulse oximetry. Can J Anaesth. 2005;52(4):379–382.
17. Hertzman A. Photoelectric plethysmography of the nasal septum in man. Proc Soc Exp Biol Med. 1937;37:290.
18. Groveman J, Cohen D, Dillon J. Rhinoplethysmography: pulse monitoring at the nasal septum. Anesth Analg. 1966;45(1):63–68.
19. Cucchiara R, Messick J. The failure of nasal plethysmography to estimate cerebral blood flow during carotid occlusion. Anesthesiology. 1981;55(5):585–586.
20. Ezri T, Lurie S, Konichezky A, et al. Pulse oximetry from the nasal septum. J Clin Anesth. 1991;3:447–450.
21. O'Leary R, Landon M, Benumof J. Buccal pulse oximeter is more accurate than finger pulse oximeter in measuring oxygen saturation. Anesth Analg. 1992;75:495–498.
22. Awad A, Stout R, Ghobashy M, et al. Analysis of the ear pulse oximeter waveform. J Clin Monit Comp. 2006;20(3):175–184.
23. Goldman J, Petterson M, Kopotic R, et al. Masimo Signal Extraction in pulse oximetry. J Clin Monit Comp. 2000;16:475–483.
24. Murray W, Foster A. The peripheral pulse wave: information overlooked. J Clin Monit. 1996;12:365–377.
25. Bhattacharya J, Kanjilal P, Muralidhar V. Analysis and characterization of the photo-plethysmographic signal. IEEE Trans Biomed Eng. 2001;48(1):5–11.
26. Johansson A. Neural network for photoplethysmographic respiratory rate monitoring. Med Biol Eng Comp. 2003;41:424–428.
27. Nilsson L, Johansson A, Kalman S. Respiratory variations in the reflection mode photoplethysmographic signal. Relationships to peripheral venous pressure. Med Biol Eng Comp. 2003;41:149–154.
28. Kato R, Sato J, Iuchi T, et al. Quantitative determination of arterial wall mechanics with pulse oximetric finger plethysmography. J Anesth. 1999;13:197–204.
29. Chowienczyk P, Kelly R, MacCallum H, et al. Photoplethysmographic assessment of pulse wave reflection: blunted response to endothelium-dependent beta2-adrenergic vasodilation in type II diabetes mellitus. J Am Coll Cardiol. 1999;34(7):2007–2014.
30. Millasseau S, Kelly R, Ritter J, et al. Determination of age-related increases in large artery stiffness by digital pulse contour analysis. Clin Sci. 2002;103:371–377.
31. Millasseau S, Kelly R, Ritter J, et al. The vascular impact of aging and vasoactive drugs: comparison of two digital volume pulse measurements. Am J Hypertens. 2003;16:467–472.
32. Bortolotto L, Blacher J, Kondo T, et al. Assessment of vascular aging and atherosclerosis in hypertensive subjects: second derivative of photoplethysmogram versus pulse wave velocity. Am J Hypertens. 2000;13:165–171.
33. Pinsky M, Summer W. Cardiac augmentation by phasic high intra-thoracic pressure support in man. Chest. 1983;84:370–375.
34. Nilsson L, Johansson A, Kalman S. Monitoring of respiratory rate in postoperative care using a new photoplethysmographic technique. J Clin Monit Comp. 2000;16:309–315.
35. Leonard P, Beattie T, Addison P, et al. Standard pulse oximeters can be used to monitor respiratory rate. Emerg Med J. 2003;20(6):524–525.
36. Leonard P, Grubb N, Addison P, et al. An algorithm for the detection of individual breaths from the pulse oximeter waveform. J Clin Monit Comp. 2004;18:309–312.
37. Foo J, Wilson S. Estimation of breathing interval from the photoplethysmographic signals in children. Physiol Measure. 2005;26(6):1049–1058.
38. Leonard P, Douglas J, Grubb N, et al. A fully automated algorithm for the determination of respiratory rate from the photoplethysmogram. J Clin Monit Comp. 2006;20(1):33–36.
39. Perel A, Pizov R, Cotev S. Systolic blood pressure variation is a sensitive indicator of hypovolemia in ventilated dogs subjected to graded hemorrhage. Anesthesiology. 1987;67(4):498–502.
40. Rooke G, Schwid H, Shapira Y. The effect of graded hemorrhage and intravascular volume replacement on systolic pressure variation in humans during mechanical and spontaneous ventilation. Anesth Analg. 1995;80:925–932.
41. Partridge B. Use of pulse oximetry as a noninvasive indicator of intravascular volume status. J Clin Monit. 1987;3:263–268.
42. Shamir M, Eidelman LA, Floman Y, et al. Pulse oximetry plethysmographic waveform during changes in blood volume. Br J Anaeth. 1999;2:178–181.
43. Fuehrlein B, Melker R, Ross E. Alar photoplethysmography: a new methodology for monitoring fluid removal and carotid circulation during hemodialysis. J Clin Monit Comp. 2007;4:211–218.
44. Jopling MW, Mannheimer PD, Bebout DE. Issues in the laboratory evaluation of pulse oximeter performance. Anesth Analg. 2002;94(1 Suppl):S62–68.
45. Block FE Jr, Detko GJ Jr. Minimizing interference and false alarms from electrocautery in the Nellcor N-100 pulse oximeter. J Clin Monit. 1986;2(3):203–205.
46. Barker SJ, Tremper KK, Hyatt J. Effects of methemoglobinemia on pulse oximetry and mixed venous oximetry. Anesthesiology. 1989;70(1):112–117.
47. Vokach-Brodsky L, Jeffrey SS, Lemmens HJ, et al. Isosulfan blue affects pulse oximetry. Anesthesiology. 2000;93(4):1002–1003.
48. Ralston AC, Webb RK, Runciman WB. Potential errors in pulse oximetry. III: effects of interferences, dyes, dyshaemoglobins and other pigments. Anaesthesia. 1991;46(4):291–295.