J.S. Gravenstein
David A. Paulus
Capnometry refers to the measurement of carbon dioxide, regardless of the method used. Capnography describes the method of obtaining a capnogram, that is, a tracing of carbon dioxide concentration as a function of time or volume. A capnograph is the instrument used to generate a capnogram. Capnometry has become the minimal standard of practice for the American Society of Anesthesiologists whenever a patient's airway is breached with an endotracheal tube, a laryngeal mask airway, or an esophageal tracheal airway. If carbon dioxide can be detected breath after breath after placing the artificial airway, the clinician has the first and best—if not the only—indication that the artificial airway is ventilating the patient's lungs rather than the esophagus and stomach.
The delivery of carbon dioxide to the exhaled gas is the final step in a complex system. Metabolism generates carbon dioxide, which is absorbed upon tissue perfusion, at which point venous blood flow delivers the CO2 to the heart, which powers pulmonary perfusion, and delivers it to the lungs and, via ventilation, gathers it from the alveoli when a breath finally pushes it to the outside. Thus, the discovery of carbon dioxide after intubation of the patient's airway, while essential, is but the tip of the proverbial iceberg. In this chapter, we provide a clinician's overview of capnometry and its applications in the perioperative period and the intensive care unit.
History
Carbon dioxide and its measurement have enjoyed a colorful history (1). Jan Baptista van Helmont (1579–1644) recognized a spirit escaping from burning wood and called it gas sylvester (from Latin silva = wood and silvester = woody). The recognition that a gas could reside in something solid found expression in the term “fixed air” introduced by J. Black in 1755. He discovered the gas to be a constituent of carbonated alkali. Later, Antoine-Laurent de Lavoisier (1743–1794) showed the gas to be an oxide of carbon. What an extraordinary circumstance: Carbon (of coal and diamonds) connected with oxygen was a gas! John Tyndall (1820–1893) spoke of “perfectly colorless and invisible gases and vapors” such as carbonic acid (now called carbon dioxide) that could well absorb radiant energy. This insight enabled him to detect carbon dioxide in the exhaled gas. However, before capnography based on physical methods could gain a foothold in clinical practice, a chemical method described by John Scott Haldane (1860–1936) became the gold standard. He caused a precisely measured volume of gas to be drawn into a closed system that made it possible to expose the gas to absorbents such as sodium or potassium hydroxide. These agents removed the carbon dioxide from the sample; the vanished volume was attributed to the absorbed carbon dioxide. Refinements of this method were widely used, yet the methods were time consuming. Chemical methods in general destroy the gas to be measured and allow only snapshots of respiratory carbon dioxide.
A number of methods exploited the physics of energy absorption. August Hermann Pfund (1879–1949), professor of optics in Baltimore, measured the effects of interposing more or less carbon dioxide between a heat source and a temperature sensor. Karl Friedrich Luft (1900–1999) employed infrared energy beamed through cells with and without carbon dioxide, thus enabling the measurements of the energy absorbed by the gas in question. Later generations of this same principle gave rise to the currently most widely used infrared spectroscopic method of capnography.
Two other methods deserve brief mention, as both of them entered the market without gaining a firm foothold. One of them became known as Raman scattering, a technique that exploits the power of laser energy to affect the amplitude of molecular vibration. Another method made use of mass spectrometry, in which charged particles are separated by their mass, thus enabling the identification and concentration of different gases.
Sites of Measurement
Capnography, herein examined, focuses on the detection and monitoring of carbon dioxide in the exhaled gases. That carbon dioxide can also be lost and consequently collected and measured from the skin (2), from the stomach (3), sublingually (4), and even from the rectum (5) deserves mention but will not be discussed in this chapter.
Steady or Unsteady State
With modern methods, continuous readings of exhaled carbon dioxide tensions and volumes can be obtained. We speak of steady state when the tension is exerted by carbon dioxide in different tissue and organ compartments and blood and alveolar gas have reached equilibrium, and when the input of carbon dioxide from metabolism equals the output of carbon dioxide via ventilation and, to a small extent, via skin, flatus, feces, and urine. A steady state can exist with high, normal, or low arterial, alveolar, or end-tidal carbon dioxide tension (PaCO2, PACO2, or PETCO2). However, all too often, we do not have a steady state: Tissue depleted of carbon dioxide can absorb liters of carbon dioxide from blood until tissue PCO2 and blood PCO2 reach equilibrium; conversely, such tissue stores can contribute CO2 to that generated by metabolism. For example, prolonged hyperventilation can exhaust tissue stores of carbon dioxide and bicarbonate. Under these conditions, the maintenance of a normal PaCO2 requires less than normal ventilation because some of the metabolic carbon dioxide filters back into the tissues instead of being exhaled. Conversely, high tissue stores of carbon dioxide (e.g., after a cardiac and respiratory arrest) will call for greater than normal ventilation until steady state is once again reached. A depressed respiratory center (e.g., under the influence of an opiate) will lead to an imbalance of input and output as the tissues take up some of the carbon dioxide while the rest leaves the body in the exhaled gas. Once the tissues and blood reach equilibrium, steady state will once again supervene in the presence of elevated levels of PaCO2, PACO2, and PETCO2. Renal compensation of metabolic acidosis or alkalosis will also lead to an unsteady state that can last for many hours. The point: Capnograms can hide as much as they reveal, and thus the interpretation of capnograms calls for discerning clinicians.
|
Table 22.1 Carbon dioxide and barometric pressure at 37°C |
||||||||||||||||||||
|
||||||||||||||||||||
Conventions of Measurements
Before describing the different methods of capnography, the conventions of reporting the tension or concentration of CO2 present in the exhaled gas must be discussed. The tension of the gas can be reported in mm Hg (same as torr), with normal end-tidal values between 35 mm Hg and 45 mm Hg, which translates into 4.67 kPa and 6.0 kPa, respectively. The amount of carbon dioxide present in a gas sample can also be reported in percent or as a fraction of the volume of gas. Here caution needs to be exercised: 5.0% end-tidal PCO2 (equal to the end-tidal fraction, Fet, 0.05) at a barometric pressure at sea level of 760 mm Hg (101 kPa) would amount to 38 mm Hg (5.05 kPa). However, many millions of people live in cities at altitude. Assume, for example, Mexico City with an ambient pressure of perhaps 550 mm Hg (73 kPa). Here, 5.0% end-tidal CO2 would represent only 27.5 mm Hg (3.65 kPa). The influence of the pressure exerted by water vapor (47 mm Hg or 6.26 kPa at 37), which is not affected by barometric pressure but rises and falls as a function of temperature, also plays an important role at altitude (Table 22.1). As we wish to correlate alveolar gas tension with the tension of gases in blood (reported in mm Hg or kPa), we prefer to report gaseous carbon dioxide not in percent, but as PCO2 in mm Hg or kPa.
Methodologies
Chemical
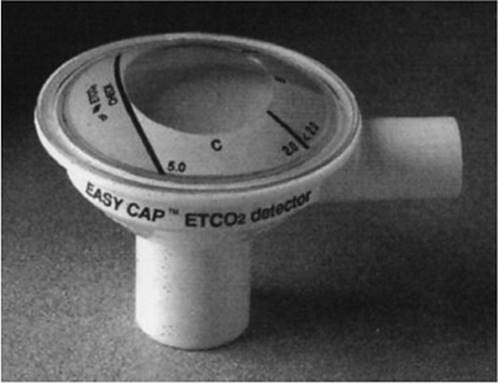
Carbon dioxide goes into solution, combines with water to form carbonic acid, and establishes an equilibrium between dissolved CO2 and bicarbonate. This reaction, which changes the pH, gives rise to chemical methods using pH indicators for the estimation of carbon dioxide concentration in moist gas, or colorimetric EtCO2 (Fig. 22.1).
Changes in temperature and the addition or removal of H+ ions, in turn, affect the ratio of bicarbonate to carbonic acid, and dissolved CO2, therefore, plays a crucial role in the acid-based equilibrium of blood, which is assessed by measuring pH and PCO2 and calculating bicarbonate in blood. This is discussed in detail elsewhere in this book, as is the importance of buffers (primarily hemoglobin) and carbonic anhydrase, which accelerate the reaction:
CO2+ H2O[left harpoon over right harpoon] H2CO3 [left harpoon over right harpoon] HCO3- + H+
Sidestream and Mainstream (On-airway) Capnography: Time-based Methods
The gas to be analyzed has to be collected from the patient under conditions that prevent contamination of the gas with ambient air. Ideally, we would like to sample tracheal gas; that is rarely possible. A cuffed endotracheal tube with a port close to the mouth offers the next best opportunity to collect exhaled gas from the patient before it mixes with gas from the outside or the breathing circuit. First, we will a look at the sidestream method.
Sidestream
On its way to the analyzer through a capillary, the gas cools (from body to room temperature) and the water vapor condenses, forming droplets. Two measures minimize the potential problem of having water obstruct the flow of gas or confound the spectroscopic analysis: Collecting capillaries made out of Nafion tubing enables the water vapor in the tube to equilibrate with the water vapor in air surrounding the tube. This leads to a reduction of water vapor in the capillary. The second, a more prosaic method, consists of a water trap situated close to the analyzer.
|
|
|
Figure 22.1. A device that detects CO2 by chemically induced color change (Nellcor, Inc.). |
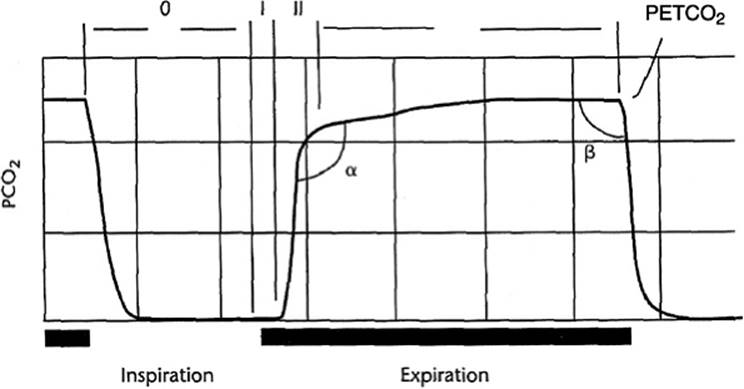
Figure 22.2 shows a typical time-based capnogram obtained under ideal conditions. Here we plot the tension of carbon dioxide in the ordinate and time in the abscissa. Observe the angles α and β, both of which in a healthy individual approach 90 degrees. A respiratory pause at the end of exhalation will cause the plateau phase to become horizontal.
With the sidestream method, the costly analyzer can be kept out of the way; a thin, long aspirating capillary presents no encumbrance to the clinical team; and aspirated gas can be analyzed for carbon dioxide as well as other gases. Furthermore, gas can be aspirated from nasal prongs with minimal annoyance to a conscious patient. Commercial configurations are available that enable the simultaneous aspiration of gas from one nostril while delivering oxygen to the other nostril or to the mouth. However, in that application, contamination of the aspirated gas with room air or oxygen is possible, although several studies have shown clinically satisfactory results with these arrangements. At a minimum, such a system can provide evidence of ventilation and enable the recording of respiratory rates.
|
|
|
Figure 22.2. Capnogram showing exhaled PCO2 versus time. Expiration shows phase I (dead space gas free of CO2), phase II (rapid appearance of CO2), and phase III (plateau). The α angle describes the transition from phase II to III and the β angle that from phase III to phase 0, the beginning of inspiration. |
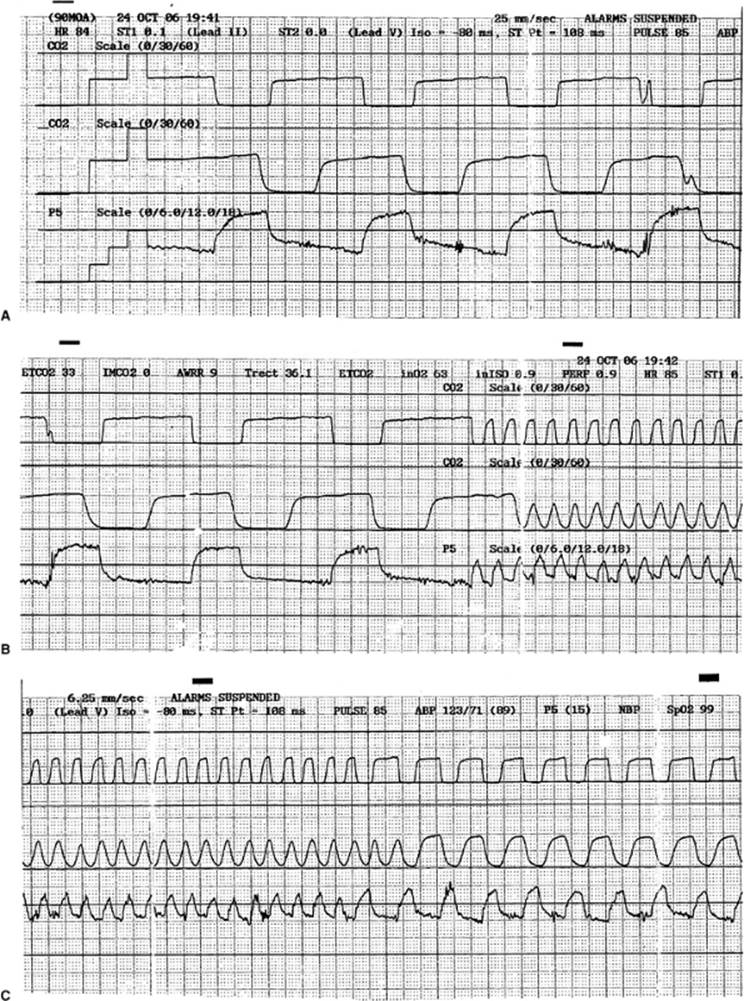
The sidestream method has two well-recognized drawbacks. The longer the capillary is, the longer the travel time for the gas from the patient to the analyzer. That causes the capnogram to be out of phase with simultaneously recorded flow or pressure tracings. The long travel also gives the leading edge of a gas a chance to mix with the gas it is replacing in the tubing, which produces slurring of the capnogram, particularly noticeable with rapid respiratory rates (Fig. 22.3).
Many sidestream capnometers aspirate up to 200 mL gas per minute into the analyzer. Premature newborns, with their small tidal volumes and high respiratory rates, will then develop capnograms that show false low end-tidal and false high inspiratory PCO2 values. Two mechanisms contribute to these conditions: On the one hand, the tiny patient's tidal volume might be so low as to cause the capnograph to aspirate gas from the breathing tube, thus diluting the exhaled gas from the patient. On the other hand, the time constant of the capnograph may be too long to respond adequately to rapid breaths. Modern capnographs offer low rates of aspiration (30–50 mL/minute) and short time constants (6).
Mainstream
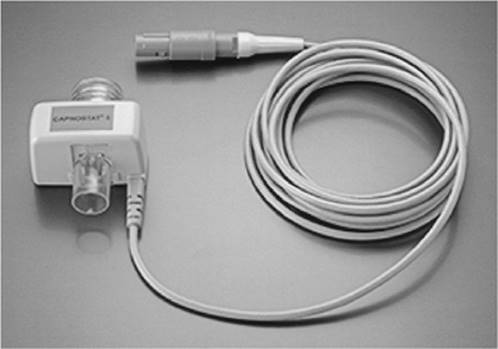
Instead of aspirating a sample of respired gas with a sidestream system, it is possible to determine the concentration of carbon dioxide close to the patient's mouth in a “mainstream” or “on-airway” method (Fig. 22.4). The method eliminates two weaknesses of the sidestream system: Without a need to transport the gas through a capillary to the analyzer, mainstream capnograms show no slurring of the capnographic tracings. Of course, these advantages come with a (tolerable) cost: The carbon dioxide sensor must be brought close to the patient's mouth, which adds weight to the breathing circuit/endotracheal tube; in this position, the sensor is exposed to potential damage, and obtaining gas samples from a spontaneously breathing, nonintubated patient is more difficult than would be true from a sidestream system. Nevertheless, mainstream systems have been adapted for capnography even in nonintubated infants.
The mainstream, on-airway system avoids problems arising out of condensation of water vapor in the exhaled gas by heating of the sensor. At 37°C, water vapor will exert 47 mm Hg, thus affecting—if not powerfully—the determination of PCO2 in sidestream systems. Purists will, therefore, point out that mainstream capnography will give values more representative of alveolar gases than sidestream systems, a small advantage with no clinical significance.
Volume-based Capnography
Instead of plotting the respired gas as a function of time, we can also plot it as a function of volume. This calls for a method to measure, breath by breath, the respired volume of gas. Commonly, only the exhaled tidal volume is shown (Fig. 22.5).
Observe on Figure 22.5:
· A: The tracing starts with the beginning of exhalation, which consists of dead space free of CO2.
· B: As the dead space is cleared, gas from the sequentially smaller and smaller airways, and finally alveoli, will be exhaled. A steeply rising concentration of carbon dioxide over volume reflects this phase. The phase ends in a distinctive knee and then transitions into a more or less horizontal phase.
· C: The gently rising horizontal phase adds volume from distant lung segments.
· D: The end-tidal value, normally about 40 mm Hg, represents alveolar gas if lung function and tidal volume are normal.
· E: The inspiratory limb of the breath is not recorded, as is the custom with volume-based capnograms.
The measurement of the exhaled volume presents challenges. Not only is the flow rate not uniform over the entire exhaled volume, but also the presence of water vapor, barometric pressure, composition of the exhaled gas (imagine the presence of helium!), configuration of the sensor, and response time of the flow meter can all affect the accuracy of the measurement (7).
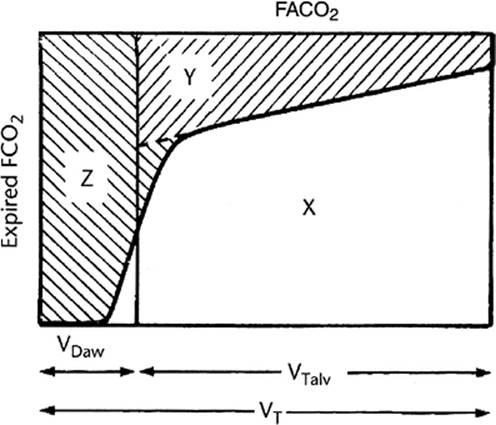
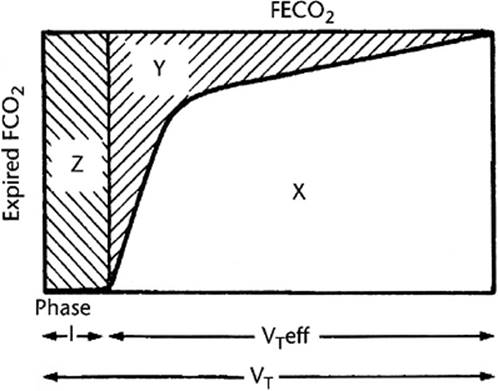
Observe in Figure 22.5 the gap between the end-tidal value and the arterial carbon dioxide tension; thus, together with an arterial blood gas, the single breath method enables the clinician to estimate the volume of carbon dioxide in the exhaled breath (X), the volume of the alveolar dead space (Y), and the volume of the anatomic dead space (Z). Fletcher adopted an estimation of the “efficiency” of ventilation by drawing a horizontal line through the end-tidal concentration of carbon dioxide (8) (Fig. 22.6).
Check of Capnograph
Before accepting the data provided by capnographs, check the technical details of the instruments, whether sidestream or mainstream and whether time or volume based. Calibration can be accomplished with a test gas, with references built into the instrument, and for mainstream systems with cells that mimic the presence of a known carbon dioxide concentration. When in doubt, the user can test his or her own exhaled gas. However, this will not test the linearity of the instrument.
For sidestream systems, check for a properly connected sampling system and patent tubing. When secretions or water droplets impede gas flow, the sidestream capnograph will report erroneous data. A break in the tubing or a loose connection can enable room air to dilute the sample. In a mainstream system, a leak between the sensor and patient can introduce artifacts. Gas other than the patient's exhaled gas can dilute the sample in all applications in which the sample is not taken from a port close to the endotracheal tube, as is true with aspiration of gas from nasal cannulae.
Pay attention to the patient's tidal volume. If the patient's tidal volume, whether spontaneous or not, is too small to deliver undiluted alveolar gas to the capnograph, the end-tidal PCO2 will be falsely low. This concern arises particularly in premature newborns.
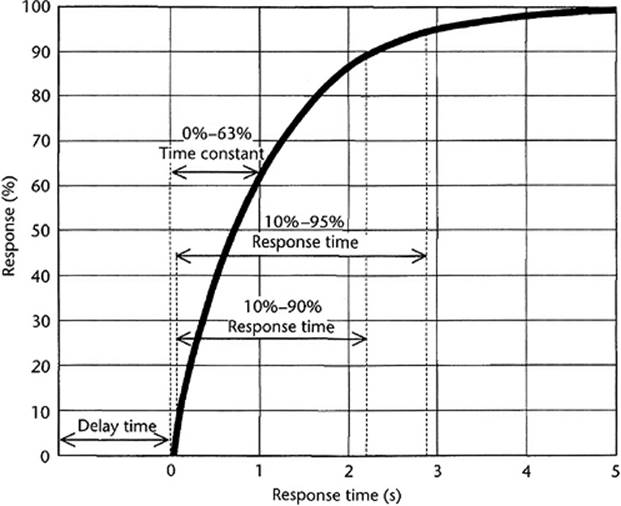
Respiratory rates affect the capability of the capnograph. Capnographs have limits to the rate of their response, usually expressed either as time needed for a 5% to 95% response or as time constant (Fig. 22.7). Consequently, with rapid respiratory rates, the instrument may not be able to reach a full response, and the end-exhaled values can present as falsely low and the inspired values falsely high.
|
|
|
Figure 22.3. A: The top capnogram derives from an on-airway sampling location. The middle tracing is a capnogram from a sidestream device. Notice the on-airway waveform is a little more crisp than that from the sidestream device. The data were collected from a patient during mechanical ventilation. The increase in airway pressure is associated with the sudden disappearance of CO2 and the drop in airway pressure signals exhalation. Travel time of gas in the capillary of the sidestream capnogram causes the on-airway curve to lag behind the pressure tracings. B: Increasing respiratory rate briefly to 60 breaths per minute eliminates the plateau in the sidestream-derived waveform with reduced end-tidal CO2, while the on-airway device still shows a plateau. C: Dropping the rate to 30 breaths per minute results in the plateau reappearing in the on-airway device. |
|
|
|
Figure 22.4. The Capnostat CO2 sensor, a fully integrated gas measurement system, is shown assembled with an adult airway adapter. All of the signal acquisition and processing is performed within the sensor. This is accomplished by the use of microelectronics and digital signal processing. The capnogram along with calculated parameters such as end-tidal and inspired values are provided via a serial interface. (Image courtesy of Respironics, Inc., Murrysville, PA.) |
Make sure the respired gas is free of gases that would confound the spectrographic analysis of carbon dioxide, as can be true of nitrous oxide and helium. Many capnographs offer compensation for the presence of nitrous oxide. Helium causes the carbon dioxide concentrations to be read falsely low (9).
|
|
|
Figure 22.5. Schematic single breath test. FaCO2 represents the FCO2 of a gas in equilibrium with arterial blood. Area X represents the volume of CO2 in the breath. Area Y represents the alveolar dead space. The alveolar dead space fraction is given by Y/(X + Y). VTalv is the alveolar tidal volume. The physiologic dead space fraction is represented by areas (Y + Z)/(X + Y + Z). Note that fractions are used, rather than partial pressures, in order that the areas may represent CO2 volumes, actual or notional. Observe the horizontal line of an invasively obtained FaCO2. (Reproduced with permission from Fletcher R. In Gravenstein JS, Jaffe MB, Paulus DA, eds. Capnography, Clinical Aspects. Cambridge, UK: Cambridge University Press; 2004:381.) |
|
|
|
Figure 22.6. Definition of efficiency. The breath is divided into phase I, the ineffective part, and VTeff, the effective part (which contains phases I and II). Efficiency is calculated from 100 times area X divided by areas (X + Y). In effect, efficiency is a noninvasive measure of ventilatory efficiency. (Reproduced with permission from Fletcher R. In Gravenstein JS, Jaffe MB, Paulus DA, eds. Capnography, Clinical Aspects. Cambridge, UK: Cambridge University Press; 2004:382.) |
Cardiogenic Oscillations
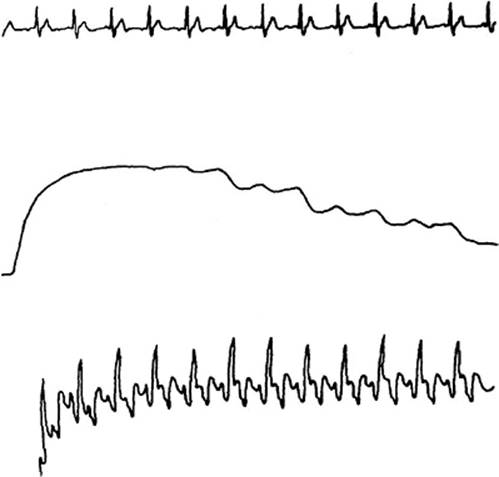
Cardiogenic oscillations (Fig. 22.8) are a reminder that the lungs share space with a beating heart in the chest. These oscillations can be seen with both sidestream and mainstream systems. The oscillations synchronous with the heart beat are thought to represent “the complex summation of transient alterations in the proportion of the total flow coming from different lung units and containing gases of different concentrations” (10).
Interpretation
What Is a Normal Capnogram?
A normal capnogram is a plot of CO2 and time, which can be divided into inspiratory and expiratory segments, each one grouped in phases (Fig. 22.2).
· Inspiratory segment: The inspiratory phase, phase 0, is usually a flat line overlapping the zero (baseline) CO2 concentration line, unless rebreathing is present. The latter part of the horizontal baseline is phase I of the expiratory segment. Phase 0 represents the dynamics of inspiration.
· Expiratory segment: The expiratory segment, similar to a single breath CO2 curve, is divided into phases I, II, and III, and occasionally phase IV, which represents the terminal rise in CO2 concentration.
· Phase I: Phase I represents CO2-free gas from the apparatus and anatomic dead space.
· Phase II: Phase II consists of a rapid S-shaped upswing on the tracing due to mixing of dead space gas with alveolar gas.
· α Angle: The angle between phases II and III has been referred to as the α angle, and increases as the slope of phase III increases. Changes of the α angle correlate with
sequential emptying of alveoli. In general, the more heterogeneous are functional units of the lung, and the wider one is the α angle.
|
|
|
Figure 22.7. For sidestream sampling, total response time is equal to the delay or transit time in the sampling catheter plus the measurement rise time, which is expressed different ways. (Reproduced from Gravenstein JS, Paulus DA, Hayes TJ. Capnography in Clinical Practice. 2nd ed. Boston: Butterworth-Heinemann, 1989.) |
|
|
|
Figure 22.8. Simultaneous electrocardiogram and capnogram with cardiogenic oscillations and pneumotachygraph. Cardiogenic oscillations in this capnogram (middle tracing) were generated from a healthy volunteer who breathed into a mouthpiece, to which a pneumotachygraph (set at high sensitivity) and sidestream capnograph sampling connector were attached. An electrocardiogram (top tracing) was recorded simultaneously. Oscillations appeared on the capnogram only on the down-slope. The oscillation occurred at the same rate as the heartbeat, but 2 to 3 seconds after the pneumotachygraph because of the travel time of the gas in the sidestream capnograph. In order to generate a pneumotachygraph, the subject kept his glottis open after an exhalation was completed. |
· Phase III: Phase III is the link between the α angle and the PETCO2. Its slope increases with ventilation/perfusion (V/Q) mismatch, and it is determined by the gas-emptying sequence of the alveolar units. If the units empty synchronously, the CO2 expired results in a smooth flat or slightly upsloping phase III. In patients with severe V/Q scatter and longer time constants, CO2 emptying is sequential, resulting in a steeper rising slope of phase III. In general, the more severe the mismatch is, the steeper the slope. Factors such as changes in cardiac output, CO2 production, airway resistance, breathing pattern (tachypnea), and low functional residual capacity (FRC) may further affect the V/Q status of the various units in the lung, and thus influence the height or the slope of phase III.
An incompetent expiratory valve resulting in rebreathing may affect the α angle and up-slope the phase III of the capnograph. A simultaneous recording of flow rate waveforms is potentially used to differentiate this technical problem from an abnormal plateau of phase III of the capnograph. For a healthy, spontaneously breathing adult or with optimal mechanical ventilation, the α angle should show a smooth curve (see Fig. 22.2), end-tidal values of 35 to 45 mm Hg, and an arterial PaCO2 of only 3 to 4 mm Hg higher than the end-tidal values. There would be no carbon dioxide in the inspired air.
How can we be sure that ventilation is normal when we don't have arterial blood gas analyses available? A stethoscope would be helpful in confirming normal breath sounds left and right. A spontaneously breathing patient should be breathing regularly, without a tracheal tug during inspiration; the left and right chest should rise equally and evenly during inspiration; and during expiration, the abdominal muscles should not contract. If clinical findings raise doubts about the adequacy of ventilation, even with a normal-appearing capnogram, the arterial blood gas should be analyzed. Should PETCO2 fail reasonably to reflect PaCO2, capnography can still provide useful trend data, but the clinician will now need to identify the reason for a larger than normal difference between PETCO2 and PaCO2.
The volume-based method provides a valuable opportunity to estimate the volume of carbon dioxide exhaled. Because no single breath equals the next, even with mechanical ventilation, several to many breaths need be sampled and averaged to arrive at a reasonable estimate. Volumetric capnography (plotting CO2 concentration over expired volume) has been used for real-time calculations of anatomic and physiologic dead space ventilation. Since anatomic dead space generally does not change rapidly, alterations of physiologic dead space measured in real time can indicate changes in the alveolar dead space component. While the information obtained from volumetric capnography could be theoretically useful to titrate ventilator parameters, its use is currently not widespread.
Normally, we expect 200 to 250 mL/minute (about 2–3 mL/kg/minute) of carbon dioxide to be produced by a resting, healthy, normothermic adult of average weight. Assuming steady state (ignoring small losses through skin, feces, and urine), the volume exhaled would represent the volume produced. Diet can change the respiratory quotient (RQ = carbon dioxide production/oxygen consumption), usually assumed to be around 0.8.
What Are the Signs of an Abnormal Capnogram?
For a valid measurement of the tidal volume during mechanical ventilation, the exhaled rather than the inspired volume must be measured. Positive pressure during inspiration can cause gas to escape through a leak or around the endotracheal tube; such loss is less likely during passive expiration.
Equipment Related
Ventilator-related Failures or Gas Leaks
1. Leaks: With mechanical ventilation, leaks in the breathing circuit are likely to spill gas during inspiration when the pressure in the system is high, and thus can lead to hypoventilation despite a properly calculated (but not measured) minute ventilation.
2. Inspired CO2
In the absence of intentionally added carbon dioxide, three mechanisms can lead to the appearance of inspired carbon dioxide:
a. Exhausted carbon dioxide absorber: With a circle system, as used in anesthesia, an exhausted carbon dioxide absorber will cause rebreathing.
b. Incompetent expiratory valve: An incompetent expiratory valve will lead to rebreathing of the carbon dioxide deposited in the expiratory limb of the breathing circuit.
The two conditions described above, however, can be distinguished by simply raising the fresh gas flow to exceed minute ventilation: That will prevent rebreathing owing to an exhausted carbon dioxide absorber, but will not prevent rebreathing through a defective (stuck in the open position) expiratory valve. Whether an exhausted carbon dioxide absorber or a defective valve causes rebreathing of carbon dioxide, the effect resembles the addition of dead space, which calls for an increase of minute ventilation lest carbon dioxide retention leads to rising PACO2, PaCO2, and PETCO2(Fig. 22.9).
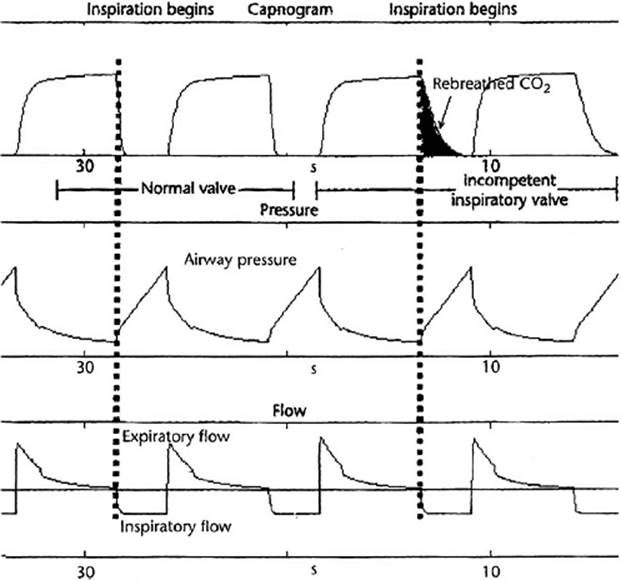
c. Incompetent inspiratory valve: Malfunction of the inspiratory valve generates a typical capnogram (Fig. 22.10).
|
|
|
Figure 22.9. Incompetent expiratory valve leads to rebreathing of CO2 in this time-based capnogram from a patient breathing from a circle system. Observe that the capnogram does not return to baseline during inspiration. Either an exhausted carbon dioxide absorber allows exhaled gas to return to the patient during inspiration or an expiratory valve stuck in the open position lets exhaled gas be admixed to the inspired gas during inspiration, indicating the presence of CO2 in the inspired gas. High fresh gas flow can compensate for an exhausted carbon dioxide absorber but not for rebreathing through a faulty expiratory valve. |
3. Abnormal capnograms with normal production of carbon dioxide
Hyperventilation:
Anxious people, and more often patients with central nervous system injuries, can hyperventilate to the point of inducing tetany; in healthy volunteers, a drop by 20 mm Hg PETCO2 induced tingling and tetany manifested by increased axonal excitability, presumably owing to reduced ionized calcium (11).
In the clinical setting, patients with an acute increase of intracranial pressure can be treated with transient hyperventilation in order to decrease cerebral blood flow known to fall with decreased PaCO2. The capnogram will first briefly show increased and then decreased PETCO2, eventually leading to reduced carbon dioxide tissue stores. However, be careful when observing an abnormally low PETCO2! Be sure that the low PETCO2 is due to hyperventilation and not to other circumstances. For example, very low tidal volumes can show low PETCO2 even though PaCO2 is elevated. A mistaken diagnosis of hyperventilation and the decision to reduce minute ventilation would harm the patient.
Hypoventilation:
Three clinical circumstances can lead to hypoventilation: Drug- or disease-induced depression of the respiratory center, drug- or disease-induced muscle weakness, and airway obstruction. With the onset of hypoventilation, less carbon dioxide appears in the exhaled gas, carbon dioxide accumulates in the tissues, and venous PCO2 rises. Eventually, the retained carbon dioxide levels reach a new equilibrium after renal compensation has reached its peak. There will be higher than normal levels of body stores of carbon dioxide, PaCO2, PACO2, and PETCO2. Once a new steady state has been reached, and assuming unchanged metabolism, the amount of carbon dioxide exhaled per minute will be the same as before the perturbation; however, the end-expired values will be elevated. Instituting hyperventilation at this point will bring end-tidal values back toward “normal,” at which point continued hyperventilation will result in respiratory alkalosis. In patients with elevated PETCO2 on mechanical ventilation, clinicians should resist the temptation to increase minute ventilation without first going through a differential diagnosis of an elevated PETCO2 lest they delay the treatment of an underlying process.
|
|
|
Figure 22.10. Illustration of the difference between normally functioning and incompetent inspiratory valves. Note that the CO2 tracing in the normal capnogram rapidly drops to baseline at the start of inspiration (marked by increase in airway pressure [center tracing] and inspiratory flow [bottom tracing]). When the inspiratory valve is incompetent, exhaled CO2 from the previous breath enters the inspiratory limb of the circle breathing system, and is rebreathed at the next breath. The presence of CO2 in the inspiratory limb is evident from the widened capnogram (shaded area). (Generated with BreathSim software from Goldman JM, Ward DR, Daniel L. BreathSim, a mathematical model-based simulation of the anesthesia breathing circuit, may facilitate testing and evaluation of respiratory gas monitoring equipment. Biomed Sci Instrum. 1996;32:293–298.) |
4. Abnormal capnograms with increased production of carbon dioxide
5. Exogenous CO2 production:
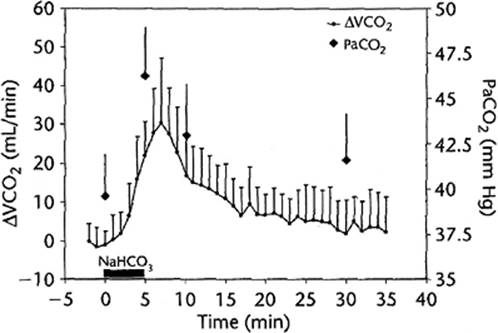
Bicarbonate infusion: Bicarbonate infused in the treatment of metabolic acidosis will dissociate under most clinical conditions (carbonic anhydrase being available) and liberate carbon dioxide, perhaps as much as 1 L/50 mmol (Fig. 22.11).
Carbon dioxide insufflation: Carbon dioxide insufflation during laparoscopic (etc.) procedures burdens the body with many extra liters (at times >40 L in adults) of carbon dioxide. Cardiac output and buffering capacity of blood will influence the rate of gas release. The blood carries much of the gas to the lungs, where increased ventilation is needed to maintain normal arterial gas values. Fortunately, after releasing the gas from the abdominal cavity, arterial blood gas values return toward normal over about an hour (12). Some surgeons like to flood the surgical field with carbon dioxide. In case of venous aspiration of gas, the aspirate would be the readily absorbed carbon dioxide rather than air containing close to 80% of poorly absorbed nitrogen (13).
Endogenous CO2 production:
Shivering, as seen in patients with severe nervous system injuries or when emerging from anesthesia, can double the consumption of oxygen and thus the production of carbon dioxide. Fever triggered by the liberation of pyrogens from infectious agents, toxins, or inflammation is the most common cause of increased CO2 production. Much rarer is malignant hyperthermia (MH), an autosomal dominant inherited disorder of skeletal muscle that sends carbon dioxide production into overdrive. In susceptible patients, halothane—and, to a lesser degree, other halogenated anesthetics—and succinylcholine can trigger the syndrome.
A rising PETCO2 provides the first warning many minutes before increasing blood or body temperature can be detected. While the syndrome arises usually during anesthesia, it sometimes becomes manifest hours later. The syndrome provides a telling example of why the clinician should not simply blame rising PETCO2 on hypoventilation and increase minute ventilation without ruling out MH—an often fatal condition if not detected in time and treated with dantrolene. Of course, in the treatment of MH, increasing minute ventilation becomes necessary, together with appropriate treatment of fever, hyperkalemia, and arrhythmias.1
|
|
|
Figure 22.11. Time course of the changes in VCO2 (ΔVCO2) and PaCO2 in 16 artificially ventilated critically ill patients during and after the infusion of 1/5 mmol/kg sodium bicarbonate over 5 minutes. (Reproduced with permission from Levraut J, Garcia P, Jiunti C, et al. The increase in CO2 production induced by NaHCO3 is affected by blood albumin and hemoglobin concentrations. Intens Care Med. 2000;26:558.) |
Rarely, the syndrome is triggered by neuroleptic drugs such as prochlorperazine (Compazine), promethazine (Phenergan), clozapine (Clozaril), and risperidone (Risperdal). This neuroleptic malignant syndrome (NMS) has also been associated with nonneuroleptic agents that block central dopamine pathways (e.g., metoclopramide [Reglan], amoxapine [Asendin], and lithium) (14).
High metabolic activity with hyperthyroidism can become symptomatic after infection or trauma to the thyroid gland. Tachycardia, markedly increased oxygen consumption and carbon dioxide production, and raised body temperature characterize the syndrome. When muscle wasting, particularly in elderly hyperthyroid men, affects breathing, capnography can be misleading.
6. Abnormal capnograms with reduced production of carbon dioxide
If production of carbon dioxide is abnormally low, even “normal” ventilation will represent hyperventilation. Numerous conditions can lead to a decrease of carbon dioxide production. Currently, the most common circumstance is iatrogenically decreased body temperature (e.g., as induced during cardiopulmonary bypass). Submersion in cold water, hypothyroidism, and several mitochondrial diseases can also decrease metabolism (15). Often the clinician will need to consider arterial blood gas values in order to correctly interpret normal and low PETCO2.
Capnography: Clinical Applications
Obstructive Lung Diseases
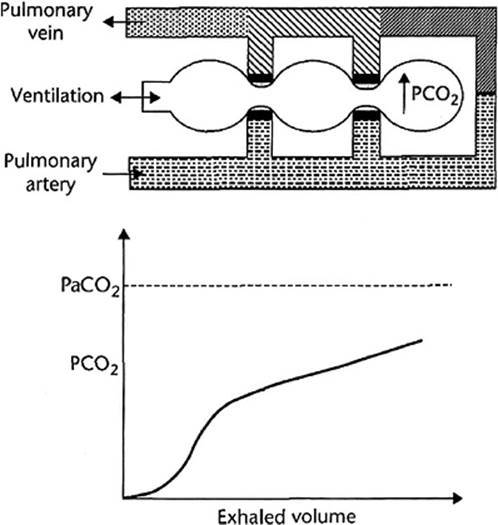
Many patients with chronic obstructive pulmonary disease, including asthma, show typical capnographic features that include a slowly rising concentration of carbon dioxide in the expired tidal volume and alteration of the slopes of phase III (Fig. 22.12). Figure 22.12 shows diagrammatically how impedance to air flow in sequential areas of the lungs contributes to uneven emptying of the lungs. Severe V/Q mismatch in patients with obstructive lung diseases will also cause CO2 release, first from the high V/Q alveolar unit (low CO2), and last from low V/Q alveolar units (high CO2), contributing to the upsloping shape of phase III (16). For these reasons, single values of ETCO2 have proven unreliable as differential diagnosis indices in patients with obstructive disease compared to restrictive lung disease (17). When PETCO2 differs from PaCO2 because of V/Q mismatching, changes in the PETCO2 may be seen with a corresponding increase, decrease, or no change in PaCO2. In these cases, a direct measurement of dead space ventilation with volumetric capnography can be useful to predict the relationship between PaCO2 and PETCO2.
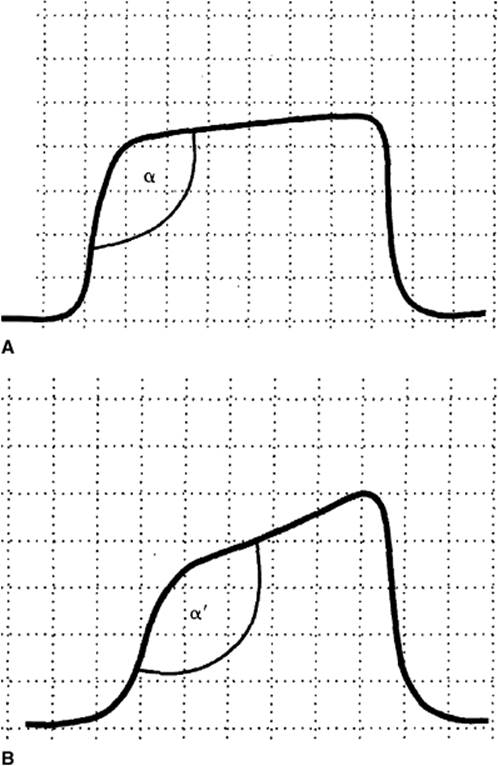
ETCO2 during weaning from mechanical ventilation has been used with success to prevent dangerous, and frequently unrecognized, hypercapnia in patients with increased dead space ventilation (18). Unfortunately, in many cases, relevant hypercapnic episodes (increases of ETCO2 of greater than 3 mm Hg) can only be detected with a sensitivity of 82% and a specificity of 76%, making arterial sampling during weaning a frequent necessity. Despite these limitations, capnography may substantially reduce the number of arterial blood gas analyses necessary during weaning from mechanical ventilations (19). One can describe the degree of flattening by reporting an α angle as shown in Figure 22.13.
|
|
|
Figure 22.12. Diagram of ventilation/perfusion mismatch (i.e., chronic obstructive pulmonary disease) and the resulting volume-based capnogram. The diagram shows the narrowed air passages resulting in decreased ventilation of distal alveoli. (Reproduced with permission from Anderson JT. In Gravenstein JS, Jaffe MB, Paulus DA, eds. Capnography, Clinical Aspects. Cambridge, UK: Cambridge University Press; 2004:192.) |
Ventilation/Perfusion Mismatch
In healthy individuals, the ventilation-to-perfusion ratio comes close to 1:1. Under the influence of gravity, the lower lungs are favored with perfusion over ventilation as compared to the upper lungs. Any pathologic condition that disturbs this balance can result in a mismatch. Under physiologic conditions, we expect the arterial CO2 tension to be 3 to 5 mm Hg higher than the end-tidal CO2 tension. In general, neither end-tidal nor arterial CO2 can exceed venous PCO2. A conspiracy of ventilation/perfusion inequalities can raise or decrease arterial to alveolar PCO2 differences depending on the patient's disease, position, ventilatory pattern and pulmonary perfusion pressure, and flow. Acute respiratory distress syndrome (ARDS) is an example of severe V/Q scatter. Low lung compliance and an increase in resistance imply longer time constants and sequential CO2 emptying, resulting in a steeper rising slope of phase III of a time-based capnogram. Such a ventilatory disturbance in ARDS can be monitored with a real-time capnograph. However, when a significantly widened PaCO2–PETCO2 difference is observed, it is likely that coexisting significant dead space ventilation occurs. In these cases, direct measurement of dead space ventilation with volumetric capnography confirms the suspected diagnosis.
|
|
|
Figure 22.13. A: Normal capnogram showing α of 105 degrees. B: Capnogram during acute bronchospasm showing α′ of 140 degrees. |
Recent reports in pediatric populations suggest that a dead space volume–to–tidal volume (VD/VT) ratio of 60% is a critical ratio for lack of reliability of PETCO2 in patients with increased extravascular lung water (20). In this subset of patients with a particularly poor prognosis, a VD/VT ratio more than 65% identifies patients at risk for respiratory failure following extubation (20). This observation mirrors our personal experience in adult ARDS patients, whereas a VD/VT ratio more than 60% identifies patients with grave pulmonary dysfunction (21) and increased risk of death (22).
The PaCO2–PETCO2 difference in ARDS patients has recently found another interesting application. It has been theorized that the narrowing of this difference, while positive end-inspiratory pressure is applied, indicates the best possible recruitment of unstable alveoli without overdistension (23). In other words, calculating the VD/VT ratio in patients with a wide PaCO2–PETCO2 difference could be strategically useful to optimize positive end-expiratory pressure, thereby limiting promotion of excessive “West zone 1” in the lung.
Bronchial Intubation as an Example of a Shunt
With intubation of usually the right, mainstem bronchus, a classic example of a large shunt develops: One lung is perfused but not ventilated. About half of the cardiac output is shunted past the lung, and its desaturated blood is mixed with the saturated blood coming from the other lung. The mixing effect of the shunt is more pronounced for oxygen (46 mm Hg O2 venous blood into 100 mm Hg pO2 arterial blood) than for carbon dioxide (46 mm Hg CO2 venous blood into 40 mm Hg PCO2 arterial blood). The initial reduction of exhaled CO2 results in a reduced PETCO2 value until the system comes back into equilibrium. A partial and variable compensation for such a large shunt is caused by hypoxic pulmonary vasoconstriction, limiting the PaCO2–PETCO2 gap.
Pulmonary Embolism as an Example of Dead Space Ventilation
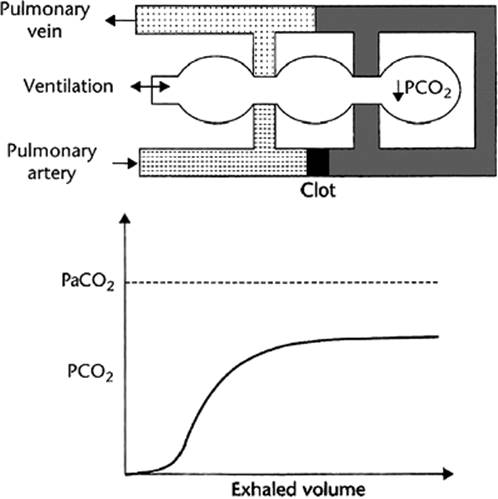
A typical example of dead space ventilation occurs when an embolus blocks perfusion such that lung tissue is ventilated but not perfused. Depending on the tidal volume of the nonperfused lung segment, the dead space being ventilated can substantially dilute the PETCO2, leading to large differences between PaCO2 and PETCO2 (Fig. 22.14). In the same patient, the plateau of the CO2 volume capnograph flattens (24). If the patient's respiratory drive is intact, alveolar hypoxia and increased alveolar dead space will result in increased minute ventilation with resultant low end-tidal PCO2 values.
|
|
||||||||||||||||||||||||||||||
|
Figure 22.14. Diagram of ventilation/perfusion mismatch (i.e., chronic obstructive pulmonary disease) secondary to a clot (pulmonary embolus) on ventilated but not perfused alveoli and volume-based capnogram. (Reproduced with permission from Anderson JT. In Gravenstein JS, Jaffe MB, Paulus DA, eds. Capnography, Clinical Aspects. Cambridge, UK: Cambridge University Press; 2004:192.) |
||||||||||||||||||||||||||||||
|
Table 22.2 The effect of hemorrhagic shock and reduced pulmonary blood flow on the elimination of carbon dioxide |
||||||||||||||||||||||||||||||
|
||||||||||||||||||||||||||||||
With ablation of this compensation, as in a patient who is chemically paralyzed, heavily sedated, or anesthetized, the PaCO2 always increases from baseline, and the (a-ET)PCO2 gap widens (25). The pulmonary artery angiogram, spiral chest computerized tomography, and scintillation V/Q lung scan remain the gold standards for diagnosing pulmonary embolism. Unfortunately, while capnography has the advantage of being noninvasive and practical at the bedside, it lacks specificity (26).
Low Cardiac Output State
Hemorrhagic shock represents the extreme of reduced pulmonary blood flow without, in this example, disturbance of lung function (Table 22.2). The reduced alveolar blood flow will prevent the matching of CO2 elimination with systemic CO2 production. As a result, PETCO2 will decrease while the mixed venous PCO2 will continue to increase (27). Positive pressure ventilation will enlarge the areas of the lungs receiving more ventilation than perfusion, which will exaggerate the impact of low perfusion pressure to the dependent areas of the lungs (28). However, if ventilation is maintained constant, the percent decrease in PETCO2 directly correlated with the percent decrease in cardiac output (r2 = 0.82) (29).
Cardiac Arrest
While capnography is well established as a tool to confirm correct endotracheal intubation (30,31,32,33), it has garnered growing interest in the interpretation of low blood flow states, primarily because of the difficulty in directly measuring low rates of blood flow, particularly during human cardiac arrest and resuscitation. It is much easier to measure end-tidal CO2 as evidence of pulmonary blood flow than direct measurements of cardiac output.
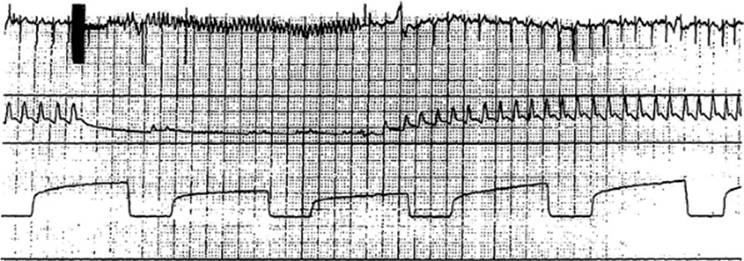
With sudden cardiac standstill, the capnogram shows quickly vanishing carbon dioxide levels in the exhaled gas. Thus, continued ventilation will wash the carbon dioxide out of the unperfused lungs. After three or four time constants, there will be very little carbon dioxide left in the unperfused lungs (Fig. 22.15).
|
|
|
Figure 22.15. A patient undergoing the implantation of an automatic internal cardiac defibrillator was monitored with electrocardiogram (ECG; top), radial artery pressure (middle), and mainstream capnography (bottom). Induced ventricular fibrillation (black area in ECG) and defibrillation are apparent in the ECG tracing. Observe decay of arterial pressure. During absent pulmonary blood flow, the patient's lungs were ventilated and with two breaths the end-tidal PCO2 fell from 35 mm Hg before fibrillation to 22 mm Hg. |
Conversely, with re-establishment of circulation, the reappearance of carbon dioxide provides welcome evidence of pulmonary perfusion. During cardiac arrest, carbon dioxide will have accumulated in tissue and, because of acidosis development during shock and arrest, the addition of hydrogen ions will cause bicarbonate to be converted to carbon dioxide. A number of recent studies have shown that end-tidal CO2 varies directly with cardiac output during cardiac arrest (34,35) and provides a useful indicator of the efficacy of resuscitation efforts. The relative effect of pharmacologic intervention during cardiopulmonary resuscitation (CPR) can also be assessed by the ETCO2. For example, following the administration of epinephrine, the prior relationships of end-tidal CO2 may be altered due to the changes in pulmonary and peripheral vascular resistance and preferential redirection of blood flow (36). In some instances, epinephrine may cause decreased pulmonary blood flow and end-tidal CO2, while at the same time coronary perfusion pressure increases because of increased peripheral vascular resistance (37).
Investigators have used end-tidal CO2 as a substitute for the measurement of blood flow in studies of CPR techniques (38,39). Because end-tidal CO2 is directly related to cardiac output when minute ventilation is held constant, it is a useful tool for bedside real-time evaluation of effectiveness of chest compression. Unfortunately, if ventilation is not constant in any low state, including cardiac arrest, then end-tidal carbon dioxide levels are unreliable.
Capnography Standards in the Intensive Care Unit
The American Association of Respiratory Care (AARC) strongly recommends the use of capnography in patients who are mechanically ventilated in the intensive care unit (ICU). However, when capnography is used as an indirect monitor of PaCO2 in the critically ill patient, one has to consider limitations that can affect the accuracy of this technology, as listed below:
1. The composition of the respiratory gas mixture may affect the capnogram, such as the use of high O2 concentrations in critically ill patients (40).
2. The breathing frequency may alter the slope of phase III and the PETCO2 measured value (41).
3. The presence of Freon, used as a propellant in metered-dose inhalers, can cause an artificial increase of the PETCO2 reading (42).
4. Contamination of the monitor or sampling system by secretions or condensate, a sample tube of excessive length, a sampling rate that is too high, or obstruction of the sampling chamber can lead to unreliable results.
5. Use of filters can lead to falsely low PETCO2 readings (43).
6. Small tidal volume delivery, especially in neonates and pediatric patients, with low continuous flow rates that leak into the ventilator circuit, around the tracheal tube cuffs, or as a result of uncuffed tubes can result in a factitiously low PETCO2 value (44).
7. A low cardiac output state may result in an artificially low PETCO2 value.
8. In the presence of a carbonated beverage in the stomach, one may see several breaths with a factitiously elevated PETCO2 value (45).
Reversal of the PaCO2–PETCO2 Difference
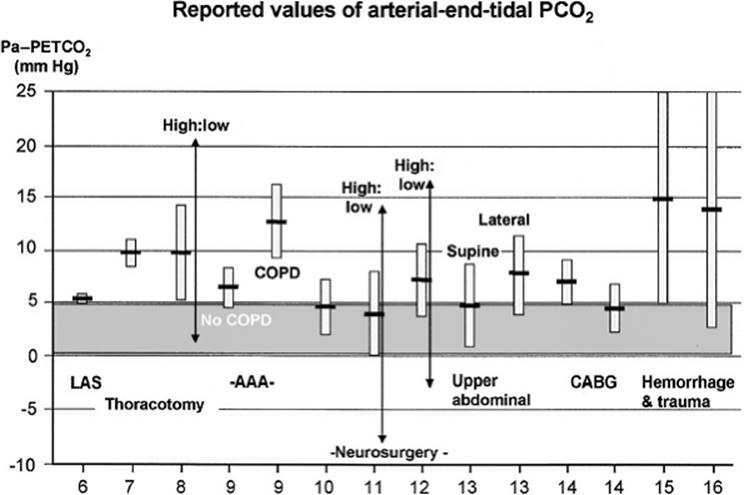
A PETCO2 higher than PaCO2 or “reversed gradient” has been occasionally observed in pregnant and obese patients (46,47). The mechanisms for the reversals remain to be elucidated. However, this phenomenon has been appreciated only when phase III has a steep slope or when a terminal “step-up knee” of the waveform is present. As seen in Figure 22.16, a host of circumstances can be associated with large arterial to alveolar PCO2 differences, rarely attributable to a single mechanism (47).
|
|
|
Figure 22.16. Intraoperative values of the arterial–end-tidal PCO2 differences. The means ± standard deviation of the differences reported in 12 different articles are shown as vertical bars. The numbers on the horizontal axis are the references. The stippled area is the presumed “normal” value of 0 to 5 mm Hg. The surgical procedure is identified. Note that surgical position, major diseases, and unstable cardiovascular status increase the difference. Note also the reported high and low values (arrows). COPD, chronic obstructive pulmonary disease; LAS, lower abdominal surgery; AAA, abdominal aortic aneurysmectomy; CABG, coronary artery bypass grafting. (Reproduced with permission from Wahba RWM, Tessler MJ. Misleading end-tidal CO2 tensions. Brief review. Can J Anaesth. 1996;43:862.) |
Confirmation of Brain Death
The diagnosis of brain death must meet many conditions, one of which is the unresponsiveness of the brainstem to rising carbon dioxide tensions in the absence of drug effects. In 2006, the Stroke Service of the Massachusetts General Hospital (48) presented a detailed description of apnea testing. Key features include, but are not limited to, criteria for body temperature and blood pressures, and call for an arterial pH of 7.35 to 7.45, preoxygenation, and a PaCO2 of 35 to 45 mm Hg for at least 20 minutes prior to discontinuation of mechanical ventilation. After discontinuation of ventilation, apnea is said to exist if PaCO2 increases from 40 mm Hg up to 60 mm Hg, or a 20 mm Hg or greater increase from the pretest baseline. (See the original document for important details.)
Summary
The attention of physiologists and physicians has been recently focused on time and volume capnography to monitor the dynamics of CO2 in critically ill patients as the result of respiratory and/or cardiovascular derangement. Therefore, capnographic features need to be interpreted in view of the clinician's knowledge of either factors. Despite its limitations, capnography can provide significant and clinically useful information, and may often allow life-saving diagnostic and therapeutic alterations. As capnographic technology improves and clinical experience of the intensivist accumulates, we anticipate more widespread use of this monitoring modality in the future.
References
1. Jaffe MB. Brief history of time and volumetric capnography. In: Gravenstein JS, Jaffe MB, Paulus DA, eds. Capnography, Clinical Aspects. Cambridge, UK: Cambridge University Press; 2004:341–354.
2. Rosner V, Hannhart B, Chabot F, et al. Validity of transcutaneous oxygen/carbon dioxide pressure measurement in the monitoring of mechanical ventilation in stable chronic respiratory failure. Eur Respir J. 1999;13:1044.
3. Groeneveld ABJ. Tonometry of partial carbon dioxide tension in gastric mucosa: use of saline, buffer solutions, gastric juice or air. Crit Care. 2000;4:201.
4. Creteur J, De Backer D, Sakr Y, et al. Sublingual capnometry tracks microcirculatory changes in septic patients. Intensive Care Med. 2006;32:516.
5. Weiss M, Schmitz A, Salgo B, et al. Rectal luminal PrCO2, measured by automated air tonometry, does not reflect gastric luminal PrCO2 in children. J Anesth. 2006;20:243.
6. Hagerty JJ, Kleinman ME, Zurakowski D, et al. Accuracy of a new low-flow sidestream capnography technology in newborns: a pilot study. J Perinatol. 2002;22:219.
7. Jaffe MB. In: Gravenstein JS, Jaffe MB, Paulus DA, eds. Capnography, Clinical Aspects. Cambridge, UK: Cambridge University Press; 2004:413–421.
8. Fletcher R. In: Gravenstein JS, Jaffe MB, Paulus DA, eds. Capnography, Clinical Aspects. Cambridge, UK: Cambridge University Press; 2004:381–384.
9. Ball JA, Grounds RM. Calibration of three capnographs for use with helium and oxygen gas mixtures. Anaesthesia. 2003;58:156.
10. Lauzon A, Elliott AR, Paiva M, et al. Cardiogenic oscillation phase relationships during single-breath tests performed in microgravity. J Appl Physiol. 1998;84:661.
11. Kazama T, Ikeda K, Kato T, et al. Carbon dioxide output in laparoscopic cholecystectomy. Br J Anaesth. 1996;76:530.
12. O'Connor BR, Kussman BD, Park KW. Severe hypercarbia during cardiopulmonary bypass: a complication of CO2 flooding of the surgical field. Anesth Analg. 1998;86:264.
13. Adnet P, Lestavel P, Krivosic-Horber R. Neuroleptic malignant syndrome. Br J Anaesth. 2000;85:129.
14. Macefield G, Burke D. Paresthesia and tetany induced by voluntary hyperventilation increased excitability of human cutaneous and motor axons. Brain. 1991;114:527.
15. Morey TE. Carbon dioxide production and anesthesia. In: Gravenstein JS, Jaffe M, Paulus DA, eds. Clinical Capnography: Clinical Aspects. Carbon Dioxide Over Time and Volume. Cambridge, UK: Cambridge University Press; 2004:257–268.
16. Strömberg NOT, Gustafsson PM. Ventilation inhomogeneity assessed by nitrogen washout and ventilation-perfusion mismatch by capnography in stable and induced airway obstruction. Pediatr Pulmonol. 2000;29:94–102.
17. Brown LH, Gough JE, Seim RH. Can quantitative capnometry differentiate between cardiac and obstructive causes of respiratory distress? Chest. 1998;113:323–326.
18. Saura P, Blanch L, Lucangelo U, et al. Use of capnography to detect hypercapnic episodes during weaning from mechanical ventilation. Intensive Care Med. 1996;22:374–381.
19. Niehoff J, DelGuercio C, LaMorte W, et al. Efficacy of pulse oximetry and capnometry in postoperative ventilatory weaning. Crit Care Med. 1988;16:701–705.
20. Hubble CL, Gentile MA, Tripp DS, et al. Deadspace to tidal volume ratio predicts successful extubation in infants and children. Crit Care Med. 2000;28:2034–2040.
21. Gabrielli A, Euliano N, Layon AJ, et al. Deadspace volume-to-tidal volume ratio for classifying pulmonary dysfunction in respiratory failure, abstracted. Anesthesiology. 2007;107:A1520.
22. Nuckton TJ, Alonso JA, Kallet RH, et al. Pulmonary dead-space fraction as a risk factor for death in the acute respiratory distress syndrome. N Engl J Med. 2002;346:1281–1286.
23. Murray IP, Modell JH, Gallagher TJ, et al. Titration of PEEP by the arterial minus end-tidal carbon dioxide gradient. Chest. 1984;85:100–104.
24. Schreiner MS, Leksell LG, Gobran SR, et al. Microemboli reduce phase III slopes of CO2 and invert phase II slopes of infused SF6. Respir Physiol. 1993;91:137–154.
25. Nikodymova L, Daum S, Stiksa J, et al. Respiratory changes in thromboembolic disease. Respiration. 1968;25:51–66.
26. Patel MM, Rayburn DB, Browning JA, et al. Neural network analysis of the volumetric capnogram to detect pulmonary embolism. Chest. 1999;116:1325–1332.
27. Weil MH, Bisera J, Trevino RP, et al. Cardiac output and end-tidal carbon dioxide. Crit Care Med. 1985;13:907–909.
28. Ward KR. The basis for capnometric monitoring in shock. In: Gravenstein JS, Jaffe MB, Paulus DA. Capnography, Clinical Aspects. Cambridge, UK: Cambridge University Press; 2004:223–222.
29. Leigh MD, Jones JC, Motley HL. The expired carbon dioxide as a continuous guide of the pulmonary and circulatory systems during anesthesia and surgery. J Thorac Cardiovasc Surg. 1961;41:597–610.
30. Bhende MS, Thompson AE, Cook DR. Validity of a disposable end-tidal CO2 detector in verifying endotracheal tube position in infants and children. Ann Emerg Med. 1990;19:483.
31. Mickelson KS, Sterner SP, Ruiz E. Exhaled PCO2 as a predictor of endotracheal tube placement. Ann Emerg Med. 1986;15:657.
32. Ornato JP, Shipley JB, Racht EM, et al. Multicenter study of end-tidal carbon dioxide in the prehospital setting. Ann Emerg Med. 1992;21:518–523.
33. Vukmir RB, Heller MB, Stein KL. Confirmation of endotracheal tube placement: a miniaturized qualitative CO2 detector. Ann Emerg Med. 1991;20:726–729.
34. Kalenda Z. The capnogram as a guide to the efficacy of cardiac massage. Resuscitation. 1978;6:259–263.
35. Sanders AB, Atlas M, Ewy GA, et al. Expired CO2 as an index of coronary perfusion pressure. Am J Emerg Med. 1985;3:147–149.
36. Garnett AR, Ornato JP, Gonzalez ER, et al. End-tidal carbon dioxide monitoring during cardiopulmonary resuscitation. JAMA. 1987;257:512–515.
37. Martin GB, Gentile NT, Paradis NA, et al. Effect of epinephrine on end-tidal carbon dioxide monitoring during CPR. Ann Emerg Med. 1990;19:396–398.
38. Ornato JP, Levine RL, Young DS, et al. Effect of applied chest compression on systemic arterial pressure and end-tidal carbon dioxide concentration during CPR in human beings. Ann Emerg Med. 1989;18:732–737.
39. Ornato JP, Gonzalez ER, Garnett AR, et al. Effect of cardiopulmonary resuscitation compression rate on end-tidal carbon dioxide concentration and arterial pressure in man. Crit Care Med. 1988;16:241–245.
40. Ammann EC, Galvin RD. Problems associated with the determination of carbon dioxide by infrared absorption. J Appl Physiol. 1968;25:333–335.
41. Graybeal JM, Russell GB. Relative agreement between a man and mass spectrometry for measuring end-tidal carbon dioxide. Respir Care. 1994;39:190–194.
42. Elliott WR, Raemer DB, Goldman DB, et al. The effects of bronchodilator-inhaler aerosol propellants on respiratory gas monitors. J Clin Monit. 1991;7:175–180.
43. Hardman JG, Curran J, Maharan RP. End-tidal carbon dioxide measurement and breathing system filters. Anaesthesia. 1997;52:646–648.
44. Branson RD. The measurement of energy expenditure: instrumentation, practical considerations, and clinical application. Respir Care. 1990;35:640–656.
45. Li J. Capnography alone is imperfect for endotracheal tube placement confirmation during emergency intubation. J Emerg Med. 2001;20:223–229.
46. Shankar KB, Moseley H, Kumar Y, et al. Arterial to end tidal carbon dioxide tension difference during caesarean section anaesthesia. Anaesthesia. 1986;41:698.
47. Wahba RWM, Tessler MJ. Misleading end-tidal CO2 tensions. Brief review. Can J Anaesth. 1996;43:862.
48. Stroke Service of the Massachusetts General Hospital. http://www.massgeneral.org/stopstroke/protocolBrainDeath.asp. Accessed.