Emanuel P. Rivers
Ronny Otero
A. Joseph Garcia
Konrad Reinhart
Arturo Suarez
Immediate Concerns
During initial management of the critically ill patient, physiologic variables such as blood pressure, heart rate, urine output, cardiac filling pressures, and cardiac output (CO) are used to guide resuscitative efforts. Despite normalization of these variables, significant imbalances between systemic oxygen delivery ([D with dot above]O2) and demand result in decreases in central (Sc[v with bar above]O2) and mixed (S[v with bar above]O2) venous oxygen saturation levels and global tissue hypoxia (1,2,3). This global tissue hypoxia, if left untreated, leads to anaerobic metabolism, lactate production, and oxygen debt. The magnitude and duration of oxygen debt have been implicated in the development of the inflammatory response, multisystem organ failure and increased mortality (4,5,6,7,8). Early restoration of global tissue normoxia aided by venous oxygen saturation monitoring has resulted in a reduction in inflammation, morbidity, mortality, and health care resource consumption (9,10). The purpose of this chapter is to review the physiologic principles and clinical utility of S[v with bar above]O2 in the management of the critically ill patient.
Major Problems
Patient Selection for Continuous Venous Oximetry
Continuous venous oximetry is likely to be most useful in patients at greatest risk of developing global tissue hypoxia. This includes patients with significant acute or chronic cardiopulmonary disease undergoing major surgical procedures and undergoing therapy that may interfere with their ability to increase oxygen delivery during times of stress. It is also useful in patients who require hemodynamic and ventilator support (11).
Goals of Venous Oximetry Monitoring
The goals of continuous venous oximetry vary depending on the initial condition of the patient. Venous oximetry can be used as an end point in the early resuscitation or monitoring device for high risk patients at risk for developing global tissue hypoxia. The common goal is to ensure a balance between systemic oxygen delivery and demands. A stable and normal value for the S[v with bar above]O2 may indicate that further measurements are unnecessary. However, an abrupt decrease in S[v with bar above]O2 becomes a warning that investigation of oxygen delivery (CO, arterial oxygen saturation [SaO2], and hemoglobin [Hgb] concentration), and systemic oxygen consumption [[V with dot above]O2] are needed so that specific therapy may be directed toward the underlying disorder (12).
Stress Points
1. A normal S[v with bar above]O2 range is 65% to 75% (0.65 to 0.75) and suggests that the oxygen supply is meeting the demands of the tissues. Since S[v with bar above]O2 is a global value, a normal value does not guarantee absence of ischemic tissues.
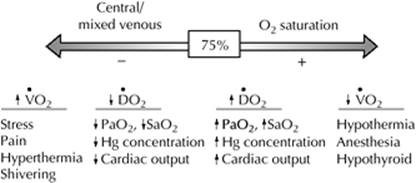
2. There are four determinants of S[v with bar above]O2: CO, Hgb concentration, arterial oxygen content, and [V with dot above]O2. In the critically ill patient, an abrupt change in S[v with bar above]O2indicates that a change in oxygen transport–demand balance has occurred but does not identify which determinant has changed.
3. A decrease in S[v with bar above]O2 may be caused by a decrease in CO, Hgb concentration, and arterial oxygen content or an increase in [V with dot above]O2.
4. An increase in S[v with bar above]O2 is more difficult to interpret. It may indicate distal migration of the catheter which is easy to check by determining catheter position (see below). Patients may have a high CO, [V with dot above]O2, or high arterial oxygen content, especially during anesthesia or mechanical ventilation where there is a larger amount of dissolved oxygen. If this is associated with persistent elevation of lactate levels, it is an ominous sign. In patients with cirrhosis, sepsis, and peripheral shunts, an abnormal distribution of peripheral blood flow may impair oxygen uptake so that S[v with bar above]O2 remains high. In cirrhosis, there is pathologic shunting between the arterial and venous system in the liver causing a high CO and high S[v with bar above]O2. The septic state is accompanied by a peripheral oxygen deficit, which can be partially reversed by maintaining an above-normal CO and [D with dot above]O2 (13). Higher-than-normal S[v with bar above]O2 may be required in sepsis to overcome the defect in peripheral oxygen use. Patients with anatomic shunts such as ventricular septal defects and arterial-venous fistulas for hemodialysis also may have abnormal mixing of arterial and venous blood leading to higher venous oxygen saturations.
5. Pulse oximetry and mixed venous oximetry can be combined into a tool of continuous cardiac and pulmonary monitoring.
6. The difference between arterial and venous saturation (SaO2 -S[v with bar above]O2) is an estimation of arterial venous oxygen content difference and is inversely proportional to CO and directly proportional to oxygen consumption.
7. The ventilation/perfusion index ([V with dot above]/[Q with dot above] I) gives an estimate of intrapulmonary shunt. Using saturation as an inference of oxygen content, respiratory dysfunction ([V with dot above]/[Q with dot above] I) can be estimated from the equation (1 – SaO2)/(1 – S[v with bar above]O2).
Essential Troubleshooting Procedures
1. Continuous S[v with bar above]O2 measurements may drift and require daily calibration using laboratory co-oximetry.
2. Calibration should also be verified anytime the optical module is disconnected, or whenever the measurement is thought to be erroneous.
3. Distal migration of the pulmonary artery catheter (PAC) tip may cause a higher S[v with bar above]O2 reading due to proximity to pulmonary capillary blood, which is approximately 100% saturated. The catheter should be positioned in a large enough segment of the pulmonary artery to require ≤1.25 mL of air in the balloon to occlude that segment.
4. Infusion of fluids or blood through the distal port of the catheter may alter the light signal and the reading.
5. Decreased light intensity signal or damping of the pulmonary artery (PA) tracing may indicate migration distally or fibrin around the optic bundles. If irrigation of the catheter does not correct the artifact, the catheter should be withdrawn and repositioned.
6. A change in S[v with bar above]O2 of greater than 10% in either direction requires investigation.
Initial Therapy
1. If S[v with bar above]O2 is low in association with a low CO, optimization procedures with fluids or inotropic agents should occur immediately. When titrating inotropic infusions, a lack of response (S[v with bar above]O2 does not increase) suggests inadequate therapy. CO should be reassessed and treatment augmented.
2. In cases of respiratory dysfunction, arterial saturation should respond to therapies such as increased fraction of inspired oxygen (FiO2) and positive end-expiratory pressure (PEEP) within 8 to 10 minutes. If SaO2 does not increase or if S[v with bar above]O2 decreases, either respiratory therapy has been ineffective or CO may be compromised.
3. After improvement in respiratory function, if the patient is receiving a high FiO2, the FiO2 may be decreased every 10 to 20 minutes if arterial and venous saturation remain stable. Increased difference in (SaO2 minus S[v with bar above]O2) usually correlates with a sudden decrease in CO.
4. A decrease in A-V S[v with bar above]O2 difference that increase (SaO2 minus S[v with bar above]O2) in response to measures CO indicates a successful intervention.
Physiology of Oxygen Transport
The process of oxygen transport includes loading oxygen into the red blood cells (hemoglobin) and delivering it to the tissue by the heart (cardiac output), as well as utilization of the oxygen in the periphery and the return of deoxygenated blood to the right side of the heart. Several terms must be defined to understand the components of oxygen transport (absolute values should be indexed to body surface area):
· Oxygen delivery ([D with dot above]O2) is the volume of oxygen delivered (mL/minute) from the left ventricle each minute. [D with dot above]O2 = CO × CaO2 × 10
· Arterial content of oxygen (CaO2) is the mL of O2 in 100 mL of arterial blood.
· CaO2 = (Hgb × 1.34 to 1.39 mL O2/gm of Hgb × SaO2) + (0.0031 × PaO2)
· Mixed venous content of oxygen (C[v with bar above]O2) is mL of O2 in 100 mL of mixed venous blood. C[v with bar above]O2 = (Hgb × 1.34 to 1.39 mL O2/gm of Hgb × S[v with bar above]O2) + (0.0031 × P[v with bar above]O2)
· Oxygen demand is the cellular oxygen requirement to avoid anaerobic metabolism. Oxygen demand is the amount of oxygen required by the body tissues to function under conditions of aerobic metabolism. Because oxygen demand is determined at the tissue level, it is difficult to quantify clinically.
· Oxygen consumption ([V with dot above]O2) is the amount of oxygen consumed by the tissue, usually calculated by the Fick equation:
· [V with dot above]O2 is a mechanism by which the body “protects” the oxygen demand created at the tissue level. Increased [V with dot above]O2 in early stages of shock is associated with increased survival. Oxygen consumption may increase by increasing CO, widening the arterial-venous oxygen content difference, or both. In the normal state, both CO and arterial-venous oxygen difference may increase by about threefold, providing a total increase of [V with dot above]O2 during times of stress to about ninefold above the resting state. Normally, [V with dot above]O2 and oxygen demand are equal; however, in times of great oxygen demand or times in which either CO or arterial- venous oxygen content difference cannot increase to meet the oxygen demand of the cells, oxygen demand may exceed [V with dot above]O2. When this occurs, an oxygen debt accumulates and anaerobic metabolism and lactic acidosis ensue (14).
· Oxygen uptake is the measured volume of oxygen removed from inspired gas each minute (using indirect calorimetry/metabolic gas monitor). Oxygen uptake differs slightly from [V with dot above]O2 in that the latter is a calculated value (from the Fick equation) and the former is the measured volume of oxygen taken up by the patient each minute. Oxygen uptake is measured by analyzing inspired and expired gas concentrations and inspired and expired volumes. Measurement of oxygen uptake may be useful for metabolic studies in assessing variations in [V with dot above]O2 as well as determining caloric needs.
· Oxygen utilization coefficient (OUC) or extraction ratio (O2ER) is the fraction of delivered oxygen that is consumed. OUC or O2ER = [V with dot above]O2/[D with dot above]O2
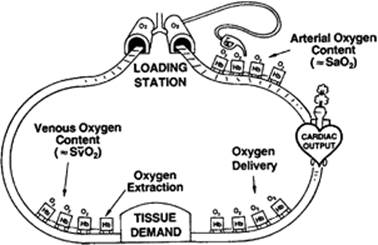
· Therefore, the oxygen utilization coefficient defines the balance between oxygen supply (delivery) and demand (consumption) (Fig. 26.1).
· Oxygen transport is the processes contributing to oxygen delivery and oxygen consumption.
Assessment of Oxygen Transport Balance
Oxygen transport balance may be assessed on several levels. First, examination of the patient may reveal signs of hypoperfusion, including altered mentation, cutaneous hypoperfusion, oliguria, tachycardia, and, when all compensatory systems have failed, hypotension. Unfortunately, these clinical signs are often late, nonspecific, and at times uninterruptible in critically ill patients. A more physiologic approach is to assess the determinants of oxygen transport balance individually by using the Fick equation. The arterial-venous oxygen content difference may be used to assess the relative balance between CO and [V with dot above]O2. An increase in the arterial-venous oxygen content difference indicates that either flow is decreased or consumption is increased.
|
|
|
Figure 26.1. The physiology of oxygen transport and utilization. |
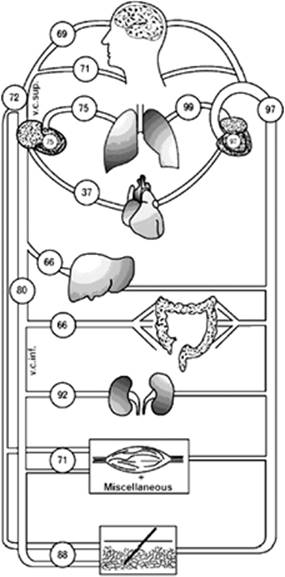
When the Fick equation is solved for S[v with bar above]O2 (Table 26.1), it becomes apparent that an inverse linear relation exists between S[v with bar above]O2 and oxygen utilization coefficient (11) if SaO2 is maintained constant. S[v with bar above]O2 measured continuously is, therefore, an on-line indicator of the adequacy of the oxygen supply and of the demand in perfused tissues. The determinants of S[v with bar above]O2 are [V with dot above]O2, Hgb, CO, SaO2, and, to a small degree, PaO2. S[v with bar above]O2 represents the flow-weighted average of the venous oxygen saturations from all perfused tissues (Fig. 26.2). Therefore, tissues that have high blood flow but relatively low oxygen extraction (kidney) will have a greater effect on S[v with bar above]O2 than will tissues with low blood flow, although the oxygen extraction of these tissues may be high (myocardium) (15,16).
The interpretation of S[v with bar above]O2 requires consistent and intact vasoregulation (5). When vasoregulation is altered (such as in sepsis), oxygen uptake may be severely altered, causing a marked increase in S[v with bar above]O2. Septic patients can have a normal S[v with bar above]O2 while the hepatic venous saturation can be up to 15% lower (17,18). This reduced oxygen saturation was noted to arise from an increased regional metabolic rate rather than reduced perfusion. Flow-limited regional oxygen consumption may potentially exist despite the presence of a normal S[v with bar above]O2. Therefore, a normal S[v with bar above]O2 should not be considered as sole criteria to ensure optimal oxygen delivery in critically ill patients (19,20) (Fig. 26.3).
|
Table 26.1 Derivation of S[v with bar above]O2 from Fick Equation |
||||||||||||||||||
|
||||||||||||||||||
|
|
||||||||||||||||||
|
Figure 26.2. Venous oxygenation saturations of various organs. (From Reinhart K, Rudolph T, Bredle DL, et al. Comparison of central-venous to mixed-venous oxygen saturation during changes in oxygen supply/demand. Chest. 1989;95(6):1216–1221.) |
||||||||||||||||||
|
|
|
Figure 26.3. Variables that affect S[v with bar above]O2. (From Rivers EP, Ander DS, Powell D. Central venous oxygen saturation monitoring in the critically ill patient. Curr Opin Crit Care. 2001;7(3):204–211.) |
Although oxygen demand cannot be measured, the relative balance between consumption and demand is best indicated by the presence of excess lactate in the blood. Lactic acidosis implies that demand exceeds consumption or oxygen supply dependency and anaerobic metabolism is present (14,21,22) (Fig. 26.4). The relative balance between oxygen supply and demand can be assessed by the oxygen utilization coefficient (1). Calculation of this coefficient, however, requires the measurement of CO, Hgb, SaO2, PaO2, S[v with bar above]O2, and mixed venous oxygen tension (P[v with bar above]O2). Mixed venous oxygen tension, a reflection of both PaO2 and CO, is a better predictor of hyperlactatemia and death than either arterial PaO2 or CO alone. A P[v with bar above]O2 below 28 mm Hg is usually associated with hyperlactatemia and increased mortality (23). Blood lactate concentrations greater than 4 mmol/L are unusual in normal and noncritically ill hospitalized patients and warrant concern. In hospitalized (non-ICU) nonhypotensive subjects, as well as in critically ill patients, a blood lactate concentration greater than 4 mmol/L may portend a poor prognosis (24). Since serum lactate is a global measurement, a normal lactate is not a guarantee that all tissue beds are adequately perfused.
Arterial Venous Oxygen Content Difference
From the Fick principle, we learned that CO was equal to oxygen consumption divided by arterial venous oxygen content difference (CaO2 – CvO2). Even in the critically ill patient, it is unlikely that Hgb or total body oxygen consumption can change sufficiently minute to minute to affect the calculations. Therefore, (Ca – [v with bar above])O2 usually reflects changes in cardiac output. In addition, immediate response to therapy—or lack thereof—can help tailor therapy more precisely and rapidly (25). Since the contribution of dissolved oxygen is minute (0.0031 × partial pressure of oxygen), and the factor (Hgb × 1.39 mL O2/gm Hgb) occurs in both sides of the equation, (Ca – [v with bar above])O2 can be estimated by subtracting the values of pulse oximetry and continuous mixed venous oximetry (SaO2 – S[v with bar above]O2).
|
|
|
Figure 26.4. The relationship of oxygen transport variables and lactate levels. |
Intrapulmonary Shunt
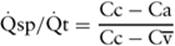
Although PaO2 is affected by changes in respiratory function (intrapulmonary shunt), PaO2 is also affected by changes in CO if there is a moderate intrapulmonary shunt (≥20%). For example, if there is a 20% shunt (20% of CO is not involved with gas exchange) and blood goes to the left side of the heart deoxygenated, any decrease in S[v with bar above]O2 will decrease PaO2. Thus, although no change in pulmonary function has occurred, a decrease in CO (or even any factor that decreases venous oxygen content) lowers PaO2 and increases the alveolar-to-arterial oxygen tension gradient (26). This nonpulmonary effect on PaO2 is important to understand since treatment of intrapulmonary shunt is to increase PEEP, which would be disastrous if low CO was the cause for low PaO2. The equation for intrapulmonary shunt is as follows:
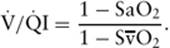
where [Q with dot above]sp/[Q with dot above]t is physiologic shunt (% of cardiac output), Cc is capillary oxygen content, Ca is arterial oxygen content, and C[v with bar above] is venous oxygen content. We can simplify the shunt equation by ignoring the calculation of Hgb-carried oxygen by dropping (Hgb × 1.39) and substituting saturations of 100% for the pulmonary capillary saturation, pulse oximetry for arterial saturation, and mixed venous oximetry for S[v with bar above]O2. The entire equation for pulmonary capillary content can be replaced by the term 1 (or 100% Hgb saturation). Because we have already substituted Sa for arterial content and S[v with bar above] for venous content, this estimation of physiologic shunt (the [V with dot above]/[Q with dot above] I) can be represented by the equation (27):
|
|
|
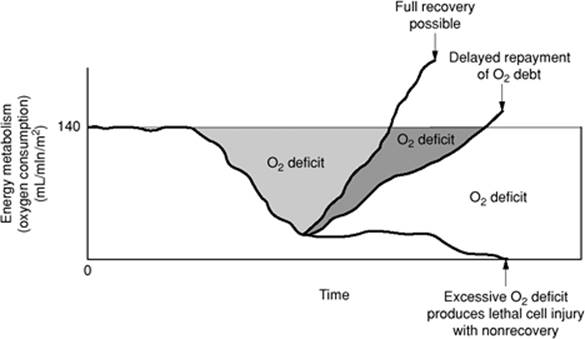
Figure 26.5. The concepts of oxygen debt. (From Dunham CM, Siegel JH, Weireter L, et al. Oxygen debt and metabolic acidemia as quantitative predictors of mortality and the severity of the ischemic insult in hemorrhagic shock. Crit Care Med. 1991;19(2):231–243; Rixen D, Siegel JH. Bench-to-bedside review: oxygen debt and its metabolic correlates as quantifiers of the severity of hemorrhagic and post-traumatic shock. Crit Care. 2005;9(5):441–453; and Siegel JH. The effect of associated injuries, blood loss, and oxygen debt on death and disability in blunt traumatic brain injury: the need for early physiologic predictors of severity. J Neurotrauma. 1995;12(4):579–590.) |
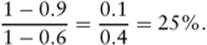
For instance, if arterial saturation were 90% (or 0.9) and venous saturation were 60% (or 0.6), the Qs/Qt calculation would be
This estimation fails to reflect the severity of respiratory failure as judged by the need to use a FiO2, and this equation needs to specify the FiO2 of the patient to be meaningful.
The Consequences of Tissue Hypoxia
When compensatory mechanisms such as increased systemic oxygen extraction are exceeded, tissue hypoxia results with pathologic significance not only in vitro (4), but also, low S[v with bar above]O2 is associated with the generation of inflammation and the mitochondrial impairment of oxygen use (28). The accumulation of global tissue hypoxia over time leads to oxygen deficits. The magnitude and duration of this oxygen debt has been associated with the generation of inflammatory biomarkers, morbidity, and mortality (8,28,29,30,31,32) (Fig. 26.5).
Monitoring Oxygen Transport
Critically ill patients in the emergency department (ED), operating room (OR), and intensive care units (ICUs) may be grouped into three categories. Category 1 consists of patients requiring intensive observation or monitoring. These patients may have major risk factors or may be admitted because of the nature of their illness or the nature of the therapy they are receiving. Category 2 patients require intensive nursing care and often specialized technology and care facilities to direct therapy for major systemic illness. Category 3 patients need continuous physician intervention for hemodynamic and other instabilities. Continuous venous oximetry may have clinical applications in each of these broad classes of patients. The three major objectives of monitoring critically ill patients are (i) to ensure that the patient is stable, (ii) to provide an early warning system regarding untoward events, and (iii) to evaluate the efficiency and efficacy of interventions performed.
Category 1 patients undergoing hemodynamic and oxygen transport monitoring only because of underlying risk factors who have a normal and stable S[v with bar above]O2 have an intact balance between oxygen supply and demand. Further assessment of CO and arterial and mixed venous blood gas analysis to reach that conclusion can be eliminated, and there is “safety in no (other) numbers.” If the patient becomes unstable as manifested by a decreasing S[v with bar above]O2, the monitoring system will meet the second objective by providing an early warning of the imbalance in oxygen supply and demand. In this situation, although an alert has been given, the cause of the oxygen transport imbalance is not necessarily clear. The change in S[v with bar above]O2 is sensitive but not specific. In this clinical situation, it may be necessary to measure CO, SaO2, and Hgb. When the cause of the imbalance is identified, specific therapy may be instituted to restore the oxygen supply–demand balance. While interventions are applied, the continuous assessment of supply–demand balance may be used to evaluate the efficacy of the intervention with instant feedback. Continuous CO methodology should supplement but not supplant mixed venous oximetry. This is particularly important in critical illness, defined as a non-steady state, when changes in all elements of oxygen transport and use can be expected (32).
Continuous Mixed Venous (S[v with bar above]O2) Monitoring
S[v with bar above]O2 can be monitored continuously using infrared oximetry. The technology is based on reflection spectrophotometry. Light is transmitted into the blood, and reflected off red blood cells and read by a photodetector in the receiving fiberoptic bundle (11). The amount of light reflected at different wavelengths varies depending on the concentration of oxyhemoglobin and hemoglobin (Fig. 26.6). The microprocessor uses the relative reflectances to calculate the oxyhemoglobin and total Hgb, the fraction of which represents S[v with bar above]O2. The catheter used to measure venous oxygen saturation can be a pulmonary artery or a modified central venous catheter.
|
|
|
Figure 26.6. The technology of spectrophotometry. (From Rivers EP, Ander DS, Powell D. Central venous oxygen saturation monitoring in the critically ill patient. Curr Opin Crit Care. 2001;7(3):204–211.) |
The continuous oximetry system must be calibrated before use by a co-oximetry measured sample (33). This may be done in vitro by positioning the catheter tip next to a target that reflects the transmitted light in such a manner that the microprocessor can be calibrated. After in vitro calibration, the oxygen saturation of the central venous system, right atrium, right ventricle, and PA can be measured while the catheter is being floated into the proper position. These measurements during the insertion of the catheter may be useful to rule out intracardiac left-to-right shunts.
Once the PA catheter is in proper position, blood may be sampled through the distal port to calibrate or to verify the calibration of the system. The first in vivo calibration is usually done at 24 hours post–PAC insertion. A mixed venous sample is withdrawn and analyzed by laboratory co-oximetry. Blood drawn from the PA should be aspirated slowly (1 mL over 20 seconds) to prevent contamination by the highly oxygenated pulmonary capillary blood. The value obtained by the microprocessor at the time the blood sample is drawn is retained by the system. This may be compared against the value obtained from the laboratory sample, and, if a significant (greater than 2%) difference exists, the instrument may be recalibrated to the laboratory co-oximeter value. The calibration should be verified at any time the optical module is disconnected from the catheter, whenever the measurement is suspected of being erroneous, and every 24 hours to ensure stability of the system.
Because it is crucial that red blood cells be flowing past the tip of the catheter, proper positioning in the PA is necessary. Distal migration of the PA catheter tip is a common source of error. When the catheter tip advances into the distal segments of the PA, a high or increased S[v with bar above]O2, a decreased light intensity signal, or damping of the PA tracing may become evident. If these signs are encountered, the distal lumen of the catheter should be irrigated with flush solution to remove fibrin on the catheter tip. If the pressure waveform is not restored to a proper PA tracing by irrigation, the catheter should be slowly withdrawn until the PA pressure tracing is restored. At this point, the PA catheter balloon may be slowly inflated until the pulmonary artery occlusion pressure (PAOP) tracing is observed. If this tracing is not produced by inflation of the balloon to maximum volume (1.5 mL), the catheter should be slowly advanced until an occlusion pressure tracing is observed. At that point, the balloon can be deflated again and then slowly reinflated until a PAOP tracing occurs. The volume required to restore this tracing should be at least 75% of the total capacity of the balloon. Using the maximum balloon volume to attain a PAOP tracing ensures that the catheter is in the proximal section of the PA and is, in fact, a physiologic confirmation of the catheter tip position.
Distal migration of the PA catheter may cause artifactually high oxygen saturation because highly saturated (approximately 100%) pulmonary capillary blood is sampled. The catheter tip may be lodged against a vessel wall or bifurcation, causing an alteration in the light intensity received by the fiberoptic bundles. A low light intensity alarm must be corrected before the venous saturation measurement is considered reliable or before the system is recalibrated. Large fluctuations in the light intensity signal may indicate that the catheter tip is malpositioned but also may indicate a condition of intravascular volume deficit that allows compression or collapse of the pulmonary vasculature (especially during positive pressure ventilation) (34).
Continuous Central Venous (Scoverline[v with bar above]O2) Monitoring
Early management of the critically ill patient is frequently performed outside the intensive care unit. The time between the onset of critical illness and definitive ICU intervention can be significantly long and have outcome implications (35,36,37). Measurement of S[v with bar above]O2 requires placement of a pulmonary artery catheter, which may not be feasible early in the resuscitation of adult, pediatric, and neonatal patients. However, central venous assess can be obtained in both ICU and non-ICU settings making continuous Sc[v with bar above]O2 monitoring a convenient surrogate for S[v with bar above]O2.
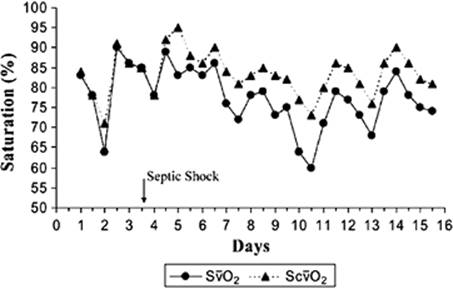
Numerous animal and human models have examined the relationship between S[v with bar above]O2 and Sc[v with bar above]O2 obtained from the superior vena cava and right atria (Fig. 26.7). Superior venal caval (SVC) Sc[v with bar above]O2 is slightly lower and more accurately reflects S[v with bar above]O2 when patients were not in shock (38,39). Right atrial Sc[v with bar above]O2 has a better correlation than superior vena caval saturation and is not significantly different from S[v with bar above]O2 whether in shock or not in shock (38). In patients in shock a consistent reversal of this relationship occurs, the Sc[v with bar above]O2 is greater than S[v with bar above]O2, and this difference can range from 5% to 18% (38,39,40). Redistribution of blood flow away from the splenic, renal, and mesenteric bed toward the cerebral and coronary circulation including more desaturated blood (<30%) from the coronary sinus contribute to this observation (38). Thus, Sc[v with bar above]O2 will consistently overestimate the true S[v with bar above]O2 under shock conditions.
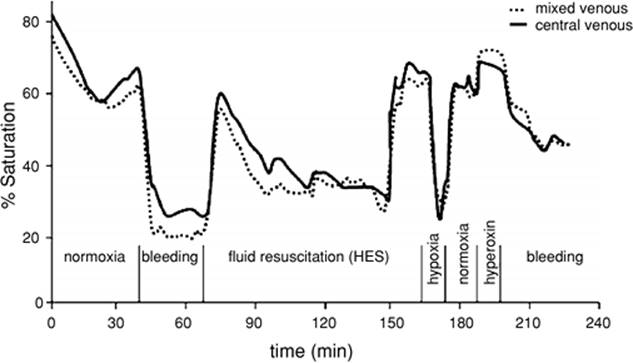
There has been considerable debate regarding whether Sc[v with bar above]O2 is a satisfactory substitute for S[v with bar above]O2, particularly in ranges above 65% (41,42,43,44,45,46,47,48,49,50). Although the absolute values of Sc[v with bar above]O2 and S[v with bar above]O2 differ, studies have shown close and consistent tracking of the two sites across a wide range of hemodynamic conditions (Figs. 26.8 and 26.9), thus making it clinically useful (43,51,52,53,54,55,56,57,58,59,60,61,62). The clinical utility or value of S[v with bar above]O2/Sc[v with bar above]O2 is in the lower ranges. The presence of a pathologically low Sc[v with bar above]O2 value (implying an even lower S[v with bar above]O2) is more clinically important than whether the values are equal. Goldman et al. (51) found that Sc[v with bar above]O2 <60% showed evidence of heart failure or shock or a combination of the two. Hyperdynamic septic shock ICU patients seldom exhibit S[v with bar above]O2 levels <60% to 65%, which, when sustained, is associated with increased mortality (12,63). Studies examining the clinical utility of Sc[v with bar above]O2early in the course of disease presentation routinely encounter values less than 50%, which are considered critical (3,64,65). At these values, venous saturations are actually 5% to 18% lower in the pulmonary artery (38,40) and 15% lower in the splanchnic bed (19). Thus, although not numerically equivalent, these ranges of values have similar pathologic implications (51) and are associated with high mortality (23).
|
|
|
Figure 26.7. Central versus mixed venous oxygen saturation. |
The clinical utility of an end point of resuscitation is determined by whether it changes clinical practice and morbidity/mortality. Irrespective of whether the Sc[v with bar above]O2 equals S[v with bar above]O2, the presence of a low Sc[v with bar above]O2 in early sepsis portends increased mortality and correcting this value by a treatment algorithm (66) improves morbidity and mortality. The concept of the approximately 5% numeric difference between S[v with bar above]O2 and Sc[v with bar above]O2 prompted the Surviving Sepsis Campaign to recommend reaching a S[v with bar above]O2 of 65% and/or Sc[v with bar above]O2 of 70% goal in the resuscitation portion of its severe sepsis and septic shock bundle (67,68).
|
|
|
Figure 26.8. Central versus mixed venous oxygen saturation. (From Reinhart K, Rudolph T, Bredle DL, et al. Comparison of central-venous to mixed-venous oxygen saturation during changes in oxygen supply/demand. Chest. 1989;95(6):1216–1221.) |
Interpretation of Venous Oxygen Saturation
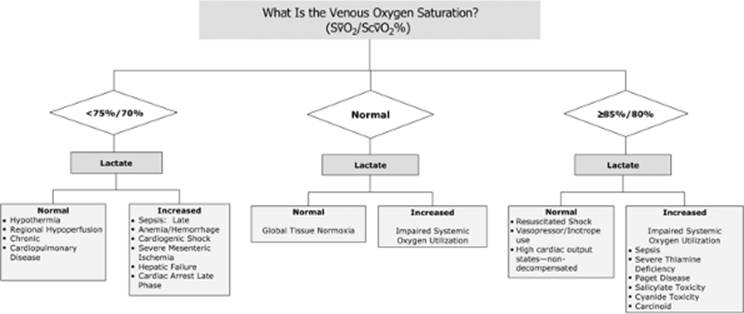
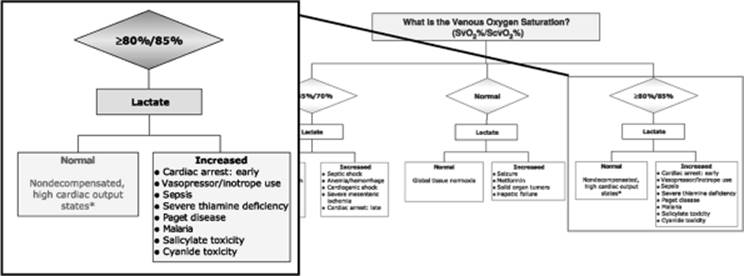
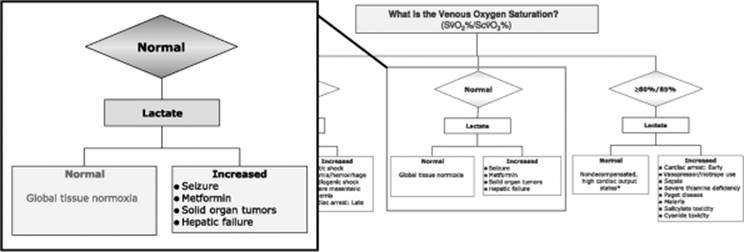
The algorithm is presented in Figure 26.10. Mixed venous oxygen saturation values within the normal range (67%–75%) indicate a normal balance between oxygen supply and demand, provided that vasoregulation is intact and a normal distribution of peripheral blood flow is present. Values of S[v with bar above]O2 greater than 75% indicate an excess of [D with dot above]O2 over [V with dot above]O2and are most commonly associated with syndromes of vasoderegulation such as cirrhosis and sepsis. High values also are seen in states of low [V with dot above]O2 (hypothermia, muscular paralysis, sedation, coma, hypothyroidism, or a combination of these factors), hyperoxygenation, high CO, inability to consume oxygen, and rarely, cyanide toxicity.
Uncompensated changes in any of the four determinants of S[v with bar above]O2 may result in a decrease in the measured value, but in complex, critically ill patients, the correlation between changes in S[v with bar above]O2 and changes in any of the individual determining factors is low (69). In a study of the patients in a surgical ICU, no statistical correlation existed between changes in either PaO2 or SaO2 and S[v with bar above]O2. Although there was a statistically significant correlation between changes in S[v with bar above]O2 and CO and [D with dot above]O2, the coefficients of determination (r2) were too low to allow prediction of CO, oxygen consumption, or oxygen delivery from S[v with bar above]O2. Also, no statistical correlation existed between S[v with bar above]O2 and either arterial-venous oxygen content difference or calculated [V with dot above]O2. There was a significant inverse correlation between S[v with bar above]O2 and oxygen utilization coefficient, confirming the accuracy of the measurement and the reliability of S[v with bar above]O2 as an estimation of the oxygen utilization ratio—as long as arterial oxygen saturation is near 100%. The determinants of S[v with bar above]O2 are multifactorial, and, in critically ill patients, the degree of compensation for changes in one variable cannot be predicted (69). Patients with chronically impaired O2 transport appear to tolerate very low S[v with bar above]O2 values better than acutely ill patients, presumably due to adaptive changes in the former group. Delayed lactate presentation may be seen in this group of patients (70,71).
|
|
|
Figure 26.9. Central versus mixed venous oxygen saturation. HES, hydroxyethyl starch. (From Reinhart K, Rudolph T, Bredle DL, et al. Comparison of central-venous to mixed-venous oxygen saturation during changes in oxygen supply/demand. Chest. 1989;95(6):1216–1221.) |
It is useful, however, to appreciate the magnitude of change in S[v with bar above]O2 that would occur with an isolated change in any of the individual determinants. If no compensatory changes occur in [V with dot above]O2 or CO, Hgb must decrease by almost 50% (13 to 7.5 g/dl/L) before S[v with bar above]O2 decreases below the lower limit of the normal range (Table 26.2). The S[v with bar above]O2changes would be even smaller because CO should increase in response to the acute anemia. However, if CO is fixed because of underlying cardiovascular disease, a decrease in Hgb will be reflected by a decrease in S[v with bar above]O2.
The effect of arterial oxygen tension on S[v with bar above]O2 in the absence of other compensatory changes is demonstrated in Table 26.3. As long as SaO2 is maintained in a relatively normal range, the direct effect on S[v with bar above]O2 is minimal. However, when there is sufficient arterial hypoxemia to produce arterial desaturation, the S[v with bar above]O2 falls in direct proportion to the change in SaO2. Similarly, changes in CO (Table 26.4) and [V with dot above]O2 (Table 26.5) may be shown to affect S[v with bar above]O2, although the magnitude of change in any of these individual parameters does not predict the magnitude of change in S[v with bar above]O2 because compensatory factors are usually involved. A decrease in S[v with bar above]O2 greater than 10% is likely to be clinically significant regardless of the initial value. A change from 70% to 60% may be associated with a large fractional change in CO if other factors did not change. On the other hand, a change from 60% to 50% is associated with a much smaller fractional change in CO but in the range of limited oxygen transport reserve and should raise more concern (Table 26.6).
|
|
|
Figure 26.10. Diagnostic algorithm of Sc[v with bar above]O2/S[v with bar above]O2. |
When demand exceeds consumption, anaerobic metabolism must occur, and the eventual result is lactic acidosis. The lactate level, therefore, defines the balance between [V with dot above]O2 and oxygen demand. An elevated lactate implies either ongoing anaerobic metabolism (shock) or prior anaerobic metabolism and oxygen debt. A normal S[v with bar above]O2 implies the latter and a low S[v with bar above]O2, the former, in states of lactic acidosis, except in situations in which unloading cellular uptake or mitochondrial utilization are impaired.
|
Table 26.2 Effect of Changes in Hemoglobin Concentration on S[v with bar above]O2 |
|||||||||||||||||||||||||
|
|||||||||||||||||||||||||
Clinical Uses of S[v with bar above]O2 Monitoring
S[v with bar above]O2 values have been used extensively in various clinical scenarios in critically ill patients. These include during and after cardiac arrest (72,73), in cardiac surgery patients (74), during and after cardiac failure (75), shock (76), acute myocardial infarction (51,77), general medical ICU conditions (78,79,80), postoperative cardiovascular procedures (81), trauma (82,83,84), vascular surgery (85,86), septic shock (9,12,63), hypovolemia (87,88), pediatric surgery (75), in neonates (89), lung transplantation (90), and cardiogenic shock (91,92).
Cardiac Arrest
Management of the cardiac arrest patient by advanced cardiac life support (ACLS) guidelines include physical examination (i.e., palpation of a pulse) and electrocardiographic monitoring. Sc[v with bar above]O2 monitoring during cardiac arrest has been shown to be a diagnostic and therapeutic adjunct (93,94,95). Cardiac arrest patients routinely have Sc[v with bar above]O2 values of 5% to 20% during cardiopulmonary resuscitation (CPR). Failure to reach an Sc[v with bar above]O2 of at least 40% during the management of cardiac arrest carries a 100% mortality even if the patient has an intermittent measurable blood pressure. These values are consistent with animal models (S[v with bar above]O2 of <43%) using cardiopulmonary bypass (96). Sc[v with bar above]O2 has also been used to confirm the presence or absence of sustainable cardiac activity during electromechanical dissociation (EMD) or a pulseless idioventricular rhythm where over 35% of these patients have been shown to have spontaneous cardiac activity (pseudo-EMD) (97). If the Sc[v with bar above]O2 is greater than 60% during CPR, return of spontaneous circulation (ROSC) is likely, and the pulse should be frequently rechecked if EMD was present. Between Sc[v with bar above]O2 values of 40% and 72%, there is a progressive increase in the rate of ROSC. When an Sc[v with bar above]O2 greater than 72% is obtained, ROSC has likely occurred. Continuous Sc[v with bar above]O2 monitoring also provides an objective measure to confirm the adequacy or inadequacy of CPR in providing [D with dot above]O2.
|
Table 26.3 Effect of Variation in PaO2 on S[v with bar above]O2 |
||||||||||||||||||||||||||||||||||||||||||
|
||||||||||||||||||||||||||||||||||||||||||
|
Table 26.4 Effect of Cardiac Output (CO) on S[v with bar above]O2 |
||||||||||||||||||||||||||||||||||||||||||
|
||||||||||||||||||||||||||||||||||||||||||
Post–Cardiac Arrest Care
In the immediate postresuscitation period, patients are frequently hemodynamically unstable and have a high frequency of rearrest. Blood pressure (1,94) may be rendered insensitive in the measurement of cardiac output or oxygen delivery secondary to the high systemic vascular resistance of catecholamine therapy. An abrupt or gradual decrease in S[v with bar above]O2 (less than 40%–50%) indicates likelihood for rearrest. An S[v with bar above]O2 greater than 60% to 70% indicates hemodynamic stability. A sustained extreme elevation of S[v with bar above]O2 (greater than 80%), or venous hyperoxia, in the presence of a low [D with dot above]O2 and increased lactate levels carries a poor prognosis because it indicates an impairment of systemic oxygen utilization. This has been attributed to long periods of arrest and the use of large doses of vasopressors (98). If this derangement is not corrected within the first 6 hours of the early postresuscitation period, the outcome is uniformly fatal (94). Venous hyperoxia can also be seen after acute myocardial infarction. Postexercise S[v with bar above]O2 overshoot and, hence, decreased systemic oxygen extraction during recovery represent a compensatory response of an enhanced peripheral vascular tone that maintains systemic arterial blood pressure in the setting of reduced cardiac output by linking central and peripheral blood flow (99).
|
Table 26.5 Effect of Oxygen Consumption on S[v with bar above]O2 |
||||||||||||||||||||||||||||||||||||||||||
|
||||||||||||||||||||||||||||||||||||||||||
|
Table 26.6 Percentage of Error Resulting From Estimation of P[v with bar above]O2 |
||||||||||||||||||||||||||||||||||||||||||
|
||||||||||||||||||||||||||||||||||||||||||
Traumatic and Hemorrhagic Shock
The standards of Advanced Trauma Life Support focus on normalization of vital signs (100). Studies have shown that vital signs are insensitive end points of resuscitation and outcome predictors in hemorrhage and trauma resuscitation (1,101). Scalea et al. (101) and Kowalenko et al. (102) have shown that patients presenting with trauma and hemorrhage required additional resuscitation or surgical procedures if the Sc[v with bar above]O2 remained less than 65%. Kremzar et al. (82) examined whether maintaining normal levels of S[v with bar above]O2 in patients with multiple injuries is more relevant to survival than maintaining above-normal levels of oxygen transport. For patients with multiple injuries, maintaining normal S[v with bar above]O2 values and increasing [D with dot above]O2 only if required are more relevant for survival than routine maintenance of above-normal oxygen transport values. In a series of 10 seriously injured patients requiring resuscitation and definitive operative control of hemorrhage, Karzarian and Del Guercio (83) found that improvement of the S[v with bar above]O2 was associated with improved survival. In this study, mixed venous oxygen saturations were valuable predictors of survival and were a helpful parameter to monitor during the resuscitative, operative, and immediate postoperative periods.
Acute and Chronic Heart Failure and Pulmonary Hypertension
Cardiogenic shock is characterized by decreased [D with dot above]O2, decreased S[v with bar above]O2, increased O2ER and evidence of tissue hypoxia (lactic acidosis, end-organ dysfunction) secondary to acute myocardial dysfunction (91,92). S[v with bar above]O2 has been shown to have therapeutic and prognostic utility in patients with acute myocardial infarction (77,92,103,104). Prospective outcome studies have not validated its clinical use in this patient population (105). Ander et al. (64) examined patients who presented with decompensated chronic severe heart failure (ejection fraction <30%) who were stratified into normal and elevated lactate (>2 mmol/L) groups. There was a significant prevalence of “occult cardiogenic shock” (Sc[v with bar above]O2 of 26.4%–36.8%) in the presence of normal vital signs. Using a goal-oriented approach of preload, afterload, contractility, coronary perfusion, and heart rate optimization, these patients required additional therapy compared to their counterparts with normal lactate levels. Sc[v with bar above]O2 and brain natriuretic peptide (BNP) level predict hemodynamics associated with lower survival rates and may be useful as noninvasive markers of prognosis in epoprostenol-treated pulmonary arterial hypertension (PAH) patients (106).
Severe Sepsis and Septic Shock
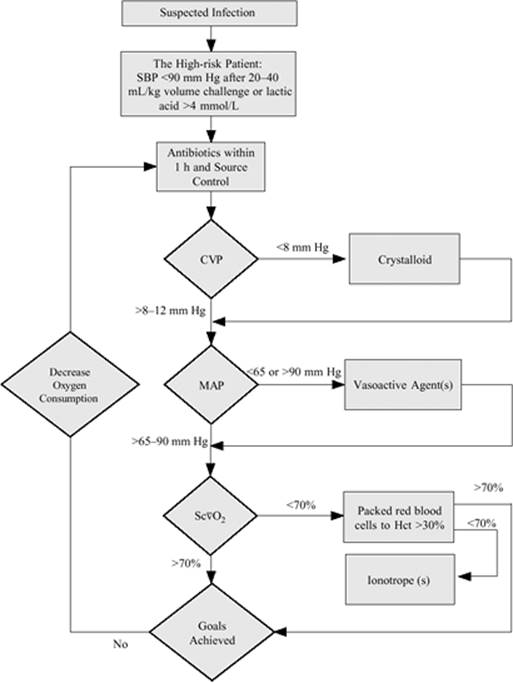
S[v with bar above]O2 in sepsis is commonly referred to as an end point of low impact in clinical decisions in sepsis because of the common perception that S[v with bar above]O2 is always increased in septic ICU patients. However, there are fundamental issues that render this modality clinically useful when applying it to the early stages of supply-dependent phase of sepsis (global tissue hypoxia) where saturation is low in both animal (107,108) and human models of sepsis (103). During this phase S[v with bar above]O2 is inversely correlated with lactate concentration (r = -0.87, p <0.001). These data suggest that cellular oxygen utilization is largely maintained during rapidly fatal septic shock (109,110). Identifying sudden episodes of supply dependency in septic ICU patients (sudden decreases in S[v with bar above]O2) has diagnostic and prognostic significance (10,12,63). Previous studies have examined S[v with bar above]O2-guided goal-directed therapy after ICU admission and have found no outcome benefit in general ICU patients (79). However, in a study evaluating early goal-directed therapy (EGDT) using multiple hemodynamic end points including S[v with bar above]O2 in the most proximal stages of hospital admission, patients presenting with severe sepsis and septic shock were randomized to 6 hours of EGDT or standard therapy before ICU admission. Both groups were resuscitated to a central venous pressure (CVP) >8 mm Hg and mean arterial pressure (MAP) >65 mm Hg; however, the treatment group was resuscitated to a Sc[v with bar above]O2 >70% using additional therapies such as red cell transfusion, inotropes, and mechanical ventilation to reach this end point (Fig. 26.11). Over the initial 72 hours, there was a higher central venous O2 saturation, lower lactate, lower base deficit, and higher pH in the EGDT versus the control group indicating more definitive resolution of global tissue hypoxia. Organ dysfunction, vasopressor use, duration of mechanical ventilation, and mortality were significantly reduced (9). This concept of EGDT has been reproduced in multiple studies and is one of the cornerstones of the resuscitation bundle recommended by the Surviving Sepsis Campaign (111).
Pulmonary Embolus
Patients with massive pulmonary embolism and obstructive shock usually require hemodynamic stabilization, thrombolytics, and mechanical interventions. Krivec et al. (112) examined 10 consecutive patients hospitalized in the ICU with obstructive shock following massive pulmonary embolism in a prospective observational study. During hemodynamic optimization and infusion of thrombolytics therapy, heart rate, CVP, mean pulmonary artery pressure, and urine output remained unchanged, but the relative change of S[v with bar above]O2 at hour 1 was higher than the relative changes of all other studied variables (p <0.05). Serum lactate on admission and at 12 hours correlated to S[v with bar above]O2 (r = -0.855, p <0.001). In obstructive shock after massive pulmonary embolism, S[v with bar above]O2 changes more rapidly than other standard hemodynamic variables.
|
|
|
Figure 26.11. Early goal-directed therapy (EGDT) in severe sepsis and septic shock. CVP, central venous pressure; Hct, hematocrit; MAP, mean arterial pressure; SBP, systolic blood pressure; Sc[v with bar above]O2, central venous oxygen saturation. (From Rivers E, Nguyen B, Havstad S, et al. Early goal-directed therapy in the treatment of severe sepsis and septic shock. N Engl J Med. 2001;345(19):1368–1377.) |
Respiratory Failure
In nine of 13 patients with hypoxemic respiratory failure requiring positive end-expiratory pressure (PEEP), there was a strong correlation (r = 0.88) between [D with dot above]O2 and S[v with bar above]O2. Of the four patients not showing a good correlation, two had sepsis and two had nearly normal values of S[v with bar above]O2 and oxygen delivery at all levels of PEEP studied. Continuous measurement of S[v with bar above]O2 improves monitoring of patients, facilitates titration of respiratory therapies, detects abrupt changes in tissue oxygen consumption, and identifies levels of PEEP associated with greatest oxygen delivery (113).
Postoperative Thoracic and Cardiac Surgery Patients
Continuous S[v with bar above]O2 monitoring was examined in 19 patients as to its predictive value during the postoperative course after thoracotomy for a time period up to 60 hours. In all but one of the 10 patients with S[v with bar above]O2 less than 65% for at least one hour, complications occurred. A fall of S[v with bar above]O2 more than 5% or a value <60% predicted a period of hypotension in six patients. In two of them this coincided with a period of ventricular arrhythmias. In those with S[v with bar above]O2 below 65%, no postoperative complications such as arrhythmias, shock, respiratory dysfunction, or oliguria took place (76). Cardiac surgical patients are at risk of inadequate perioperative oxygen delivery caused by extracorporeal circulation and limited cardiovascular reserves (114,115). Four hundred and three elective cardiac surgical patients were enrolled in the study and randomly assigned to either the control or the protocol group. Goals of the protocol group were to maintain S[v with bar above]O2 >70% and a lactate concentration ≤2.0 mmol/L from ICU admission and up to 8 hours thereafter. The median hospital stay was shorter in the protocol group (6 vs. 7 days, p <0.05), and patients were discharged faster from the hospital than those in the control group (p <0.05). Discharge from the ICU was similar between groups (p = 0.8). Morbidity was less frequent at the time of hospital discharge in the protocol group (1.1% vs. 6.1%, p <0.01) (116). Venous oximetry has also been shown to have clinical utility in weaning patients from ventricular assist devices (117,118).
Vascular Surgery
In 31 patients undergoing elective operations for aortic aneurysms (n = 25) and aortoiliac occlusive disease (n = 6), S[v with bar above]O2 was recorded throughout the operation. In all patients, unclamping the aorta resulted in a marked reduction of mean S[v with bar above]O2, with no change in the cardiac output or SaO2. The unclamping of tube grafts was associated with a significant reduction in arterial pH (p <0.01) and in S[v with bar above]O2 (p <0.001) when compared with unclamping of bifurcation grafts. Despite a longer clamp time, unclamping the second limb of a bifurcation graft resulted in a smaller decrease in S[v with bar above]O2 when compared with that observed after unclamping the first limb (12% vs. 6%, p <0.01). The change in S[v with bar above]O2 after unclamping the second limb was only 2% in aortobifemoral grafts and 9% in aortobi-iliac grafts. Reperfusion via extensive pelvic and lumbar collaterals in patients with aortoiliac occlusive disease reduces the degree of S[v with bar above]O2 decrease after aortic unclamping. Monitoring the changes in S[v with bar above]O2 during different types of aortic reconstruction helps to define precisely the physiologic alterations that occur in the course of these operations (85,86).
Postoperative High-Risk Patients
Sc[v with bar above]O2 and other biochemical, physiologic and demographic data were prospectively measured for 8 hours after major surgery. Data from 118 patients were analyzed; 123 morbidity episodes occurred in 64 of these patients. The optimal Sc[v with bar above]O2 cutoff value for morbidity prediction was 64.4%. In the first hour after surgery, significant reductions in Sc[v with bar above]O2 were observed, but there were no significant changes in cardiac index (CI) or oxygen delivery index during the same period. Significant fluctuations in Sc[v with bar above]O2 occur in the immediate postoperative period and are not always associated with changes in oxygen delivery, suggesting that oxygen consumption is also an important determinant of Sc[v with bar above]O2. Reductions in Sc[v with bar above]O2are independently associated with postoperative complications (119,120,121).
Positioning Patients and Postural Changes
The effects of changes in positioning on S[v with bar above]O2 in critically ill patients with a low ejection fraction (≤30%) and the contribution of variables of oxygen delivery ([D with dot above]O2) and oxygen consumption ([V with dot above]O2) to the variance in S[v with bar above]O2 were examined. An experimental two-group repeated-measures design was used to study 42 critically ill patients with an ejection fraction of ≤30%. Patients were assigned randomly to one of two position sequences: supine, right lateral, left lateral; or supine, left lateral, right lateral. Data on S[v with bar above]O2 were collected at baseline, each minute after position change for 5 minutes, and at 15 and 25 minutes. A difference in S[v with bar above]O2 among the three positions across time was significantly different (p<0.0001), with the greatest differences occurring within the first 4 minutes and in the left lateral position. [V with dot above]O2 accounted for a greater proportion of the variance in S[v with bar above]O2with position change than did [D with dot above]O2 (122,123). Similar findings have been noted in S[v with bar above]O2 with orthostatic positioning and its superiority in reflecting central blood volume over central venous pressure (87).
Neonates and Pediatric Patients
S[v with bar above]O2 has been shown to be clinically useful in pediatric patients (124). However, the challenges of pulmonary artery catheterization make monitoring of the shock state with S[v with bar above]O2 limited, making Sc[v with bar above]O2 a convenient surrogate (75,89). In an experimental model of neonatal sepsis, S[v with bar above]O2 significantly correlates with right atrium oxygen saturation (r2 = 0.88). Animal studies suggest that Sc[v with bar above]O2 at the right atrium can be a sure, efficient, and easy alternative for the neonatal patient (125), particularly during therapeutic interventions such as mechanical ventilation and intravascular volume resuscitation (126). Studies in patients have been less consistent. Simultaneous Sc[v with bar above]O2 and S[v with bar above]O2values in children recovering from open heart surgery show Sc[v with bar above]O2 is consistently lower than S[v with bar above]O2. This difference may be secondary to residual intracardiac left-to-right shunting of blood or to altered distribution of systemic blood flow. The saturation difference between the two venous samples decreases during postoperative recovery, making a Sc[v with bar above]O2blood sample an inadequate substitute for S[v with bar above]O2. Because Sc[v with bar above]O2 was frequently subnormal while S[v with bar above]O2 was in the normal range, monitoring of S[v with bar above]O2 could not be reliably used to rule out oxygen supply/demand imbalance during the early postoperative period in these patients (124,127). To overcome these clinical inconsistencies, a regression formula was derived: S[v with bar above]O2 = 3 × SVC + HIVC divided by 4, where SVC is superior vena cava saturation and HIVC is high inferior vena cava saturation (61). Validation of the clinical utility of Sc[v with bar above]O2 in children has the same challenges as in adults. A sepsis trial reported significant survival benefit when Sc[v with bar above]O2 was added to the pediatric model of septic shock. This study supports current recommendations by the American College of Critical Care Medicine for its use in neonatal and pediatric septic shock (Fig. 26.12) (128).
Cost Effectiveness
Economic analysis of the technology of venous oximetry is complex. Because of its variable use in many clinical situations, the direct association with one single variable to outcome and health care resource consumption is not a simple one. In quantitating the economic impact, one must assess prevention of additional resource use such as venous blood gases and nursing time, hemodynamic life-threatening events, and decreased health care resource consumption through improved morbidity and mortality. Significant reductions in the number of venous blood gas analyses, cardiac output measurement, and charges have been observed (113,129,130). Several studies have suggested that the increased cost of the fiberoptic catheter is not justifiable in terms of cost savings (131,132). However, in the treatment of sepsis and cardiothoracic patients, significant reductions in morbidity, mortality, and health care resource consumption have been observed with goal-directed algorithms using venous oximetry (116,133).
|
|
|
Figure 26.12. Pediatric advanced life support (PALS). Cl, chlorine; CVP, central venous pressure; ECMO; extracorporeal membrane oxygenation; MAP, mean arterial pressure; PDE, phosphodiesterase; PICU, pediatric intensive care unit; Sc[v with bar above]O2, central venous oxygen saturation. (From Carcillo JA, Fields AI. Clinical practice parameters for hemodynamic support of pediatric and neonatal patients in septic shock. Crit Care Med. 2002;30(6):1365–1378.) |
Combined Venous and Pulse Oximetry
Pulse oximetry and continuous mixed venous oximetry can be combined into a useful tool if we understand the underlying physiology that allows certain inferences to be made as well as the limitations. The two devices together provide the capacity to evaluate simultaneous changes in the patient's cardiovascular and respiratory systems. Arterial oxygen tension and arterial oxygen saturation are related through the familiar oxyhemoglobin dissociation curve. SaO2 values in the range of 70 to 95 reflect changes in PaO2 and are useful in monitoring cardiorespiratory disease and directing therapy. Large changes in PaO2 (80–600 mm Hg) can occur with minimum changes in SaO2. To maintain arterial oxygen delivery, we keep SaO2 values between 90% and 95%. Below 90%, desaturation diminishes arterial oxygen content and oxygen delivery; above 95%, SaO2 values no longer track PaO2 values. At a Hgb value of 13 g/dL, fully saturated Hgb would carry 18.07 mL of oxygen. If arterial PO2 was 100 mm Hg, an additional 0.31 mL would be dissolved in plasma for a total oxygen content of 18.38 mL per 100 mL of blood. If PaO2 fell to 75 mm Hg and SaO2 concomitantly dropped to 95%, Hgb-carried oxygen would be 18.07 times 0.95, or 17.17 mL. The dissolved oxygen would be 75 times 0.003, or 0.23, and total oxygen content would be 17.4 mL in 100 mL of blood. In the first example, total oxygen content was 18.38 mL. If the second oxygen content, 17.4 mL, is divided by 18.38 mL, the quotient is 0.95; thus, total oxygen content changed the same amount as did the arterial saturation. We can obtain the same information by comparing changes in SaO2 alone without following either PaO2 or calculating total oxygen content. The same is true for S[v with bar above]O2 and mixed venous oxygen content (27,134,135).
Applicability
There are many valuable bedside uses for simultaneous oximetry. For instance, if a patient's respiratory function has improved, high FiO2 may be weaned quickly. We have found that changes can be made every 5 minutes. This contrasts to the usual clinical scenario using blood gases where after a change in FiO2 (15-minute equilibration period), drawing of blood is done. If patients have severely depressed oxygenation, PEEP therapy can be augmented much more rapidly by monitoring S[v with bar above]O2. In the case of cardiovascular collapse associated with low S[v with bar above]O2ithe response to blood and other fluid infusions as well as vasoactive drugs can be judged rapidly. If the intervention does not increase S[v with bar above]O2 quickly (within a few minutes), it probably has not been effective. Increased CO may result in increased oxygen consumption without a change in SaO2 minus S[v with bar above]O2. This ability to judge the effectiveness of interventions quickly is certainly attractive and often gratifying to the clinician.
Limitations and Future Questions
In spite of studies questioning the value of S[v with bar above]O2 in ICU patients (94,127,132,136), there is considerable evidence that Sc[v with bar above]O2 may have a beneficial role in the early management of critically ill adults, children, and neonates (89,126). The ability to access this information earlier in the phases of critical illness is now a reality, and further studies are now in progress to confirm that early recognition and treatment of out-of-normal-range Sc[v with bar above]O2 values have significant outcome benefit.
Clinical Examples
Case 1
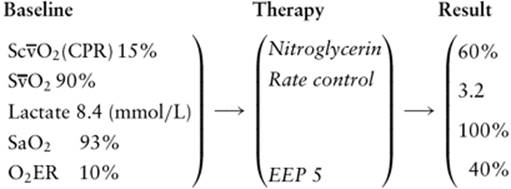
A 75-year-old male victim of a witnessed cardiac arrest presents to the emergency department. After bystander CPR was performed, emergency medical services (EMS) initiates advanced cardiac life support (ACLS) guidelines. He was found to be in ventricular fibrillation and was successfully defibrillated into normal sinus rhythm. He is admitted to the ICU.
Vital signs: Blood pressure (BP), 160/80; MAP, 106 mm Hg; heart rate (HR), 130 beats per minute; respiratory rate (RR), 16 (bag/valve/mask); temp, 36.4°C; SaO2, 98% on 100% FiO2; Sc[v with bar above]O2, 85%.
Arterial blood gas (ABG) (21%): pH, 7.20; PaCO2, 31; PaO2, 63; SaO2, 93%; NaHCO3, 18; base deficit, -5.
Complete blood count (CBC): White blood cells (WBC), 15.1; hemoglobin (Hb), 10.5; hematocrit (Hct), 31%; platelets (PLT), 400,000.
PA catheter: CI, 1.2/minute/m2; PAOP, 22 cm/H2O; CVP, 26 cm/H2O; systemic venous resistance (SVR), 5,600 dynes/s·cm5.
|
|
|
Figure 26.13. Baseline for Case 1. |
What's the Baseline?
This case (Fig. 26.13) illustrates several important elements. Namely, the interpretation of the S[v with bar above]O2 is limited without an arterial blood gas since a near-normal S[v with bar above]O2 value does not imply normal physiology. The oxygen extraction ratio (O3ER) (aO2 - [v with bar above]O2 difference/SaO2) is only 10%. The value of S[v with bar above]O2 is also confounded by the presence of mild anemia. Hypoxemia and circulatory arrest with resultant hypoperfusion leads to anaerobic metabolism represented by the presence of lactic acidosis.
What's Happening?
The O2ER is very low, and in the setting of cardiac arrest, can possibly relate to the vasoconstrictive effects of vasopressors used during ACLS or the cytotoxic damage of global tissue hypoxia and reperfusion. This impairment of systemic oxygen utilization is manifest as mixed venous hyperoxia. Global tissue hypoxia ensues as a consequence of decreased perfusion and impaired tissue uptake resulting in lactic acidosis (73). It is notable that as treatment progresses with vasodilators, the O2ER increases to 40% and lactate decreases.
What's the Interpretation?
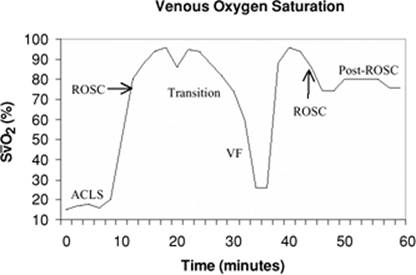
The postresuscitative phase of cardiac arrest is characterized by a complex array of hemodynamic perturbations (Fig. 26.14). O2ER can be up to 90% during cardiac arrest, and the failure to reach a S[v with bar above]O2 of 40% portends near 100% mortality (73). Once a return to spontaneous circulation (ROSC) is obtained, venous hyperoxia or an impaired O2ER may be a temporary or permanent issue. The period immediately following multiple doses of vasopressors with ROSC is characterized by elevated circulating catecholamines and is termed the early postarrest phase. If efforts fail to decrease afterload, vasodilate the microcirculation, improve cardiac function to a [V with dot above]O2 above 90 mL/minute/m2 within 6 hours after cardiac arrest and persistent lactic acidosis, death is imminent within 24 hours (73).
Similar scenarios to the early phase of cardiac arrest characterized by an elevated S[v with bar above]O2 and lactic acidosis can also be seen with vasopressor-dependent shock, sepsis, severe thiamine deficiency, severe Paget disease, malaria, salicylate toxicity, and cyanide toxicity. The later post-ROSC phase demonstrating low S[v with bar above]O2 and persistent lactic acidosis is comparable to hepatic failure, sepsis, anemia/hemorrhage, cardiogenic shock, and severe mesenteric ischemia.
Case 2
A 66-year-old female with a history of chronic obstructive lung disease (COPD) presents to the emergency department with a chief complaint of shortness of breath with fever for the past 4 days. She has had a cough productive of yellowish-greenish sputum and is tachypneic and in obvious respiratory distress.
Vital signs: BP, 140/80; HR, 118; RR, 24; temp, 38.0 C; pulmonary oxygen saturation (SpO2), 88% on room air, 93% on 2 L/minute O2
ED course: In the emergency department, the patient is noticeably more tachypneic and lethargic, so the patient is ultimately intubated for airway protection. Chest x-ray (CXR) study demonstrates a right lower lobe (RLL) infiltrate, consolidation, and airspace disease.
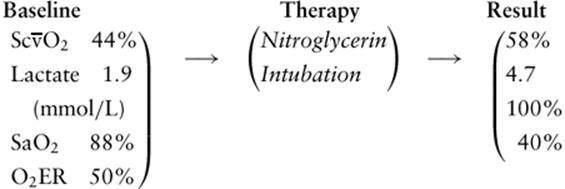
Hemodynamic monitoring in the ED: CVP, 16 cm/H2O; Sc[v with bar above]O2, 44%; lactate, 1.9 mmol/L.
|
|
|
Figure 26.14. S[v with bar above]O2 response during resuscitation. ACLS, advanced cardiac life support; ROSC, return of spontaneous circulation; S[v with bar above]O2, mixed venous oxygen saturation; VF, ventricular fibrillation. (Adapted from Rivers EP, Martin GB, Smithline H, et al. The clinical implications of continuous central venous oxygen saturation during human CPR. Ann Emerg Med. 1992;21(9):1094–1101, with permission.) |
About 1 minute after intubation, Sc[v with bar above]O2 monitoring begins to rise; Sc[v with bar above]O2 is now reading 58%. The patient is suctioned and copious thick sputum is removed. The patient's CVP improved to 8 cm H2O after administration of a vasodilator. Repeat lactate reading increases 4.7 mmol/L.
What's the Baseline?
This patient has hypoxia, respiratory distress, and relatively stable vital signs (Fig. 26.15). The fever and clinical complaint in the presence of three systemic inflammatory response syndrome (SIRS) criteria makes pneumonia a likely inciting condition. The patient also exhibits hyperlactatemia and central venous hypoxia (low Sc[v with bar above]O2)
What's Happening?
The patient has symptoms consistent with pneumonia and hypoxemia with an O2ER of 50%. This increased O2ER despite a normal blood pressure with an elevated central venous pressure should alert the clinician of possible myocardial dysfunction.
What's the Interpretation?
The combination of three SIRS criteria and hyperlactatemia in the setting of infection heralds global hypoperfusion and organ dysfunction. The central venous hypoxemia reflects her oxygen delivery–dependent state. This illustrates the concept of cryptic septic shock. These patients are often clinically underrecognized due to the presence of seemingly normal vital signs in the face of tissue hypoxia. Interestingly, the presence of an elevated CVP would ordinarily imply normal or elevated intravascular volume, and in patients with a history of cardiac dysfunction, could lead the clinician to inappropriately administer a diuretic. In this case a vasodilator was more appropriate therapy to improve cardiac output by reduction of afterload. Patients with long-standing cardiopulmonary disease may have low venous saturations with normal lactates until they become delivery dependent. This has been characterized as metabolic hibernators (71).
The presence of SIRS criteria should prompt the clinician to consider obtaining a lactate level to stratify the severity of her condition. In certain patients who do not present initially with an elevated lactate, their history of concurrent medical conditions can create a state of ischemic preconditioning, also termed metabolic hibernation. This early recognition and treatment of the hypoperfused state was originally described by Rivers et al. where a protocolized approach to severe sepsis significantly improved morbidity and mortality. Similar hemodynamic conditions to this patient's initial presentation include hypothermia, a regional hypoperfused state, or congestive heart failure/cardiopulmonary disease.
|
|
|
Figure 26.15. Baseline for Case 2. |
Case 3
A 60-year-old male patient was brought to the emergency department from an assisted-living facility with a chief complaint of change in mental status. The patient has a past medical history significant for cerebral vascular accident (CVA), hypertension, schizophrenia, and diabetes. The patient was found slumped on a park bench.
Initially the patient is nonverbal and presents with the following vital signs: BP, 110/40; HR, 120; RR, 24; temp, 32°C; SaO2, 96% on 2L O2; Glasgow coma scale, 11.
Physical examination:
Patient receives 1-L bolus of crystalloids with mild increase in BP. The patient is taken to the monitored area of the ED because the nurse notices the patient is very slow to respond. The patient's bedside glucose is <50 mg/dL. The patient is given an amp of 50% dextrose. The patient's mental status immediately improves.
Labs: Na, 158; K, 5.2; Cl, 100; CO2, 24; BUN, 90; creatinine, 1.8; glucose, 44; β-hydroxybutyrate, 8.0.
ABG: pH, 7.30; pCO2, 44; paO2, 100; SaO2, 96%; HCO3-, 24; lactate, 2.0.
Hemodynamics: CVP, 1 cm H2O, Sc[v with bar above]O2, 72%.
Hospital Course
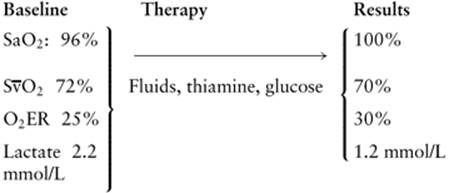
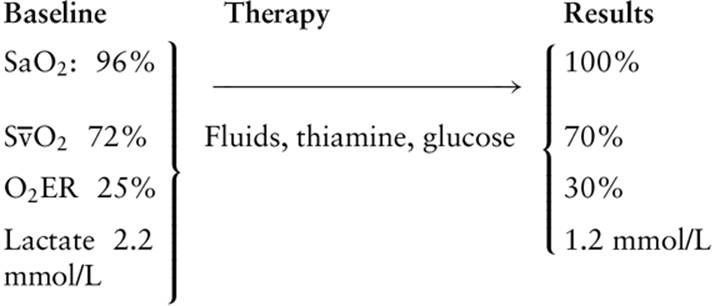
What's the Baseline?
This patient's mental status is altered, probably due to the combination of hypoglycemia and hypothermia (Fig. 26.16). His initial presentation and hemodynamic measurements indicate severe volume depletion. The patient is maintaining a normal blood pressure but has evidence of progressing hemodynamic instability. Given his history, toxicologic and metabolic derangements may be responsible for his hemodynamic embarrassment.
What's Happening?
The patient is exhibiting evidence of anion gap metabolic acidosis (which may be due to ketonemia [β-hydroxybutyrate] and mild lactic acidosis) as well as abnormal chemistry and blood gas data. His O2ER is 25%, which is in the normal range. The patient is hypothermic, which may account for the central venous oxygen saturation in the normal range. His mental status may be accounted for by hypoglycemia.
|
|
|
Figure 26.16. Baseline for Case 3. |
What's the Interpretation?
The patient's extraction ratio may be slightly higher than expected but may be explained by a depressed metabolic rate associated with hypothermia. The near-normal lactate level on presentation may also be explained by a depressed metabolic rate despite the lack of substrate (glucose). The higher-than-expected O2ER should be noted, and a search for disturbances of oxygen utilization should be considered. Entities that impair the tissues' ability to utilize oxygen consist of toxicologic and metabolic derangements including chronic thiamine deficiency, cyanide toxicity, and possibly severe acetaminophen toxicity.
References
1. Wo CC, Shoemaker WC, Appel PL, et al. Unreliability of blood pressure and heart rate to evaluate cardiac output in emergency resuscitation and critical illness. Crit Care Med. 1993;21(2):218–223.
2. Cortez A, Zito J, Lucas CE, Gerrick SJ. Mechanism of inappropriate polyuria in septic patients. Arch Surg. 1977;112(4):471–476.
3. Rady MY, Rivers EP, Nowak RM. Resuscitation of the critically ill in the ED: responses of blood pressure, heart rate, shock index, central venous oxygen saturation, and lactate. Am J Emerg Med. 1996;14(2):218–225.
4. Karimova A, Pinsky DJ. The endothelial response to oxygen deprivation: biology and clinical implications. Intensive Care Med. 2001;27(1):19–31.
5. Beal AL, Cerra FB. Multiple organ failure syndrome in the 1990s. Systemic inflammatory response and organ dysfunction. JAMA. 1994;271(3):226–233.
6. Bihari D, Smithies M, Gimson A, et al. The effects of vasodilation with prostacyclin on oxygen delivery and uptake in critically ill patients. N Engl J Med. 1987;317(7):397–403.
7. Bakker J, Gris P, Coffernils M, et al. Serial blood lactate levels can predict the development of multiple organ failure following septic shock. Am J Surg. 1996;171(2):221–226.
8. Rivers EP, Kruse JA, Jacobsen G, et al. The influence of early hemodynamic optimization on biomarker patterns of severe sepsis and septic shock. Crit Care Med. 2007;35(9):2016–2024.
9. Rivers E, Nguyen B, Havstad S, et al. Early goal-directed therapy in the treatment of severe sepsis and septic shock. N Engl J Med. 2001;345(19):1368–1377.
10. Varpula M, Tallgren M, Saukkonen K, et al. Hemodynamic variables related to outcome in septic shock. Intensive Care Med. 2005;31:1066–1071.
11. Nelson LD. Continuous venous oximetry in surgical patients. Ann Surg. 1986;203(3):329–333.
12. Krafft P, Steltzer H, Hiesmayr M, et al. Mixed venous oxygen saturation in critically ill septic shock patients. The role of defined events. Chest. 1993;103(3):900–906.
13. Wolf YG, Cotev S, Perel A, et al. Dependence of oxygen consumption on cardiac output in sepsis. Crit Care Med. 1987;15(3):198–203.
14. Kandel G, Aberman A. Mixed venous oxygen saturation. Its role in the assessment of the critically ill patient. Arch Intern Med. 1983;143(7):1400–1402.
15. Meier-Hellmann A, Hannemann L, Specht M, et al. Hepatic venous and mixed venous O2 saturation during catecholamine therapy in patients with septic shock [in German]. Anaesthesist. 1993;42(1):29–33.
16. Reinhart K, Rudolph T, Bredle DL, et al. Comparison of central-venous to mixed-venous oxygen saturation during changes in oxygen supply/demand. Chest. 1989;95(6):1216–1221.
17. Takano H, Matsuda H, Kaneko M, et al. Hepatic venous oxygen saturation monitoring in patients with assisted circulation for severe cardiac failure. Artif Organs. 1991;15(3):248–252.
18. Ruokonen E, Takala J, Uusaro A. Effect of vasoactive treatment on the relationship between mixed venous and regional oxygen saturation. Crit Care Med. 1991;19(11):1365–1369.
19. Dahn MS, Lange MP, Jacobs LA. Central mixed and splanchnic venous oxygen saturation monitoring. Intensive Care Med. 1988;14(4):373–378.
20. Rivers EP, Ander DS, Powell D. Central venous oxygen saturation monitoring in the critically ill patient. Curr Opin Crit Care. 2001;7(3):204–211.
21. Bakker J, Vincent J-L. The oxygen supply dependency phenomenon is associated with increased blood lactate levels. J Crit Care. 1991;6:152–159.
22. Kruse JA, Haupt MT, Puri VK, et al. Lactate levels as predictors of the relationship between oxygen delivery and consumption in ARDS. Chest. 1990;98(4):959–962.
23. Kasnitz P, Druger GL, Yorra F, et al. Mixed venous oxygen tension and hyperlactatemia. Survival in severe cardiopulmonary disease. JAMA. 1976;236(6):570–574.
24. Aduen J, Bernstein WK, Khastgir T, et al. The use and clinical importance of a substrate-specific electrode for rapid determination of blood lactate concentrations. JAMA. 1994;272(21):1678–1685.
25. Wilson RF, Gibson D. The use of arterial–central venous oxygen differences to calculate cardiac output and oxygen consumption in critically ill surgical patients. Surgery. 1978;84(3):362–369.
26. Norwood SH, Civetta JM. Ventilatory support in patients with ARDS. Surg Clin North Am. 1985;65(4):895–916.
27. Rasanen J, Downs JB, Malec DJ, et al. Real-time continuous estimation of gas exchange by dual oximetry. Intensive Care Med. 1988;14(2):118–122.
28. Boulos M, Astiz ME, Barua RS, et al. Impaired mitochondrial function induced by serum from septic shock patients is attenuated by inhibition of nitric oxide synthase and poly(ADP-ribose) synthase. Crit Care Med. 2003;31(2):353–358.
29. Dunham CM, Siegel JH, Weireter L, et al. Oxygen debt and metabolic acidemia as quantitative predictors of mortality and the severity of the ischemic insult in hemorrhagic shock. Crit Care Med. 1991;19(2):231–243.
30. Rixen D, Siegel JH. Bench-to-bedside review: oxygen debt and its metabolic correlates as quantifiers of the severity of hemorrhagic and post-traumatic shock. Crit Care. 2005;9(5):441–453.
31. Siegel JH. The effect of associated injuries, blood loss, and oxygen debt on death and disability in blunt traumatic brain injury: the need for early physiologic predictors of severity. J Neurotrauma. 1995;12(4):579–590.
32. Snyder JV, Carroll GC. Tissue oxygenation: a physiologic approach to a clinical problem. Curr Probl Surg. 1982;19(11):650–719.
33. Nierman DM, Schechter CB. Mixed venous O2 saturation: measured by co-oximetry versus calculated from PVO2. J Clin Monit. 1994;10(1):39–44.
34. Nelson LD. Continuous monitoring of O2 saturation. Chest. 1989;96(4):956–957.
35. Varon J, Fromm RE Jr, Levine RL. Emergency department procedures and length of stay for critically ill medical patients. Ann Emerg Med. 1994;23(3):546–549.
36. Lundberg JS, Perl TM, Wiblin T, et al. Septic shock: an analysis of outcomes for patients with onset on hospital wards versus intensive care units. Crit Care Med. 1998;26(6):1020–1024.
37. Lefrant JY, Muller L, Bruelle P, et al. Insertion time of the pulmonary artery catheter in critically ill patients. Crit Care Med. 2000;28(2):355–359.
38. Lee J, Wright F, Barber R, Stanley L. Central venous oxygen saturation in shock: a study in man. Anesthesiology. 1972;36(5):472–478.
39. Scheinman MM, Brown MA, Rapaport E. Critical assessment of use of central venous oxygen saturation as a mirror of mixed venous oxygen in severely ill cardiac patients. Circulation. 1969;40(2):165–172.
40. Glamann DB, Lange RA, Hillis LD. Incidence and significance of a “step-down” in oxygen saturation from superior vena cava to pulmonary artery. Am J Cardiol. 1991;68(6):695–697.
41. Edwards JD, Mayall RM. Importance of the sampling site for measurement of mixed venous oxygen saturation in shock. Crit Care Med. 1998;26(8):1356–1360.
42. Martin C, Auffray JP, Badetti C, et al. Monitoring of central venous oxygen saturation versus mixed venous oxygen saturation in critically ill patients. Intensive Care Med. 1992;18(2):101–104.
43. Faber T. Central venous versus mixed venous oxygen content. Acta Anaesthesiol Scand Suppl. 1995;107:33–36.
44. Dongre SS, McAslan TC, Shin B. Selection of the source of mixed venous blood samples in severely traumatized patients. Anesth Analg. 1977;56(4):527–532.
45. Rigg JD, Nightingale PN, Faragher EB. Influence of cardiac output on the correlation between mixed venous and central venous oxygen saturation. Br J Anaesth. 1993;71(3):459.
46. Varpula M, Karlsson S, Ruokonen E, Pettila V. Mixed venous oxygen saturation cannot be estimated by central venous oxygen saturation in septic shock. Intensive Care Med. 2006;32(9):1336–1343.
47. Chawla LS, Zia H, Gutierrez G, et al. Lack of equivalence between central and mixed venous oxygen saturation. Chest. 2004;126(6):1891–1896.
48. Martin GB, Carden DL, Nowak RM, et al. Central venous and mixed venous oxygen saturation: comparison during canine open-chest cardiopulmonary resuscitation. Am J Emerg Med. 1985;3(6):495–497.
49. Pieri M, Brandi LS, Bertolini R, et al. Comparison of bench central and mixed pulmonary venous oxygen saturation in critically ill postsurgical patients [in Italian]. Minerva Anesthesiol. 1995;61(7–8):285–291.
50. Turnaoglu S, Tugrul M, Camci E, et al. Clinical applicability of the substitution of mixed venous oxygen saturation with central venous oxygen saturation. J Cardiothorac Vasc Anesth. 2001;15(5):574–579.
51. Goldman RH, Klughaupt M, Metcalf T, et al. Measurement of central venous oxygen saturation in patients with myocardial infarction. Circulation. 1968;38(5):941–946.
52. Reinhart K, Rudolph T, Bredle DL, et al. Comparison of central-venous to mixed-venous oxygen saturation during changes in oxygen supply/demand. Chest. 1989;95(6):1216–1221.
53. Schou H, Perez de Sa V, Larsson A. Central and mixed venous blood oxygen correlate well during acute normovolemic hemodilution in anesthetized pigs. Acta Anaesthesiol Scand. 1998;42(2):172–177.
54. Cohendy R, Peries C, Lefrant JY, et al. Continuous monitoring of the central venous oxygen saturation in surgical patients: comparison to the monitoring of the mixed venous saturation. Acta Anaesthesiol Scand. 1996;40(8 Pt 1):956.
55. Berridge JC. Influence of cardiac output on the correlation between mixed venous and central venous oxygen saturation. Br J Anaesth. 1992;69(4):409–410.
56. Scalea TM, Holman M, Fuortes M, et al. Central venous blood oxygen saturation: an early, accurate measurement of volume during hemorrhage. J Trauma. 1988;28(6):725–732.
57. Davies GG, Mendenhall J, Symreng T. Measurement of right atrial oxygen saturation by fiberoptic oximetry accurately reflects mixed venous oxygen saturation in swine. J Clin Monit. 1988;4(2):99–102.
58. Herrera A, Pajuelo A, Morano MJ, et al. Comparison of oxygen saturations in mixed venous and central blood during thoracic anesthesia with selective single-lung ventilation [in Spanish]. Rev Esp Anestesiol Reanim. 1993;40(6):349–353.
59. Wendt M, Hachenberg T, Albert A, et al. Mixed venous versus central venous oxygen saturation in intensive medicine. Anasth Intensivther Notfallmed. 1990;25(1):102–106.
60. Emerman CL, Pinchak AC, Hagen JF, et al. A comparison of venous blood gases during cardiac arrest. Am J Emerg Med. 1988;6(6):580–583.
61. Weber H, Grimm T, Albert J. The oxygen saturation of blood in the venae cavae, right-heart chambers, and pulmonary artery, comparison of formulae to estimate mixed venous blood in healthy infants and children [in German (author's transl)]. Z Kardiol. 1980;69(7):504–507.
62. Ladakis C, Myrianthefs P, Karabinis A, et al. Central venous and mixed venous oxygen saturation in critically ill patients. Respiration. 2001;68(3):279–285.
63. Heiselman D, Jones J, Cannon L. Continuous monitoring of mixed venous oxygen saturation in septic shock. J Clin Monit. 1986;2(4):237–245.
64. Ander DS, Jaggi M, Rivers E, et al. Undetected cardiogenic shock in patients with congestive heart failure presenting to the emergency department. Am J Cardiol. 1998;82(7):888–891.
65. Rivers EP, Nguyen HB, Havstad S, et al. Early goal directed therapy in the treatment of severe sepsis and septic shock: an outcome evaluation [abstract]. Chest. 2000;118(4):87S.
66. Practice parameters for hemodynamic support of sepsis in adult patients in sepsis. Task Force of the American College of Critical Care Medicine, Society of Critical Care Medicine. Crit Care Med. 1999;27(3):639–660.
67. Dellinger RP, Carlet JM, Masur H, et al. Surviving Sepsis Campaign guidelines for management of severe sepsis and septic shock. Intensive Care Med. 2004;30(4):536–555.
68. Rivers E. Mixed vs central venous oxygen saturation may be not numerically equal, but both are still clinically useful. Chest. 2006;129(3):507–508.
69. Vaughn S, Puri VK. Cardiac output changes and continuous mixed venous oxygen saturation measurement in the critically ill. Crit Care Med. 1988;16(5):495–498.
70. Wiesemes R, Peters J. The role of mixed venous oxygen saturation in perioperative monitoring and therapy. A critical stock taking [in German]. Anasthesiol Intensivmed Notfallmed Schmerzther. 1993;28(5):269–278.
71. Rady M, Jafry S, Rivers E, et al. Characterization of systemic oxygen transport in end-stage chronic congestive heart failure. Am Heart J. 1994;128(4):774–781.
72. Rivers EP, Martin GB, Smithline H, et al. The clinical implications of continuous central venous oxygen saturation during human CPR. Ann Emerg Med. 1992;21(9):1094–1101.
73. Rivers EP, Rady MY, Martin GB, et al. Venous hyperoxia after cardiac arrest. Characterization of a defect in systemic oxygen utilization. Chest. 1992;102(6):1787–1793.
74. Waller JL, Kaplan JA, Bauman DI, Craver JM. Clinical evaluation of a new fiberoptic catheter oximeter during cardiac surgery. Anesth Analg. 1982;61(8):676–679.
75. de la Rocha AG, Edmonds JF, Williams WG, et al. Importance of mixed venous oxygen saturation in the care of critically ill patients. Can J Surg. 1978;21(3):227–229.
76. Krauss XH, Verdouw PD, Hughenholtz PG, et al. On-line monitoring of mixed venous oxygen saturation after cardiothoracic surgery. Thorax. 1975;30(6):636–643.
77. Muir AL, Kirby BJ, King AJ, et al. Mixed venous oxygen saturation in relation to cardiac output in myocardial infarction. Br Med J. 1970;4(730):276–278.
78. Birman H, Haq A, Hew E, et al. Continuous monitoring of mixed venous oxygen saturation in hemodynamically unstable patients. Chest. 1984;86(5):753–756.
79. Gattinoni L, Brazzi L, Pelosi P, et al. A trial of goal-oriented hemodynamic therapy in critically ill patients. SvO2 Collaborative Group. N Engl J Med. 1995;333(16):1025–1032.
80. Bracht H, Hanggi M, Jeker B, et al. Incidence of low central venous oxygen saturation during unplanned admissions in a multidisciplinary intensive care unit: an observational study. Crit Care. 2007;11(1):R2.
81. Polonen P, Ruokonen E, Hippelainen M, et al. A prospective, randomized study of goal-oriented hemodynamic therapy in cardiac surgical patients. Anesth Analg. 2000;90(5):1052–1059.
82. Kremzar B, Spec-Marn A, Kompan L, et al. Normal values of SvO2 as therapeutic goal in patients with multiple injuries. Intensive Care Med. 1997;23(1):65–70.
83. Kazarian KK, Del Guercio LR. The use of mixed venous blood gas determinations in traumatic shock. Ann Emerg Med. 1980;9(4):179–182.
84. Rady MY. Patterns of oxygen transport in trauma and their relationship to outcome. Am J Emerg Med. 1994;12(1):107–112.
85. Powelson JA, Maini BS, Bishop RL, et al. Continuous monitoring of mixed venous oxygen saturation during aortic operations. Crit Care Med. 1992;20(3):332–336.
86. Norwood SH, Nelson LD. Continuous monitoring of mixed venous oxygen saturation during aortofemoral bypass grafting. Am Surg. 1986;52(2):114–115.
87. Madsen P, Olesen HL, Klokker M, et al. Peripheral venous oxygen saturation during head-up tilt induced hypovolaemic shock in humans. Scand J Clin Lab Invest. 1993;53(4):411–416.
88. Madsen P, Iversen H, Secher NH. Central venous oxygen saturation during hypovolaemic shock in humans. Scand J Clin Lab Invest. 1993;53(1):67–72.
89. O'Connor TA, Hall RT. Mixed venous oxygenation in critically ill neonates. Crit Care Med. 1994;22(2):343–346.
90. Conacher ID, Paes ML. Mixed venous oxygen saturation during lung transplantation. J Cardiothorac Vasc Anesth. 1994;8(6):671–674.
91. Edwards JD. Oxygen transport in cardiogenic and septic shock. Crit Care Med. 1991;19(5):658–663.
92. Creamer JE, Edwards JD, Nightingale P. Hemodynamic and oxygen transport variables in cardiogenic shock secondary to acute myocardial infarction, and response to treatment. Am J Cardiol. 1990;65(20):1297–1300.
93. Snyder AB, Salloum LJ, Barone JE, et al. Predicting short-term outcome of cardiopulmonary resuscitation using central venous oxygen tension measurements. Crit Care Med. 1991;19(1):111–113.
94. Rivers EP, Rady MY, Martin GB, et al. Venous hyperoxia after cardiac arrest. Characterization of a defect in systemic oxygen utilization. Chest. 1992;102(6):1787–1793.
95. Nakazawa K, Hikawa Y, Saitoh Y, et al. Usefulness of central venous oxygen saturation monitoring during cardiopulmonary resuscitation. A comparative case study with end-tidal carbon dioxide monitoring. Intensive Care Med. 1994;20(6):450–451.
96. Osawa H, Yoshii S, Abraham SJ, et al. Critical values of hematocrit and mixed venous oxygen saturation as parameters for a safe cardiopulmonary bypass. Jpn J Thorac Cardiovasc Surg. 2004;52(2):49–56.
97. Paradis NA, Martin GB, Goetting MG, et al. Aortic pressure during human cardiac arrest. Identification of pseudo- electromechanical dissociation. Chest. 1992;101(1):123–128.
98. Rivers EP, Wortsman J, Rady MY, et al. The effect of the total cumulative epinephrine dose administered during human CPR on hemodynamic, oxygen transport, and utilization variables in the postresuscitation period. Chest. 1994;106(5):1499–1507.
99. Sumimoto T, Sugiura T, Takeuchi M, et al. Overshoot in mixed venous oxygen saturation during recovery from supine bicycle exercise in patients with recent myocardial infarction. Chest. 1993;103(2):514–520.
100. Deakin CD, Low JL. Accuracy of the advanced trauma life support guidelines for predicting systolic blood pressure using carotid, femoral, and radial pulses: observational study. BMJ. 2000;321(7262):673–674.
101. Scalea TM, Hartnett RW, Duncan AO, et al. Central venous oxygen saturation: a useful clinical tool in trauma patients. J Trauma. 1990;30(12):1539–1543.
102. Kowalenko T, Ander D, Hitchcock R, et al. Continuous central venous oxygen saturation monitoring during the resuscitation of suspected hemorrhagic shock [abstract]. Acad Emerg Med. 1994;1(2):A69.
103. Astiz ME, Rackow EC, Kaufman B, et al. Relationship of oxygen delivery and mixed venous oxygenation to lactic acidosis in patients with sepsis and acute myocardial infarction. Crit Care Med. 1988;16(7):655–658.
104. Verdouw PD, Hagemeijer F, Dorp WG, et al. Short-term survival after acute myocardial infarction predicted by hemodynamic parameters. Circulation. 1975;52(3):413–419.
105. Kyff JV, Vaughn S, Yang SC, et al. Continuous monitoring of mixed venous oxygen saturation in patients with acute myocardial infarction. Chest. 1989;95(3):607–611.
106. Chin KM, Channick RN, Kim NH, et al. Central venous blood oxygen saturation monitoring in patients with chronic pulmonary arterial hypertension treated with continuous IV epoprostenol: correlation with measurements of hemodynamics and plasma brain natriuretic peptide levels. Chest. 2007;132(3):786–792.
107. Griffel MI, Astiz ME, Rackow EC, et al. Effect of mechanical ventilation on systemic oxygen extraction and lactic acidosis during early septic shock in rats. Crit Care Med. 1990;18(1):72–76.
108. Hirschl RB, Heiss KF, Cilley RE, et al. Oxygen kinetics in experimental sepsis. Surgery. 1992;112(1):37–44.
109. Rackow EC, Astiz ME, Weil MH. Increases in oxygen extraction during rapidly fatal septic shock in rats. J Lab Clin Med. 1987;109(6):660–664.
110. Astiz ME, Rackow EC, Weil MH. Oxygen delivery and utilization during rapidly fatal septic shock in rats. Circ Shock. 1986;20(4):281–290.
111. Dellinger RP, Levy MM, Carlet JM, et al. Surviving Sepsis Campaign: international guidelines for management of severe sepsis and septic shock: 2008. Intensive Care Med. 2008;34(1):17–60. Epub 2007 Dec 4.
112. Krivec B, Voga G, Podbregar M. Monitoring mixed venous oxygen saturation in patients with obstructive shock after massive pulmonary embolism. Wien Klin Wochenschr. 2004;116(9–10):326–331.
113. Fahey PJ, Harris K, Vanderwarf C. Clinical experience with continuous monitoring of mixed venous oxygen saturation in respiratory failure. Chest. 1984;86(5):748–752.
114. Kirkeby-Garstad I, Sellevold OF, Stenseth R, et al. Marked mixed venous desaturation during early mobilization after aortic valve surgery. Anesth Analg. 2004;98(2):311–317, table of contents.
115. Tweddell JS, Ghanayem NS, Mussatto KA, et al. Mixed venous oxygen saturation monitoring after stage 1 palliation for hypoplastic left heart syndrome. Ann Thorac Surg. 2007;84(4):1301–1310; discussion 10–11.
116. Polonen P, Ruokonen E, Hippelainen M, et al. A prospective, randomized study of goal-oriented hemodynamic therapy in cardiac surgical patients. Anesth Analg. 2000;90(5):1052–1059.
117. Termuhlen DF, Swartz MT, Pennington DG, et al. Predictors for weaning patients from ventricular assist devices. ASAIO Trans. 1988;34(2):131–139.
118. Termuhlen DF, Swartz MT, Ruzevich SA, et al. Hemodynamic predictors for weaning patients from ventricular assist devices (VADs). J Biomater Appl. 1990;4(4):374–390.
119. Pearse R, Dawson D, Fawcett J, et al. Changes in central venous saturation after major surgery, and association with outcome. Crit Care. 2005;9(6):R694–699.
120. Shoemaker WC, Thangathurai D, Wo CC, et al. Intraoperative evaluation of tissue perfusion in high-risk patients by invasive and noninvasive hemodynamic monitoring. Crit Care Med. 1999;27(10):2147–2152.
121. Bland RD, Shoemaker WC, Abraham E, et al. Hemodynamic and oxygen transport patterns in surviving and nonsurviving postoperative patients. Crit Care Med. 1985;13(2):85–90.
122. Gawlinski A, Dracup K. Effect of positioning on SvO2 in the critically ill patient with a low ejection fraction. Nurs Res. 1998;47(5):293–299.
123. Lewis P, Nichols E, Mackey G, et al. The effect of turning and backrub on mixed venous oxygen saturation in critically ill patients. Am J Crit Care. 1997;6(2):132–140.
124. Schranz D, Schmitt S, Oelert H, et al. Continuous monitoring of mixed venous oxygen saturation in infants after cardiac surgery. Intensive Care Med. 1989;15(4):228–232.
125. Baquero Cano M, Sanchez Luna M, Elorza Fernandez MD, et al. Oxygen transport and consumption and oxygen saturation in the right atrium in an experimental model of neonatal septic shock [in Spanish]. An Esp Pediatr. 1996;44(2):149–156.
126. Hirschl RB, Palmer P, Heiss KF, et al. Evaluation of the right atrial venous oxygen saturation as a physiologic monitor in a neonatal model. J Pediatr Surg. 1993;28(7):901–905.
127. Rasanen J, Peltola K, Leijala M. Superior vena caval and mixed venous oxyhemoglobin saturations in children recovering from open heart surgery. J Clin Monit. 1992;8(1):44–49.
128. Carcillo JA, Fields AI. Clinical practice parameters for hemodynamic support of pediatric and neonatal patients in septic shock. Crit Care Med. 2002;30(6):1365–1378.
129. Orlando R 3rd. Continuous mixed venous oximetry in critically ill surgical patients. ‘High-tech’ cost-effectiveness. Arch Surg. 1986;121(4):470–471.
130. Arnoldi D, Dechert R, Wise C. Use of continuous SvO2 monitoring can decrease requirements for cardiac output determination in surgical ICU patients. Crit Care Med. 1995;23(1 Suppl):A22.
131. Pearson KS, Gomez MN, Moyers JR, et al. A cost/benefit analysis of randomized invasive monitoring for patients undergoing cardiac surgery. Anesth Analg. 1989;69(3):336–341.
132. Jastremski MS, Chelluri L, Beney KM, et al. Analysis of the effects of continuous on-line monitoring of mixed venous oxygen saturation on patient outcome and cost-effectiveness. Crit Care Med. 1989;17(2):148–153.
133. Huang DT, Angus DC, Dremsizov TT, et al. Cost-effectiveness of early goal-directed therapy in the treatment of severe sepsis and septic shock. Crit Care. 2003;7:S116.
134. Rasanen J, Downs JB, Hodges MR. Continuous monitoring of gas exchange and oxygen use with dual oximetry. J Clin Anesth. 1988;1(1):3–8.
135. Bongard FS, Leighton TA. Continuous dual oximetry in surgical critical care. Indications and limitations. Ann Surg. 1992;216(1):60–68.
136. Boutros AR, Lee C. Value of continuous monitoring of mixed venous blood oxygen saturation in the management of critically ill patients. Crit Care Med. 1986;14(2):132–134.
Appendix
|
Appendix 26.1. Normal Range, Units, and Derivation for Common Oxygen Transport Terms |
||||||||||||||||||||||||||||||||||||||||||||||||||||||||
|
||||||||||||||||||||||||||||||||||||||||||||||||||||||||