Christoph N. Seubert
Dietrich Gravenstein
Steven A. Robicsek
Michael E. Mahla
Neurologic monitoring in the intensive care unit (ICU) is used either in a general sense as part of a systems-based approach to assess one of the major bodily systems or with the specific intent to guide therapy and/or assess prognosis. Imaging studies of the central nervous system (CNS)—while not considered “monitoring” in the strict sense—play a central role in this assessment by establishing diagnoses and quantifying the extent of pathology. Important constraints for typical neuroradiologic imaging are presented in the first section below.
Many interventions in the ICU aimed at restoring or maintaining conditions that are favorable for recovery of the patient target normal brain and, by extension, affect the results of neurologic monitoring. Therefore, an understanding of the parameters that affect the state of the brain is necessary as the context for interpreting the results of neurologic monitoring. These are presented in the second section followed by a detailed discussion of available modalities for serial assessment or monitoring of the nervous system.
Neuroradiologic Imaging
Routine imaging studies of the brain are important in the repeated assessment of a patient's neurologic status. Objective information, particularly about structural abnormalities, is essential to the clinical diagnosis. Neuroradiologic imaging studies typically take the form of computed tomography (CT) or magnetic resonance imaging (MRI). Although not considered “monitoring” per se, repeated studies or critically timed studies may provide important clues about the time course of a pathologic process (1). Typical imaging workup for various clinical diagnoses in critical care medicine is presented in Table 27.1.
To maximize the utility of an imaging study, the requesting physician needs to be aware of inherent strengths and weaknesses of the chosen imaging modality. The questions of contraindications to MRI, such as metal implants (see www.mrisafety.com), morbid obesity, claustrophobia, or the use of contrast agents, require special consideration. Whereas the quality of CT images is simply degraded by patient movement, MRI images acquired in an uncooperative, moving patient may contain “spurious pathology” because of misregistration of anatomic structures. The requesting physician needs to provide adequate details of the clinical history to the radiologist, so that the imaging protocol can be designed to maximize information. Finally, some thought should be given to the balance between the time spent obtaining the images and the risks to the patient from a reduced level of, or delay in, care during imaging and transport. Given the rapid development in MRI modalities or in postacquisition processing, such balance is frequently best achieved by consulting directly with the radiologist.
CT provides a map of the degree of radiographic absorption of intracranial structures. Generally, it is the test of choice for localizing blood and imaging bone. Newer helical CT scanners make image acquisition a comparatively fast process. This allows the two- and three-dimensional reconstruction of arterial anatomy from images during the first pass of radiocontrast administration to obtain a CT arteriogram.
MRI provides a map of the response of hydrogen nuclei to external magnetic fields. It is more versatile than CT, provides better imaging of posterior fossa contents, and is considerably more time consuming. T1 weighting enhances the detection of lipids, methemoglobin (e.g., as the subacute residual of a hemorrhage), and concentrated protein (e.g., in a colloid cyst). A radiofrequency pulse prior to T1 image acquisition can suppress the enhancement of lipids (“fat suppression”) and is an example of a protocol change that affects the resulting image. T2 weighting enhances the detection of unbound water such as in cerebrospinal fluid (CSF) (Fig. 27.1). A radiofrequency pulse prior to T2 image acquisition (fluid attenuation inversion recovery [FLAIR] imaging) can suppress the enhancement of CSF and improve the detection of edema (Fig. 27.1). MRI can also be focused to detect moving elements such as in MR arteriography or venography or CSF flow studies. Axoplasmic motion of bulk water can be imaged with MRI to obtain a diffusion image (apparent diffusion coefficient [ADC] map). This axoplasmic motion stops shortly after brain ischemia; therefore, diffusion images provide the earliest radiographic evidence for the core zone of an ischemic stroke.
Contrast media distribute with the blood flow, and can therefore accentuate areas of increased vascularity such as in inflamed tissue or areas of tumor-induced angioneogenesis. Contrast media also distribute into—and thereby highlight—brain structures that are missing a blood–brain barrier such as the pineal gland or pituitary stalk, or brain areas where the blood–brain barrier has been disrupted. Brain perfusion can be imaged during a bolus administration of contrast medium either by MRI or by CT. The resulting map of the time to peak concentration of the contrast medium currently provides qualitative information on cerebral blood flow, although quantitative approaches are under development. Qualitative differences in cerebral blood flow can be used to identify the ischemic penumbra of a stroke.
Cerebral Metabolism: Flow–Metabolism Coupling
The cerebral metabolic rate for oxygen (CMRO2) of the brain averages 3.0 to 3.8 mL O2/minute/100 g. Although only 2% of body weight, the human adult brain accounts for 15% to 20% of the resting oxygen consumption and about 25% to 30% of the glucose consumption of the body. In order to meet this high demand for oxygen and glucose, the brain requires a high level of perfusion: 40 to 60 mL/minute/100 g of brain tissue. Cerebral blood flow is regulated by four primary factors: metabolic stimuli, chemical stimuli, perfusion pressure, and neural stimuli.
|
Table 27.1 Typical imaging procedures for neurologic diseases in their acute phase |
|||||||||||||||||||||||||||||||||
|
|||||||||||||||||||||||||||||||||
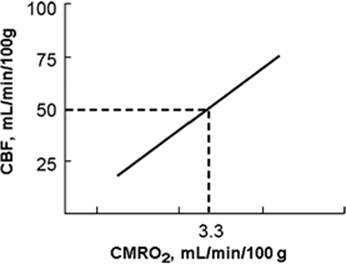
In the normal brain, an increase in cerebral metabolism is rapidly matched by local increases in cerebral blood flow (CBF). This is referred to as regional flow–metabolism coupling or cerebral metabolic autoregulation (2). CBF is thus linked to brain function and metabolism so that CBF varies in parallel with CMRO2 (Fig. 27.2). Two compensatory responses to acute reductions in CBF have been established: Autoregulation and increased oxygen extraction (3,4,5). Oxygen extraction is able to vary within a narrow range. Misery perfusion occurs when oxygen extraction is increased as a response to increased CMRO2, either when autoregulatory CBF compensation has been exceeded or uncoupling has occurred (6). As cerebral perfusion pressure (CPP) falls, cerebral blood flow is maintained initially by resistance arteriole vasodilation (7). Severe ischemia results as CPP is further reduced; the capacity of both CBF autoregulation and increased oxygen extraction is exhausted, and CBF falls as a function of pressure. Positron emission tomography (PET) studies indicate that this occurs with relatively preserved CMRO2 in the penumbra of a focal ischemic area.
|
|
|
Figure 27.1. Magnetic resonance images from a patient with a glioblastoma multiforme. The axial, gadolinium-enhanced T1-weighted image demonstrates the enhancing tumor margin with its nonenhancing central necrosis. The axial, T2-weighted image shows water as a bright signal in perifocal edema and the central tumor necrosis, as well as in the cerebrospinal fluid, while the fluid attenuation inversion recovery image highlights only the edema around the tumor and suppresses the cerebrospinal fluid signal and the tumor necrosis. (Images courtesy of Ilona Schmalfuss, MD.) |
Several vasoactive metabolic mediators have been proposed for cerebral regulation, including hydrogen ion, potassium, CO2, adenosine, glycolytic intermediates, phospholipid metabolites (2), and, more recently, nitric oxide (8). In humans, flow–metabolism coupling is evident during a variety of motor and cognitive tasks that can be mapped using CBF techniques (9).
The global relationship between CBF and CMRO2 can be expressed by the Fick equation where DajO2 is the arteriojugular difference in oxygen content:
CMRO2 = DajO2 × CBF or DajO2 = CMRO2/CBF
In brain injury, during hypothermia, and under the influence of anesthetic agents, CBF and metabolism may become dissociated. In a series of 109 severe head injury patients, Bouma et al. reported that CBF measured within the first 6 hours after trauma was less than 18 mL/minute/100 g (i.e., the threshold for cerebral ischemia) in one third of the patients (10). Arterial vasospasm was an independent predictor of poor outcome (11). Secondary ischemic neurologic damage was associated with systemic factors, such as hypotension or hypoxemia, and local factors, such as intracranial hypertension, after the injury worsened outcome. Disruption of normal homeostatic mechanisms such as pressure autoregulation (see below) may also aggravate cerebral ischemia. Mechanical hyperventilation used to reduce intracranial pressure (ICP) may be deleterious by decreasing CBF, and may thus also lead to ischemia (12).
|
|
|
Figure 27.2. Flow–metabolism coupling in the central nervous system. As the metabolic needs of the brain—expressed as the cerebral metabolic requirement for oxygen (CMRO2)—increases, cerebral blood flow (CBF) increases in parallel. |
Hypothermia
Cerebral protection by hypothermia is commonly attributed to cerebral metabolic suppression. The temperature coefficient (Q10) is the factor by which CMRO2 is decreased by a 10°C decrease in temperature. Between 37°C and 27°C, the temperature coefficient is 2.23, but between 27°C and 17°C—a temperature range during which the electroencephalographic activity ceases—the temperature coefficient doubles to 4.53. Below 17°C, the Q10 returns to near 2.0 (Fig. 27.3). In the absence of electroencephalographic activity (e.g., during barbiturate coma), however, the Q10 remains near 2.0 over the entire temperature range. With moderate hypothermia (i.e., above 27°C), both CO2 reactivity and autoregulation are intact while CBF and CMRO2 remain coupled (13). Evidence suggests that there is a change in the coupling of blood flow and metabolism during deep cerebral hypothermia (below 25°C). Nonetheless, metabolic regulation remains a main determinant of CBF even during deep cerebral hypothermia (14).
|
|
|
Figure 27.3. Theoretical interaction of temperature, brain function, metabolic requirements (CMRO2), and calculated Q10 values. During temperature reduction from 37°C to 27°C, function is maintained, and metabolism devoted to both function and maintenance of integrity are presumed to be equally affected, with a slightly more than 50% reduction in CMRO2 generating a Q10 value of 2.4. A further 10°C reduction in temperature to 17°C abolishes function, resulting in a step decrease in CMRO2 such that the calculated Q10 value is 5.8. At this point, the total oxygen consumed by the brain is reduced to less than 8% of the normothermic value. (With permission from Black S, Michenfelder JD. Cerebral blood flow and metabolism. In: Cucchiara RF, Black S, and Michenfelder JD. Clinical Neuroanesthesia. 2nd ed. New York; Churchill Livingston. 1998:9.) |
Anesthetics
With the exception of ketamine, most intravenous and inhalational anesthetics depress cerebral metabolism (15,16), with consequent reductions in oxygen consumption (CMRO2), CBF, and intracranial pressure (17). As CMRO2 decreases, CBF is reduced proportionately because of flow–metabolism coupling. After the administration of propofol and thiopental, flow–metabolism coupling usually remains intact (17), and cerebral oxygen saturation is expected to either remain unaltered or improve. Etomidate, in contrast, can produce a rapid reduction in CBF accompanied by a slower reduction in CMRO2, a finding first demonstrated in dogs and later replicated in humans (18,19). This mismatching of flow–metabolism coupling, with a greater reduction in flow than demand, may induce significant—albeit transient—cerebral oxygen desaturation.
Propofol is believed to maintain cerebral autoregulation, and even high doses of this drug do not obtund autoregulation or carbon dioxide reactivity (20). The effect of propofol on flow–metabolism coupling is more controversial, with at least one study demonstrating intact coupling (21). Both increased and decreased cerebral oxygen extraction have been demonstrated with propofol, suggesting CBF–CMRO2uncoupling (22,23). Despite the fact that normal flow–metabolism coupling is believed to be retained in only a proportion of head-injured patients, there is a paucity of data regarding the influence of propofol on flow–metabolism coupling after traumatic brain injury. It has been demonstrated that after traumatic brain injury, flow–metabolism coupling remains intact during a step increase in propofol infusion rates (24), as is the case in noninjured patients (25).
Benzodiazepines and opiates appear to have limited intrinsic effects on CBF, CMRO2, and CBF–CMRO2 coupling (26,27). Because of their sedative properties, they cause a decrease in CBF and intracranial pressure that parallels the sedation-induced decrease in CMRO2. As with all anesthetics, the decreased sympathetic tone caused by the sedation, on the other hand, risks a decrease in mean arterial pressure that may in fact diminish cerebral perfusion. Dexmedetomidine, an α2-receptor agonist, is a recent and expensive sedative. Similar to opiates and benzodiazepines, its effects on cerebral physiology appear to be caused by the sedation (28). Limited experience in traumatic brain injury patients did not reveal adverse effects (29).
|
|
|
Figure 27.4. Effect of arterial CO2 on cerebral blood flow (CBF). |
Arterial Blood Gases: Carbon Dioxide and Oxygen
Carbon dioxide is a potent cerebral vasodilator and thus a major determinant of CBF (Fig. 27.4) (30). At normotension, CBF increases almost linearly when the arterial partial pressure of carbon dioxide (PaCO2) increases from 25 to 80 mm Hg. Global CBF varies 2% to 4% for each mm Hg change in PaCO2 (31). The effects of PaCO2 on the cerebral circulation are regulated by a complex and interrelated system of mediators. The initial stimulus of CO2-induced vasodilation is a decrease in brain extracellular pH (32), further mediated by nitric oxide, prostanoids, cyclic nucleotides, potassium channels, and a decrease in intracellular calcium concentration as a final common pathway.
Arteriolar tone has an important influence on how PaCO2 affects CBF. Moderate hypotension impairs the response of the cerebral circulation to changes in PaCO2, while severe hypotension abolishes it altogether (33). Similarly, PaCO2 modifies pressure autoregulation, and from hypercapnia to hypocapnia, there is a widening of the autoregulation plateau (34). The response of cerebral vessels to CO2 can be used therapeutically by instituting hyperventilation to decrease CBF, in turn reducing cerebral blood volume and ICP. Numerous studies on CO2 reactivity have generally demonstrated that the response is preserved during intravenous or inhalation anesthesia (35). CO2 reactivity has also been used to assess the adequacy of brain perfusion in patients with internal carotid artery stenosis or cerebrovascular disease. In severe head injury, intact CO2 vasoreactivity is a good predictor of the effectiveness of hyperventilation or barbiturate therapy in controlling elevated ICP in individual patients (36). Furthermore, impaired cerebral CO2 vasoreactivity is associated with a poor outcome in patients with severe head injury (37). On the other hand, hyperventilation has been found to increase oxygen extraction, cause misery perfusion, and thereby promote secondary brain injury (12).
Moderate changes in arterial PO2 (PaO2) do not significantly alter CBF. When PaO2 falls below 50 mm Hg, however, CBF increases so that cerebral oxygen delivery remains constant (30). Hypoxia acts directly on cerebral tissue to release lactic acid, adenosine, and prostaglandins, which contribute significantly to cerebral vasodilation. Hypoxia also acts directly on cerebrovascular smooth muscle to produce hyperpolarization and reduce calcium uptake, both mechanisms enhancing vasodilation.
Pressure Autoregulation
Pressure autoregulation refers to the ability of the brain to maintain total and regional CBF nearly constant despite large changes in systemic arterial blood pressure (Fig. 27.5), independently of flow–metabolism coupling (34). Autoregulation is generally expressed as the relationship between CBF and arterial blood pressure when cerebral venous and CSF pressures are low. It can be more precisely defined using the relationship between CBF and CPP that represents the difference between mean systemic arterial pressure and cerebral outflow pressure. Because the cerebral venous system is compressible and may act as a “Starling resistor” or waterfall phenomenon (38), outflow resistance is governed by whichever pressure is higher—CSF pressure (ICP) or venous outflow pressure (jugular bulb pressure).
The cerebral vascular resistance (R) can be expressed as:
R = CPP/CBF = (8/π) × h × (l/r4)
where (8/π) is a constant for calculation, h = blood viscosity, l = length, and r = radius of the vessel. Importantly, the radius enters to the fourth power in the equation, making it the most efficient means of controlling vascular resistance.
In adults under normal conditions, CBF remains constant between a CPP of roughly 60 and 150 mm Hg (34). The autoregulation curve is shifted to the right in hypertensive patients and to the left in neonates. At the lower limit of autoregulation, cerebral vasodilation is maximal, and below this level, CBF falls passively with CPP. Beyond the upper limit where vasoconstriction is maximal, the elevated intraluminal pressure may force the vessels to dilate, leading to an increase in CBF and damage to the blood–brain barrier (34,39). Metabolic mediators, such as adenosine, can also be involved in the low-pressure range of autoregulation (39).
|
|
|
Figure 27.5. Preserved cerebral pressure autoregulation (solid line) keeps cerebral blood flow (CBF) constant over a wide range of perfusion pressures. Impaired autoregulation (dashed lines) either manifests as a shortened or even absent plateau of the autoregulation curve. |
Pressure autoregulation can be impaired in many pathologic conditions, including brain tumor, subarachnoid hemorrhage, stroke, or head injury. A loss of CBF regulatory capacity can be attributed either to damage of the control system (e.g., cerebral vessels)—usually referred to as “paralysis” in the clinical literature (40)—or of the feedback mechanisms involved in the brain's hemodynamic control. Changes in the normal feedback mechanisms may include tissue acidosis, extracellular potassium increase, or alterations in cerebral neural pathways. Neurotransmitters can reach vasoactive levels in perivascular CSF as a result of synaptic overflow either during neuronal activation or in pathologic conditions.
Neurogenic Regulation
A major difference between other systemic circulations and the cerebral circulation is the relative lack of humoral and autonomic control on normal cerebrovascular tone. Hence, a maximal stimulation of the sympathetic or parasympathetic nerves alters CBF only slightly (41). Furthermore, there is considerable evidence that indicates the existence of age-related differences in cerebral resistance vessels to neural stimuli. For example, both in vivo and in vitro, cerebrovascular constrictor responses to noradrenaline or electrical transmural stimuli are greater in fetal and neonatal animals than in adult animals. The mechanism for the age-related decrease is unclear, but could be the result of such factors as loss of number or affinity of α-adrenergic receptors with development. However, changes in cerebrovascular sensitivity to α-adrenergic stimuli may not occur with age in all species. Electrical or reflex activation of sympathetic nerves reduces CBF in adult rabbits. Sympathetic stimulation may protect the cerebral circulation from hyperemia associated with even modest elevations in arterial blood pressure.
Other Factors Regulating Cerebral Blood Flow
Although cardiac output hardly influences CBF in normal conditions, it may significantly influence flow to ischemic regions (42,43). However, studies examining the possible relationship between changes in cardiac output and CBF have, for the most part, assessed the effect of drugs that increase cardiac output during either normotension or induced hypertension. Improving cerebral perfusion by volume loading is indirectly accomplished by improving blood rheology and directly accomplished by increasing systemic arterial pressure, and preventing occult decreases in systemic pressure in hypovolemic patients.
Since blood viscosity is a major determinant of vascular resistance, CBF is inversely related with hematocrit (44). Nevertheless, a continuing controversy questions whether CBF is purely rheologic or a function of changes in oxygen delivery to the tissue (45). Bouma and Muizelaar have claimed that viscosity directly participates in cerebral hemodynamic autoregulation, termed viscosity autoregulation (39).
Cerebral Function
Clinical Examination
Cerebral function can be monitored with instrumentation or assessed clinically. As the discussion of individual monitoring modalities below shows, each monitor offers only a small window into the state of the central nervous system. Even in combination, current monitors have significant limitations in spatial and/or temporal resolution. A neurologic examination of an alert patient, on the other hand, can comprehensively assess the function of the central nervous system. Furthermore, it can be repeated as often as needed and requires neither expensive technical equipment nor specialized technologists.
In clinical practice, however, the neurologic examination has important limitations. First, the patient's clinical status or underlying disease may limit the amount of information obtainable by a clinical examination. Second, the results and, by extension, the utility of a neurologic examination may be constrained by therapeutic interventions that are frequently used in the ICU. For example, in an intubated patient who is treated with neuromuscular blocking agents, the only evidence of recurrent generalized seizure activity may be increased intracranial pressure, while the postictal alteration of consciousness and the motor manifestations of the seizure go unnoticed. Finally, neurologic evaluations are performed intermittently and by examiners of variable skill, raising problems of reliability. Despite these limitations, the clinical examination forms the cornerstone of the neurologic assessment of ICU patients and typically directs further diagnostic or therapeutic interventions.
While a comprehensive discussion of a clinical neurologic examination is beyond the scope of this chapter, two aspects of the examination that are particularly pertinent to the ICU environment will be discussed in some detail. The first is the assessment of the level of consciousness, because of its ties to patient outcome for many different neurologic diseases. The second is the examination for assessing brain death, not only because it is a graded assessment of brainstem function, but also because it illustrates sources of error that may impact the results of the clinical neurologic examination in the ICU environment in general.
Level of Consciousness: Glasgow Coma Scale
The level of consciousness is typically assessed by the Glasgow coma scale (GCS). Numerical scores are assigned for best responses in the categories of eye opening, motor response, and verbal response (Table 27.2). The GCS was originally described more than 30 years ago for the continuous assessment of patients with traumatic brain injury after the initial period of stabilization (46). Because its assessment is quick, objective, and relatively reliable (47) and because the resulting score is easily documented and communicated, the GCS has gained widespread use in emergency medicine and critical care patients. It has been incorporated into the APACHE score (48) and the World Federation of Neurosurgical Societies (WFNS) grading of subarachnoid hemorrhage (49).
The level of consciousness is a reflection of the severity of many different disease states, and can be compromised not just by diseases of the central nervous system, but also at the extremes of a wide variety of other organ dysfunctions common in critical care. Not surprisingly, therefore, the scores from a tool such as the GCS that assesses the level of consciousness may be associated with prognosis and outcome. For the GCS, an association of lower scores with worsened outcome has been shown for traumatic brain injury (50), subarachnoid hemorrhage (51), brain abscess (52), survival after cardiac arrest (53,54), and septic encephalopathy (55). For example, in traumatic brain injury, a GCS score greater than 7 suggests a 90% likelihood of an outcome of moderate disability or better, whereas a score less than 7 suggests an increased risk of death or persistent vegetative state that approaches 60% to 90% for a GCS score of 3 (50,56,57). In aneurysmal subarachnoid hemorrhage, a GCS score less than 13 after initial treatment of increased intracranial pressure (i.e., WFNS grade 4 or 5) corresponds to a 60% to 90% chance of a poor functional outcome or death, while such outcomes only affect 14% of patients whose level of consciousness is unaffected (GCS 15, WFNS grade 1 or 2) (51).
|
Table 27.2 Glasgow coma scale |
||||||||||||||||||||||||||||||||||||||||||||||||||||||||||||||||||||
|
||||||||||||||||||||||||||||||||||||||||||||||||||||||||||||||||||||
Despite its widespread use and appeal, the GCS has several important limitations, even if applied correctly. One is the information loss inherent in reducing a graded assessment of three responses into a single number. The second is that mechanical problems such as swelling and endotracheal intubation may prevent proper assessment of eye opening and verbal response. In this setting, some clinicians assign the lowest component score, whereas others try to infer the “true” score from related neurologic findings, and still others add the subscript “T” to indicate an intubated patient. Third, sedatives and neuromuscular blocking agents affect the GCS score upon repeated assessment. Finally, although the degree of brainstem involvement may reflect the severity of coma, the GCS provides limited information about brainstem function.
Determination of Brain Death
The determination of brain death for purposes of organ donation or withdrawal of life support is an area that has brought both the merits and the limitations of the neurologic examination into clear focus. Because the clinical determination of brain death requires a comprehensive and methodical assessment of the patient (58), its steps may serve as a guide to the neurologic examination of a comatose patient. An algorithm for the determination of brain death is shown in Fig. 27.6. Given the gravity of the “therapeutic” consequences of the diagnosis of brain death, a prerequisite to its determination is a clinical picture, typically supported by imaging studies, that is consistent with the occurrence of brain death.
The first step in the neurologic examination for the determination of brain death is the determination of coma (i.e., lack of responsiveness to external stimuli due to unconsciousness as discussed above). Motor responses elicited by the examination need to be differentiated from spontaneous movements during the examination. The latter are typically brief, slow movements that originate from the spinal cord and do not become integrated into decerebrate or decorticate responses. Only rarely are they reproducible upon repeat testing. Reproducible partial eye opening that failed to reveal the iris has been described in response to a peripheral painful stimulus in a patient who fulfilled clinical criteria of brain death (59). Conditions that may confound the clinical diagnosis of brain death are listed in Table 27.3. In addition to considering such confounding conditions, the diagnosis of brain death should be consistent with imaging studies and/or the overall clinical picture before the formal determination of brain death is considered.
The next step in the neurologic examination is the assessment of brainstem function. As in the assessment of the level of consciousness, direct trauma to either afferent or efferent structures needs to be considered before any of the tests of brainstem function are interpreted as negative. Typical tests, their afferent and efferent pathways, and potentially interfering clinical conditions are summarized in Table 27.4.
To complete the diagnosis of brain death, an apnea test is performed to test the response to an acute decrease in the pH of CSF due to hypercarbia. Hypercarbia is induced by disconnecting mechanical ventilation, while continued oxygenation is assured by both preoxygenation and apneic oxygenation. Absence of respiratory movements at an arterial PCO2 of 60 mm Hg or after an increase in PCO2 of 20 mm Hg is consistent with brain death. Apnea testing may be complicated by arterial hypotension due to loss of arterial and autonomic tone (60). While such hypotension corroborates the diagnosis of brain death, it makes the hemodynamic stability required for apnea testing difficult to attain. The apnea test may trigger movement responses, which reflect residual spinal activity (61).
|
|
|
Figure 27.6. |
Once all these criteria for brain death are met, either an observation period followed by repeat assessment or a confirmatory test is used to reach a final diagnosis (see Fig. 27.6). Cerebral angiography is the gold standard among confirmatory tests. Contrast media is injected into the aortic arch and distributes to the external carotid circulation, whereas the internal carotid and vertebral arteries fill only to the level of the skull base and atlanto-occipital junction, respectively. Similar findings can be obtained with magnetic resonance angiography or with single photon emission computed tomography 99mTc-HMPAO (SPECT). Electroencephalography and transcranial Doppler are also frequently used as confirmatory tests. Their role will be discussed in greater detail below.
Electrophysiologic Techniques
Neurophysiologic function testing has been used for more than 20 years as a diagnostic/prognostic tool in the intensive care unit (62,63,64,65). Snapshots of function of different parts of the nervous system have been used to predict the most likely long-term function of the nervous system. This information helps the intensivist determine whether continued aggressive intensive care is appropriate given the patient's most likely long-term neurologic outcome. To a much lesser extent, neurophysiologic testing modalities have been used as continuous monitors of neurologic function in the patient who cannot be assessed neurologically, primarily because of the need for sedation (66,67,68). There are two main modalities of neurophysiologic function testing used in the intensive care unit: Electroencephalography (EEG) and evoked potentials (EPs). For each modality, the theoretical basis for use and utility will be reviewed.
|
Table 27.3 Neurologic states resembling brain death |
||||||||||||||||||||||||
|
||||||||||||||||||||||||
Electroencephalography: Theoretical Basis
In order to understand how EEG can be used in the ICU, the clinician must first understand how scalp-recorded EEG is produced and what factors may affect the recordings. EEG activity is generated by neurons in the pyramidal layer of the cerebral cortex. The scalp-recorded EEG is produced by a summation of excitatory and inhibitory postsynaptic potentials (EPSPs and IPSPs), not actual cellular depolarization. EPSPs and IPSPs are produced by the spontaneous release of small packets of excitatory or inhibitory neurotransmitters from a nerve terminal that produce only very small changes in the postsynaptic membrane potential, insufficient to cause depolarization. As a result, the amplitude (voltage) of EEG electrical activity is much smaller than the electrocardiogram, ranging from <5 µV in the elderly to >100 µV in the teenager. As a result, the EEG signal cannot be recorded remotely from the generator site, and practically speaking, EEG activity recorded from a single electrode only reflects cortical activity directly beneath the recording site. In addition, because the EEG signal is so small, poor electrode contact with the scalp may result in significant loss of signal.
|
Table 27.4 Clinical examination of the brainstem during evaluation for brain death |
||||||||||||||||||||||||
|
Maintenance of ion fluxes associated with the production of the EEG is an energy requiring process. Pharmacologic total suppression of the EEG will result in a 50% to 60% decrease in CMRO2 (69,70). The decrease in oxygen requirement parallels the suppression of the EEG in cases of lesser suppression. An EEG that is merely slowed pharmacologically will be associated with a higher CMRO2 than an EEG that is totally suppressed or flat.
The EEG is organized both spatially and temporally, but patterns of organization are much more difficult for the clinician to recognize, primarily because few clinicians have significant experience with normal EEG patterns, pathologic EEG patterns, or drug-induced EEG patterns. EEG patterns are described primarily in terms of frequency (how fast voltage oscillations occur) and amplitude (size or voltage). Slower frequency ranges include δ (3 Hz or slower) and θ (3.5–7.5 Hz). These frequencies are not seen in the normal awake adult but are commonly seen in the naturally asleep adult or in the adult who is receiving therapeutic doses of sedative-hypnotic and/or analgesic drugs. Faster frequency ranges include α (8–13 Hz) and β (>13 Hz). Alpha frequencies (8–13 Hz) tend to be present on the posterior part of the head and are most prominent with the eyes closed. Alpha activity disappears with attention and concentration, replaced with faster β activity. Beta frequencies are commonly seen more toward the front of the head and are associated with increased “function” of a particular part of the brain. In the neurologically abnormal patient, θ and δ frequencies may be focal, associated with a specific loss of function, or more global, associated with generalized neurologic dysfunction. Generally, the more severe the neurologic damage/dysfunction, the slower the recorded EEG activity will be. For example, a patient with a receptive and expressive aphasia will likely demonstrate EEG slowing (θ and δ waves) over the dominant temporal lobe.
|
Table 27.5 Sedative-hypnotic and analgesic drugs and the electroencephalogram (EEG) |
||||||||||||||||||||||||||||||||||||||||||||||||||||||||||||||||||||||||||||||||||||||||||||||||||||
|
||||||||||||||||||||||||||||||||||||||||||||||||||||||||||||||||||||||||||||||||||||||||||||||||||||
Sedative-hypnotic drugs produce a change in neurologic function that is likewise paralleled by EEG changes. The EEG changes associated with sedative-hypnotic drugs are predictable, related both to the drug used and the dosage of drug given. The vast majority of sedative-hypnotic drugs used in the intensive care unit will produce identical, dose-related changes in the EEG. Table 27.5 shows EEG pattern changes associated with most drugs that would be used in the ICU environment. Limited information about dexmedetomidine, which is being increasingly used in the ICU for sedation, suggests that predictable EEG patterns do occur with this drug as with other sedatives and analgesics commonly used in the intensive care unit environment. Combinations of drugs, of course, will have different effects than when either drug is used alone. Specific data regarding the effect of combinations of drugs is limited and beyond the scope of this chapter. However, in general, both sedative and analgesic drugs will increase the primary effect of the drug being used in the higher dose as well as add effects of their own.
In summary, the scalp-recorded EEG reflects function of closely underlying neuronal tissue. Function may be altered by neurologic damage, pharmacologic means, normal changes in function associated with changes in alertness or sleep, or any combination of these factors. Thus, whether the EEG is used as a monitor or a diagnostic/prognostic tool, interpretation of data without a thorough knowledge of all factors that could influence recordings is not possible.
Diagnostic Electroencephalography: Clinical Utility in the Intensive Care Unit
Diagnostic EEG studies or EEG monitoring in the ICU is done primarily for one of three purposes: Brain death determination, monitoring for evidence of seizure activity or cerebral ischemia, and determination of drug effect for the purposes of titrating sedative and analgesic drugs or control of intracranial pressure.
Criteria for brain death vary from state to state, but in most states, a 16- to 32-channel isoelectric EEG on two consecutive recordings at least 24 hours apart can provide strong corroborating evidence for cessation of brain function (see Fig. 27.6). Because other factors affecting the EEG can produce an isoelectric EEG in the absence of brain death, the EEG cannot be used as the sole evaluation for brain death. While it is likely that drug levels (Table 27.5) will decline significantly over a 24-hour period, patients with massive drug overdose or impaired metabolic pathways may show an isoelectric EEG for much longer than 24 or 48 hours. In these cases, the neurologic examination may also not be useful since high drug levels may suppress even the most resistant reflex responses. Fortunately, other diagnostic testing methods, including other electrophysiologic and nonelectrophysiologic methods, may be helpful. Evoked potentials (see below), for example, are more resistant to drug effects than the EEG and can frequently be used to demonstrate brainstem and cortical function even in the face of an isoelectric EEG (71,72). In addition, EEG recorded immediately after cardiac arrest may show an isoelectric pattern that subsequently recovers (73). Cortical evoked potentials have also been demonstrated to be more reliable in assessing neurologic function immediately after an ischemic/anoxic insult (73). In summary, a scalp-recorded, 16- to 32-channel EEG is a helpful adjunct to the diagnosis of brain death, provided all other factors influencing the EEG are understood and controlled.
Continuous EEG monitoring in the ICU or, alternatively, sequential diagnostic EEG studies have been described for detection of nonconvulsive seizure (NCS) activity (or seizure activity in the pharmacologically paralyzed patient) and for detection of cerebral ischemia (66,67,68,74,75,76). This type of monitoring requires multiple channels of information to obtain adequate monitoring coverage of the entire brain. A highly trained technologist observes the patient simultaneously with the EEG recording, and operates the equipment and maintains recording electrodes during nursing care that will commonly dislodge them. The technologist also provides real-time neurophysiologic data to the clinicians caring for the patient. Processed EEG algorithms have been developed to facilitate detection of ischemia epileptiform and frank seizure activity during continuous EEG monitoring (77,78), but the technology has not yet evolved enough to eliminate the need for an on-site technologist with monitoring experience.
Continuous EEG monitoring in the ICU has demonstrated that NCSs are much more common than previously thought (75,76,79). NCSs have been reported following neurosurgical procedures, subarachnoid hemorrhage, CNS infection, head injury, and other conditions. In addition, there is evidence using neuron-specific enolase as a marker of neurologic injury that NCSs may produce neurologic damage and that seizure duration and time to diagnosis are significantly related to the extent of damage and long-term outcome. Without continuous EEG monitoring, NCSs cannot be detected, as they are not consistently and specifically associated with other findings such as hypertension and tachycardia (79).
The personnel and fiscal costs of continuous EEG monitoring have made it unfeasible except in the larger neurologic and neurosurgical intensive care units where many patients with conditions amenable to continuous monitoring require care (74). In addition, very little outcome data exist to demonstrate that such monitoring is overall cost effective. When considering real-time neurologic monitoring in the patient whose neurologic examination cannot be assessed, much work needs to be done to determine how continuous EEG monitoring will mesh with other neurologic monitoring modalities such as intracranial pressure, cerebral blood flow, brain tissue pO2 monitoring, transcranial Doppler, and microdialysis monitoring. Theoretically and based on limited clinical data (74,75,76,77,78,79), there is much promise for continuous EEG monitoring when used as a part of a multimodality neurologic monitoring program.
Processed Electroencephalogram: Monitoring of Sedation
The use of the EEG to monitor the depth of sedation in patients in the ICU has been described extensively in the literature, and nearly all techniques utilize processed EEG rather than the unprocessed analog signal. Drug effect monitoring is generally accomplished using one or two channels of EEG information, generally recorded over the frontopolar region of the cerebral cortex. This location is chosen because application of surface recording electrodes is easy in this location (no hair) and most devices designed for this purpose have been validated using frontopolar recording locations. Usage of this smaller number of channels is based on the assumption that the drug effect will be similar in all areas of the brain. This assumption is generally valid except in the case of a patient with focal brain damage. In areas of damage, the drug effect will generally be greater than usual and must be interpreted in light of the abnormal baseline recording. None of the commercially available devices for monitoring drug effects on the EEG has been calibrated or validated appropriately for monitoring drug effects in the patient with the abnormal EEG, and relatively limited information is available on the use of EEG to monitor drug effects in neurologically damaged patients (80,81,82,83).
EEG drug effect monitoring is used most commonly for titrating sedative drugs, particularly in the pharmacologically paralyzed patient, but also for titration of barbiturate drugs used to control intracranial pressure (66,67,68,84,85). Devices used to monitor the drug effect either utilize unprocessed, raw analog EEG in a fashion similar to ECG monitoring in the ICU or utilize one of three signal processing techniques: Power spectrum analysis, bispectral analysis, or EEG entropy analysis. Examples of commercial monitors include the bispectral index (BIS), the patient state index, and entropy. Although the BIS has been used and studied most widely among these monitors, the concepts discussed below should apply to other EEG-based monitors of sedation as well.
BIS (Aspect Medical Systems, Inc., Natick, MA) monitoring has been used in the intensive care setting to guide dosing of sedatives and reassure clinicians that paralyzed or agitated patients are amnestic but not excessively sedated (86). The BIS monitor processes EEG signals that are recorded from a self-adhesive electrode strip placed on the forehead. It calculates and displays a BIS value, a dimensionless number ranging from 0 to 100 that is derived from highly processed EEG data that includes EEG power, frequency, and bicoherence (87). Low BIS numbers indicate strong relationships among the EEG frequencies and reflect a condition consistent with a deep hypnotic state (Table 27.6). This relationship is valid despite the effects of age and infirmity on sensitivity to sedation (88,89).
|
Table 27.6 Clinical condition expected with bispectral index values |
||||||||||||||
|
Despite its obvious clinical utility, the aspects of imperfect performance of the BIS monitor are well known. For example, the BIS can decrease to numbers (20,21,22,23,24,25,26,27,28,29,30,31,32,33,34,35,36,37,38,39,40,41,42,43,44,45,46,47,48,49,50) consistent with deep general anesthesia during natural sleep without sedation (90). Moreover, although memory is less likely to form at lower BIS values, memory has been demonstrated even at a BIS in a range (40,41,42,43,44,45,46,47,48,49,50,51,52,53,54,55,56,57,58,59,60) associated with general anesthesia (91). Additionally, artifact from electromyographic (EMG), electro-oculographic (EOG) (92), or pacemaker generators (93) can produce significant but spurious BIS increases (from 50s to 80s). This raises the possibility of overdosing nonrelaxed or paced patients when attempting to maintain a given BIS range. BIS values can also be driven higher by medications that are CNS stimulants, such as ketamine, methylphenidate, or dexmedetomidine (94). In such cases, the BIS may not reflect the level of hypnosis or sedation experienced by the patient. Therefore, when the sedative dosages required to achieve a desired BIS range exceed normal expectations, the possibility of an artifactual interference deserves consideration.
Perhaps the most significant issue with BIS or other monitors of cortical anesthetic drug effect are their inability to differentiate deep sedation from cerebral ischemia. Both conditions cause loss of higher-frequency EEG waves (α and β slowing and δ and θ wave intrusion) and, in extreme states, both can produce burst suppression or isoelectric EEG patterns with a low BIS. When O2 delivery decreases below a level sufficient to meet the CMRO2, electrical function fails and BIS decreases. This may partly explain improved ICU outcomes when the BIS is maintained >60 (95). Therefore, the determination that sedation is adequate based on having achieved a target BIS value should only be made when one is confident that cerebral perfusion is adequate.
Interpretation of BIS or, for that matter, any EEG-based monitor of sedation is best accomplished when the patient's pharmacologic support remains stable in the face of changing CPP or, conversely, the CPP remains adequate and stable during pharmacologic adjustments and BIS changes. As a corollary, the BIS can assist with guiding therapy when the adequacy of O2 supply to the CNS is in question (95).
In summary, other than for drug effect monitoring, use of the EEG in the ICU remains relatively limited, primarily because of personnel costs and difficulty in maintaining stable technical conditions for monitoring multiple channels of information. As our understanding of underlying mechanisms for neurologic injury improves, we may be able to learn which monitoring modalities are most useful for a given clinical scenario and which can more specifically target EEG monitoring to a smaller area of the brain. In addition, as computing power continues to improve, signal processing technology will likewise improve, and EEG monitoring equipment that recognizes artifact and self-corrects technical problems may reduce the need for the continuous presence of highly trained personnel to operate the EEG in the ICU environment.
Evoked Potentials
The EEG is a recording of the spontaneous electrical activity of the cerebral cortex. In contrast, EPs are recordings of the electrical activity from different parts of the nervous system produced by either sensory or motor stimuli applied to activated portions of the sensory and motor systems, respectively. With the exception of motor-evoked responses recorded from muscle, EPs are much smaller than background EEG or muscle electrical activity, and the responses from repetitive stimuli must be averaged in order to be able to discern the responses from other background biologic signals or environmental noise. Auditory responses are very small (generally <0.5 µV) and require as many as 1,000 to 2,000 averaged responses to clarify the signal. Somatosensory responses are larger (0.5–10 µV) and require fewer averages to clarify. EPs are described in terms of latency (time [msec] from stimulus application to onset or peak of response) and amplitude (µV) (Fig. 27.7). Conceptually, amplitude is the more important parameter for ICU studies because voltage is mainly related to the amount of functional neural tissue generating the response, and latency is related to the conduction time from the stimulus site to the generating site. This assumption, while usually true, is not always the case since a peripheral or cranial nerve injury may produce a nerve with fibers conducting at many different velocities. This situation would produce a desynchronized evoked response of smaller amplitude, even when the neural tissue generating the more rostral response is entirely normal.
|
|
|
Figure 27.7. Latency is defined as the time from stimulus application to the onset or the peak of the response (peak latency shown here). Amplitude is the size (usually microvolts) of the evoked response. |
In comparison with the EEG, EPs are much less susceptible to the effects of intravenous sedative-hypnotic drugs and not significantly affected by intravenous analgesics (96). Auditory EP responses will not be altered significantly by any sedating or analgesic regimen used in the ICU today. Notably, based on known effects of opiates and sedatives on brainstem auditory evoked potentials (BAEPs), patients admitted with opiate or sedative drug overdose and an isoelectric EEG will not show any significant abnormality of waves I through V related to the drug effect alone (71,72,96). Somatosensory EPs are somewhat more susceptible to the effects of sedative drugs. Subcortical somatosensory responses (see below) are resistant to drug effects to the same degree as the BAEP. Cortical somatosensory EPs do show significant increases in latency and decreases in amplitude with sedating medications (96), but generally they will not be completely abolished even by enough sedative medication to render the EEG isoelectric (71,72,96). This observation is also important for the patient with drug overdose.
Table 27.7 is a summary of the different types of evoked potentials that may be recorded or monitored in the ICU. In the ICU, EPs are most commonly utilized as diagnostic tests of neurologic function. The results of these tests are then frequently used as prognostic indicators of intermediate and long-term neurologic function. EPs may also be monitored continuously in the ICU but, like with the EEG, personnel and maintenance costs are very high, and only a few large neurologic or neurosurgical ICUs are able to provide real-time EP monitoring.
EPs reflect the function of nervous system tissue along the entire pathway involved with the stimulated system. For example, somatosensory EPs are recorded by applying an electrical stimulus to a distal peripheral nerve, recording from the peripheral nerve more centrally, recording over the spinal cord (usually cervical region), and recording over the cerebral cortex. Thus, function of part of the peripheral nervous system, spinal cord, brainstem, thalamus, internal capsule, and cerebral cortex is assessed with a single test. In contrast to EEG, EPs, therefore, are able to test the function of portions of the nervous system caudal to the cortex as well as a limited area of the cortex. Generally, when EPs are recorded or monitored in the ICU, the function of the tested or monitored pathway is assumed to reflect the function of the surrounding neural tissue, whether cortical, subcortical, or spinal cord (Fig. 27.8). This assumption concerning the surrounding neural tissue is clearly not always valid; however, considerable clinical evidence has demonstrated that EPs usually do reflect the function of the surrounding neural tissue and are very effective at detecting a developing injury and in prognosticating the long-term effects of an existing neurologic injury. This section of the chapter will examine BAEPs, somatosensory evoked potentials (SEPs), and transcranial motor evoked potentials (TcMEPs) and their use as diagnostic, prognostic, and monitoring tools in the ICU. While each modality will be considered separately, BAEPs and SEPs are most commonly recorded together to provide information about a larger portion of the nervous system. Because TcMEPs were only recently approved for use in humans, only limited information about the diagnostic, prognostic, and monitoring utility of TcMEPs in the ICU is available. Since only a few centers are able to provide continuous EP monitoring to detect ongoing function and developing injury, this section will focus on the diagnostic and prognostic uses of EPs.
|
Table 27.7 Evoked potentials (EPs) in the intensive care unit |
|||||||||||||||
|
|||||||||||||||
|
|
|||||||||||||||
|
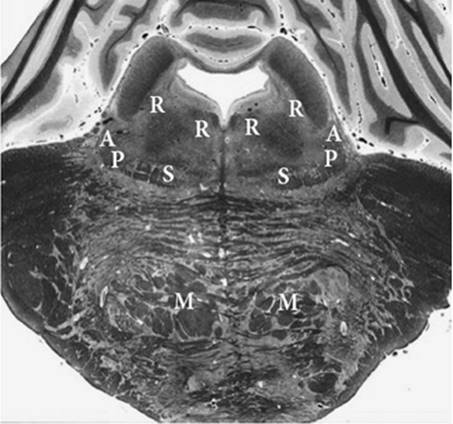
Figure 27.8. Section of the brainstem through the midpons. Note the relatively limited and separated territory of the brainstem actually monitored by evoked responses at this level. Function of the surrounding brain stem is assumed to be reflected by auditory and somatosensory function. Vital pathways and structures are near both the auditory and somatosensory pathways. A, auditory pathway; P, pain pathway; S, somatosensory pathway; R, reticular formation; M, descending motor pathway. |
Brainstem Auditory Evoked Potentials
The stimulus for the BAEP is a repetitive loud click applied either via headphone or via ear inserts. In order to interpret the information provided by BAEPs, the clinician must be aware of factors that may alter the ability to activate the auditory pathway with the click stimulus. For example, cerumen in the ear canal may muffle the applied stimulus. Trauma may anatomically disrupt the auditory apparatus (damage to the external auditory canal, tympanic membrane, middle ear apparatus). Aminoglycoside antibiotics may damage the inner ear transduction system. Fortunately, the eighth nerve itself produces a recordable action potential (Fig. 27.9), and presence of this response confirms that the auditory stimulus has actually reached the nervous system. Without the presence of an eighth nerve action potential, no conclusions about the functioning of the more rostral auditory pathway can be made.
|
|
|
Figure 27.9. Normal brainstem auditory evoked response. Note the presence of wave I, the eighth nerve action potential, which confirms that the auditory apparatus is being properly stimulated. |
Figure 27.8 is a schematic representation of the auditory pathway in relationship to important brainstem and midbrain structures. The entire BAEP is generally completed within 10 msec of the stimulus application. Because the auditory pathway has multiple synapses that produce recordable responses from the lower pons through the midbrain, if the recorded response demonstrates abnormalities at any level, significant neurologic impairment of the patient is likely because of the functional significance of nearby motor, sensory, autonomic, cranial nerve, and reticular activating system structures. Based on results from multiple studies, if the BAEP beyond the cochlear nerve action potential (wave I) is absent bilaterally, the CNS prognosis is very grave and most patients will subsequently be determined to be brain dead by clinical and/or angiographic criteria (62,65,97,98,99). Figure 27.10 shows BAEP and SEP recordings from three different patients who were comatose following trauma or surgery and were being evaluated for CNS function with EP recordings in the surgical ICU. Patient A had absent BAEPs beyond wave I and absent SEPs, and was determined to be brain dead within 24 hours of the EP studies. Patient B had a normal recording of waves I through V, but SEPs were absent. This patient had a prolonged hospital course and never recovered any higher neurologic function. Patient C had normal BAEPs and SEPs despite a severely impaired neurologic examination and difficult to control seizures at the time of the SEP study. Subsequent EP studies continued to show intact BAEPs and SEPs despite abnormal posturing and difficult to control seizures. This patient went on to recover independent neurologic function after many months of rehabilitation (100). These three patients exemplify the most common usage of EPs in the ICU, and their studies and outcome reflect what is documented in the literature. In summary, absent BAEPs beyond wave I indicate a high likelihood of a brain death outcome. Intact and normal BAEPs may indicate a good outcome, especially in the face of normal SEPs. If SEPs are absent bilaterally, the best likely outcome is a chronic vegetative state, even with normal BAEP waves I through V.
The auditory pathway continues rostrally, and responses may be recorded that are generated in the auditory cortex (middle-latency auditory evoked responses). There are limited clinical data available that indicate that presence of a normal middle-latency auditory response is a good prognostic sign to the same degree as the SEP in the comatose patient.
The stimulus for the SEP is a repetitive electrical stimulus delivered to a peripheral nerve, most commonly the median nerve at the wrist or the posterior tibial nerve at the ankle, using surface electrodes or subdermal needle electrodes. The response (nerve action potential) is recorded proximally over the peripheral nerve or appropriate nerve plexus to be certain that the somatosensory stimulus is being appropriately delivered to the central nervous system (Fig. 27.11). The next recorded response is generated in the lower brainstem and recorded with a surface electrode placed over the upper cervical spine. The primary initial cortical response at the rostral end of the somatosensory pathway is recorded over the cortex on the opposite side from stimulus application, and usually occurs within 25 msec from stimulus application at the median nerve or 50 msec from stimulus application at the posterior tibial nerve. The normal SEP also contains responses that are later than the primary response. These responses, also generated by cortical neurons, are considered to be related to higher cognitive function. Most studies where SEPs are either monitored or used for diagnosis and prognosis only analyze the initial primary cortical response occurring prior to 25 msec. A few studies have also examined the prognostic significance of the later SEP or auditory responses (101,102), but the clinician should be aware that all of these later responses are highly influenced and easily abolished by any of the drugs used for sedation and analgesia in the ICU. In fact, later auditory responses have been used to gauge the depth of sedation in a fashion similar to the EEG bispectral index (102).
|
|
|
Figure 27.10. Neurophysiologic studies from three comatose patients. A: Brain-dead patient. This patient has no recordable evoked auditory response after wave I and no recordable somatosensory response after the cervical response. B: Chronic vegetative state. This patient has an intact auditory evoked response and no cortical somatosensory responses. C: Good outcome. This comatose patient has normal auditory and somatosensory evoked responses at all levels. |
Figure 27.8 shows the somatosensory pathway schematically, together with the auditory pathway and nearby brainstem, midbrain, and cortical structures in a single slice through the pons. As shown in the figure, the auditory and somatosensory pathways are separated far enough to include multiple important structures in the territory between them. The anatomic locations of the two separated pathways explain why neurologic outcome is usually better when both evoked response modalities show a normal response. The presence of cortical responses to a peripheral stimulus indicates that the involved subcortical nervous pathway is intact and that cortical neurons are still functional to be activated and produce a measurable electrical response, both of which are necessary for a good long-term neurologic outcome.
In summary, the presence of normal SEPs bilaterally, based on all available literature, is an excellent prognostic sign. The absence of any SEP cortical response is a poor prognostic indicator. The degree of bad outcome can be predicted by the BAEP. Intact and normal BAEPs with absent cortical SEPs predict a best outcome of a chronic vegetative state. Outcome may be worse, however, as BAEPs commonly deteriorate later with rostral-to-caudal CNS deterioration. Absent BAEP responses beyond wave I predict a high likelihood of brain death. Present but abnormal SEPs are associated with intermediate outcomes between good/high function and a chronic vegetative state (62,64,65,97,98,99,102,103,104,105).
The motor pathway may be tested by transcranial stimulation of the motor cortex. The cortex may be activated by a magnetic or electrical stimulus. A descending response may then be recorded over the spinal cord at multiple levels: The peripheral nerve and (most commonly) the muscle. Cortical stimulation, either electrical or magnetic, commonly activates the motor cortex governing both the upper and lower extremities and produces a myogenic response that does not need to be averaged. The electrical stimulus intensity is quite high and is prohibitively painful in the awake subject. Thus, most of the limited work has been done using transcranial magnetic stimulation, which is much less painful and readily tolerated by the awake patient. What limited data are available indicate that results are mixed at best when using MEP testing as a prognostic indicator for long-term CNS outcome (106,107,108,109). Several carefully conducted studies also utilizing SEPs indicate that SEPs are a much better prognostic indicator than MEPs (106,109). Much more work using MEPs needs to be done before any firm conclusions about their utility can be drawn.
Peripheral Nerve Stimulation
The rate of recovery from neuromuscular blocking (NMB) agents depends upon the NMB agent chosen, its dosing pattern (intermittent or continuous infusion), and numerous patient factors (e.g., pseudocholinesterase deficiency, hepatic or renal dysfunction, induced cytochrome P450 enzyme, organophosphate toxicity, among many others) (110). The suitability for extubation following prolonged neuromuscular blockade has traditionally relied upon functional strength testing, such as an ability to produce a negative inspiratory force or to sustain a head lift. Incomplete patient cooperation caused by sedation or confusion, among other reasons, can adversely affect these tests. Peripheral nerve stimulation (PNS) used for “muscle twitch” testing, or acceleromyography, complements such functional assessments by objectively revealing the condition of the neuromuscular junction, independent of patient participation.
Reliable interpretation of nerve stimulation requires uniform stimulation and placement parameters. Conventional PNS delivers current—adjustable up to 80 mA—in a train-of-four (TOF) series at 2 Hz as double-burst stimulation (DBS), as single shocks at 1.0 or 0.1 Hz, or by tetanic stimuli of 50 or 100 Hz. When tolerated, maximal current settings assure the best chance of delivering supra-threshold stimuli and activation of the greatest percentage of motor fibers despite changes of impedance or proximity, as can occur with electrode separation or desiccation, skin cooling, or peripheral edema. TOF and double-burst stimulation patterns do not require comparison to earlier responses for interpretation, and are therefore well suited for use in the ICU setting where recovery of neuromuscular function may take hours to days and may involve assessments by multiple providers.
Muscle twitch testing measures the force of muscle contractions in response to PNS. The ratio of the force between the last and first stimuli in a series (TOF or DBS) best defines the percentage of acetylcholine receptors occupied by nondepolarizing NMB agents in the neuromuscular junction, but is cumbersome to perform (111). Counting the loss of twitches in a TOF is a simpler method for assessing the level of block and has greater bedside utility (Table 27.8). In contrast, the TOF ratio does not change following the administration of a depolarizing NMB agent such as succinylcholine. When depolarizing NMB agents are used, the force of contraction diminishes equally across all stimuli and disappears altogether with sufficient dose. If an excessive depolarizing NMB agent is administered, a prolonged phase II block emerges. TOF responses during a phase II block behave similarly to responses obtained following nondepolarizing NMB agents.
|
|
||||||||||||||||
|
Figure 27.11. Normal median nerve somatosensory response. Reproducible responses at the brachial plexus and cervical levels confirm that a somatosensory stimulus is reaching the central nervous system. Without responses at both these levels, conclusions about cortical functions cannot be made. |
||||||||||||||||
|
Table 27.8 Percentage neuromuscular junction blockade with nondepolarizing neuromuscular blocking agents and corresponding train-of-four and clinical responses |
||||||||||||||||
|
The peripheral nerve stimulator is attached to a patient using two pregelled electrocardiogram electrodes, although needle electrodes can also be used. The electrodes should be placed closely (without the gels touching) to one another over a site where a nerve with motor function lies relatively superficial to the skin. Antegrade nerve conduction is improved if the positive lead is applied to the proximal electrode. The current path between electrodes should not contain the muscle whose movement is being monitored. Separation of electrodes beyond several centimeters increases the probability that the PNS current may depolarize muscle directly, causing movement unrelated to conduction through the neuromuscular junction and thus, misinterpretation of the level of neuromuscular blockade.
Common sites for electrode placement are over the course of the ulnar nerve at the medial aspect of the wrist or over the ulnar groove at the elbow. Stimulation of the ulnar nerve activates the m. adductor pollicis and twitches the thumb. Placement of the electrodes anterior to the tragus will stimulate the facial nerve, which innervates the m. corrugator supercilii and furrows the eyebrow. Stimulation of the posterior tibial nerve posterior to the medial malleolus causes the m. flexor hallucis brevis and great toe to move.
Cold will weaken muscle strength even in the absence of NMB agents, making PNS testing valuable in patients recovering from hypothermia (112). Patients who have had a stroke will experience an up-regulation of acetylcholine receptor density on the muscle membrane as the affected muscles denervate. As a result, PNS on an affected limb will produce a TOF response that exceeds the response seen from the same site PNS on a normal limb. To avoid overdosing or prematurely extubating a patient based on TOF testing, PNS should be performed on sites unaffected by prior nerve injury.
PNS is particularly helpful for monitoring the level of relaxation achieved during the infusion of NMB agents. PNS monitoring can help direct the rate of infusion and avoid excessive administration. Pharmacokinetic and pharmacodynamic models that illustrate the TOF response to PNS with succinylcholine and rocuronium NMB infusions can be found at http://vam.anest.ufl.edu/simulations/simulationportfolio.php.
Cerebral Perfusion
All of the previously discussed monitors are monitors of nervous system function or imaging modalities of brain structures. When function fails, they do not necessarily give information about the mechanismof nervous system damage. One of the most common mechanisms of CNS damage is inadequate blood flow. The remainder of this chapter will examine those methods that are available to monitor the adequacy of CBF. These monitors provide information that is complementary to the functional assessment discussed above, because function only becomes altered when CBF decreases by more than half.
The most common clinical measure aimed at ensuring adequate CBF is to maintain the cerebral perfusion pressure above the lower limit of cerebral autoregulation. In cases of intracranial disease, the relevant pressure opposing adequate perfusion is the intracranial pressure.
Monitoring of Intracranial Pressure
ICP reflects the dynamic interaction of tissues and fluids within a fixed-volume, hard cranial shell of approximately 1,400 mL in an adult. Its contents can be divided into cerebral parenchyma, arterial and venous blood, and CSF components. The cerebral parenchyma accounts for 80% to 90% of the contents and includes both intra- and extracellular fluid as well as cellular membranes. The volume of the blood together with the CSF makes up the remaining 10% to 20%. The Monroe-Kellie doctrine, as modified by Cushing at the turn of the 19th century, states that any increase in volume of one intracranial component occurs at the expense of another. Normal intracranial pressure in adults is 8 to 15 mm Hg and in babies the pressure is 10 to 20 mm Hg (less when measured through a lumbar puncture). Compensatory mechanisms stabilize ICP in response to slight changes in CBF, as well as CSF production and absorption. In the absence of effective compensatory mechanisms, an increase in the volume of any one of the components will lead to an exponential increase in pressure, as illustrated by the pressure–volume relationship (Fig. 27.12) described by Langfitt (113). Compensation may be achieved by any of the following: (a) changes in the volume of CSF; (b) the slight distention of the dura; (c) changes in the intravascular volume, particularly in the venous channels; and (d) compression or swelling of the brain. The rate of change in the volume of intracranial contents is of importance. For example, a rapid increase in volume produced by an epidural hematoma may overwhelm the compensatory mechanisms and produce a rapid increase in ICP, whereas a slowly growing brain tumor may produce a gradual displacement of structures within the cranial vault without a significant increase in ICP.
ICP is not static. Pressure fluctuations occur with cardiac systole due to distention of the intracranial arteriolar tree and respiration (i.e., ICP falling with each inspiration and rising with expiration). Straining or compression of neck veins can also cause a rise in pressure. A value in excess of 18 to 20 mm Hg is abnormal and must be treated.
|
|
|
Figure 27.12. Pressure–volume relationship of the intracranial vault. Volume in milliliters (abscissa) of water added to a supratentorial extradural balloon in a monkey, 1 mL/hour. Pressure in millimeters of mercury (ordinate). (With permission from Langfitt TW. Increased intracranial pressure. Clin Neurosurg. 1969;16:43–71.) |
As the ICP increases, the cerebral venous pressure increases in parallel so as to remain 2 to 5 mm Hg higher, or else the venous system would collapse. Because of this relationship, CPP can be satisfactorily estimated from mean arterial pressure minus ICP. Cerebral arterial circulation is normally autoregulated to maintain a constant CBF for a CPP between 60 and 150 mm Hg.
Clinical deterioration in neurologic status is widely considered a sign of increased ICP. Bradycardia, increased pulse pressure, and pupillary dilation are accepted as signs of increased ICP.
The five methods most commonly used to monitor ICP are (a) an intraventricular catheter, (b) a subarachnoid or subdural bolt, (c) a subdural catheter, (d) an intraparenchymal fiberoptic filament sensor, and (e) an extradural fiberoptic sensor. Each of these has its advantages and disadvantages. The intraventricular catheter is typically considered the gold standard. Its advantages include easy recalibration and a means to treat ICP elevations by removing CSF. On the other hand, placement may be difficult in the face of a distorting intracranial pathology. The other devices are easier to place, but the accuracy of the recorded values may be more difficult to verify. All ICP monitors are invasive and share a risk of infection of about 5%.
|
|
|
Figure 27.13. Intracranial pressure waveform showing the percussion wave (P1), tidal wave (P2), and dicrotic wave (P3). The timing of the peaks corresponds to the arterial pressure waveform. (Image courtesy of Integra Neurosciences, Inc.) |
Patients who require ICP monitoring are generally considered to be those (a) with a closed head injury and a GCS less than or equal to 8; (b) in whom a CT scan shows significant brain distortion; (c) with worsening neurologic status; (d) in whom there is a need to sedate, paralyze, or operate in the context of an abnormal brain; (e) with postoperative complications; and (f) who are unconscious or in shock. The ICP data derived from such monitoring can serve as a useful therapeutic guide to clinical care.
Interpretation of Intracranial Pressure Waveforms
The normal ICP waveform has three characteristic peaks (P1, P2, and P3) of decreasing height that correlate with the arterial pulse waveform (Fig. 27.13). The P1 (or percussion) wave originates from arterial systole, and has a sharp peak and constant amplitude. The P2 (or tidal) wave is more variable and ends on the dicrotic notch. Elevation of the P2 component of the ICP waveform is thought to reflect decreased intracranial adaptive capacity and impaired autoregulation. However, sustained increases in ICP can occur without P2 elevation. The P3 (or dicrotic) wave follows the dicrotic notch and is venous in origin.
When consecutive ICP waveforms are observed over time, three distinct patterns—first described by Lundberg in 1960 as A, B, and C waves—may be observed (114). A waves, now more commonly referred to as plateau waves, are pathologic (Fig. 27.14). There is a rapid rise in ICP up to 50 to 100 mm Hg, followed by a variable period during which the ICP remains elevated (“plateau”), followed by a rapid fall to the baseline. These plateau waves typically last from 5 to 20 minutes. They are generally seen in patients with already elevated ICP. During a series of plateau waves, both amplitude and duration may increase, leading to a “terminal” wave in which ICP may rise to levels that impede CBF. “Truncated” or atypical plateau waves that do not exceed 50 mm Hg are early indicators of neurologic deterioration. B and C waves are smaller fluctuations in ICP thought to be related to respiration and autonomic fluctuations in blood pressure (Traube-Hering-Mayer waves), respectively. They are of little clinical significance.
|
|
||||||||||||||||||||||||||||||||||||||||||||||||||||||||||||||||||||||||||||||
|
Figure 27.14. Lundberg plateau waves. The tracing of the intracranial pressure shows several pathologic increases of intracranial pressure, with plateaus lasting from 20 to 60 minutes. (Image courtesy Integra Neurosciences, Inc.) |
||||||||||||||||||||||||||||||||||||||||||||||||||||||||||||||||||||||||||||||
|
Table 27.9 Techniques for measuring cerebral blood flow |
||||||||||||||||||||||||||||||||||||||||||||||||||||||||||||||||||||||||||||||
|
||||||||||||||||||||||||||||||||||||||||||||||||||||||||||||||||||||||||||||||
While a markedly decreased or elevated cerebral perfusion pressure may lead to ischemia or spontaneous hemorrhage, respectively, a normal cerebral perfusion pressure by no means ensures normal cerebral blood flow. Increased cerebrovascular resistance (e.g., because of carotid stenosis, cerebral vasospasm, or microcirculatory compromise) may cause ischemia despite normal cerebral perfusion pressure. Similarly, normal cerebral perfusion pressure may coexist with abnormally increased cerebral blood flow in settings such as posttraumatic vasoparalysis or normal perfusion pressure breakthrough after resection of an arteriovenous malformation.
Direct Cerebral Blood Flow Measurement
The ideal clinical method for CBF measurement in patients with intracranial pathology would be a noninvasive, inexpensive bedside procedure that is continuous or at least frequently repeatable, and provides good spatial resolution for superficial and deep structures of all vascular territories (115,116). No currently available method (Table 27.9) comes close to having all these characteristics. Nonetheless, determinations of CBF serve to validate other techniques of assessing cerebral perfusion and provide important insights into the pathophysiologic events in head injury or stroke.
Direct measurement of cerebral blood flow is possible by determining the kinetics of either wash-in or wash-out of an inert tracer compound, in a variation of the method originally described by Kety and Schmidt (117). The most widely used measurement involves the administration of a radioactive isotope of 133Xe either per inhalation or intravenously, followed by measurement of the radioactivity wash-out, with γ detectors placed over specific areas of the brain. This method provides a spatial resolution of about 3 cm to 4 cm, depending on the number of detectors. In the normal brain, flow at different depths may be inferred from the early wash-out, which should reflect high-perfusion cortical gray matter, and low-perfusion deeper white matter. An important disadvantage of the technique is its lack of sensitivity for focal areas of hypoperfusion, which are obscured by adjacent areas of adequate flow—a phenomenon described as “look-through.”
Radiologic methods like SPECT, PET, Xenon-enhanced CT or perfusion CT, or MRI provide excellent spatial resolution, but are not available at the bedside. Some are used clinically as confirmatory tests in the determination of brain death. SPECT and magnetic resonance angiography, for example, show a “hollow skull phenomenon” and absent intracranial flow, respectively. Xenon-enhanced CT, which can be combined with standard CT scanning, has been used to obtain prognostic information and withhold unnecessarily aggressive therapy by assessing the severity of the decrease in CBF during stroke (118). Perfusion imaging allows the detection of a viable penumbra around areas of ischemia, which may be restored to normal function if the relative ischemia can be reversed.
|
|
|
Figure 27.15. The flow velocity in intracerebral arteries shows a characteristic pattern of changes as intracranial pressure increases to the point of intracranial circulatory arrest and brain death. Initially, it resembles an arterial pressure wave form. (With permission from Hassler W, Steinmetz H, Gawlowski J. Transcranial Doppler ultrasonography in raised intracranial pressure and in intracranial circulatory arrest. J Neurosurg. 1988;68:745–751.) |
Transcranial Doppler
An easy-to-apply, continuous, and noninvasive monitor of relative changes in CBF employs transcranial Doppler (TCD) ultrasound (119).
Theoretical Basis
Ultrasound waves are used to measure the velocity of blood flow in the basal arteries of the brain and the extracranial portion of the internal carotid artery. These waves are transmitted through the relatively thin temporal bone, the orbit, or the foramen magnum (120). When they contact moving red blood cells, they are reflected at a changed frequency through the brain and skull back to a detector. The change in frequency as blood cells move toward or away from the ultrasound transmitter and detector is an example of the Doppler effect, and is related to velocity and direction of flow. Velocity increases during systole and decreases during diastole; blood in the center of the lumen moves faster than that near the vessel wall, producing a spectrum of flow velocities. This spectrum resembles the shape of the waveform produced by an intra-arterial pressure transducer (Fig. 27.15). The TCD probe emits ultrasound waves as short pulses. Because ultrasound travels through tissue at a constant velocity, assessment of flow at different distances from the transducer becomes possible by varying the time window during which the reflected ultrasound waves are received. Thus, each arterial segment at the base of the brain has a distinct signature in terms of depth of insonation and direction of flow. TCD measurements are most commonly (and easily) made in the middle cerebral and internal carotid arteries, but may also be measured in other vessels, including the anterior cerebral, anterior communicating, posterior cerebral, posterior communicating, and basilar arteries. In approximately 10% of patients, particularly elderly females, technically satisfactory recordings cannot be obtained because of increased skull thickness (121).
Although TCD allows the interrogation of all arteries that supply the brain, it cannot provide a simple assessment of global or hemispheric CBF. In the setting of acute stroke or traumatic arterial dissection, the mere patency of a vessel is an important question that has diagnostic, therapeutic, and prognostic implications (120,121). For example, the presence of blood flow indicates recanalization of a vessel, and may be used to spare a patient the risks associated with thrombolytic therapy. Beyond the question of vessel patency, the link between TCD measurements and cerebral blood flow is indirect and subject to one technical limitation and two principal assumptions inherent in the link. The technical limitation is that the accuracy with which the flow velocity can be determined depends on the angle of insonation. Variability of repeated measurements can be minimized either by using a single examiner or by rigidly mounting the TCD probe on the patient's head with a headset, provided a shift in brain structures caused by a mass lesion does not displace the artery. The two principal assumptions that have to be met for TCD-measured blood flow velocity to correspond to CBF are as follows:
1. Flow and flow velocity are directly related only if the diameter of the artery remains constant.
2. Second, the blood flow in the basal arteries of the brain must be directly related to cortical CBF.
These assumptions likely represent an oversimplification and have not been supported adequately by evidence. Specifically, radioactive xenon-measured CBF does not correlate well with TCD-derived middle cerebral artery velocity during carotid endarterectomy or cardiopulmonary bypass (122,123,124). Likewise, normal variations in blood flow velocities are large (125). Despite this limitation, TCD has found many applications in the ICU, particularly in answering research questions in combination with other monitoring modalities that assess CBF. While these have contributed to our understanding, for example, the time course and mechanisms of secondary injury in brain trauma, their application is limited to a few centers (126,127,128).
Detection of Cerebral Vasospasm
TCD has been helpful in identifying vasospasm following aneurysmal subarachnoid hemorrhage (129,130,131,132). As the diameter of the arterial lumen decreases with vasospasm, the velocity of blood flowing through the narrowed vessel must increase if flow is to be maintained. Using absolute flow velocity alone, detection and documentation of the severity and duration of vasospasm are possible, with a specificity that approaches 100% but with limited sensitivity (125,133,134). Attempts have been made to improve the sensitivity by normalizing the flow velocity to that measured prior to the time of vasospasm (125) or to the flow velocity of the ipsilateral extracranial internal carotid artery (130). One important setting wherein absolute TCD flow velocity may underestimate the severity of vasospasm is that of increased ICP (135). Increases in ICP, however, lead to characteristic changes in the TCD waveform and increase the pulsatility index (see below).
Although TCD has contributed much to our understanding of the natural history of vasospasm following aneurysmal subarachnoid hemorrhage, most studies predate the current therapeutic approach of early exclusion of the aneurysm and supportive therapy with hypertensive-hypervolemic hemodilution and nimodipine. A recent advance in the treatment of vasospasm that highlights one limitation of TCD is the therapeutic dilation of stenotic arteries. TCD flow velocities may remain elevated despite successful dilation as a result of impaired autoregulation in the poststenotic vascular bed (136). Likewise, TCD cannot assess isolated distal vasospasm, which may account for as much as a third of all cases of vasospasm (137). Because of such specific limitations and some limitation in sensitivity (138,139), TCD is not universally used to assess patients with aneurysmal subarachnoid hemorrhage.
Assessment of Intracranial Pressure and Confirmation of Brain Death
The TCD-generated waveform exhibits sequential characteristic changes as intracranial pressure increases (Fig. 27.15) (140). As ICP increases, the systolic waveform becomes more peaked. As ICP nears diastolic blood pressure, diastolic flow diminishes and subsequently ceases. Once ICP exceeds diastolic blood pressure, TCD shows a pattern of to-and-fro movement of blood that indicates imminent intracranial circulatory arrest (Fig. 27.15). This change in waveforms can be used to calculate a pulsatility index by relating the difference between peak systolic and end-diastolic velocity either to the mean or to the systolic velocity. Such waveform analyses correlate well with the intracranial pressure (135,141), but cannot replace ICP monitoring because autoregulation, vasospasm, or proximal arterial stenosis may alter the TCD signal independent of the ICP (120).
Clinical brain death demonstrates a characteristic blood flow velocity pattern (Fig. 27.15) (142,143). There is a short systolic inflow of blood, followed by an exit of blood (flow direction reverses) from the cranium during diastole. TCD is a validated confirmatory test in the diagnosis of brain death, with a sensitivity that exceeds 90% and a specificity of 100% (144,145). While TCD can ascertain the diagnosis in most patients at the bedside, a large craniotomy or an inadequate bone window may preclude the complete examination necessary to confirm brain death.
Jugular Venous Oxygen Saturation Monitoring
Jugular venous oxygen saturation (SjvO2) monitoring has been touted as an indicator of cerebral oxygen homeostasis. Changes in SjvO2 from normal range (60%–70%) provide indirect information on the state of CMRO2, and because blood flow is normally linked to CMRO2, indirect information on CBF as well. Approximately 50% to 70% of patients with severe head trauma (GCS ≤8) will have an episode of desaturation (SjvO2 <50%). Despite an ischemic threshold widely accepted to be SjvO2 >50% during the early hyperemic conditions following head injury (146), the clinical utility of SjvO2 monitoring remains unsettled.
The complexity of catheter placement, sample collection, and results interpretation may contribute to a mere 20% utilization of SjvO2 monitoring in victims of moderate to severe head injury (147). SjvO2 is preferentially measured from the flow-dominant internal jugular (IJ) vein (right 60%, left 25%, equal 15%) (148) to provide the best estimate of whole brain CMRO2 conditions. Hemispheric dominance can be established by which side will, in response to unilateral compression of the IJ vein, produce the greater rise of intracranial pressure. Alternatively, IJ vein size seen by ultrasound provides a reasonable estimate of dominance, as does the relative size of the jugular foramina on CT scan of the head.
Cannulation of the jugular bulb for intermittent (standard catheters) or continuous (fiberoptic oximetry catheters) monitoring of jugular venous saturation is similar to internal jugular catheterization for central venous catheter placement; however, the needle, wire, and catheter are advanced in the cephalad direction. The risk of causing an intracranial vascular injury is reduced if the wire is not pushed into the jugular bulb. The catheter (hollow or oximetric) should be advanced slowly until resistance indicates it has reached the roof of the bulb. The catheter is then withdrawn 1 cm so that head movement cannot cause catheter-related vessel injury or thrombosis. It is recommended not to power-flush or administer infusions through this catheter.
An increase in SjvO2 indicates either lowered CMRO2 (less extraction) and/or increased or hyperemic CBF. A decrease in SjvO2 (greater extraction) indicates increased CMRO2, hypoxia/anemia, or oligemia. Observed changes in SjvO2 might then help guide therapeutic interventions.
Abundant experience validates the association of jugular venous desaturation (SjvO2 less than 50%) with worsened neurologic outcome. Conversely, mortality was reduced 66% when monitoring and managing the cerebral extraction of oxygen with SjvO2 in conjunction with cerebral perfusion pressure than when cerebral perfusion pressure alone was managed (149). CMRO2 increased in patients with elevated intracranial pressure (ICP ≥20 mm Hg) and normal to decreased cerebral extraction (“luxury perfusion”) of oxygen with hyperventilation therapy. Elevated ICP associated with normal to increased cerebral extraction of oxygen was treated with mannitol, resulting in improved ICP and cerebral oxygenation.
Profound neurologic deterioration occurs with SjvO2 desaturation to 30% or less (150). As cerebral circulatory arrest develops, the external carotid artery increasingly provides the blood sampled at the jugular bulb, and SjvO2 then increases. In the clinical setting where brain death is expected, a ratio of mixed venous blood saturation to SjvO2 less than 1 has been found to be highly sensitive (95%), specific (100%), and predictive (92%) for cerebral circulatory arrest (151).
The limitations with SjvO2 monitoring may partly explain its low utilization. Admixture of extracranial blood through collateral venous drainage into the superior sagittal, sigmoid, and cavernous sinuses directly into the jugular bulb is believed to occur even when it is correctly placed into the jugular bulb (152). When samples are drawn faster than 2 mL/minute (153) or the catheter tip lies too short of the jugular bulb, extracranial blood may further contaminate the specimen and spuriously elevate SjvO2. Even a “clean” SjvO2 sample does not distinguish between lateralizing differences in flow, metabolism, or brain injury. Thus, because SjvO2 reflects a global average from a variety of brain regions, marked regional hypoperfusion may not be reflected by a change in SjvO2 (154). Although SjvO2 and brain tissue oxygen pressure (PbtO2), a measure of regional ischemia, usually track in the same direction, maintaining SjvO2 above conventional thresholds did not reliably protect against the occurrence of regional ischemic insults. Consequently, SjvO2 cannot be used alone to direct hyperventilation or to alert clinicians to evolving hypocapnia-induced regional cerebral ischemia. It is now clear that “acceptable” hyperventilation may cause harm that remains clinically undetected by SjvO2 (155).
SjvO2 monitoring may be most useful as a trend monitor in patients with diffuse global brain injury and when it identifies saturations below the ischemic threshold. Normal-range SjvO2 can represent a “false-negative” measurement insofar as areas of regional ischemia may be present. Currently, the best technique for guiding therapy to a regional area of concern is with PbtO2 monitoring.
Near-infrared Spectroscopy
Near-infrared spectroscopy (NIRS) utilizes the minimal absorption and greater penetration of wavelengths in this portion of the electromagnetic spectrum to evaluate changes in cerebral blood flow and cerebral oxygenation. Similar to pulse oximetry, NIRS compares differences in the absorption of hemoglobin (670–760 nm) to oxyhemoglobin (830 nm). In this manner, NIRS can be used for noninvasive assessment of brain oxygenation through an intact skull in human subjects by detecting changes in oxyhemoglobin concentrations associated with neural activity.
Application of straight-line photon transmission to oximetry was developed for clinical application in the early 1970s and reported by Jobsis in 1977 (156). A second type of NIRS—imaging of diffusion and scattering light—was developed by Kato et al. (157) and McCormick et al. (158) in 1991. NIRS utilizes light with a wavelength between 700 and 1,300 nm to penetrate the scalp, skull, and brain. A review of the development of the technique was recently published (159). NIRS offers the advantage of continuous, noninvasive monitoring of the cerebral cortex, and is typically done with one sensor each for the right and left hemisphere of the brain. Originally developed for monitoring neonates, the penetration in adults is significantly less compared to neonates. Additionally, extracranial changes in blood flow and oxygenation affect absorption values. NIRS may be as sensitive in detecting progressive cerebral hypoxia as EEG (160), but spatial resolution is limited by the number of detectors. Together with transcranial Doppler evaluation, it provides useful information in the hemodynamic evaluation of carotid artery occlusion (161), and in 2004 was described as a promising technique in the near future (162). At this time, clinical utility in the adult population remains limited.
Brain Oxygenation/Microdialysis
In contrast to most other techniques for evaluating brain oxygenation, tissue monitoring and microdialysis offer both the advantage and disadvantage of monitoring a very discrete region of tissue (163). Continuous brain tissue oxygen monitoring measures oxygen delivery and identifies cerebral hypoxia and ischemia in patients with brain injury, aneurysmal subarachnoid hemorrhage, or malignant stroke, or other patients at risk for secondary brain injury. Intraparenchymal direct oxygen partial pressure measurements (PbrO2) have been shown to be of potential value in the management of cerebral perfusion and management of patients with traumatic brain injury (164,165).
In the 2007 Guidelines for the Management of Severe Head Injury (166), a brain tissue oxygenation threshold of less than 15 mm Hg was adopted as a level III recommendation. Based on many studies over the past decade (167,168,169), subthreshold levels of PbrO2 have been associated with increased morbidity and mortality in patients with severe brain injury. Giri et al. described that increases in inspiratory oxygen has little effect on PbrO2 in normal tissue, whereas in the injured brain, PbrO2 is increased as long as blood flow is present (170). Stiefel et al. reported in 2005 a management strategy in severe traumatic brain injury that included PbrO2 monitoring and therapy directed at maintaining brain oxygenation greater than 25 mm Hg (171). Using this multimodal approach, they observed reduced patient mortality compared to CPP-directed therapy.
Van den Brink et al. studied 101 comatose, nonpenetrating head injury patients, whose GCS score was greater than 8. Despite aggressive management of both ICP and CPP, brain tissue hypoxia frequently occurred (169). The depth and duration of tissue hypoxia was associated with an unfavorable outcome and death at 6 months after injury. In patients with severe injury in whom hyperventilation is considered, monitoring of brain oxygenation may be considered (172). The significance of local partial pressure of brain tissue oxygen continues to be debated; however, evidence for inclusion in multimodal monitoring is increasing.
Microdialysis is a technique that can be combined with brain tissue oxygen monitoring within the same highly localized probe (173,174). The intracerebral probe consists of a fluid path surrounded by a semipermeable membrane. This fluid path is perfused with a balanced salt solution that equilibrates with interstitial fluid from the brain. Therefore, the fluid returned from that fluid path contains substances from the brain in proportion to their local concentration, their specific membrane permeability, and the perfusate flow rate. Since the latter two do not change, the concentration of substances of interest can be followed over time. In the research context, this technique has been used to study topics as diverse as the role of excitotoxicity (175) or the proteomics of brain ischemia in stroke (176). The monitoring application closest to clinical utility, however, sets its sights considerably lower. It aims to determine the state of aerobic glucose utilization by following the ratio of metabolic intermediary products such as the pyruvate-to-lactate ratio. Ratiometric determinations of chemically similar molecules obviate the need to calibrate the probe based on the permeability of the substance(s) of interest. A decrease in the pyruvate-to-lactate ratio indicates an increase in anaerobic metabolism and/or mitochondrial dysfunction consistent with ischemia (173).
Summary
Technologic advances in neurointensive care medicine have allowed successful treatment of severely injured patients. Early detection of the magnitude of the injury, damage control of coexisting diseases, prevention of secondary injury, and, ultimately, pharmacologic or surgical correction of the neurodisorders are all primary objectives of the focused neurointensive care team. Effective neuromonitoring techniques are fundamental tools to achieve these goals. As the field of neurocritical care continues to emerge as a subspecialty dedicated to the treatment of critically ill patients with neurologic diseases, the neuromonitoring level of sophistication will increase in parallel, and so will our ability to monitor cerebral physiology and pathophysiology in real time.
References
1. Gilman S. Imaging the brain. First of two parts. N Engl J Med. 1998;338:812–820.
2. Lou HC, Edvinsson L, MacKenzie ET. The concept of coupling blood flow to brain function: revision required? Ann Neurol. 1987;22:289–297.
3. Derdeyn CP, Videen TO, Yundt KD, et al. Variability of cerebral blood volume and oxygen extraction: stages of cerebral haemodynamic impairment revisited. Brain. 2002;125:595–607.
4. Kety SS, King BD, Horvath SM, et al. The effects of an acute reduction in blood pressure by means of differential spinal sympathetic block on the cerebral circulation of hypertensive patients. J Clin Invest. 1950;29:402–407.
5. Boysen G. Cerebral hemodynamics in carotid surgery. Acta Neurol Scand Suppl. 1973;52:3–86.
6. Derdeyn CP, Yundt KD, Videen TO, et al. Increased oxygen extraction fraction is associated with prior ischemic events in patients with carotid occlusion. Stroke. 1998;29:754–758.
7. Rapela CE, Green HD. Autoregulation of canine cerebral blood flow. Circ Res. 1964;15(Suppl):205–212.
8. Buchanan JE, Phillis JW. The role of nitric oxide in the regulation of cerebral blood flow. Brain Res. 1993;610:248–255.
9. Petersen SE, Fox PT, Snyder AZ, et al. Activation of extrastriate and frontal cortical areas by visual words and word-like stimuli. Science. 1990;249:1041–1044.
10. Bouma GJ, Muizelaar JP, Stringer WA, et al. Ultra-early evaluation of regional cerebral blood flow in severely head-injured patients using xenon-enhanced computerized tomography. J Neurosurg. 1992;77:360–368.
11. Lee JH, Martin NA, Alsina G, et al. Hemodynamically significant cerebral vasospasm and outcome after head injury: a prospective study. J Neurosurg. 1997;87:221–233.
12. Muizelaar JP, Marmarou A, Ward JD, et al. Adverse effects of prolonged hyperventilation in patients with severe head injury: a randomized clinical trial. J Neurosurg. 1991;75:731–739.
13. Michenfelder JD, Milde JH. The relationship among canine brain temperature, metabolism, and function during hypothermia. Anesthesiology. 1991;75:130–136.
14. Walter B, Bauer R, Kuhnen G, et al. Coupling of cerebral blood flow and oxygen metabolism in infant pigs during selective brain hypothermia. J Cereb Blood Flow Metab. 2000;20:1215–1224.
15. Stullken EH Jr, Milde JH, Michenfelder JD, et al. The nonlinear responses of cerebral metabolism to low concentrations of halothane, enflurane, isoflurane, and thiopental. Anesthesiology. 1977;46:28–34.
16. Alkire MT, Haier RJ, Barker SJ, et al. Cerebral metabolism during propofol anesthesia in humans studied with positron emission tomography. Anesthesiology. 1995;82:393–403; discussion 27A.
17. Michenfelder J. Anesthesia and the Brain. New York: Churchill Livingstone; 1988.
18. Milde LN, Milde JH, Michenfelder JD. Cerebral functional, metabolic, and hemodynamic effects of etomidate in dogs. Anesthesiology. 1985;63:371–377.
19. Edelman GJ, Hoffman WE, Charbel FT. Cerebral hypoxia after etomidate administration and temporary cerebral artery occlusion. Anesth Analg. 1997;85:821–825.
20. Matta BF, Lam AM, Strebel S, et al. Cerebral pressure autoregulation and carbon dioxide reactivity during propofol-induced EEG suppression. Br J Anaesth. 1995;74:159–163.
21. Doyle PW, Matta BF. Burst suppression or isoelectric encephalogram for cerebral protection: evidence from metabolic suppression studies. Br J Anaesth. 1999;83:580–584.
22. Ederberg S, Westerlind A, Houltz E, et al. The effects of propofol on cerebral blood flow velocity and cerebral oxygen extraction during cardiopulmonary bypass. Anesth Analg. 1998;86:1201–1206.
23. Nandate K, Vuylsteke A, Ratsep I, et al. Effects of isoflurane, sevoflurane and propofol anaesthesia on jugular venous oxygen saturation in patients undergoing coronary artery bypass surgery. Br J Anaesth. 2000;84:631–633.
24. Johnston AJ, Steiner LA, Chatfield DA, et al. Effects of propofol on cerebral oxygenation and metabolism after head injury. Br J Anaesth. 2003;91:781–786.
25. Heath KJ, Gupta S, Matta BF. The effects of sevoflurane on cerebral hemodynamics during propofol anesthesia. Anesth Analg. 1997;85:1284–1287.
26. Citerio G, Cormio M. Sedation in neurointensive care: advances in understanding and practice. Curr Opin Crit Care. 2003;9:120–126.
27. Rhoney DH, Parker D Jr. Use of sedative and analgesic agents in neurotrauma patients: effects on cerebral physiology. Neurol Res. 2001;23:237–259.
28. Prielipp RC, Wall MH, Tobin JR, et al. Dexmedetomidine-induced sedation in volunteers decreases regional and global cerebral blood flow. Anesth Analg. 2002;95:1052–1059.
29. Grille P, Biestro A, Farina G, et al. [Effects of dexmedetomidine on intracranial hemodynamics in severe head injured patients.] Neurocirugia (Astur). 2005;16:411–418.
30. Kety SS, Schmidt CF. The effects of altered arterial tensions of carbon dioxide and oxygen on cerebral blood flow and cerebral oxygen consumption of normal young men. J Clin Invest. 1948;27:484–492.
31. Reivich M. Arterial pCO2 and cerebral hemodynamics. Am J Physiol. 1964;206:25–35.
32. Brian JE Jr. Carbon dioxide and the cerebral circulation. Anesthesiology. 1998;88:1365–1386.
33. Harper AM. Autoregulation of cerebral blood flow: influence of the arterial blood pressure on the blood flow through the cerebral cortex. J Neurol Neurosurg Psychiatry. 1966;29:398–403.
34. Paulson OB, Strandgaard S, Edvinsson L. Cerebral autoregulation. Cerebrovasc Brain Metab Rev. 1990;2:161–192.
35. Eng C, Lam AM, Mayberg TS, et al. The influence of propofol with and without nitrous oxide on cerebral blood flow velocity and CO2 reactivity in humans. Anesthesiology. 1992;77:872–879.
36. Nordstrom CH, Messeter K, Sundbarg G, et al. Cerebral blood flow, vasoreactivity, and oxygen consumption during barbiturate therapy in severe traumatic brain lesions. J Neurosurg. 1988;68:424–431.
37. Berre J, Moraine JJ, Melot C. Cerebral CO2 vasoreactivity evaluation with and without changes in intrathoracic pressure in comatose patients. J Neurosurg Anesthesiol. 1998;10:70–79.
38. Luce JM, Huseby JS, Kirk W, et al. A Starling resistor regulates cerebral venous outflow in dogs. J Appl Physiol. 1982;53:1496–1503.
39. Bouma GJ, Muizelaar JP. Cerebral blood flow, cerebral blood volume, and cerebrovascular reactivity after severe head injury. J Neurotrauma. 1992;9(Suppl 1):S333–348.
40. Langfitt TW, Weinstein JD, Kassell NF. Cerebral vasomotor paralysis produced by intracranial hypertension. Neurology. 1965;15:622–641.
41. Thiel A, Zickmann B, Stertmann WA, et al. Cerebrovascular carbon dioxide reactivity in carotid artery disease. Relation to intraoperative cerebral monitoring results in 100 carotid endarterectomies. Anesthesiology. 1995;82:655–661.
42. Tranmer BI, Keller TS, Kindt GW, et al. Loss of cerebral regulation during cardiac output variations in focal cerebral ischemia. J Neurosurg. 1992;77:253–259.
43. Todd MM, Weeks JB, Warner DS. The influence of intravascular volume expansion on cerebral blood flow and blood volume in normal rats. Anesthesiology. 1993;78:945–953.
44. Todd MM, Weeks JB, Warner DS. Cerebral blood flow, blood volume, and brain tissue hematocrit during isovolemic hemodilution with hetastarch in rats. Am J Physiol. 1992;263:H75–82.
45. Todd MM, Wu B, Maktabi M, et al. Cerebral blood flow and oxygen delivery during hypoxemia and hemodilution: role of arterial oxygen content. Am J Physiol. 1994;267:H2025–2031.
46. Teasdale G, Jennett B. Assessment of coma and impaired consciousness. A practical scale. Lancet. 1974;2:81–84.
47. Rowley G, Fielding K. Reliability and accuracy of the Glasgow Coma Scale with experienced and inexperienced users. Lancet. 1991;337:535–538.
48. Knaus WA, Draper EA, Wagner DP, et al. APACHE II: a severity of disease classification system. Crit Care Med. 1985;13:818–829.
49. Teasdale GM, Drake CG, Hunt W, et al. A universal subarachnoid hemorrhage scale: report of a committee of the World Federation of Neurosurgical Societies. J Neurol Neurosurg Psychiatry. 1988;51:1457.
50. Gennarelli TA, Champion HR, Copes WS, et al. Comparison of mortality, morbidity, and severity of 59,713 head injured patients with 114,447 patients with extracranial injuries. J Trauma. 1994;37:962–968.
51. Chiang VL, Claus EB, Awad IA. Toward more rational prediction of outcome in patients with high-grade subarachnoid hemorrhage. Neurosurgery. 2000;46:28–35; discussion 35–36.
52. Tseng JH, Tseng MY: Brain abscess in 142 patients: factors influencing outcome and mortality. Surg Neurol. 2006;65:557–562; discussion 562.
53. Edgren E, Hedstrand U, Kelsey S, et al. Assessment of neurological prognosis in comatose survivors of cardiac arrest. BRCT I Study Group. Lancet. 1994;343:1055–1059.
54. Niskanen M, Kari A, Nikki P, et al. Acute physiology and chronic health evaluation (APACHE II) and Glasgow coma scores as predictors of outcome from intensive care after cardiac arrest. Crit Care Med. 1991;19:1465–1473.
55. Eidelman LA, Putterman D, Putterman C, et al. The spectrum of septic encephalopathy. Definitions, etiologies, and mortalities. JAMA. 1996;275:470–473.
56. Kuhls DA, Malone DL, McCarter RJ, et al. Predictors of mortality in adult trauma patients: the physiologic trauma score is equivalent to the Trauma and Injury Severity Score. J Am Coll Surg. 2002;194:695–704.
57. Massagli TL, Michaud LJ, Rivara FP. Association between injury indices and outcome after severe traumatic brain injury in children. Arch Phys Med Rehabil. 1996;77:125–132.
58. Wijdicks EF. Brain Death. Philadelphia: Lippincott Williams & Wilkins; 2001.
59. Santamaria J, Orteu N, Iranzo A, et al. Eye opening in brain death. J Neurol. 1999;246:720–722.
60. Goudreau JL, Wijdicks EF, Emery SF. Complications during apnea testing in the determination of brain death: predisposing factors. Neurology. 2000;55:1045–1048.
61. Saposnik G, Bueri JA, Maurino J, et al. Spontaneous and reflex movements in brain death. Neurology. 2000;54:221–223.
62. Facco E, Munari M, Baratto F, et al. Multimodality evoked potentials (auditory, somatosensory and motor) in coma. Neurophysiol Clin. 1993;23:237–258.
63. Fisher B, Peterson B, Hicks G. Use of brainstem auditory-evoked response testing to assess neurologic outcome following near drowning in children. Crit Care Med. 1992;20:578–585.
64. Pohlmann-Eden B, Dingethal K, Bender HJ, et al. How reliable is the predictive value of SEP (somatosensory evoked potentials) patterns in severe brain damage with special regard to the bilateral loss of cortical responses? Intensive Care Med. 1997;23:301–308.
65. Ruiz-Lopez MJ, Martinez de Azagra A, Serrano A, et al. Brain death and evoked potentials in pediatric patients. Crit Care Med. 1999;27:412–416.
66. Crippen D. Role of bedside electroencephalography in the adult intensive care unit during therapeutic neuromuscular blockade. Crit Care. 1997;1:15–24.
67. Freye E. Cerebral monitoring in the operating room and the intensive care unit—an introductory for the clinician and a guide for the novice wanting to open a window to the brain. Part II: sensory-evoked potentials (SSEP, AEP, VEP). J Clin Monit Comput. 2005;19:77–168.
68. Hirsch LJ. Continuous EEG monitoring in the intensive care unit: an overview. J Clin Neurophysiol. 2004;21:332–340.
69. Hall R, Murdoch J. Brain protection: physiological and pharmacological considerations. Part II: The pharmacology of brain protection. Can J Anaesth. 1990;37:762–777.
70. Steen PA, Newberg L, Milde JH, et al. Hypothermia and barbiturates: individual and combined effects on canine cerebral oxygen consumption. Anesthesiology. 1983;58:527–532.
71. Drummond JC, Todd MM, U HS: The effect of high dose sodium thiopental on brain stem auditory and median nerve somatosensory evoked responses in humans. Anesthesiology. 1985;63:249–254.
72. Sutton LN, Frewen T, Marsh R, et al. The effects of deep barbiturate coma on multimodality evoked potentials. J Neurosurg. 1982;57:178–185.
73. Rothstein TL. Recovery from near death following cerebral anoxia: A case report demonstrating superiority of median somatosensory evoked potentials over EEG in predicting a favorable outcome after cardiopulmonary resuscitation. Resuscitation. 2004;60:335–341.
74. Kull LL, Emerson RG. Continuous EEG monitoring in the intensive care unit: technical and staffing considerations. J Clin Neurophysiol. 2005;22:107–118.
75. Ronne-Engstrom E, Winkler T. Continuous EEG monitoring in patients with traumatic brain injury reveals a high incidence of epileptiform activity. Acta Neurol Scand. 2006;114:47–53.
76. Wartenberg KE, Mayer SA. Multimodal brain monitoring in the neurological intensive care unit: where does continuous EEG fit in? J Clin Neurophysiol. 2005;22:124–127.
77. Shi L, Agarwal R, Swamy MN. Model-based seizure detection method using statistically optimal filters. Conf Proc IEEE Eng Med Biol Soc. 2004;1:45–48.
78. Subasi A. Selection of optimal AR spectral estimation method for EEG signals using Cramer-Rao bound. Comput Biol Med. 2007;37:183–194.
79. Abou Khaled KJ, Hirsch LJ. Advances in the management of seizures and status epilepticus in critically ill patients. Crit Care Clin. 2006;22:637–659; abstract viii.
80. Deogaonkar A, Gupta R, DeGeorgia M, et al. Bispectral Index monitoring correlates with sedation scales in brain-injured patients. Crit Care Med. 2004;32:2403–2406.
81. Fabregas N, Gambus PL, Valero R, et al. Can bispectral index monitoring predict recovery of consciousness in patients with severe brain injury? Anesthesiology. 2004;101:43–51.
82. Schnakers C, Majerus S, Laureys S. Bispectral analysis of electroencephalogram signals during recovery from coma: preliminary findings. Neuropsychol Rehabil. 2005;15:381–388.
83. Schneider G, Heglmeier S, Schneider J, et al. Patient State Index (PSI) measures depth of sedation in intensive care patients. Intensive Care Med. 2004;30:213–216.
84. Grindstaff RJ, Tobias JD. Applications of bispectral index monitoring in the pediatric intensive care unit. J Intensive Care Med. 2004;19:111–116.
85. Riker RR, Fraser GL, Wilkins ML. Comparing the bispectral index and suppression ratio with burst suppression of the electroencephalogram during pentobarbital infusions in adult intensive care patients. Pharmacotherapy. 2003;23:1087–1093.
86. Ozcan MS, Gravenstein D. The presence of working memory without explicit recall in a critically ill patient. Anesth Analg. 2004;98:469–470.
87. Rampil IJ. A primer for EEG signal processing in anesthesia. Anesthesiology. 1998;89:980–1002.
88. Ely EW, Truman B, Manzi DJ, et al. Consciousness monitoring in ventilated patients: bispectral EEG monitors arousal not delirium. Intensive Care Med. 2004;30:1537–1543.
89. Katoh T, Bito H, Sato S. Influence of age on hypnotic requirement, bispectral index, and 95% spectral edge frequency associated with sedation induced by sevoflurane. Anesthesiology. 2000;92:55–61.
90. Sleigh JW, Andrzejowski J, Steyn-Ross A, et al. The bispectral index: a measure of depth of sleep? Anesth Analg. 1999;88:659–661.
91. Lubke GH, Kerssens C, Phaf H, et al. Dependence of explicit and implicit memory on hypnotic state in trauma patients. Anesthesiology. 1999;90:670–680.
92. Vivien B, Di Maria S, Ouattara A, et al. Overestimation of bispectral index in sedated intensive care unit patients revealed by administration of muscle relaxant. Anesthesiology. 2003;99:9–17.
93. Gallagher JD. Pacer-induced artifact in the bispectral index during cardiac surgery. Anesthesiology. 1999;90:636.
94. Johansen JW. Update on bispectral index monitoring. Best Pract Res Clin Anaesthesiol. 2006;20:81–99.
95. Dunham CM, Ransom KJ, McAuley CE, et al. Severe brain injury ICU outcomes are associated with cranial-arterial pressure index and noninvasive bispectral index and transcranial oxygen saturation: a prospective, preliminary study. Crit Care. 2006;10:R159.
96. Banoub M, Tetzlaff JE, Schubert A. Pharmacologic and physiologic influences affecting sensory evoked potentials: implications for perioperative monitoring. Anesthesiology. 2003;99:716–737.
97. Goodwin SR, Friedman WA, Bellefleur M. Is it time to use evoked potentials to predict outcome in comatose children and adults? Crit Care Med. 1991;19:518–524.
98. Morgalla MH, Bauer J, Ritz R, et al. [Coma. The prognostic value of evoked potentials in patients after traumatic brain injury.] Anaesthesist. 2006;55:760–768.
99. Nuwer MR. Electroencephalograms and evoked potentials. Monitoring cerebral function in the neurosurgical intensive care unit. Neurosurg Clin N Am. 1994;5:647–659.
100. Goodwin SR, Toney KA, Mahla ME. Sensory evoked potentials accurately predict recovery from prolonged coma caused by strangulation. Crit Care Med. 1993;21:631–633.
101. Lew HL, Dikmen S, Slimp J, et al. Use of somatosensory-evoked potentials and cognitive event-related potentials in predicting outcomes of patients with severe traumatic brain injury. Am J Phys Med Rehabil. 2003;82:53–61; quiz 62–64, 80.
102. Lew HL, Poole JH, Castaneda A, et al. Prognostic value of evoked and event-related potentials in moderate to severe brain injury. J Head Trauma Rehabil. 2006;21:350–360.
103. Carter BG, Butt W. Review of the use of somatosensory evoked potentials in the prediction of outcome after severe brain injury. Crit Care Med. 2001;29:178–186.
104. Carter BG, Butt W. Are somatosensory evoked potentials the best predictor of outcome after severe brain injury? A systematic review. Intensive Care Med. 2005;31:765–775.
105. Fischer C, Luaute J. Evoked potentials for the prediction of vegetative state in the acute stage of coma. Neuropsychol Rehabil. 2005;15:372–380.
106. Chistyakov AV, Hafner H, Soustiel JF, et al. Dissociation of somatosensory and motor evoked potentials in non-comatose patients after head injury. Clin Neurophysiol. 1999;110:1080–1089.
107. Mazzini L, Pisano F, Zaccala M, et al. Somatosensory and motor evoked potentials at different stages of recovery from severe traumatic brain injury. Arch Phys Med Rehabil. 1999;80:33–39.
108. Moosavi SH, Ellaway PH, Catley M, et al. Corticospinal function in severe brain injury assessed using magnetic stimulation of the motor cortex in man. J Neurol Sci. 1999;164:179–186.
109. Zentner J, Ebner A. Prognostic value of somatosensory- and motor-evoked potentials in patients with a non-traumatic coma. Eur Arch Psychiatry Neurol Sci. 1988;237:184–187.
110. Dhand UK. Clinical approach to the weak patient in the intensive care unit. Respir Care. 2006;51:1024–1040; discussion 1040–1041.
111. Hemmerling TM, Le N. Brief review: neuromuscular monitoring: an update for the clinician. Can J Anaesth. 2007;54:58–72.
112. Heier T, Caldwell JE. Impact of hypothermia on the response to neuromuscular blocking drugs. Anesthesiology. 2006;104:1070–1080.
113. Langfitt TW. Increased intracranial pressure. Clin Neurosurg. 1969;16:43–71.
114. Lundberg N. Continuous recording and control of ventricular fluid pressure in neurosurgical practice. Acta Psychiatr Scand. 1960;36:1–193.
115. Martin NA, Doberstein C. Cerebral blood flow measurement in neurosurgical intensive care. Neurosurg Clin N Am. 1994;5:607–618.
116. Steiner LA, Andrews PJ. Monitoring the injured brain: ICP and CBF. Br J Anaesth. 2006;97:26–38.
117. Kety SS and Schmidt CF. The nitrous oxide method for the quantitative determination of cerebral blood flow in man: theory, procedure, and normal values. J Clin Invest. 1948;27:476–493.
118. Firlik AD, Rubin G, Yonas H, et al. Relation between cerebral blood flow and neurologic deficit resolution in acute ischemic stroke. Neurology. 1998;51:177–182.
119. White H, Venkatesh B. Applications of transcranial Doppler in the ICU: a review. Intensive Care Med. 2006;32:981–994.
120. Ringelstein EB, Biniek R, Weiller C, et al. Type and extent of hemispheric brain infarctions and clinical outcome in early and delayed middle cerebral artery recanalization. Neurology. 1992;42:289–298.
121. Manno EM. Transcranial Doppler ultrasonography in the neurocritical care unit. Crit Care Clin. 1997;13:79–104.
122. Halsey JH, McDowell HA, Gelmon S, et al. Blood velocity in the middle cerebral artery and regional cerebral blood flow during carotid endarterectomy. Stroke. 1989;20:53–58.
123. Nuttall GA, Cook DJ, Fulgham JR, et al. The relationship between cerebral blood flow and transcranial Doppler blood flow velocity during hypothermic cardiopulmonary bypass in adults. Anesth Analg. 1996;82:1146–1151.
124. Weyland A, Stephan H, Kazmaier S, et al. Flow velocity measurements as an index of cerebral blood flow. Validity of transcranial Doppler sonographic monitoring during cardiac surgery. Anesthesiology. 1994;81:1401–1410.
125. Sloan MA, Haley EC Jr, Kassell NF, et al. Sensitivity and specificity of transcranial Doppler ultrasonography in the diagnosis of vasospasm following subarachnoid hemorrhage. Neurology. 1989;39:1514–1518.
126. Klingelhofer J, Sander D. Doppler CO2 test as an indicator of cerebral vasoreactivity and prognosis in severe intracranial hemorrhages. Stroke. 1992;23:962–966.
127. Martin NA, Patwardhan RV, Alexander MJ, et al. Characterization of cerebral hemodynamic phases following severe head trauma: hypoperfusion, hyperemia, and vasospasm. J Neurosurg. 1997;87:9–19.
128. Sander D, Klingelhofer J. Cerebral vasospasm following post-traumatic subarachnoid hemorrhage evaluated by transcranial Doppler ultrasonography. J Neurol Sci. 1993;119:1–7.
129. Grosset DG, Straiton J, du Trevou M, et al. Prediction of symptomatic vasospasm after subarachnoid hemorrhage by rapidly increasing transcranial Doppler velocity and cerebral blood flow changes. Stroke. 1992;23:674–679.
130. Lindegaard KF, Nornes H, Bakke SJ, et al. Cerebral vasospasm after subarachnoid haemorrhage investigated by means of transcranial Doppler ultrasound. Acta Neurochir Suppl (Wien). 1988;42:81–84.
131. Newell DW, Winn HR. Transcranial Doppler in cerebral vasospasm. Neurosurg Clin N Am. 1990;1:319–328.
132. Sekhar LN, Wechsler LR, Yonas H, et al. Value of transcranial Doppler examination in the diagnosis of cerebral vasospasm after subarachnoid hemorrhage. Neurosurgery. 1988;22:813–821.
133. Sloan MA, Burch CM, Wozniak MA, et al. Transcranial Doppler detection of vertebrobasilar vasospasm following subarachnoid hemorrhage. Stroke. 1994;25:2187–2197.
134. Wozniak MA, Sloan MA, Rothman MI, et al. Detection of vasospasm by transcranial Doppler sonography. The challenges of the anterior and posterior cerebral arteries. J Neuroimaging. 1996;6:87–93.
135. Klingelhofer J, Dander D, Holzgraefe M, et al. Cerebral vasospasm evaluated by transcranial Doppler ultrasonography at different intracranial pressures. J Neurosurg. 1991;75:752–758.
136. Giller CA, Purdy P, Giller A, et al. Elevated transcranial Doppler ultrasound velocities following therapeutic arterial dilation. Stroke. 1995;26:123–127.
137. Mizuno M, Nakajima S, Sampei T, et al. Serial transcranial Doppler flow velocity and cerebral blood flow measurements for evaluation of cerebral vasospasm after subarachnoid hemorrhage. Neurol Med Chir (Tokyo). 1994;34:164–171.
138. Sloan MA, Alexandrov AV, Tegeler CH, et al. Assessment: transcranial Doppler ultrasonography: report of the Therapeutics and Technology Assessment Subcommittee of the American Academy of Neurology. Neurology. 2004;62:1468–1481.
139. Lysakowski C, Walder B, Costanza MC, et al. Transcranial Doppler versus angiography in patients with vasospasm due to a ruptured cerebral aneurysm: a systematic review. Stroke. 2001;32:2292–2298.
140. Hassler W, Steinmetz H, Gawlowski J. Transcranial Doppler ultrasonography in raised intracranial pressure and in intracranial circulatory arrest. J Neurosurg. 1988;68:745–751.
141. Goraj B, Rifkinson-Mann S, Leslie DR, et al. Correlation of intracranial pressure and transcranial Doppler resistive index after head trauma. AJNR Am J Neuroradiol. 1994;15:1333–1339.
142. Newell DW, Grady MS, Sirotta P, et al. Evaluation of brain death using transcranial Doppler. Neurosurgery. 1989;24:509–513.
143. Petty GW, Mohr JP, Pedley TA, et al. The role of transcranial Doppler in confirming brain death: sensitivity, specificity, and suggestions for performance and interpretation. Neurology. 1990;40:300–303.
144. Ducrocq X, Hassler W, Moritake K, et al. Consensus opinion on diagnosis of cerebral circulatory arrest using Doppler-sonography: task force group on cerebral death of the Neurosonology Research Group of the World Federation of Neurology. J Neurol Sci. 1998;159:145–150.
145. Hadani M, Bruk B, Ram Z, et al. Application of transcranial Doppler ultrasonography for the diagnosis of brain death. Intensive Care Med. 1999;25:822–828.
146. The Brain Trauma Foundation. The American Association of Neurological Surgeons. The Joint Section on Neurotrauma and Critical Care. Guidelines for cerebral perfusion pressure. J Neurotrauma. 2000;17:507–511.
147. Stocchetti N, Paparella A, Bridelli F, et al. Cerebral venous oxygen saturation studied with bilateral samples in the internal jugular veins. Neurosurgery. 1994;34:38–43; discussion 43–44.
148. Hatiboglu MT, Anil A. Structural variations in the jugular foramen of the human skull. J Anat. 1992;180(Pt 1):191–196.
149. Cruz J. The first decade of continuous monitoring of jugular bulb oxyhemoglobin saturation: management strategies and clinical outcome. Crit Care Med. 1998;26:344–351.
150. Gopinath SP, Valadka AB, Uzura M, et al. Comparison of jugular venous oxygen saturation and brain tissue Po2 as monitors of cerebral ischemia after head injury. Crit Care Med. 1999;27:2337–2345.
151. Diaz-Reganon G, Minambres E, Holanda M, et al. Usefulness of venous oxygen saturation in the jugular bulb for the diagnosis of brain death: report of 118 patients. Intensive Care Med. 2002;28:1724–1728.
152. Shenkin GA, Harmel MH, Kety SS. Dynamic anatomy of the cerebral circulation. Arch Neurol Psych. 1948;60:12.
153. Matta BF, Lam AM. The rate of blood withdrawal affects the accuracy of jugular venous bulb. Oxygen saturation measurements. Anesthesiology. 1997;86:806–808.
154. Imberti R, Bellinzona G, Langer M. Cerebral tissue PO2 and SjvO2 changes during moderate hyperventilation in patients with severe traumatic brain injury. J Neurosurg. 2002;96:97–102.
155. Coles JP, Fryer TD, Coleman MR, et al. Hyperventilation following head injury: effect on ischemic burden and cerebral oxidative metabolism. Crit Care Med. 2007;35:568–578.
156. Jobsis FF. Noninvasive, infrared monitoring of cerebral and myocardial oxygen sufficiency and circulatory parameters. Science. 1977;198:1264–1267.
157. Kato T, Tokumaru A, O'Uchi T, et al. Assessment of brain death in children by means of P-31 MR spectroscopy: preliminary note. Work in progress. Radiology. 1991;179:95–99.
158. McCormick PW, Stewart M, Goetting MG, et al. Regional cerebrovascular oxygen saturation measured by optical spectroscopy in humans. Stroke. 1991;22:596–602.
159. Kato T. Principle and technique of NIRS-Imaging for human brain FORCE: fast-oxygen response in capillary event. Int Congress Series. 2004;1270:85–90.
160. Zauner A, Muizelaar JP. Measuring cerebral blood flow and metabolism. In: Reilly P, Bullock R, eds. Head Injury. London: Chapman & Hall; 1977:219–227.
161. Vernieri F, Tibuzzi F, Pasqualetti P, et al. Transcranial Doppler and near-infrared spectroscopy can evaluate the hemodynamic effect of carotid artery occlusion. Stroke. 2004;35:64–70.
162. Villringer A, Steinbrink J, Obrig H. Editorial comment–cerebral near-infrared spectroscopy: how far away from a routine diagnostic tool? Stroke. 2004;35:70–72.
163. Valadka AB, Furuya Y, Hlatky R, et al. Global and regional techniques for monitoring cerebral oxidative metabolism after severe traumatic brain injury. Neurosurg Focus. 2000;9:e3.
164. Manley GT, Hemphill JC, Morabito D, et al. Cerebral oxygenation during hemorrhagic shock: perils of hyperventilation and the therapeutic potential of hypoventilation. J Trauma. 2000;48:1025–1032; discussion 1032–1033.
165. Menzel M, Doppenberg EM, Zauner A, et al. Cerebral oxygenation in patients after severe head injury: monitoring and effects of arterial hyperoxia on cerebral blood flow, metabolism and intracranial pressure. J Neurosurg Anesthesiol. 1999;11:240–251.
166. Guidelines for the management of severe traumatic brain injury. X. Brain oxygen monitoring and thresholds. J Neurotrauma. 2007;24(Suppl 1):S65–70.
167. Bardt TF, Unterberg AW, Hartl R, et al. Monitoring of brain tissue PO2 in traumatic brain injury: effect of cerebral hypoxia on outcome. Acta Neurochir Suppl. 1998;71:153–156.
168. Valadka AB, Gopinath SP, Contant CF, et al. Relationship of brain tissue PO2 to outcome after severe head injury. Crit Care Med. 1998;26:1576–1581.
169. van den Brink WA, van Santbrink H, Steyerberg EW, et al. Brain oxygen tension in severe head injury. Neurosurgery. 2000;46:868–876; discussion 876–878.
170. Giri BK, Krishnappa IK, Bryan RM Jr, et al. Regional cerebral blood flow after cortical impact injury complicated by a secondary insult in rats. Stroke. 2000;31:961–967.
171. Stiefel MF, Spiotta A, Gracias VH, et al. Reduced mortality rate in patients with severe traumatic brain injury treated with brain tissue oxygen monitoring. J Neurosurg. 2005;103:805–811.
172. van Santbrink H, Maas AI, Avezaat CJ. Continuous monitoring of partial pressure of brain tissue oxygen in patients with severe head injury. Neurosurgery. 1996;38:21–31.
173. Hillered L, Vespa PM, Hovda DA. Translational neurochemical research in acute human brain injury: the current status and potential future for cerebral microdialysis. J Neurotrauma. 2005;22:3–41.
174. Hillered L, Persson L, Nilsson P, et al. Continuous monitoring of cerebral metabolism in traumatic brain injury: a focus on cerebral microdialysis. Curr Opin Crit Care. 2006;12:112–118.
175. Zauner A, Bullock R. The role of excitatory amino acids in severe brain trauma: opportunities for therapy: a review. J Neurotrauma. 1995;12:547–554.
176. Maurer MH, Berger C, Wolf M, et al. The proteome of human brain microdialysate. Proteome Sci. 2003;1:7.