John J. Marini
David J. Dries
John F. Perry, Jr.
Many aspects of cardiopulmonary life support are rooted in understanding the anatomy and physiology of the respiratory system. The purpose of this chapter is to review those aspects of normal structure and function of the lungs and chest wall that impact most directly on daily practice. Intentionally, we have only dipped tentatively into the physiology of pathologic conditions, as to attempt to do so would clearly exceed our page allocation and scope of this assignment. Nonetheless, we hope that this overview serves as a starting point by underlining the principles of undeniable clinical relevance.
Anatomic Considerations
Tracheobronchial Tree
A useful approach to understanding the tracheobronchial tree (Fig. 44.1) is that of Weibel (1), who numbered successive generations of air passages from the trachea to the alveolar sacs. In some sectors, there may be as few as eight generations, while in others, the air pathway may divide 23 times from the trachea (generation 0) to the alveoli (generation 23). It may be assumed that the number of passages in each generation is double that in the previous generation, and the number of passages in each generation is 2 raised to the power of the generation number.
The trachea has a mean diameter of 1.8 cm and a length of 11 cm. It is supported by U-shaped cartilage, which is joined posteriorly by smooth muscle bands. Despite the presence of cartilage, the posterior wall is deformable so that the trachea can be occluded by a pressure on the order of 50 to 70 cm H2O. Within the chest, the trachea can be compressed by elevated intrathoracic pressure, as may occur during cough when the decreased diameter increases the efficiency of secretion removal. The tracheal mucosa is a columnar ciliated epithelium containing mucus-secreting goblet cells. Cilia beat in a coordinated manner, creating an upward stream of mucus and foreign material. Anesthetics render the cilial beat ineffective. Cilial movement of mucus and respiratory debris is also compromised by drying, which occurs in patients breathing dry gas through a tracheostomy.
The trachea bifurcates asymmetrically, with the right bronchus wider and better aligned with the long axis of the trachea. It is more likely, therefore, to receive aspirated material. Main, lobar, and segmental bronchi have firm cartilaginous support, which is horseshoe shaped. Cartilage is arranged in irregular plates more distally. Where cartilage is irregular and discontinuous, bronchial smooth muscle in helical bands forms a network (1,2). The bronchial epithelium is similar to that in the trachea, although the height of cells diminishes in more peripheral passages until it becomes cuboidal in bronchioles. Bronchi down to generation 4 are sufficiently regular to be individually named. By the third generation, total cross-sectional area of the respiratory tract is still minimal.
When bronchi in generations 1 through 4 are subjected to large changes in intrathoracic pressure, collapse occurs when intrathoracic pressure exceeds intraluminal pressure by about 50 cm H2O. Collapse occurs in larger bronchi during a forced expiration since the greater part of the alveolar-to-mouth pressure difference is taken up in the segmental bronchi. Intraluminal pressure, particularly within larger bronchi, is well below intrathoracic pressure, particularly with emphysema. Collapse of larger bronchi limits peak expiratory flow in the normal subject (3).
Small bronchi extend through about seven generations, with diameter progressively falling from 3.5 to 1 mm. Since their number approximately doubles with each generation, the total cross-sectional area increases rapidly with each generation to a value at generation 11, which is about seven times the total cross-sectional area at the level of the lobar bronchi. Down to the level of true bronchi, air passages lie in close proximity to branches of the pulmonary artery in a sheath also containing pulmonary lymphatics. Distension of these lymphatics gives rise to classic cuffing seen with pulmonary edema. Small bronchi are not directly attached to pulmonary parenchyma and are not subject to direct traction. They rely on cartilage within their walls for patency and on transmural pressure, which is normally a positive gradient from the lumen to the intrathoracic space. Intraluminal pressure in small bronchi rapidly rises to more than 80% of alveolar pressure during forced expiration.
At the 11th generation, where diameter usually approximates 1 mm, cartilage disappears from the wall of airways, and structural rigidity ceases to be the factor maintaining patency. Beyond this level, air passages are embedded in pulmonary parenchyma, and elastic recoil of the lung holds the air passages open. The caliber of the airways below the 11th generation is strongly influenced by lung volume, as forces holding the lumen open are greater at higher lung volumes. Airway closure may occur at reduced lung volumes.
In succeeding generations, the number of bronchioles increases more rapidly than caliber diminishes. The total cross-sectional area increases until, in terminal bronchioles, it is about 30 times the area at the level of the large bronchi. The flow resistance of the smaller air passages (<2 mm) approximates one tenth of the total. Contraction of helical muscle bands wrinkles the cuboidal epithelium into longitudinal folds, which increases flow resistance and, in some cases, results in airway obstruction. Down to the terminal bronchiole level, air passages derive nutrition from bronchial circulation, and are influenced by systemic arterial blood gas levels. Beyond this point, air passages rely on pulmonary circulation for nutrition (Table 44.1).
|
|
|
Figure 44.1. Named branches of the tracheobronchial tree, viewed from the front. (Reused with permission from Nunn JF. Applied Respiratory Physiology. 3rd ed. London: Butterworths; 1987.) |
From the trachea to the smallest bronchioles, the functions of air passages are conduction and humidification. Beyond this point, there is a transition from conduction to gas exchange. In the three generations of respiratory bronchioles, there is a gradual increase in the number of alveoli in the walls. The epithelium is cuboidal between the mouths of the mural alveoli in the earlier generations of respiratory bronchioles but becomes progressively flatter until it is entirely alveolar epithelium in the alveolar ducts. Like the conductive bronchioles, the respiratory bronchioles are embedded in the pulmonary parenchyma. The respiratory bronchioles have well-marked muscle layers, with bands looping over the opening alveolar ducts and the openings of mural alveoli. The total cross-sectional area at this level is in the order of hundreds of square centimeters.
The primary lobular terminal respiratory unit is the likely equivalent of the alveolus when considered from the standpoint of function. The primary lobule is defined as the zone supplied by a first-order respiratory lobule. There are approximately 130,000 primary lobules with a diameter of about 3.5 mm containing approximately 2,000 alveoli each.
Alveolar ducts (generations 20–22) arise from terminal respiratory bronchioles and differ from terminal respiratory bronchioles by having no walls other than the mouths of mural alveoli (approximately 20 in number). Approximately half of alveoli arise from ducts. The last generation of air passages differs from the alveolar ducts solely in the fact that they are blind pouches. Approximately 17 alveoli arise from these alveolar sacs and account for half of the total number of alveoli.
Alveoli
The total number of alveoli is approximately 300 million but ranges from 200 to 600 million, corresponding to the height of the subject. The size of the alveoli is proportional to the lung volume. The alveoli are larger in the upper part of the lung, except at maximal inflation when the vertical size gradient disappears. The reduction in the size of alveoli and the corresponding reduction in the caliber of smaller airways in the dependent parts of the lung comprise the most important implications in gas exchange. At functional residual capacity, the mean diameter is 0.2 mm (4).
Alveolar walls, which separate adjacent alveoli, consist of two layers of alveolar epithelium on a separate basement membrane enclosing the interstitial space. These layers contain pulmonary capillaries, elastin and collagen, nerve endings, and occasional neutrophils and macrophages. On one side of the interstitium, the capillary endothelium and alveolar epithelium are closely opposed, and the total thickness from gas to blood is usually less than 0.4 µm. This is the active side of the capillary, and gas exchange is more efficient at this site. The opposite side of the capillary is usually more than 1 to 2 µm thick and contains collagen and elastin fibers in an expanded tissue space. Herein is situated the connective tissue framework, which maintains pulmonary geometry. Alveolar septa are generally flat due to the tension generated by elastic fibers and surface tension at the air–fluid interface. The surface tension of the alveolar lining fluid is modified in the presence of surfactant. Septa are perforated by fenestrations known as pores of Kohn. These pores provide collateral ventilation, which can be demonstrated between the air spaces supplied by large bronchi (2).
|
|
|
Table 44.1 |
Alveolar Cellular Morphology
The alveoli are divided by septa lined by flattened, continuous epithelial cells covering the thin interstitium (5). This epithelium, in humans, consists primarily of two distinct cells—type I and type II—with occasional neuroendocrine cells. In addition, although not frequently a part of the alveolar wall, the alveolar macrophage is, in fact, normally present on the alveolar epithelial surface.
Type I Epithelium
The type I alveolar cell (squamous lining cell), although comprising only 8% of parenchymal lung cells and inconspicuous by light microscopy, covers approximately 95% of the alveolar surface area, and has a total volume twice that of the histologically more prominent type II cell. Its nucleus is small and flattened. The nucleus is covered by a thin rim of cytoplasm containing few organelles. The remainder of the cytoplasm is aligned in broad sheets measuring 0.3 to 0.4 µm in thickness and extending in all directions for 50 µm or more over the alveolar surface. Sheets of adjacent type I cells interdigitate, and individual plates may reach into neighboring alveoli by winding the septal tip or by extending through the alveolar pores. Localized gap junctions have been identified between adjacent type I cells and between type I and type II alveolar cells frequently in association with an occluding junction (6).
The cytoplasm of type I epithelium contains few organelles but numerous pinocytotic vesicles, which are thought to transport fluid or proteins across the air–blood barrier. Type I cells have shown the ability to take up intra-alveolar particulate material. This particle clearance may be small in comparison with alveolar macrophages and the mucociliary apparatus. However, movement of materials across type I epithelium may allow particles to be deposited in regional lymph nodes.
Type II Epithelium
The type II epithelial cell (granular pneumocyte) is cuboidal in shape and protrudes into the alveolar lumen. Thus, it is easily identified on light microscopy. These cells may occur in groups of two or three. Type II epithelium is often located near corners where adjacent alveoli meet. The cytoplasm of type II epithelium is rich in organelles, including endoplasmic reticulum with ribosomes, Golgi complexes, mitochondria, and membrane-bound osmiophilic granules. There is evidence from ultrastructural, biochemical tissue culture and immunologic studies that type II cells and their osmophilic granules supply alveolar surfactant. These granules appear to function in a storage capacity, although some aspects of surfactant synthesis may also occur. Release of granule contents into the alveolar lumen occurs by exocytosis.
A second major function of type II epithelium is repopulation of normal and damaged alveolar epithelium. The type I cell is thought to be incapable of replication. On the other hand, the type II population is mitotically active and repopulates the alveolar surface. In addition, cytoplasmic simplicity and the large surface area of type I cells make them susceptible to damage from a variety of stimuli. In such circumstances, type II cells proliferate and temporarily repopulate alveolar walls, providing epithelial integrity. In time, they transform into type I cells. This sequence has been demonstrated with pulmonary injury from a variety of agents including oxygen, nitrous oxide, and other chemicals. Microvilli cover the surface of type II cells, suggesting that these cells may function in resorption of fluid or other materials from the alveolar air space.
Alveolar Macrophage
Pulmonary macrophages can be divided into three groups based on anatomic locations: (a) airway macrophage situated within the lumen or beneath the epithelial lining of conducting airways, (b) interstitial macrophage found isolated or in relation to lymphoid tissue in the interstitial connective tissue space, and (c) alveolar macrophage located on the alveolar surface. The alveolar macrophage has been the most extensively studied due to its accessibility by bronchoalveolar lavage (7,8).
The alveolar macrophage ranges from 15 to 50 µm in diameter and is round in shape with a foamy granular cytoplasm. The nuclei are eccentric and may be multiple within the cell. Ultrastructurally, macrophages show prominent cytoplasmic projections that appear as microvilluslike structures. The cytoplasm contains a well-developed Golgi apparatus, scattered mitochondria, endoplasmic reticulum, ribosomes, microtubules and microfilaments, and membrane-bound granules of varying appearance. These granules contain primary and secondary lysosomes.
Pulmonary alveolar macrophages differ from other macrophages by having aerobic energy production, increased mitochondria and mitochondrial enzymes, and more numerous and larger lysosomes. Alveolar macrophages are ultimately derived from bone marrow precursors, presumably by way of the peripheral blood monocyte. In addition, there is evidence for a population of alveolar interstitial macrophages capable of division and replenishment or augmentation of the alveolar macrophage population in the absence of a functioning bone marrow or in times of increased stress. The average lifespan of a pulmonary macrophage in the air space is estimated at 80 days. Various inhaled toxins, including cigarette smoke, have a negative effect on macrophage viability and activity.
The functions of the alveolar macrophage are numerous. They can be considered within the context of phagocytosis and clearance of unwanted intra-alveolar debris, immunologic interactions, and production of inflammatory and other chemical mediators. Subpopulations of macrophages may have capacities for one or more of these functions. Macrophage surface receptors include IgG, IgE, and C3. In association with these and other opsonins such as fibronectin, phagocytosis of foreign material occurs. Ingested microorganisms are subjected to lysosomal enzymes and, in many cases, are destroyed. Alveolar macrophages also ingest and eliminate endogenous pulmonary material, including dying type I and type II epithelial cells, alveolar surfactant, and inflammatory exudates, as may be produced during pneumonitis. Macrophages ingesting foreign material typically die within the alveoli or enter the mucociliary elevator, allowing their clearance. Alveolar macrophages present antigens to T lymphocytes for specific immunity and, ultimately, T- and B-cell activation. The production of a variety of mediators has been attributed to the alveolar macrophage population. Among substances identified are fibronectin, prostaglandins, leukotrienes, interferons, and α1 antitrypsin.
Pulmonary Vasculature
Pulmonary Arterial and Venous Circulation
The pulmonary circulation carries the same flow as the systemic circulation, but arterial pressure and vascular resistance are normally one-sixth as great (2). The media of the pulmonary arteries are half as thick as in the systemic arteries of the corresponding size. In larger vessels, the media consist mainly of elastic tissue, but in smaller vessels, they are mainly muscular, with a transition being in vessels of 1 mm in diameter. Pulmonary arteries lie close to corresponding air passages in connective tissue sheaths.
The transition to arterioles occurs at an internal diameter of 100 µm. These vessels differ radically from the systemic circulation, as they are virtually devoid of muscular tissue. There is a thin medium of elastic tissue separated from blood by the endothelium. There is little structural difference between the pulmonary arterioles and venules.
Pulmonary capillaries arise from larger vessels—the pulmonary metarterioles—and form a dense network over the walls of the alveoli; the spaces between them are similar in size to the capillaries themselves. About 75% of the capillary bed is filled in the resting state, but the percentage is higher in the dependent parts of the lung. This gravity-dependent effect is the basis of the vertical gradient of ventilation/perfusion ratios. Inflation of alveoli reduces the cross-sectional area of the capillary bed and increases the resistance to blood flow. Pulmonary capillary blood is collected into venules, which are structurally similar to arterioles. Unlike pulmonary arteries, pulmonary veins run close to the septa, which separate segments of the lung.
Bronchial Circulation
At the level of terminal bronchioles, air passages and accompanying blood vessels receive nutrition from bronchial vessels, which arise from systemic circulation. Part of this bronchial circulation returns to the systemic venous beds but mingles with pulmonary venous drainage, contributing to shunt. It has been established that when pulmonary arterial pressure in animals is raised as by massive pulmonary emboli, pulmonary arterial blood is able to reach pulmonary veins without traversing the capillary bed. This physiologic arteriovenous communication may offer an explanation for abnormalities of gas exchange during anesthesia.
Pulmonary Lymphatics
There are no lymphatics visible in the interalveolar septa, but small lymph vessels commence at the junction between the alveolar and extra-alveolar spaces. A well-developed lymphatic system courses around the bronchi and pulmonary vessels, capable of containing up to 500 mL of lymph, and draining toward the hilum (9). Down to airway generation 11, lymphatics lie in a potential space around air passages and vessels, separating them from lung parenchyma. This space becomes distended with lymph and pulmonary edema and accounts for the characteristic “butterfly shadow” seen on a chest radiograph. In the hilum, lymphatic drainage passes through groups of tracheobronchial lymph nodes, where tributaries from superficial subpleural lymphatics contribute. Most of the lymph from the left lung enters the thoracic duct. Lymph from the right lung drains into the right lymphatic duct. Pulmonary lymphatics often cross the midline.
Respiratory Physiology and Mechanical Ventilation
Positive pressure ventilation as a life-sustaining measure first proved its merit during the polio epidemics of the 1950s. Since that time, the use of mechanical ventilatory support has been synonymous with the growth of critical care medicine. Early ventilation used neuromuscular blocking agents to provide control of patient respiratory efforts. Today, patient–ventilator interaction is critical, and there is a growing awareness of complications associated with neuromuscular blockade. Finally, there is increasing recognition that ventilators can induce various forms of lung injury, which has led to reappraisal of the goals of ventilatory support (10). While it seems that each manufacturer has introduced differing modes of mechanical ventilation, the fundamental principles of ventilatory management of critically ill patients remain unchanged.
Positive pressure ventilation can be life saving in patients with hypoxemia or respiratory acidosis refractory to simpler measures. In patients with severe cardiopulmonary distress with excessive work of breathing, mechanical ventilation substitutes or supplements the action of respiratory muscles (11). In the setting of respiratory distress, respiratory muscles may account for as much as 40% of total oxygen consumption. In these circumstances, mechanical ventilation allows diversion of oxygen to other tissue beds that may be vulnerable. In addition, reversal of respiratory muscle fatigue, which may contribute to respiratory failure, depends on respiratory muscle rest. Positive pressure ventilation can reverse or prevent atelectasis by allowing inspiration at a more favorable region of the pressure–volume curve describing pulmonary function (Fig. 44.2). With improved gas exchange and relief from excessive respiratory muscle work, an opportunity is provided for the lungs and airways to heal. Mechanical ventilation is not therapeutic in and of itself, and positive pressure ventilation may aggravate or initiate alveolar damage. These dangers of ventilator-induced lung injury have led to a reappraisal of the objectives of mechanical ventilation. Rather than seeking normal arterial blood gas values, it is often better to accept a degree of respiratory acidosis and possibly relative hypoxemia to avoid large tidal volumes and high inflation pressures.
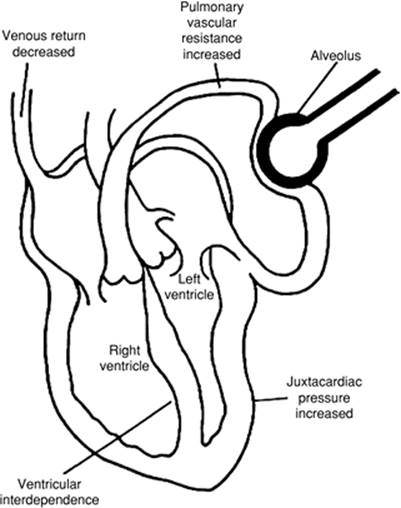
Mechanical ventilation may have hemodynamic effects as well. When applied to a passively breathing individual, positive pressure ventilation frequently lowers cardiac output, primarily as a result of decreased venous return. (This is especially true when gas trapping occurs during passive inflation [12]). In other circumstances, this form of ventilation may increase cardiac output in the setting of impaired myocardial contractility because left ventricular afterload decreases with an increase in intrathoracic pressure. Alveolar distension compresses alveolar vessels, and the resulting increase in pulmonary vascular resistance and right ventricular afterload produces a leftward shift in the interventricular septum. Left ventricular compliance is decreased both by the bulging interventricular septum and increased juxtacardiac pressure from the distended lungs. There seems little doubt that adding mechanical ventilation or removing this support from critically ill patients can be a significant imposed stress.
|
|
|
Figure 44.2. Factors responsible for the hemodynamic effects seen with positive pressure ventilation. An increase in intrathoracic pressure compresses the vena cava and thus decreases venous return. Alveolar distension compresses the alveolar vessels, and the resulting increases in pulmonary vascular resistance and right ventricular afterload produce a leftward shift in the interventricular septum. Left ventricular compliance is decreased by both the bulging septum and the increased juxtacardiac pressure resulting from distended lungs. (Reused with permission from Tobin MJ. Mechanical ventilation. N Engl J Med. 1994;330:1056–1061.) |
Mechanical ventilation strategies are clearly affected by underlying pulmonary disease. For example, in patients with acute respiratory failure, chronic obstructive pulmonary disease (COPD), asthma, or other conditions associated with a high minute ventilation, gas trapping develops in alveoli because patients have inadequate expiratory time available for exhalation before the next breath begins. Patients experiencing this “breath stacking” have a residual, peripheral positive end-expiratory pressure (PEEP). Also termed auto-PEEP, this retained peripheral gas makes triggering the ventilator more difficult, since the patient needs to generate a negative pressure equal in magnitude to the level of auto-PEEP in addition to the trigger threshold of the machine. This is one factor that may contribute to the patient's inability to trigger the ventilator despite the obvious respiratory effort. Auto-PEEP may be undetected because it is not registered routinely on the pressure manometer of the ventilator. Newer machines have software to detect auto-PEEP. In older machines, occluding the expiratory port of the circuit at the end of expiration in a relaxed patient causes pressure in the lungs and the ventilator circuit to equilibrate, and the level of auto-PEEP is displayed on the manometer (13). Fortunately, in most patients, auto-PEEP does not become a problem until the respiratory rate reaches 30 breaths/minute. If auto-PEEP or breath stacking is detected, the respiratory rate and tidal volume should be reduced to permit this (breath stacking) process to resolve.
Lung Mechanics
Respiratory Muscles
Air flows to and from the alveoli, driven by differences in pressure between the airway opening and the alveolus. During spontaneous breathing, mouth (atmospheric) pressure remains constant, while alveolar pressure fluctuates under the influence of changing pleural pressure and tissue recoil forces (14,15,16). The diaphragm powers inspiration both by displacing the abdominal contents caudally and by raising the lower ribs, expanding them outward by a bucket handle effect (17,18). This latter action is aided by the external intercostal muscles. Normal exhalation is passive. When faced with a large ventilatory requirement or with impeded gas flow due to airway obstruction or parenchymal restriction, the accessory muscles of respiration are recruited to aid inhalation. Forceful exhalation is assisted by the internal intercostal muscles. The phrenic nerves (C3–C5) innervate the diaphragm, while the spinal nerves (T2–L4) innervate the intercostal and abdominal muscles.
The primary disorders of respiratory muscle function are usefully considered as problems of the diaphragm or problems of the accessory respiratory muscles (18,19). When upright, patients with isolated paralysis of both hemidiaphragms can often sustain adequate ventilation by the coordinated use of the intercostal and abdominal muscles. First, the diaphragm is forced upward as the muscles contract to raise the abdominal pressure. The diaphragm then descends, aided by gravity, as muscle relaxation allows abdominal pressure to fall. This mechanism cannot work effectively in the supine position, a circumstance that explains why orthopnea is a prominent symptom of this disorder. Patients with spinal cord injury (quadriplegia) have the converse anatomic problem: The intact diaphragm provides adequate ventilation to meet the normal requirement, but paralysis of the expiratory musculature severely limits ventilatory reserve and coughing efficiency.
Pressure–Volume Relationships
The lung and its thoracic shell occupy identical volumes, except when air or fluid separates them (20,21,22). At any specified volume, the pressure acting to distend the lung is alveolar pressure minus pleural pressure, while the pressure across the chest wall is pleural pressure minus atmospheric pressure. The volume of the lung is determined uniquely by lung compliance (distensibility) and the pressure difference acting to distend it (transpulmonary pressure). Thus, lung volume is the same whether the alveolar pressure is 0 and pleural pressure is -5, or if alveolar pressure is 25 and pleural pressure is 20. A similar relationship between the distending pressure, compliance, and volume also applies to the chest wall. When the chest wall muscles are relaxed at functional residual capacity (FRC), the tendency of the chest wall to spring outward balances the tendency of the lung to recoil to a smaller volume. Should either the lung or the chest wall become less compliant (as in interstitial fibrosis or obesity), the pressure–volume curve shifts rightward and flattens, causing FRC to decrease (20). Conversely, an increased lung compliance (as in emphysema) allows a higher resting volume.
Pleural Pressure
The fraction of change in alveolar pressure sensed in the pleural space depends on the relative compliances of the lung (CL) and chest wall (CW). For a given change in alveolar pressure (ΔPa), the amount transmitted to the pleural space (ΔPpl) will be:
Δ Ppl = Δ Pa (CL/(CL + CW))
An inherently stiff chest wall would allow no volume change of the lung and complete transmission of a given increment in alveolar pressure to the pleural space. Conversely, an infinitely stiff lung would transmit none of it. Under normal circumstances, the lung and chest wall are almost equally compliant throughout the tidal range, so that approximately half of any change in alveolar pressure (as when PEEP is applied) is recorded in the pleural space. In clinical practice, average pleural pressure is estimated for clinical purposes as esophageal pressure (23).
Although clinicians speak fondly of pleural pressure as if it were a unique number, pleural pressure varies considerably throughout the chest because of hydrostatic gradients (which at FRC averages 0.37 cm water per centimeter vertical height), and because the pleural space and mediastinum have irregular contours caused by bony and vascular structures. At FRC, the average pleural pressure at midlung level is negative because the lungs are held open at greater than their relaxed volume. Pleural pressure surrounds the heart, the great vessels, and large airways, therefore affecting the vascular pressures measured at intrathoracic sites.
Effects of Changes in Lung Volume
Airway Resistance
Lung volume exerts a strong influence on airway resistance because resistance is inversely proportional to the fourth power of the radius. Pleural pressure surrounds the largest airways, while airways deeper within the lung are tethered open by the wall tension forces of the alveoli. Hence, as lung volume increases, the diameter of all airways increases, and resistance falls. Conversely, if a normal lung is held at a low resting lung volume, as in obesity, airway resistance will be high. In most restrictive diseases of lung tissue (e.g., interstitial fibrosis), the effects of heightened recoil on the airway diameter and driving force are usually more than sufficient to offset the effect of reduced volume, and flow rates are high relative to volume.
|
|
|
Figure 44.3. Schematic representation of the effects of changes in vital capacity on total pulmonary vascular resistance and the contributions to the total afforded by alveolar and extra-alveolar vessels. During inflation from residual volume (RV) to total lung capacity (TLC), resistance to blood flow through alveolar vessels increases, whereas resistance through extra-alveolar vessels decreases. Thus, changes in total pulmonary vascular resistance form a U-shaped curve during lung inflation. FRC, functional residual capacity. (Reused with permission from Murray JF. Circulation. In: The Normal Lung: The Basis for Diagnosis and Treatment of Pulmonary Disease. Philadelphia: WB Saunders; 1976:131.) |
Pulmonary Vascular Resistance
Raising the lung volume has a different effect on the resistance of pulmonary vessels. Although the extra-alveolar vessels expand for reasons similar to those outlined for the airways, the capillaries are compressed as vascular pressures fall relative to alveolar pressure, and net pulmonary vascular resistance increases with each increment of lung volume above FRC (Fig. 44.3).
Muscular Force
The lung volume has an important effect on the maximal inspiratory and expiratory muscular forces that can be generated. The magnitude of these forces can be quantified by measuring the pressure recorded against the occluded airway. At total lung capacity (TLC), the lung and chest wall exert their highest recoil pressures. More importantly, the muscles of expiration are stretched maximally and are able to generate their highest contractile forces. If the occluded airway port is suddenly released, as during coughing, intraluminal airway pressure falls. The flexible posterior walls of the central airways invaginate, and the lumen narrows markedly to a slit. As gas accelerates to a high velocity through this narrow region, it shears mucus from the airway walls and delivers it to the oropharynx. To be maximally effective, a coughing effort must be forceful and start from a high lung volume. Gas flows should not be obstructed in small airways, and the glottis must be sealed to allow pressure within the airway to build. In critically ill patients, all of these conditions may be violated simultaneously. For intubated patients, a vital capacity greater than 20 mL/kg and a maximal expiratory pressure of 60 mm Hg against an occluded airway at TLC are good predictors of an effective cough post extubation. The greatest negative end-inspiratory pressure can be generated at a residual volume where the muscle fibers of the diaphragm are stretched maximally to a position of favorable mechanical advantage. This encourages some patients to unintentionally misuse incentive spirometers that place emphasis on achieving a high flow rate rather than a high inhaled volume; they often exhale below FRC in order to take advantage of higher inspiratory muscle efficiency (and the relatively minor tendency of the chest wall to spring outward) at lower volumes. Conversely, hyperinflation causes the diaphragm to work less effectively, adding to the sense of dyspnea experienced by patients with COPD (Fig. 44.4).
|
|
|
Figure 44.4. Static volume–pressure curves of the lung (PL), chest wall (PW), and total respiratory system (Prs) during relaxation in the sitting posture. The static forces of the lung and the chest wall are pictured by the arrows in the side drawings. The dimensions of the arrows are not to scale; the volume corresponding to each drawing is indicated by the horizontal broken lines. (Reused with permission from Vassilakopoulos T, Zakynthinios S, Roussos C. Muscle function: basic concepts. In: Marini JJ, Slutsky AS, eds. Physiological Basics of Ventilatory Support. New York: Marcel Dekker, Inc.; 1998:114.) |
Position and Lung Volume
Position has an important influence on lung volume. In assuming a recumbent supine position, FRC falls approximately 25% to 30% (approximately 1,000 mL) in the adult, with most of the decrease occurring before the Fowler (30-degree) position (24). This reduction in lung volume occurs because the abdominal contents push the diaphragm upward. In either lateral recumbent position, the lung volume at FRC is only about 15% to 20% less than the upright sitting value because the nondependent (uppermost) lung maintains its sitting lung volume, or actually distends, partially offsetting the loss of volume from the lower lung. These observations have relevance for the nursing care of postoperative and critically ill patients.
Normal Pattern of Breathing
To provide fresh gas at 5 to 7 L/minute to the lungs, the thoracic pump moves a stroke volume of 5 to 7 mL/kg at a frequency of 10 to 16 per minute. Once every 8 to 10 minutes, a sigh of two to four times the normal tidal volume occurs, which apparently serves to reverse the natural tendency for the individual alveoli to collapse when ventilated at a normal but monotonous volume. Breath-to-breath FRC changes continuously, at about a constant average value (25).
Dead Space
The bronchial, nasal, and pharyngeal passages do not participate in gas exchange. This anatomic dead space varies with airway caliber and lung volume, averaging roughly 2.2 mL/kg of lean body weight at FRC. Because approximately 50% of this dead space resides in the upper airways, orotracheal intubation and tracheostomy decrease anatomic dead space significantly (26). On the other hand, face masks and ventilator tubing unflushed by fresh gas can become an extension of the anatomic dead space, increasing the work of breathing. In addition to anatomic dead space, some volume of fresh gas (the alveolar dead space) reaches alveoli but does not participate in gas exchange because of inadequate perfusion. A portion of the increased ventilation requirement observed after a large pulmonary embolus results from this mechanism. Taken together, anatomic and alveolar dead space constitute the physiologic dead space (i.e., the volume of gas moved during each tidal breath that does not participate in gas exchange). The fraction of each tidal breath wasted in this fashion, the dead space volume–to–tidal volume (VD/VT) ratio, can be accurately approximated by the formula:
VD/VT = (PaCO2 - PECO2)/PaCO2
where PaCO2 and PECO2 are the partial pressures of CO2 in arterial blood and mixed expired gas, respectively. At a normal tidal volume, VD/VT increases with age; expressed as a percentage:
VD/VT = 24.6 + 0.17 (age in years)
At very low tidal volumes, VD/VT rises to a high value because anatomic dead space does not decrease proportionately. (Nonetheless, even at tidal volumes theoretically below the anatomic dead space value, some alveolar gas exchange does occur.). During exercise, the VD/VT may fall to 20% or less, owing both to large tidal breaths and better perfusion throughout the lung.
Flow Limitation
The rate of airflow depends on the pressure difference driving the flow and the resistance: flow = driving pressure/resistance. Flow rates during exhalation are volume dependent because the recoil pressure that drives gas flow, as well as the airway caliber, increases progressively with lung volume. During unforced tidal breathing, the major site of airway resistance normally resides in the nasal passages, larynx, and uppermost tracheal airway. The average pleural pressure surrounding the airways varies from -2 cm H2O to -10 cm H2O, never reaching a positive value relative to the intraluminal pressure. As a result, there are no compressive pleural forces that tend to narrow the airway during passive exhalation. Forceful efforts to exhale raise the pleural pressure. Increased pleural pressure adds to the recoil pressure to boost alveolar pressure and thus potentially improves the driving pressure for gas flow. However, because pressure within the airway must decline progressively to zero as the airway opening is approached, positive pleural pressure also narrows the compressible intrathoracic airway. Above approximately two thirds of maximal effort, each additional increment in pressure narrows the airway sufficiently to offset the increment in alveolar pressure. The maximal flow rate is then said to be effort-independent at that lung volume, and remains so at smaller lung volumes, so long as the forceful effort is sustained. According to classic teaching, the point within the airway where pleural pressure and intraluminal pressure are equal (the equal pressure point) determines where “critical narrowing” occurs (27). Normally, it resides in the trachea or main bronchi at high lung volumes and migrates toward the alveolus as forceful expiration proceeds. A less well-known theory of flow limitation is the wave speed theory. Although scientifically more defensible than the equal pressure point theory, it is less intuitive and less widely known. Both theories predict that once flow limitation occurs, flow rate is determined only by the recoil pressure of the lung and resistance of the airway segment upstream of the critical pressure point.
Reproducibility stemming from effort independence is the main reason why effort-independent, forced spirometry values (such as FEV1) enjoy popularity as indices for evaluating airflow obstruction. Peak flow rate, which occurs before 25% of the vital capacity has been exhaled and all inspiratory flow rates are effort dependent, is therefore less reproducible. There are some disadvantages in using maximal flow rates, however. Some patients with emphysema have such collapsible airways that flow rates demonstrate negative effort dependence (i.e., flow rates worsen with increasing effort). Presumably, this helps account for the practice of pursed lip breathing among patients who are so severely limited by their disease that they must utilize optimal rates of exhalation during tidal breathing.
Work of Breathing
Energy must be expended in moving gas to and from the alveoli, primarily against frictional and elastic forces (28,29,30,31). Under extreme ventilatory burdens, such exertion may contribute substantially to total oxygen consumption. The main portion of fractional resistance arises from collisions of gas molecules with the surfaces of the airway. Work done against friction depends strongly upon airway size, increasing rapidly as airway caliber narrows. For this reason, frictional work varies inversely with lung volume, which influences luminal diameter. When airways are narrowed by obstructive disease, a relatively small increase in resting lung volume can reduce the work dissipated against frictional forces substantially. During normal breathing, this increase in lung volume simultaneously imposes an additional elastic cost that partially offsets any frictional reduction.
The elastic forces that oppose inflation originate within the lung parenchyma and chest wall. The tendency for the thorax to recoil inward increases in nearly linear proportion to lung volume throughout the physiologic range. Diseases such as interstitial fibrosis and obesity may dramatically increase the effort required to distend the lung against recoil forces (20). When total work done against the combined frictional and elastic forces is plotted against lung volume, the minimum value normally occurs near FRC. Patients with airflow obstruction reduce their workload if they breathe at relatively high lung volumes, since frictional work may fall dramatically as lung volume increases. Dynamic hyperinflation contributes very substantially to the work of breathing (12,32). Conversely, patients with restrictive parenchymal disease may perform less total work at lower lung volumes as the reduction in elastic work more than compensates for the increase in frictional work. Under normal circumstances, FRC is set near the volume at which total work of breathing is minimized. In cases of advanced airflow obstruction, maintenance of acceptable ventilation may require that the patient sustain a higher lung volume in order to take advantage of the higher flow rates achievable at that level. (At a lower FRC, expiratory flow is too slow to allow adequate alveolar ventilation.) Positive alveolar pressure generated during this process is termed dynamic hyperinflation, and is quantified by stopping flow at end expiration. This allows auto-PEEP (intrinsic PEEP) to be approximated (12,33).
Ventilation/Perfusion Relationships
Distribution of Ventilation and Perfusion
Ventilation
Alveoli contiguous to the pleura are kept open by a positive distending pressure (alveolar minus pleural). At the same horizontal level, a net pressure—very nearly equal to pleural pressure—surrounds the alveoli deep within the lung parenchyma due to the phenomenon of interdependence (which links each alveolar wall to its immediate and distant neighbors). Although the alveolar distending pressures across a given horizontal slice of the lung are similar, the vertical gradient of pleural pressure (approximately 0.3 cm water/vertical centimeter at FRC) causes a more negative pleural pressure at the apex of the upright lung than at the base (34,35). Consequently, the apical alveoli and airways are larger at FRC than their basal counterparts. However, as pleural pressure falls during inhalation, it does so unevenly; pressure falls most in the dependent regions closer to the diaphragm. This larger pressure swing, together with the fact that smaller alveoli are more compliant than larger ones, causes the bases to ventilate better than the apices. The same principles hold in the supine, prone, and lateral positions; uppermost lung regions are held open at higher volumes, but the dependent lung regions are better ventilated—a good rationale for periodically turning bedridden patients from side to side. These principles, which apply to spontaneous breathing, do not necessarily hold for patients receiving positive pressure ventilation in a passive mode.
Perfusion
The relationship of ventilation to dependency is fortunate, considering that the distribution of pulmonary blood flow follows a similar rule. Because of its low resistance, the normal pulmonary vascular bed is a low-pressure circuit, with resting pressures in the central arteries averaging approximately 25/10 mm Hg (mean 15 mm Hg). Pulmonary venous pressure is similar to that of the left atrium, oscillating between 3 and 10 mm Hg with the cardiac cycle. Because the apices are positioned at least 10 cm above the hila in the upright position, many capillaries therein must wink open and closed at different phases of the breathing cycle during the tidal breathing cycle. Hydrostatic pressure adds to luminal pressure so that vessels in the dependent regions are relatively dilated and the driving pressure for flow is relatively high. Hence, perfusion improves markedly, proceeding from apex to base (36). This helps explain why emboli localize to the lower lobes and why collapse of the air spaces at the base can cause profound hypoxemia, while upper lobe atelectasis seldom does. Given the patient with unilateral parenchymal disease and a choice of placing the patient in either lateral position to improve gas exchange, the good lung should be placed dependent for two reasons: The good lung will receive a higher percentage of total ventilation and perfusion, and the bad lung will be subjected to higher distending pressures. One should be concerned, however, that mucus and other noxious liquids produced in the “bad” lung could flood the dependent “good” lung, unless precautions are taken. Although dependency causes both ventilation and perfusion per unit volume to increase, the effect on perfusion is more striking, and therefore the regional ventilation-to-perfusion ratio is highest at the apex and lowest at the base (35,36).
Regulation of Regional Perfusion
Blood flow through a lung region depends on the relationship between the alveolar pressure and pulmonary arterial and venous pressures. According to what is presently believed, if alveolar pressure exceeds arterial pressure, alveolar capillaries will pinch closed, and no blood will flow except through “corner” vessels that are subjected to different distending forces (37). If alveolar pressure is less than arterial pressure but exceeds venous pressure, flow through the region will be driven by the difference between arterial and alveolar (not venous) pressures. If venous pressure is higher than alveolar pressure, flow will be dependent on the arterial minus venous pressure difference, independent of alveolar pressure. Zones reflecting each of these conditions can be identified during tidal breathing (36,38,39,40). The influence of alveolar pressure on capillary patency is particularly important to consider when high levels of positive end-expiratory pressure are applied to the airway. If alveolar pressure exceeds pulmonary venous pressure, balloon occlusion pulmonary (wedge) pressure will reflect alveolar—not pulmonary venous—pressure through at least a portion of the respiratory cycle.
Capillary Recruitment
At a given lung volume, pulmonary vascular resistance falls as flow increases. Rising pulmonary arterial pressure recruits previously unperfused capillaries so that a fivefold increase in cardiac output during exercise results in a smaller than twofold increase in mean pulmonary arterial pressure. (The ventilation-to-perfusion match-up also becomes more uniform under these conditions.) In a patient with a partially obliterated pulmonary vascular bed (e.g., emphysema or interstitial fibrosis), no capillaries may remain to be recruited at rest. In this condition, even modest increments in cardiac output or pulmonary vascular resistance cause pulmonary artery pressure to increase dramatically.
Active Vasoconstriction
Apart from the effect of capillary recruitment, pulmonary blood flow can be regionally controlled by active constriction of vascular smooth muscle. If vascular smooth muscle hypertrophy is due to chronic hypertension, the response to vasoconstricting stimuli may be exaggerated. Alveolar hypoxia exerts by far the most important influence on variations of local vascular tone (39). Normally, this property serves a useful purpose, diverting blood away from alveoli that are poorly ventilated. However, acting against a background of a restricted capillary bed, widespread hypoxic vasoconstriction may cause excessive pulmonary artery pressure and precipitate acute right ventricular failure, as in exacerbated COPD. Acidemia is a weaker stimulus to pulmonary artery vasoconstriction that adds to the effect of alveolar hypoxia.
Other stimuli can influence vasomotor tone. Hypertonic fluids, such as angiographic contrast media, can cause a striking vasoconstrictor response. (This is believed to be a major mechanism causing sudden death in angiographic studies of patients with pulmonary hypertension [40].) Vasoactive substances such as serotonin, histamine, and prostaglandin F2-α also produce notable vasoconstriction. α-Adrenergic vasopressors (e.g., levarterenol) cause little response. Unfortunately, relatively few available drugs produce potent vasodilation. Prostacyclin (intravenous or aerosolized) and inhaled nitric oxide, however, are exceptions (41). Aminophylline, isoproterenol, and calcium channel blockers (e.g., nifedipine) also act as pulmonary vasodilators. In the outpatient setting, bosentan and sildenafil have an undeniable vasodilating effect, but over a longer term.
Regulation of Regional Ventilation
Ventilation to a given lung region depends not only on the stress (pressure difference) applied, but also on the regional compliance of that unit and the resistance to air entry (42,43). The product of resistance and compliance is known as the time constant, RC, by analogy to electrical capacitors. A region with a low time constant (e.g., a stiff lung unit with open conducting airway) will fill and empty rapidly, and be relatively well ventilated for the amount of stress applied, compared to immediate neighbors having higher time constants. Healthy lungs depend upon contraction and relaxation of the bronchial smooth muscle to change the resistance and compliance of local units. Both β sympathetic and parasympathetic nerves innervate the bronchial smooth muscle. Vagal fibers are distributed throughout the tracheobronchial tree, while sympathetic fibers appear to concentrate in small airways. Under normal resting conditions, there is tonic vagal tone. Irritating stimuli, such as smoke, can trigger mild generalized bronchoconstriction, even among normal subjects. Localized bronchoconstriction occurs in an inflamed bronchus. Although found in some animal species, α receptors on bronchial smooth muscle are difficult to demonstrate in man. Carbon dioxide bronchodilates while hypocarbia bronchoconstricts. Diminished CO2 delivery and resulting bronchoconstriction may partially explain the ventilation defects occasionally seen in the region of a pulmonary embolus. Hypoxemia and acidosis may also cause some degree of bronchoconstriction. Many circulating agents affect bronchial tone. Epinephrine and other catecholamines that stimulate β2 receptors bronchodilate, as do cholinergic blockers, certain prostaglandins, nitric oxide, and theophylline derivatives. Histamine, prostaglandin F2-α, and perhaps α-adrenergic stimulators bronchoconstrict.
Gas Exchange and Transport
The Respiratory Quotient
The primary function of ventilation is to allow the exchange of CO2 generated in body tissues for the oxygen available in the inspired gas mixture. In the adult of average size at rest, approximately 250 mL of oxygen are consumed by the tissues per minute, whereas 200 mL of CO2 are generated—a respiratory quotient (CO2/O2 = RQ) of 0.8. Over a long period of time, the ratio of gases exchanged with the atmosphere, R, must equal the RQ. Transiently, however, this atmospheric exchange ratio may exceed or be less than RQ, as during hyper- or hypoventilation. Important increases in the CO2 production relative to the oxygen consumption ratio can occur with the shift to a high-carbohydrate diet. Starvation and the development of certain metabolically stressful conditions (e.g., sepsis) reduce CO2generation.
Alveolar Gas Equation
Gases move between the blood and alveolar spaces by diffusing from areas of higher partial pressure to those with lower partial pressure (44). As fresh gas is inspired at local barometric pressure, it is warmed to body temperature and humidified before it reaches the main carina. At saturation, the partial pressure exerted by water vapor at 37°C is 47 mm Hg, independent of barometric pressure. Thus:
PiO2 = FiO2 · (PB-47)
where PiO2 is the partial pressure of oxygen in the central airways, FiO2 is the fraction of oxygen in the inspired gas mixture, and PB is barometric pressure in millimeters of mercury. Barometric pressure falls with ascending altitude (45). Although ≈750 mm Hg at sea level, PB is ≈520 mm Hg at 10,000 feet.
In the steady state, the partial pressure of oxygen at the alveolar level (PaO2) can be estimated from the simplified alveolar gas equation, which is based on the principle of conservation of mass:
PaO2 = PiO2 - (PaCO2)/RQ
PaCO2, the partial pressures of CO2 in arterial blood, and the alveolar PCO2 of well-perfused units remain nearly equivalent, even in disease, so that PaCO2 is usually measured and substituted. Transient episodes of hyperventilation and breath-holding can result in oxygen tensions that are considerably higher or lower than the values predicted.
Alveolar-Arterial Oxygen Tension Difference
The alveolar gas equation is worth remembering because the difference between calculated PAO2 and measured PaO2 (known variously as the A-a PO2 difference, A-a DO2, or the A-a gradient) provides a measure of the efficiency of gas exchange between the alveolus and the arterial blood. The normal A-a gradient increases with FiO2 and with age. When supine, A-a DO2 is approximately 10 mm Hg for a healthy young person at sea level when breathing air and 100 mm Hg while breathing 100% oxygen. Hyper- and hypoventilation do not noticeably affect it. The A-a DO2 is a particularly useful index when monitoring patients who require supplemental oxygen.
Causes of Arterial Hypoxemia
Arterial oxygen content may fall due to one of six mechanisms: (a) inhalation of a hypoxic gas mixture, (b) hypoventilation, (c) impaired diffusion of oxygen from alveolar space to pulmonary capillary, (d) ventilation/perfusion mismatching, (e) shunting of venous blood past alveolar capillaries, and (f) admixture of abnormally desaturated systemic venous blood (34). A decrease in the inspired fraction of oxygen, as at high altitude, will cause hypoxemia for obvious reasons. In the steady state and in accordance with the alveolar gas equation, hypoventilation will cause alveolar PO2 to fall as oxygen is consumed, but not replenished, at a sufficient rate. The impaired diffusion of oxygen can result in incomplete equilibration of alveolar and pulmonary capillary blood, but this appears to be of limited clinical importance except when the lung parenchyma is seriously abnormal and cardiac output is high. The increased distance for diffusion between the alveolus and erythrocyte, the decreased gradient for O2 diffusion, and the shortened transit time of the red cell through the capillary all adversely influence diffusion (44). Under ordinary circumstances, however, none of these factors acting in isolation slows the equilibration sufficiently to prevent the saturation of end-capillary blood. Nonetheless, a combination of adverse influences may cause enough impairment of diffusion to contribute to hypoxemia (e.g., diffusion impairment probably contributes to the hypoxemia of a person with interstitial fibrosis during exercise).
Ventilation/Perfusion Mismatch
Regional mismatching of ventilation and perfusion is perhaps the most frequent cause of clinically important desaturation (e.g., COPD). Regional is the key word when the entire lung is considered. It is not the ratio of minute ventilation relative to total pulmonary blood flow that determines whether hypoxemia occurs, but rather whether ventilation and perfusion distribute appropriately (e.g., one lung could receive all ventilation and the other lung all perfusion, for an overall ventilation/perfusion [V/Q] ratio of 1.0). Units that are relatively poorly ventilated in relation to the perfusion they receive cause desaturation; high V/Q units contribute to alveolar and physiologic dead space, but not to hypoxemia. Unfortunately, overventilating some units to compensate for others that are underventilated may keep PaCO2—but not PaO2—at the proper level. Aliquots of blood exiting from different lung units mix gas contents, not partial pressures. For CO2 content, which relates linearly to alveolar ventilation in the physiologic range, a unit with good ventilation can compensate for an underventilated unit. However, at normal barometric pressure, a little more oxygen can be loaded onto blood with already saturated hemoglobin, no matter how high the oxygen tension in the overventilated units may rise. Hence, when equal amounts of blood from well and poorly ventilated units blend their contents, the result is blood with O2 content halfway between them and a PaO2 only slightly higher than that of the lower V/Q unit. Supplementing the inspired fraction of oxygen will cause arterial hypoxemia to reverse impressively as the alveolar oxygen partial pressure of even poorly ventilated units climbs high enough to achieve saturation. After breathing 100% oxygen for a sufficient period of time, only those units that are totally—or almost totally—unventilated will contribute to hypoxemia.
Shunt
Hypoventilation, impaired diffusion, and V/Q mismatching all respond to supplemental oxygen. Units that are totally unventilated are unresponsive to oxygen therapy and contribute to intrapulmonary shunt. Shunt can also be intracardiac, as in cyanotic (right-to-left) congenital heart disease, or can result from the passage of blood between abnormal vascular communications within the lung, as occurs with pulmonary arteriovenous communications. If given oxygen for 15 minutes, the percentage of blood flow being shunted can be calculated from the formula:
[(CcO2 - CaO2)/(CcO2 - CvO2)] × 100
where C denotes content, and c, a, and v denote end-capillary, arterial, and mixed venous, respectively (46). End-capillary PO2 is assumed to equal alveolar oxygen tension, which in turn is calculated from the simplified alveolar gas equation. (Although it is best to measure mixed venous oxygen content directly, stable patients with presumed normal cardiac output and hemoglobin and oxygen consumption can reasonably be estimated to have a normal CvO2, so long as arterial blood is near full saturation.) For a patient breathing pure oxygen, a shunt fraction less than 25% can be estimated rapidly by dividing the A-a difference (670-PaO2) by 20, again with the proviso that the mixed venous oxygen content is normal. At lower inspired oxygen fractions, true shunt cannot be reliably estimated by an analysis of oxygen contents, but venous admixture or physiologic shunt can. Although V/Q mismatch as well as true shunt may contribute to a lower than normal PaO2, any desaturation can be considered as if it originated from true shunt units. To calculate venous admixture, CcO2 in the shunt formula is calculated from the ideal PAO2 existing at that particular inspired oxygen fraction. At the bedside, a very imprecise but commonly used indicator of gas exchange is the PaO2/FiO2 ratio (the “P-to-F” ratio). In healthy adults, this ratio exceeds 400, independently of the FiO2.
As the percentage of true shunt rises, supplemental oxygen becomes progressively less effective in raising PaO2. When true shunt fraction is higher than 25%, little benefit accrues from raising the inspired oxygen fraction above 0.5. As a shunt increases, the P-to-F ratio becomes increasingly insensitive. These considerations have practical significance, because concentrations of oxygen higher than 0.5 markedly increase the risk of oxygen toxicity, but may have only marginal benefit in high shunt lungs (47). Hence, in patients with true shunt, FiO2 can frequently be lowered out of a dangerous range without changing PaO2 noticeably. Conversely, at low shunt percentages, even small changes in shunt fraction or at FiO2 can cause major changes in oxygen tension. If the venous admixture is due primarily to V/Q mismatching, the response to raising FiO2 will depend on whether most admixture arises from units with nearly normal, moderately low, or very low V/Q ratios (48). If hypoxemia is caused by very low V/Q (but not shunt) units, little improvement may accrue until the oxygen fraction approaches 1.0, at which level PaO2 rises abruptly.
Admixture of Abnormally Desaturated Venous Blood
Admixture of abnormally desaturated venous blood is a potentially important mechanism acting to lower PaO2 in patients with impaired pulmonary gas exchange and reduced cardiac output. The oxygen content of venous blood is determined by the interplay between oxygen consumption and oxygen delivery. O2 consumption equals cardiac output times CaO2 minus CvO2. Oxygen delivery will be impaired if arterial saturation falls without a compensatory increase in tissue perfusion, or if tissue perfusion falls. In the first instance, the peripheral tissues will strip the usual amount of oxygen from an already desaturated hemoglobin molecule, and the resulting venous O2 content will drop, provided that O2 consumption remains normal. In the second instance, venous content will fall as an abnormal amount of oxygen is removed from each unit volume of sluggishly passing blood.
If all returning venous blood goes to well-ventilated units, abnormally desaturated venous blood presents no problem, as blood exiting from the lung will be fully saturated. However, to the extent that venous admixture exists, reduced venous saturation translates into arterial desaturation. When lung parenchymal disease develops, patients with limited cardiac reserves are those at greatest jeopardy for serious desaturation by this mechanism. In such patients, there is a “positive feedback loop”—arterial desaturation leads to venous desaturation, which adds to venous admixture and impairs arterial oxygenation further. Even with stable lung parenchymal disease, serious arterial desaturation can occur if cardiac output falls disproportionately to oxygen consumption. Thus, in many intensive care patients, PaO2 fluctuates considerably, independent of changes in the lungs.
Gas Transport and Storage
Oxygen Carriage
In blood, hemoglobin binds the vast majority of oxygen, and plasma dissolves the remaining small fraction. The oxyhemoglobin dissociation relationship is curvilinear, with the knee of the curve at approximately 60 mm Hg at normal pH (49). Acidosis, increased temperature, raised PaCO2, and increased erythrocyte 2,3-diphosphoglycerate (DPG) shift the curve rightward, mildly hampering loading at the alveolus but facilitating unloading of oxygen at the low PO2 of tissue. At sea level, normal PaO2 is age dependent, varying from approximately 100 mm Hg at age 20 to 80 mm Hg at age 80. Because hemoglobin binding is 90% complete at a partial pressure of 60 mm Hg and falls rapidly below that level, a PaO2 of ≥60 mm Hg and SaO2 of ≥90% are commonly agreed to represent adequate oxygen loading, and are used as benchmark values for clinical purposes. Raising the PaO2 10-fold raises the oxygen-carrying capacity a scant 12.5%. The volume of oxygen carried in 100 mL of blood can be calculated from the following formula:
CaO2 = 1.39 [Hgb] % Sat + 0.0034 [PaO2]
where Hgb is hemoglobin, expressed in grams per 100 mL of blood, and % Sat equals percentage of hemoglobin saturation. At normal rates of oxygen consumption and delivery, mixed venous blood has a PO2of 40 mm Hg, a saturation of 75%, and an oxygen content of 15 mL oxygen per 100 mL of blood. The content difference between simultaneous arterial and mixed venous samples—the a-v O2 difference—averages 5 mL of oxygen per 100 mL of blood under normal circumstances. However, this difference widens when O2 consumption is disproportionate to the rate of O2 delivery to the tissues, as commonly occurs in states of low cardiac output. Conversely, the difference will be narrow in sites of abnormally high blood flow or if there are functional arteriovenous shunts in peripheral tissues.
CO2 Carriage
Carbon dioxide is carried in the blood in three forms. The small proportion physically dissolved in plasma contributes little to CO2 exchange between venous blood and the alveolus (about 10% of the total). CO2 is also bound to blood proteins (mainly hemoglobin) more avidly by venous than by arterial blood. Approximately 30% of the CO2 delivered to the alveolus is released from these “carbamino” compounds (50). Quantitatively, the majority of CO2 carried in the blood takes the form of bicarbonate ion. With the help of erythrocyte carbonic anhydrase to speed its conversion to CO2 as it reaches the alveolus, bicarbonate delivers approximately 60% of the total CO2 offered for exchange.
Stores of O2 and CO2
Exclusive of the gas volume of the lungs, total body tissue stores of oxygen are small, scarcely more than 1 L. In addition, a considerable proportion of that stored volume is not available to the tissues without unacceptable reductions in PO2 and the gradient for diffusion of oxygen at the tissue level. Following sudden cessation of the circulation, supplies are rapidly exhausted, and irreversible damage to certain vital organs occurs within minutes. The lungs act as a reservoir of approximately 500 mL of oxygen when breathing air; hence, PaO2 falls more slowly during apnea than it does during circulatory arrest. (For this reason, attempts to maintain adequate forward blood flow must not be interrupted during management of circulatory arrest.) When filled with pure oxygen rather than air, the capacity of the lung reservoir is increased fivefold, and the duration of apnea before hypoxemia occurs is prolonged threefold or longer. Breathing oxygen does little to increase storage in blood and other body tissues, and PAO2 falls precipitously upon returning to room air breathing. Thus, “preoxygenating” a patient before tracheal suctioning is ineffective if more than a few seconds elapse after oxygen is removed from the face, and is maximally effective when oxygen is continued up to the time that suction is applied. Similar considerations apply during endotracheal intubation; if the tube cannot be placed quickly and the patient continues to breathe spontaneously, the attempt to intubate should not be prolonged.
By comparison with oxygen stores, body stores of carbon dioxide are enormous—on the order of 100 times as great. As a result, it takes much longer for CO2 to find a steady-state level after a step change in ventilation (51). Interestingly, PaCO2 more rapidly achieves the steady-state value following a step increase in ventilation than following a step decrease. The PaCO2 will have achieved its final value within 10 to 15 minutes after a ventilatory increase, although not for almost an hour or more following a decrease. These rules of thumb are helpful when deciding the time for arterial blood gas sampling during weaning efforts or when adjusting ventilator settings.
Consequences of Altered PaO2, PaCO2, and pH
Hypoxemia
Whether hypoxemia is tolerated well or poorly depends not only on the degree of desaturation, but also on compensatory mechanisms and the sensitivity of the vital organs to hypoxic stress. The major mechanisms of compensation are an increased cardiac output to improve perfusion of vital tissues (due to capillary recruitment and changes in distribution of resistance) and increases in hemoglobin concentration. Other adaptations, such as improved downloading of oxygen by tissue acidosis and increased anaerobic metabolism, assume less importance until failure of the primary methods calls them into action (as during circulatory arrest).
If a conscious individual without cardiac limitation or anemia is made mildly hypoxic over a short period of time, no important effect will be noted until PaO2 falls below 50 to 60 mm Hg. At that level malaise, lightheadedness, mild nausea, vertigo, impaired judgment, and discoordination are the first symptoms, reflecting the extreme sensitivity of cerebral tissue to hypoxia (52). Although minute ventilation increases, little dyspnea develops unless hypercapnia uncovers underlying mechanical lung problems, as in COPD. Marked confusion resembling alcohol intoxication appears as PaO2 falls into the 35- to 50-mm Hg range, especially in older individuals with ischemic cerebrovascular disease. Heart rhythm disturbances also develop. Between 25 and 35 mm Hg, renal blood flow decreases and urine output slows. Lactic acidosis appears at this level, even with normal cardiac function. The patient becomes lethargic or obtunded, and minute ventilation is maximal. At approximately 25 mm Hg, the normal individual loses consciousness; and below that tension, minute ventilation falls due to depression of the respiratory drive center.
The sequence of events will be shifted to occur at progressively higher levels of oxygen tension if any of the major compensatory mechanisms for hypoxemia is defective. Even mild decreases in oxygen tension are poorly tolerated by an anemic patient with impaired cardiac output. In addition, critically ill patients may have impaired autonomic control of perfusion distribution due either to endogenous pathology (e.g., sepsis) or to vasopressor therapy.
Hyperoxia
At normal barometric pressure, venous and mean tissue oxygen tensions rise less than 10 mm Hg above normal when pure oxygen is administered to healthy subjects; hence, nonpulmonary tissues are little altered. However, high concentrations of oxygen in the lung eventually replace nitrogen even in poorly ventilated regions, causing collapse of low V/Q units as oxygen is absorbed by venous blood faster than it is replenished. Diminished lung compliance results. More importantly, high oxygen tensions injure bronchial and parenchymal tissues. The toxic effects of oxygen are both time-and concentration-dependent (47). Several hours of pure oxygen breathing is sufficient to cause some sternal discomfort due to irritation of bronchial epithelium. Within 12 hours, histologic evidence of alveolar injury begins to develop. At high concentrations, parenchymal infiltration and fibrosis occur eventually, a process usually requiring days to weeks. However, many patients subjected to similar conditions undergo no detectable adverse changes. There is general agreement that very high oxygen concentrations are well tolerated for up to 48 hours. At concentrations of inspired oxygen less than 50%, clinically detectable oxygen toxicity is unusual; however long, such therapy is required.
Carbon Dioxide
Hypercapnia
The major waste product of oxidative metabolism, CO2 is a relatively innocuous gas. Apart from its key role in regulation of ventilation, the clinically important effects of CO2 relate to changes in cerebral blood flow, pH, and adrenergic tone. Hypercapnia dilates cerebral vessels and hypocapnia constricts them, a point of importance for patients with raised intracranial pressure. Acute increases in CO2 depress consciousness, probably a result of neuronal acidosis. Similar but slowly developing increases in CO2 are well tolerated. Nonetheless, a higher PaCO2 signifies alveolar hypoventilation, which causes a decrease in alveolar and arterial PO2. With hypoxemia averted by supplemental oxygen, some outpatients with severe airflow obstruction and PaCO2 carry levels that chronically exceed 90 mm Hg and continue to lead active lives. The adrenergic stimulation that accompanies acute hypercapnia causes cardiac output to rise and peripheral vascular resistance to increase. Diaphoresis and plethora are accompanying clinical signs. During acute respiratory acidosis, these effects may partially offset those of the hydrogen ion on cardiovascular function, allowing better tolerance of low pH than with metabolic acidosis of a similar degree. During acute respiratory acidosis, constriction of glomerular arterioles also occurs by adrenergic stimulation, sometimes producing oliguria. Muscular twitching, asterixis, and seizures may be observed at extreme levels of hypercapnia in patients made susceptible by electrolyte or neural disorders.
Hypocapnia
The major effects of acute hypocapnia relate to alkalosis and diminished cerebral blood flow. Abrupt lowering of PaCO2 reduces cerebral blood flow and raises neuronal pH, causing altered cortical and peripheral nerve function. Sudden major reduction of PaCO2 (e.g., shortly after initiating mechanical ventilation) can produce life-threatening seizures. Cardiac arrhythmias are also an important consequence of abruptly lowering PaCO2.
Hydrogen Ion Concentration
For mammalian cells to function optimally, hydrogen ion concentration must be rigidly controlled. The widest pH range that can be sustained for more than a few hours and is compatible with life is approximately 6.8 to 7.8 units. Although all organs malfunction to some extent during acidosis, cardiovascular function is perhaps the most impaired. Myocardial fibers contract less efficiently, systemic vessels react sluggishly to vasoconstrictive stimuli, vasomotor control deteriorates, blood pressure falls, arrhythmias develop, and pulmonary hypertension is accentuated (53). As a result, defibrillation and cardiopulmonary resuscitation are especially difficult in an acidotic patient. In addition, acidosis profoundly affects neuronal performance, acts synergistically with alveolar hypoxia to cause pulmonary vasoconstriction, and blunts the action of adrenergic bronchodilators on the conducting airways. Each of these effects accelerates dramatically in severity as pH falls below 7.20. Above 7.20, pH is not a major concern of itself, and should not prompt therapy aimed solely at pH correction. (In fact, the rightward shift of the oxyhemoglobin dissociation curve may improve tissue oxygen delivery if cardiovascular performance remains adequate.) In this higher pH range, acutely developing acidosis is more alarming for what it signifies: Seriously compromised ventilatory, metabolic, or cardiovascular systems in need of urgent attention.
Alkalosis causes less apprehension among physicians than acidosis of a similar degree because the etiology is usually less life threatening. However, alkalosis is detrimental with regard to the release of oxygen to the tissues, shifting the oxyhemoglobin dissociation curve leftward. Raised pH does not exert the dangerously depressing influence on myocardium and blood vessels seen with a similar degree of acidosis. Furthermore, unless very abrupt and severe, the effects of raised pH on the brain are limited to confusion and encephalopathy. The major risk of extreme alkalosis appears to relate to cardiac arrhythmias, which are caused in part by electrolyte shifts (decreased calcium, increased potassium) and diminished oxygen delivery.
To keep hydrogen ion concentration within narrow limits, its generation rate must equal the elimination rate. The hydrogen ion is generated in two ways: One by hydration of CO2 from “volatile” acid (according to the reaction complex formula) and another by the production of fixed acid from the by-products of metabolism such as sulfates and phosphates (49,53). Ventilation eliminates the volatile acid load after reversal of the CO2 hydration reaction in the lung capillaries, while the kidney excretes the bulk of the fixed acid load. Quantitatively, the lungs are much more important, as they eliminate a much greater acid load (53). If the excretion of CO2 speeds or slows inappropriately, the result is respiratory derangement of the acid-base balance. If the excretion rate of fixed acid speeds or slows in relation to production, or if abnormal metabolic loads of acid or alkali develop that cannot be handled, metabolic acidosis or alkalosis occurs. A complete discussion of acid-base physiology is beyond the scope of this chapter.
Control of Ventilation
The respiratory center of the medulla modifies its own cyclic rhythm by integrating signals from many sources (54). These inputs, which may be of cortical, chemical, or reflex origin, cause changes in the timing frequency in the depth of tidal breathing. In general, each potential modifier of medullary activity is much more potent as a stimulus to increase breathing than as a depressant to retard the endogenous level of breathing set by the respiratory center. Efferent flow descends via the phrenic nerves to the diaphragm and via the spinal nerves to the intercostal and abdominal muscles. Control of output from the medullary respiratory center is an interactive process. For example, the precise effect of a given rise in PaCO2 will depend on the levels of cortical arousal, PaO2, and pH. The result of that neural output will depend on the ability of the ventilatory muscles to contract in a coordinated fashion and on the lungs to ventilate upon command.
Chemical Stimuli
Under normal resting conditions, intracerebral hydrogen ion concentration is the predominant influence over ventilation. As in the periphery, the ratio of bicarbonate concentration to PCO2 determines pH. Unlike CO2, which transports passively across the blood–brain barrier, the bicarbonate concentration of the cerebrospinal fluid is maintained somewhat lower than in blood by an active process (the “brain kidney”). This mechanism is capable of making relatively rapid compensatory adjustments in bicarbonate so that cerebrospinal fluid (CSF) pH is restored almost completely to its normal resting value of 7.3 within 12 hours following a derangement (54,55). By comparison, the CO2 crosses the juxtamedullary area quickly and passively. Thus, an abrupt rise in PaCO2 precipitates intracerebral acidosis, prompting increased ventilation to restore pH balance. The potency of an increase in PaCO2 wanes with time, as CSF bicarbonate rises to compensate. Conversely, the ventilatory compensation for sustained metabolic acidosis is maximized 12 or more hours following its onset, since initially peripheral pH receptors drive PaCO2 to low levels and create CSF alkalosis, which temporarily limits the ventilatory increase.
PaCO2 drives ventilation mainly through its effect on intracerebral hydrogen ion concentration. However, a rise in PaCO2 also stimulates receptors at the carotid bifurcation (perhaps to the peripheral pH receptors located there). The level of PaO2 modifies the ventilatory response to CO2, increasing it when hypoxemia occurs. Thus, when hypoxemia is relieved (as during treatment of the compensated COPD), PaCO2 is expected to rise somewhat, even if the respiratory center is otherwise normally responsive to CO2. The rise in CO2 will be exaggerated if CO2 sensitivity is reduced. Cortical depression, whether caused by sleep or sedative drugs, limits the response to CO2, especially in patients with a previously blunted drive to breathe. Prolonged mechanical stress may also alter the sensitivity to chemical stimuli. Although the most common example occurs in chronic airflow obstruction, even normal individuals increase the CO2 set point if made to breathe against resistance for an extended period of time. Teleologically, this occurs because total work of breathing lessens when PaCO2 rises to make each tidal exchange more efficient.
Although an effect can be demonstrated up to 150 mm Hg, PaO2 is an important stimulus for ventilation only when the blood is significantly desaturated (54). Oxygen receptors located mainly in the carotid body send neural signals to the medulla. Extreme hypoxia depresses rather than stimulates ventilation by direct depression of the respiratory center. With advancing age, the ventilatory response to hypoxemia (into low blood pH) diminishes, perhaps a consequence of carotid artery sclerosis. Starvation and sedatives also attenuate the hypoxic ventilatory drive. Systemic acidosis is a very potent drive to ventilation, with its effect at least additive to that of hypoxemia when the two occur together, as they often do clinically. The receptors for peripheral blood pH are located in the carotid body.
Nonchemical Stimuli
Neural reflexes originating from receptors located within the lung or chest wall may drive ventilation. Thus, the hyperventilation that occurs during the early phases of asthma and pulmonary edema, as well as the chronic hyperventilation of interstitial fibrosis, may result from stimulation of normally quiescent receptors. Central neurogenic hyperventilation and Cheyne-Stokes breathing (on average, also a hyperventilatory pattern) usually result from intracerebral pathology and may be modified by neuromuscular input.
Clinical Disorders of Ventilatory Control
For therapeutic purposes, it is important when evaluating hypercapnia to distinguish patients with depressed drives (“won't” breathers) from those whose condition, such as COPD or neuromuscular disease, will not allow them to achieve normal alveolar ventilation (“can't” breathers). Many patients present with combined problems of drive and mechanics. For example, because advanced age and starvation may blunt ventilatory drives, an elderly patient within acutely elevated ventilation requirements and mechanical stress (e.g., pneumonia) often presents with a component of respiratory acidosis as well as hypoxemia. Clues to primary respiratory center dysfunction include no evidence of obstruction or neuromuscular disease, normal A-a DO2, and the preserved ability to drive PaCO2 considerably below normal with voluntary hyperventilation. Because a wide spectrum of response to PCO2 and PaO2 exist even among healthy normal subjects, it is not surprising that two otherwise indistinguishable patients with the same pulmonary pathology may set very different levels of alveolar ventilation.
Sleep routinely blunts the chemical drives to breathe (56,57,58). Many chronic disorders can depress the respiratory center function. Among these, hypothyroidism, narcotic overdose, and the obesity hypoventilation syndrome are perhaps the most reversible. The utility of respiratory center stimulants is limited. Stimulants are contraindicated for patients with problems confined to disordered mechanics, such as COPD, since dyspnea may worsen with little beneficial effect. Progesterone increases CO2 drive in pregnant women and has been used therapeutically as a ventilatory stimulant for primary hypoventilation (59). Its maximal effect is delayed several days. Conversely, testosterone blunts CO2 responsiveness (60). Newer drugs touted to selectively improve alertness (e.g., modafinil, atomoxetine) may prove useful when somnolence contributes to hypoventilation.
References
1. Weibel ER. Morphometry of the Human Lung. Berlin: Springer; 1963.
2. Nunn JF. Applied Respiratory Physiology. 3rd ed. London: Butterworths; 1987.
3. Macklem PT, Wilson NJ. Measurement of intrabronchial pressure in man. J Appl Physiol. 1965;20:653–663.
4. Glazier JB, Hughes JM, Maloney JE, et al. Vertical gradient of alveolar size in lungs of dogs frozen intact. J Appl Physiol. 1967;23:694–705.
5. Fraser RG, Paré JA, Paré PD, et al. Diagnosis of Diseases of the Chest. 3rd ed. Philadelphia: Saunders; 1988.
6. Crapo JD, Barry BE, Gehr P, et al. Cell number and cell characteristics of the normal human lung. Am Rev Respir Dis. 1982;126:332–337.
7. Hocking WG, Golde DW. The pulmonary-alveolar macrophage (first of two parts). N Engl J Med. 1979;301:580–587.
8. Hocking WG, Golde DW. The pulmonary-alveolar macrophage (second of two parts). N Engl J Med. 1979;301:639–645.
9. Staub NC. J Pulmonary edema. Physiol Rev. 1974;54:678–811.
10. Dreyfuss D, Saumon G. Ventilator-induced lung injury: lessons from experimental studies. Am J Respir Crit Care Med. 1998;157:294–323.
11. Tobin MJ. Mechanical ventilation. N Engl J Med. 1994;330:1056–1061.
12. Pepe PE, Marini JJ. Occult positive end-expiratory pressure in mechanically ventilated patients with airflow obstruction. The auto-PEEP effect. Am Rev Respir Dis. 1982;126:166–170.
13. Chatburn RL, Primiano FP Jr. A new system for understanding modes of mechanical ventilation. Respir Care. 2001;46:604–621.
14. Loring SH. Mechanics of lungs and chest wall. In: Marini JJ, Slutsky AS, eds. Physiological Basis of Ventilatory Support. New York: Marcel Dekker Inc.; 1998:177–208.
15. Agostoni E, Mead J. Statics of the respiratory system. In: Fenn WO, Rahn H, eds. Handbook of Physiology, Section 3: Respiration. Vol. 1. Washington, D.C.: American Physiological Society; 1964:387–409.
16. Rodarte JH. Lung and chest wall mechanics: basic concepts. In: Scharf SM, Cassidy SS, eds. Heart-Lung Interactions in Health and Disease. New York: Marcel Dekker; 1989:221–242.
17. DeTroyer A, Loring SH. Actions of the respiratory muscles. In: Roussos C, Macklem PT, eds. The Thorax. 2nd ed. New York: Marcel Dekker Inc; 1994:535–563.
18. Vassilakopoulos T, Zakynthinos S, Roussos C. Muscle function: basic concepts. In: Marini JJ, Slutsky AS, eds. Physiological Basis of Ventilatory Support. New York: Marcel Dekker Inc.; 1998:103–152.
19. Roussos C, Macklem PT. The respiratory muscles. N Engl J Med. 1982;307:786–797.
20. Sharp JT, Barrocas M, Chokroverty S. The cardiorespiratory effects of obesity. Clin Chest Med. 1980;1:103–118.
21. Otis AB, Fenn WO, Rahn H. Mechanics of breathing in man. J Appl Physiol. 1950;2:592–607.
22. Mead J. Mechanical properties of lungs. Physiol Rev. 1961;41:281–330.
23. Baydur A, Behrakis PK, Zin WA, et al. A simple method for assessing the validity of the esophageal balloon technique. Am Rev Respir Dis. 1982;126:788–791.
24. Marini JJ, Tyler ML, Hudson LD, et al. Influence of head-dependent positions on lung volume and oxygen saturation in chronic air-flow obstruction. Am Rev Resp Dis. 1984;129(1):101–105.
25. Tobin MJ. Breathing pattern analysis. Intensive Care Med. 1992;18:193–201.
26. Fowler WS. The respiratory dead space. Am J Physiol. 1948;154:405–416.
27. Hyatt RE. Expiratory flow limitation. J Appl Physiol. 1983;55(1 Pt 1):1–7.
28. Sassoon CSH, Mahutte CK. Work of breathing during mechanical ventilation. In: Marini JJ, Slutsky AS, eds. Physiological Basis of Ventilatory Support. New York: Marcel Dekker Inc.; 1998:261–310.
29. Tobin MJ. Respiratory monitoring in the intensive care unit. Am Rev Respir Dis. 1988;138:1625–1642.
30. Otis AB. The work of breathing. In: Fenn WO, Rahn H, eds. Handbook of Physiology, Section 3: Respiration. Vol. 1. Washington, D.C.: American Physiology Society; 1964:463–476.
31. Aubier M, Viires N, Syllie G, et al. Respiratory muscle contribution to lactic acidosis in low cardiac output. Am Rev Respir Dis. 1982;126:648–652.
32. Kimball WR, Leith DE, Robins AG. Dynamic hyperinflation and ventilator dependence in chronic obstructive pulmonary diseases. Am Rev Respir Dis. 1982;126:991–995.
33. Hoffman RA, Ershowsky P, Krieger BP. Determination of auto-PEEP during spontaneous and controlled ventilation by monitoring changes in end-expiratory thoracic gas volume. Chest. 1989;96:613–616.
34. Otis AB, McKerrow CB, Bartlett RA, et al. Mechanical factors in distribution of pulmonary ventilation. J Appl Physiol. 1956;8:427–443.
35. Permutt S, Howell JB, Proctor DF, et al. Effect of lung inflation on static pressure-volume characteristics of pulmonary vessels. J Appl Physiol. 1961;16:64–70.
36. West JB, Dollery CT, Naimark A. Distribution of blood flow in isolated lung: Relation to vascular and alveolar pressures. J Appl Physiol. 1964;19:713–724.
37. Albert RK, Lakshminarayan S, Charan NB, et al. Extra-alveolar vessel contribution to hydrostatic pulmonary edema in in situ dog lungs. J Appl Physiol. 1983;54(4):1010–1017.
38. Riley RL, Cournand A. Analysis of factors affecting partial pressures of oxygen and carbon dioxide in gas and blood of lungs: theory. J Appl Physiol. 1951;4:77–101.
39. Peake MD, Harabin AL, Brennan NJ, et al. Steady-state vascular responses to graded hypoxia in isolated lungs of five species. J Appl Physiol. 1981;51(5):1214–1219.
40. Peck WW, Slutsky RA, Hackney DB, et al. Effects of contrast media on pulmonary hemodynamics: comparison of ionic and nonionic agents. Radiology. 1983;149:371–374.
41. Sastry BK. Pharmacologic treatment for pulmonary arterial hypertension. Curr Opin Cardiol. 2006;21(6):561–568.
42. Mead J, Whittenberger JL. Physical properties of human lungs measured during spontaneous respiration. J Appl Physiol. 1953;5:779–796.
43. Grassino AE, Roussos C, Macklem PT. Static properties of the chest wall. In: Crystal RG, West JB, et al., eds. The Lung: Scientific Foundations. New York: Raven Press; 1991:855–867.
44. Forster RE. Diffusion of gases across the alveolar membrane. In: Handbook of Physiology. Section 3. Washington, DC: American Physiological Society; 1987.
45. West JB. The physiologic basis of high-altitude diseases. Ann Int Med. 2004;141(10):789–800.
46. Pontoppidan H, Geffin B, Lowenstein E. Acute respiratory failure in the adult. Parts 1-3. N Engl J Med. 1972;287(14):690–698,743–752, 799–806.
47. Deneke SM, Fanburg BL. Normobaric oxygen toxicity of the lung. N Engl J Med. 1980;303(2):76–86.
48. Dantzker DR, Brook CJ, Dehart P, et al. Ventilation-perfusion distributions in the adult respiratory distress syndrome. Am Rev Resp Dis. 1979;120(5):1039–1052.
49. Corey HE. Stewart and beyond: new models of acid-base balance. Kidney Int. 2003;64(3):777–787.
50. Severinghaus JW. Simple, accurate equations for human blood O2 dissociation components. J Appl Physiol. 1979;46:599–602.
51. Ivanov SD, Nunn JF. Influence of duration of hyperventilation on rise time of P-CO2 after step reduction of ventilation. Respir Physiol. 1968;5(2):243–249.
52. Kafer ER, Sugioka K. Respiratory and cardiovascular responses to hypoxemia and the effects of anesthesia. Intl Anesthesiol Clin. 1981;19(3):85–122.
53. Kellum JA. Clinical review: reunification of acid-base physiology. Crit Care. 2005;9(5):500–507.
54. Younes M, Georgopoulos D. Control of breathing relevant to mechanical ventilation. In: Marini JJ, Slutsky AS, eds. Physiological Basis of Ventilatory Support. New York: Marcel Dekker Inc.; 1998:1–74.
55. Bisgard GE, Busch MA, Forster HV. Ventilatory acclimatization to hypoxia is not dependent on cerebral hypocapnic alkalosis. J Appl Physiol. 1986;60(3):1011–1015.
56. Weinhouse GL, Schwab RJ. Sleep in the critically ill patient. Sleep. 2006;29(5):707–716.
57. Phillips B. Sleep, sleep loss, and breathing. Southern Med J. 1985;78(12):1483–1486.
58. Skatrud JB, Dempsey JA. Interaction of sleep state and chemical stimuli in sustaining rhythmic ventilation. J Appl Physiol. 1983;55:813–822.
59. Sutton FD Jr, Zwillich CW, Creagh CE, et al. Progesterone for outpatient treatment of Pickwickian syndrome. Ann Int Med. 1975;83(4):476–479.
60. Matsumoto AM, Sandblom RE, Schoene RB, et al. Testosterone replacement in hypogonadal men: effects on obstructive sleep apnoea, respiratory drives, and sleep. Clin Endocrinol. 1985;22(6):713–721.