Michael Schlame
Thomas J. J. Blanck
Structure of the Heart
Structure of Cardiac Myocytes
Cardiac myocytes are the main cell type of cardiac tissue (1). They have two important functions: (a) to contract in response to an electrical stimulus and (b) to pass the electrical stimulus on to neighboring cells. The simultaneous performance of these two activities requires a highly specialized array of intracellular membranes and contractile elements. Cardiac myocytes are distinct in many ways from skeletal muscle cells. For instance, cardiac myocytes are approximately 10 to 15 µm in diameter and about 50 µm long, which is only a fraction of the size of skeletal myocytes, which may extend up to several centimeters.
Cardiac myocytes are surrounded by the sarcolemma, a specialized plasma membrane that harbors the pumps responsible for ion exchange between the intracellular and the extracellular space (see section 2). The sarcolemma not only lines the surface of the cardiac myocyte, but it also forms a series of tubular invaginations, so-called T tubules (transverse tubules). These tubules effectively increase the surface area of the cell and bring the extracellular environment into close proximity of intracellular structures. T tubules are rich in L-type calcium channels, so that extracellular calcium gets delivered rapidly into the core of the cell.
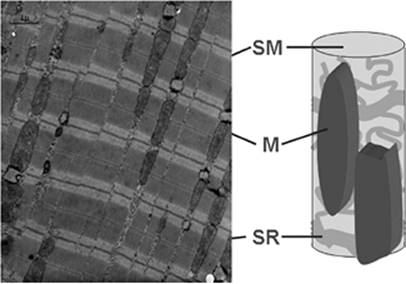
Cardiac myocytes contain a number of organelles in specific spatial arrangement. These organelles include sarcomers, mitochondria, the sarcoplasmic reticulum, the nucleus, and the Golgi apparatus. Sarcomeres (about 50% of cell volume) and mitochondria (30% to 40% of cell volume) are the dominant components of cardiac myocytes (Fig. 45.1). These two organelles are responsible for contraction and supply of energy, respectively. It is therefore not surprising that the majority of inborn cardiomyopathies are caused by defects in either of these structures. The cardiac sarcomere consists of (a) actin filaments, built from actin monomers with associated troponin and tropomyosin; and (b) myosin filaments (see section 3). The sarcomere structure of the heart is similar to that of the skeletal muscle. Between the sarcomere bundles, mitochondria form elongated sacs, which are oriented parallel to the sarcomeres, reflecting a close spatial relationship between intracellular energy supply and energy consumption.
The sarcoplasmic reticulum is a network of tubes and cysts, spreading throughout the cell. Together with the T tubules, the sarcoplasmic reticulum accounts for about 2% of the cellular volume. The cisternal parts of the sarcoplasmic reticulum lie in close apposition to the T tubules. The two structures interact closely in order to generate cyclic changes in the calcium concentration. These signaling events are triggered by the depolarization-induced influx of calcium through the T tubules, which causes a second wave of massive release of calcium from the sarcoplasmic reticulum (see section 2).
Finally, cardiac myocytes contain a nucleus that accounts for about 5% of the cell volume. The nucleus is localized in the center of the cell and is associated with the rough endoplasmic reticulum, where the synthesis of proteins takes place. Some of the proteins are then processed in the Golgi apparatus, which is also associated with the endoplasmic reticulum.
Cardiac myocytes form a functional syncytium in which cells act in concert, both mechanically and electrically. This aspect requires sophisticated communication between cardiac myocytes at the intercalated discs, a specialized portion of the sarcolemma where individual cells make contact with each other. Intercalated discs send processes deep into the neighboring cell, which creates an interdigitating junction with a large surface area. Mechanical cooperation between cells is provided by specific anchor sites for actin filaments and by spot desmosomes that allow actin filaments to run from one cell to another. Electrical cooperation between cells is provided by gap junctions that contain microchannels. Gap junctions allow the passage of ions and small molecules between adjacent myocytes.
The above discussion applies mostly to the prototype of cardiac myocytes located in the ventricular myocardium. However, the heart contains three modifications of this prototype: (a) atrial cardiomyocytes located in the right and left atrium, (b) pacemaker cells located in the sinoatrial and atrioventricular nodes, and (c) Purkinje cells located in the Tawara branches. Atrial cardiomyocytes are smaller than ventricular cardiomyocytes (about 20 µm long and 5 µm in diameter) and they are elliptical in shape. They have a lesser concentration of T tubules than ventricular cells, but many more intercellular connections, both end to end and side to side, in order to spread the electrical impulse rapidly. Pacemaker cells have the ability to generate an action potential, and Purkinje cells have the ability to transmit this action potential with high speed. Both pacemaker and Purkinje cells are myocytes in principle, but they have specialized electrical properties. On the other hand, atrial and ventricular myocytes have specialized mechanical properties, but they also have the ability to generate and propagate action potentials.
Gross Anatomy of the Heart
The human heart is a four-chamber pump that ejects blood by rhythmic contractions (Fig. 45.2). Two thick-walled chambers, the left and the right ventricles, drive the systemic and pulmonary circulation. Two thin-walled chambers, the left and the right atria, eject blood into the respective ventricles at the end of their relaxation phase. Thus, atrial systole occurs during ventricular diastole and vice versa. Although atrial contractions may contribute up to 20% of the cardiac output by increasing ventricular filling, it is, in principle, dispensable, and the heart may function as a two-chamber pump in patients with atrial fibrillation or atrial asystole. In order to generate unidirectional blood flow, valves are positioned at the outflow orifices of each chamber. The atrioventricular valves (tricuspid and mitral) are located between atria and ventricles, whereas the semilunar valves (aortic and pulmonic) are located between ventricles and main arteries. As a result, the ventricles may close alternatively their inflow and outflow tract, but atria close their outflow tract only. For this reason, partial reversal of blood flow may occur in patients with atrioventricular (AV) valve regurgitation or in patients with untimely atrial contraction (atrial flutter, junctional rhythm).
|
|
|
Figure 45.1. Internal structure of cardiomyocytes. The electron micrograph shows sarcomers (SMs) and mitochondria (M), the dominant intracellular organelles. Sarcomers form rods, which are surrounded by a web of sarcoplasmic reticulum (SR). Sarcomers and mitochondria are oriented in parallel. |
The left ventricle has the shape of a conic cylinder that contracts by shortening both its long axis and its diameter (Fig. 45.3). As it connects the left atrium with the aortic root, it has to pump blood against a large pressure gradient. The left ventricle is the actual generator of blood pressure and is the main engine of blood flow. In extreme cases, such as in patients with Fontan correction of congenital defects, the entire circulation may be driven by a single left-type ventricle (2). The ventricular wall consists of three distinct layers of tissue: the endocardium, the myocardium, and the epicardium (3). The endocardium is endothelial tissue that lines the ventricular cavity. It covers the inside of the myocardium, including the beamlike projections of the myocardium in the ventricle called trabeculae. The myocardium is the middle layer that contains the contractile cardiac myocytes. The myocardium makes up most of the ventricular wall, which is about 1 cm thick. The outside of the myocardium is covered by epicardium. The space between epicardium and myocardium contains coronary blood vessels and some fat tissue.
|
|
|
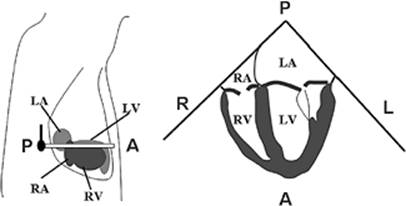
Figure 45.2. Four-chamber view of the heart by transesophageal echocardiography. The left drawing shows the orientation of the echo beam relative to the four heart chambers. The right drawing shows the four chambers in the echocardiographic image. LA, left atrium; RA, right atrium; LV, left ventricle; RV, right ventricle; A, anterior; P, posterior; R, right; L, left. |
|
|
|
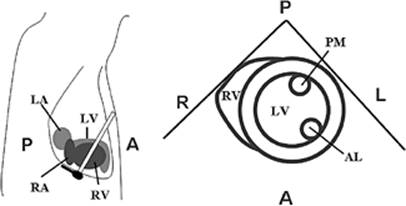
Figure 45.3. Transgastric view of the left ventricle. The left drawing shows the orientation of the echo beam relative to the heart chambers. The right drawing shows the two ventricles in the echocardiographic image. LV, left ventricle; RV, right ventricle; AL, anterolateral papillary muscle; PM, posteromedial papillary muscle; A, anterior; P, posterior; R, right; L, left. |
The right ventricle has a more complex geometry than the left ventricle (Fig. 45.4). It consists of a trabeculated inflow tract and a nontrabeculated outflow tract, both of which are separated by a small muscle bundle, called the crista supraventricularis (4). Blood flows downward into the inflow tract, which also contains the papillary muscles of the tricuspid valve, and then upward into the outflow tract, and through the pulmonic valve. The wall of the right ventricle is thinner and more compliant than the wall of the left ventricle. Therefore, the right ventricle may accommodate an increase in blood volume with little change in end-diastolic pressure.
|
|
|
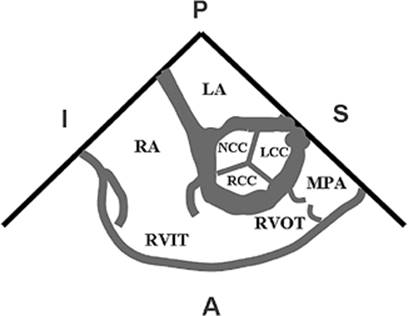
Figure 45.4. Echocardiographic view of the right ventricle. It is divided into a right ventricular inflow tract (RVIT) and a right ventricular outflow tract (RVOT). In this view, the right ventricle wraps around the aortic valve, of which all three cusps are seen in cross section. LCC, left coronary cusp; RCC, right coronary cusp; NCC, noncoronary cusp; LA, left atrium; RA, right atrium; MPA, main pulmonary artery; A, anterior; P, posterior; I, inferior; S, superior. |
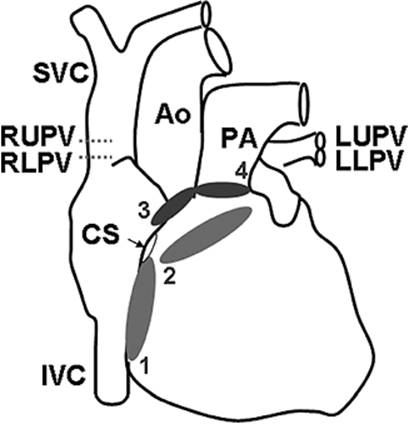
The right and left atria are the receiving chambers of the heart. They are functional extensions of the large veins and have a muscular wall that is 2 to 3 mm thick. The right atrium is located superior and medial to the right ventricle. It receives blood from the superior vena cava, the inferior vena cava, and the coronary sinus. The left atrium is located superior and posterior to the left ventricle. It receives blood from four pulmonary veins that enter the posterior wall of the left atrium in the left inferior, left superior, right inferior, and right superior position (Fig. 45.5). Atria have trabeculated auricular appendages of variable size. These appendages may become the site of blood clot formation.
The atrioventricular valves originate from connective tissue rings located at the atrioventricular junction. The valves are formed from endocardial tissue flaps that grow into the lumen of the junction. The free edges of the flaps are anchored to papillary muscles of the ventricular myocardium via chordae tendineae. The right-sided tricuspid valve has three flaps (anterior, posterior, and septal), whereas the left-sided mitral valve has only two (anterior and posterior). The semilunar valves are derived from the same connective tissue ring as the atrioventricular valves. However, they have a smaller orifice and smaller, semi-lunar cusps that grow into the lumen of the main arteries. These cusps close the valvular orifice if there is sufficient back pressure from the arterial side. The three cusps of the pulmonic valve are positioned anterior, left, and right. The three cusps of the aortic valve are referred to as left coronary, right coronary, and noncoronary. The aortic valve is tilted about 40 degrees to the horizontal plane. The pulmonic valve is oriented near perpendicularly to the aortic valve.
|
|
|
Figure 45.5. Veins and arteries of the four heart chambers. Superior vena cava (SVC), inferior vena cava (IVC), and coronary sinus (CS) empty into the right atrium. Left upper (LU), left lower (LL), right upper (RU), and right lower (RL) pulmonary veins (PVs) empty into the left atrium. The aorta (Ao) receives blood from the left ventricle and the pulmonary artery (PA) receives blood from the right ventricle. The positions of the four heart valves are shown in anteroposterior projection: 1, tricuspid valve; 2, mitral valve; 3, aortic valve; 4, pulmonic valve. |
|
|
|
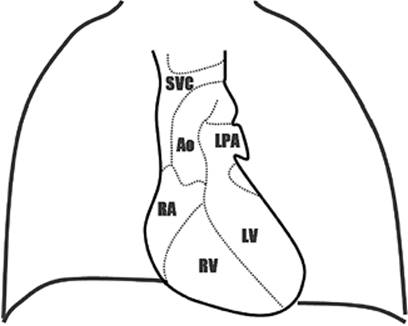
Figure 45.6. Anteroposterior projection of the cardiac silhouette on x-ray film of the chest. SVC, superior vena cava; RA, right atrium; Ao, aorta; LPA, left pulmonary artery; RV, right ventricle; LV, left ventricle. |
Critically ill patients are routinely followed by serial radiographic studies of the chest. The anteroposterior projection of the cardiac silhouette on radiographs may yield specific information about the structures that contribute to the silhouette borders (Fig. 45.6). The right border of the silhouette is formed by the superior vena cava and the right atrium. The left border is formed by the aortic arch, the left pulmonary artery, and the left ventricle.
Pacemakers and Conduction System
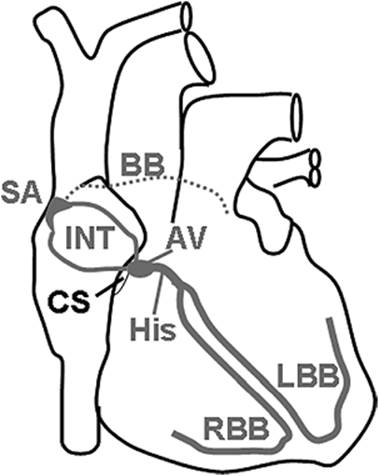
As mentioned in section 1.1, the heart contains a group of specialized cardiac myocytes with pacemaker activity and high conductivity, but with virtually no contractile function. These cells are distributed throughout the heart via the so-called conduction system that stretches from the junction of the superior vena cava all the way to the apex of the heart, and from there into the working myocardium of both ventricles (Fig. 45.7). The conduction system includes the sinoatrial node, the atrial conduction pathways, the atrioventricular node, the bundle of His, left and right bundle brunches, and the Purkinje system (3).
The sinoatrial node is located at the junction of the right atrium and the superior vena cava. The node is 4 × 20 mm in size, and contains a collection of specialized cardiac myocytes with very dependable automaticity. The ability of these cells to depolarize spontaneously in short constant time intervals makes them the physiologic pacemaker, silencing all other potential centers of automaticity in the heart. The rate of depolarization of the sinoatrial node is under control of the autonomic nervous system (see section 2). Parasympathetic impulses from the vagus nerve (cranial nerve X) decrease the rate of depolarization, whereas sympathetic impulses from accelerator fibers (originating from ventral roots T1-T4) increase the rate of depolarization.
|
|
|
Figure 45.7. Major pathways of the cardiac conduction system. SA, sinoatrial node; INT, internodal tracts; BB, Bachmann bundle (connection between left and right atria); AV, atrioventricular node; His, bundle of His; RBB, right bundle branch; LBB, left bundle branch; CS, coronary sinus. |
Because of its anatomic location, the sinoatrial node directly depolarizes the right atrium. In addition, the sinoatrial activity is conducted to the left atrium via the Bachmann bundle. Additionally, internodal conduction pathways exist to facilitate the transmission of electrical impulses from the sinoatrial node to the atrioventricular node. The atrioventricular node is only 2 × 4 mm in size. It is located near the ostium of the coronary sinus on the right side of the central fibrous body that provides the scaffold of the four heart valves at the atrioventricular junction. The atrioventricular node is the main conduction pathway that links atrial and ventricular depolarization. However, additional strands of conducting muscle tissue are sometimes present in normal human hearts and may become functionally active under pathologic conditions (e.g., pre-excitation syndromes). Like the sinoatrial node, the atrioventricular node has the ability to depolarize spontaneously, but its activity is normally suppressed by the sinoatrial node because the latter fires at a much higher rate. Nevertheless, the atrioventricular node may become the dominant pacemaker in patients with sinus node dysfunction (junctional heart rhythm).
The atrioventricular node transmits the depolarization wave to the bundle of His, a 20-mm-long array of fibers that extends from the node posteriorly and inferiorly into the interventricular septum. The conduction of impulses through the atrioventricular node is delayed in order to allow enough time between atrial and ventricular systole. This delay also limits the number of impulses that can be transmitted to the ventricles, so that patients with atrial fibrillation do not develop life-threatening ventricular fibrillation. The bundle of His penetrates the central fibrous body between the tricuspid, mitral, and aortic valves. It divides at the top of the interventricular septum into the right and left bundle branches. The bundle branches travel downward in the interventricular septum toward the papillary muscles. They connect to the Purkinje system, which activates the ventricular myocardium.
Coronary Perfusion
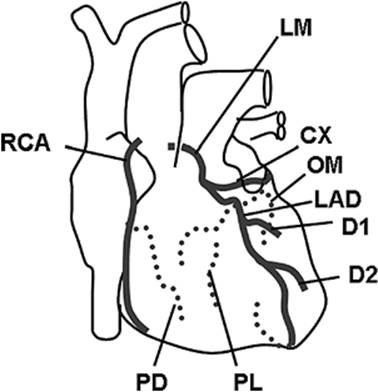
Blood is supplied to the heart through the right and left main coronary arteries, which arise from ostia located near the top of the sinus of Valsalva (Fig. 45.8). The left coronary artery divides after a 2- to 10-mm course into the left anterior descending artery and the circumflex artery. The left anterior descending artery gives off two diagonal branches, and supplies primarily the left ventricle and the interventricular septum as well as a small portion of the anterior wall of the right ventricle next to the septum (Table 45.1). The circumflex artery travels posteriorly around the heart and supplies the left atrium and the left ventricle. In 10% to 15% of patients, the circumflex artery continues as the posterior descending artery (left dominant coronary circulation). In these cases, the circumflex artery is the main blood supply to the inferior wall of the left ventricle, the posterior third of the interventricular septum, and the atrioventricular node. However, in 85% to 90% of patients, these structures are supplied by the right coronary artery (right dominant coronary circulation). In addition, the right coronary artery supplies the right atrium and most of the right ventricle. The right coronary artery delivers blood to the sinoatrial node in 50% to 60% of patients. In all others, the sinoatrial node is supplied by the circumflex artery.
|
|
||||||||||
|
Figure 45.8. Coronary arteries. Dotted lines are on the posterior aspect of the heart. LM, left main coronary artery; CX, circumflex artery; OM, obtuse marginal artery; LAD, left anterior descending artery; D1, first diagonal artery; D2, second diagonal artery; PL, posterolateral artery; RCA, right coronary artery; PD, posterior descending artery. |
||||||||||
|
Table 45.1 Coronary blood supply |
||||||||||
|
||||||||||
Venous return of coronary blood occurs mostly through the large coronary sinus that enters the right atrium through its posterior wall. Blood coming from the anterior wall of the right ventricle may also drain directly into the right atrium via a variable number of anterior right ventricular veins. In addition, there are tiny venous outlets, called thebesian veins that drain blood directly into the four heart chambers. The thebesian veins of the left atrium and the left ventricle contribute to physiologic right-to-left shunting.
Coronary blood flow equals coronary perfusion pressure divided by coronary vascular resistance. Since intramural pressure in the ventricular wall usually exceeds venous pressure, the coronary perfusion pressure is the difference between the pressure in the aortic root and the pressure in the ventricles. During systole, when left ventricular pressure approaches aortic pressure, the left ventricle becomes largely cut off from the blood supply. Thus, left ventricular blood flow is unique in that it is intermittent rather than continuous. In contrast, blood flow to the right ventricle and the atria is more continuous.
Coronary blood flow is strictly controlled by autoregulatory changes in coronary vascular resistance. Coronary arteries dilate in response to increased metabolic demand. The mechanism by which coronary resistance changes is complex, involving an array of signals, such as adenosine, prostaglandins, protons, carbon dioxide, oxygen, and nitric oxide. For instance, adenosine, a powerful vasodilator, may be secreted by cardiac myocytes that surround the small arteries and arterioles of the coronary circulation. However, small arteries and arterioles are also innervated by the sympathetic nervous system, which adds extrinsic control to the autoregulatory mechanisms. Sympathetic control may involve both constriction of blood vessels via α1 receptors and dilation of blood vessels via β2 receptors. Coronary constriction appears to be important in equalizing blood flow through the layers of the heart (1).
Electrical Cycle of the Heart
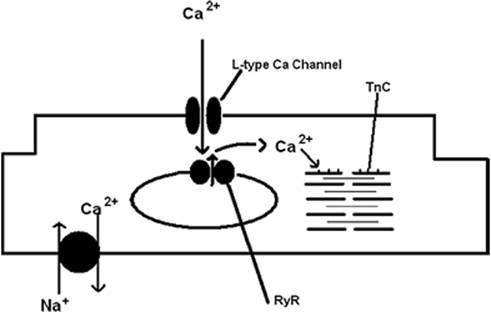
The electrical cycle of the heart derives from the excitable nature of each cardiac myocyte. These are typical cells that have become specialized in two major ways: (a) to transmit electrical signals and (b) to transduce that electrical signal into a mechanical function, contraction (Fig. 45.9). We will first examine the excitable characteristics of the individual cardiac myocyte.
|
|
|
Figure 45.9. A schematic representing a cardiac myocyte demonstrating a few of the important Ca2+ regulatory sites. TnC represents troponin C and RyR represents the ryanodine receptor. |
Resting Membrane Potential
As already discussed above, the cardiac myocyte is engulfed by a plasma membrane called the sarcolemma, which ensures the separation of the intracellular from the extracellular environment. The sarcolemma is a lipid bilayer with many voltage- and ligand-gated ion channels and other pumps, transporters, and receptors that allow the cell to fulfill its excitable function. The most significant elements of the sarcolemma that allow the electrical signals to be both generated and transmitted are the voltage-gated ion channels, the Na+–Ca2+ exchanger and the Na+-K+-ATPase electrogenic pump. While every cell has a membrane potential, the factor that makes cardiac cells, and other excitable cells such as neurons, unique is the high density of voltage-gated ion channels. However, unlike other excitable cells, intercalated discs and their imbedded gap junctions allow the conduction of an electrical impulse between adjacent cardiac myocytes.
The cardiac myocyte has an electrical cycle that lasts from 500 to 800 msec, while the action potential (AP) is 300 msec or less (5). Therefore, there is a significant period of time when the cardiac myocyte is at “rest.” At rest, the myocyte is relaxed and is maintained at its resting membrane potential, Em. The resting membrane potential results from the open K+ channels in the sarcolemma and the small “leak” of Na+ through the sarcolemma. The resting membrane potential is described by the Nernst equation, which takes into account the permeability of the sarcolemma and its ion gradients. Since K+channels are the only open channels at rest, the resting membrane potential is strongly dependent on the intra- and extracellular K+ gradient.
EK = 61.54 log10 ([K+]o/[K+]i
EK is the potential due to the K+ gradient, [K+]o is the extracellular K+ concentration, [K+]i is the intracellular K+ concentration, and 61.54 is a conversion factor (2.303 × RT/zF), which includes z, the valence of K+; F, the Faraday constant; R, the gas constant; the body temperature in Kelvin; and 2.303, the factor to transform a natural log into a logarithm to the base 10. Depending on the values used for extra- and intracellular K+, the resting membrane potential is calculated to be between -80 and -90 mV. Since the sarcolemma is not completely impermeable to all ions, ion gradients and the resulting membrane potential would ultimately dissipate if the Na+-K+-ATPase pump were not able to maintain the K+ gradient. The Na+-K+-ATPase pump hydrolyzes adenosine triphosphate (ATP) to adenosine diphosphate (ADP) in order to eliminate three Na+ from the cell for every two K+ that are pumped into the cell until electrical and chemical energy is balanced, resulting in a resting membrane potential of approximately -85 mV for cardiac myocytes.
Action Potential
Within the sinoatrial (SA) node are pacemaker cells that contain few contractile elements, but have the important characteristics of spontaneous diastolic depolarization. The pacemaker cells undergo a gradual depolarization from their “resting” membrane potential of -65 mV to approximately -40 mV, which is the threshold at which an action potential is initiated.
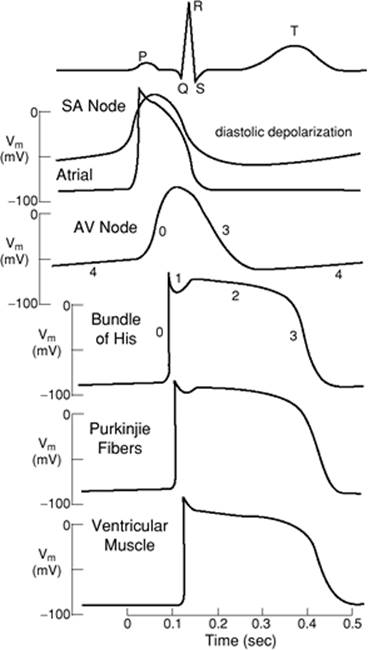
The action potential is a regenerative all-or-none event that occurs when the membrane potential depolarizes to a level where a sufficient number of ion channels open, leading to an inward current that can begin a positive feedback loop (6). The predominant ion channels responsible for the action potential in the SA node pacemaker cells are T- and L-type Ca2+ channels. The T- and the L-type channels activate and inactivate ten times more slowly than Na+ channels and provide the broader profile of the SA and AV nodal AP, as well as the long plateau, which is evident in the AP of both the atrial and ventricular cardiac myocyte (Fig. 45.10). The dependence on Ca2+ as the depolarizing current makes the SA and AV nodes particularly sensitive to pharmacologic manipulation with Ca2+ channel blockers.
The configuration of the SA node AP is markedly different from that in the atrial and ventricular cardiac myocytes, where voltage-gated Na+ channels predominate and provide the major fast inward current responsible for depolarization. Figure 45.10 provides examples of the action potentials from the SA node through the atria and the AV node down the bundle of His and Purkinje fibers into the ventricle. As can be seen, the rate of depolarization in the SA and AV nodes is considerably slower than in the rest of the heart. The reversal of the depolarization of the SA nodal pacemaker cells results at the peak of depolarization, with opening of delayed rectifier K+ channels that provide the outward positive current to nullify the previous influx of positive ions, leading to repolarization of the cell.
|
|
|
Figure 45.10. The surface electrocardiogram at the top of the figure and the action potential profiles throughout the heart and their temporal relationships to each other. SA, sinoatrial; AV, atrioventricular. (Reused with permission from Lynch C. Cellular electrophysiology of the heart. In: Lynch C, ed. Clinical Cardiac Electrophysiology: Perioperative Considerations. Philadelphia: JB Lippincott; 1994:1.) |
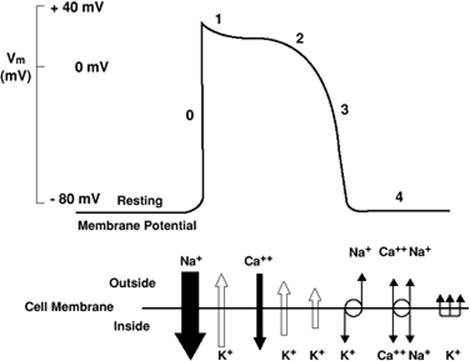
The action potential in ventricular cardiac myocytes has a markedly different time course. As an AP passes from the conduction system to the ventricular cardiac myocytes, the voltage-gated Na+ channels provide the positive inward current that depolarizes the ventricular myocyte. The entry of Na+ is rapid, as can be seen from the fast upstroke of the action potential, which has been named phase 0, and is due in part to the kinetic characteristics of the voltage-gated Na+ channel, which shows rapid activation and rapid inactivation (Fig. 45.11). The membrane potential moves toward the Nernst potential for Na+, ENa+. Phase 1 describes the notch in the AP that is seen at the initial reversal of the depolarization and is due to Na+ channel inactivation and the transient outward flow of K+ and inward flow of Cl-. However, at this time, complete repolarization is delayed due to the opening of L-type voltage-gated Ca2+ channels, allowing the influx of Ca+—important for contraction—and resulting in a plateau of the AP, known as phase 2. At the plateau, the membrane potential is held near 0 mV for about 100 msec, which leads to the activation of an outward K+ current. Phase 3 describes the termination of the AP and the repolarization of the cell with the outflow of K+ ions due to the opening of K+ channels contributing to the delayed rectifier K+ current. At phase 4, the cell has returned to its resting membrane potential, reestablishing its ion gradients with the activity of the Na+-K+-ATPase pump and the Na+–Ca2+ exchanger.
Autonomic Control of the Cardiac Electrical Activity
The autonomic nervous system plays a major role in controlling the initiation of the heart beat and the rate of pacemaker firing. Both parasympathetic and sympathetic nervous inputs converge on the SA and AV nodal cells, exerting opposite influences on heart rate (7).
|
|
|
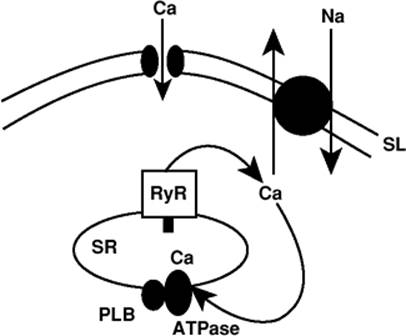
Figure 45.11. Proposed model of sarcoplasmic reticulum (SR) Ca2+ transport as a cardiac pacemaker. After a normal Ca2+ release, the SR Ca2+ uptake refills the SR with Ca2+ and triggers, via the ryanodine receptor, a local SR Ca2+ release, which triggers a Na+–Ca2+ exchange current leading to the depolarization of the sinoatrial nodal cell. SL, sarcolemma. (Reused with permission from Bers DM. The beat goes on. Circ Res. 2006;99:921.) |
Parasympathetic
The parasympathetic nervous system contributes nerve fibers from its cranial outflow through the cervical ganglia where preganglionic fibers course down to the cardiac plexus, and from there send postganglionic unmyelinated axons that impinge on the SA and AV nodal cells. The cardiac plexus is divided into a superficial and deep plexus. The superficial plexus is found at the base of the heart at the arch of the aorta, while the deep plexus is found on the anterior aspect of the trachea near its bifurcation. The parasympathetic fibers carried by the vagus nerve are cholinergic and release acetylcholine (ACh) when activated. ACh has three principal actions that result in the slowing of heart rate and a decrease in contractility. ACh activates an outward K+ current, which leads to hyperpolarization and reduction of the slope of the spontaneous diastolic depolarization of SA and AV nodal cells. In atrial cells, the duration of the AP is decreased, leading to a decrease in the atrial filling phase and a consequent decrease in contractility. A third mechanism of inhibition that occurs through ACh synaptic release and muscarinic activation is a decrease in ICa (the entry of calcium into atrial myocytes upon initiation of the action potential), which leads directly to a decrease in atrial contractility (7).
Sympathetic
Sympathetic nervous input to the heart derives from preganglionic neurons in the upper four or five thoracic spinal segments. Axons pass to postganglionic neurons in thoracic and cervical ganglia. The cervical ganglia supply the superior, middle, and inferior cardiac nerves to the cardiac plexus where they meet the thoracic cardiac nerves from the thoracic ganglia. Sympathetic nervous outflow then supplies the pacemaker cells in the SA and AV nodes, the conduction system, and both the atrial and ventricular myocytes. β-Adrenergic activation through the sympathetic input to the heart leads to cardiac acceleration and increased contractility. Norepinephrine is the major adrenergic synaptic mediator in the heart. The action of adrenergic stimulation is relatively simple: To increase the heart rate. The mechanism of this effect, however, is complex. β-Adrenergic stimulation leads to increased activation of If, the inward current that accelerates diastolic depolarization, so that a threshold is reached earlier in the AP, leading to earlier opening of L-type Ca2+ channels, since their threshold is reached sooner. The L-type Ca2+ channel is also activated by β-adrenergic stimulation. The channel is phosphorylated, which results in faster channel opening and more frequent channel openings. Depolarization is thus faster, leading to faster activation of IK and repolarization. The net result is more frequent firing of the AP and a faster heart rate (7).
Recent work has focused on the primacy of Ca2+ in regulating the pacemaker function of the SA node (8,9). Bogdanov et al. (8) have proposed that the ryanodine receptor (RyR) in SA nodal cells is important in regulating the firing rate of the SA node. They have demonstrated that the interaction of the sarcoplasmic reticulum (SR) Ca2+ pump, intraluminal Ca2+, the RyR receptor, and the Na+–Ca+ exchanger can work in concert toward diastolic depolarization and activation of a regenerative AP. Blocking of RyR Ca2+ release limits depolarization, while β-adrenergic stimulation activates the SR Ca2+ pump and RyR gating, resulting in more Ca2+ sparks and faster refiring of APs (Fig. 45.11). While this proposal is new, it certainly broadens the previous view of pacemaker generation and unifies aspects of pacemaker activity and arrhythmia generation.
If both parasympathetic and sympathetic inputs to the heart are totally blocked pharmacologically, the heart rate actually increases, as manifested by the overriding parasympathetic inhibition seen in most individuals (7).
Contraction–Relaxation Cycle of the Heart
Initiating Events
The concerted and synchronous activity of the heart for the approximately 2.5 billion heart beats over a lifetime depends on tight physiologic control; that is, the spontaneous and rhythmic electrical activity of the pacemaker cells must be transformed into regular and synchronized contraction and relaxation. The atrial and ventricular myocytes are designed to provide this contractile function. Each cardiac myocyte transforms electrical activity into a synchronized contraction. The electrical signal is uniformly passed through gap junctions from cardiac myocyte to cardiac myocyte, producing the AP previously described. The unique characteristic of the AP essential for the initiation of the contractile process is the plateau phase (10). The plateau phase, as seen in Figure 45.12, is due to the prolonged opening of the L-type Ca2+ channel, which provides an inward positive current of Ca2+, thus maintaining the depolarization for a prolonged period. The entry of Ca2+ through the L-type channel initiates the sequence of events leading to contraction.
Role of Calcium
As already explained in section 1, the ventricular myocyte has an extensive membranous system called the T tubules that allow the extracellular fluid to invaginate into the central recesses of the cell (Fig. 45.13). Depolarization that occurs with the action potential leads to the opening of L-type Ca2+ channels. The L-type channels are present in the T-tubular structure and are in close apposition to the calcium release channels, known as RyRs, which are located in the SR. Upon depolarization, Ca2+ (ICa) courses through the voltage-gated L-type Ca2+ channels into the cleft that separates the sarcolemma (T tubule) from the SR. The cleft is approximately 10 nm wide. This area of the SR is densely populated with RyRs. The Ca2+ that enters through the L-type channel diffuses through the cleft to activate RyRs, initiating the opening of the RyR and the release of large amounts of Ca2+ from the SR. Although it has yet to be measured, it is estimated that the concentration of Ca2+ reaches several millimolars and subsequently leads to the activation of the myofibrils. This process of depolarization, Ca2+ entry, and subsequent Ca2+ release has been termed Ca2+ sparks. These sparks cause the concerted activation of clusters of RyRs. Since the T tubules and the SR are spread throughout the myocyte (Fig. 45.13), the Ca2+ that is released floods the cell and interacts with the Ca2+-sensitive protein in the myofibrils, troponin C.
|
|
|
Figure 45.12. The ventricular cardiac myocyte action potential (AP). The numbers along the AP indicate the phases of the AP. The lower panel schematically represents the relative quantity and temporal relationship of the ionic movements involved in the AP. SL, sarcolemma; RyR, ryanodine receptor; SR, sarcoplasmic reticulum; PLB, phospholamban. (Reused with permission from Barber MJ. Class I antiarrhythmic agents. In: Lynch C, ed. Clinical Cardiac Electrophysiology: Perioperative Considerations. Philadelphia: JB Lippincott; 1994:85.) |
The activation of contraction is similar in atrial and ventricular myocytes in that depolarization initiates the opening of Ca2+ channels and the entry of Ca2+, but quite different in extent because of the differing architecture of the two types of myocytes (11) (Fig. 45.13). The major difference is that a T-tubular network does not exist in the atrial myocyte, resulting in a markedly different Ca2+ distribution during depolarization between the atrial and ventricular myocyte. In the ventricular myocyte, a T tubule occurs at every Z line and penetrates perpendicularly into the myocyte. In addition, the T tubule has extensive branching but always maintains its intimate relationship to the SR. Furthermore, the SR in the ventricular myocyte forms an intricate network that surrounds the myofibrils, while the SR in the atrial myocyte forms a much simpler and less elaborate network. Hence, in the ventricular myocyte, a depolarization results in Ca2+ entry and release throughout the cell. The Ca2+ profile within the ventricular myocyte is thus homogeneous due to the synchronous recruitment of Ca2+ sparks throughout the cell. The profile in the atrial myocytes is quite different due to the absence of a T-tubular system and the presence of a “Z-tubular” system. The Z tubule is an SR element rather than a sarcolemmal element. The Z tubules are tubular extensions of the SR that are perpendicular to the long axis of the cell and contain RyRs. There are two main RyR populations in the atrial myocyte: one population at the periphery and a second, more extensive population deeper in the atrial myocyte. A depolarization therefore results in a markedly different Ca2+ profile. One observes mainly a rise in Ca2+ around the periphery of the cell and not the homogeneous Ca2+ profile seen throughout the ventricular myocyte.
Depolarization initiates Ca2+ entry. Ca2+ entry initiates large amounts of Ca2+ release from the RyR to initiate contraction. Prior to discussing the elements of contraction, it is important to consider the process of Ca2+ sequestration that completes the excitation–contraction–relaxation process. The SR is an extensive network of tubules and cysts and contains multiple imbedded proteins, but the two most significant are the RyR and the Ca2+ pump, known as the SERCA (sarcoendoplasmic reticulum calcium pump). The SERCA is essential for re-establishing the low concentration of Ca2+ in the cytosol, allowing relaxation to occur. It achieves this by using energy from the hydrolysis of ATP to pump Ca2+ from the cytosol back into the SR. However, one must remember that excess Ca2+ from the extracellular space enters the myocyte upon depolarization, and therefore a second mechanism for Ca2+ removal must exist to re-establish the initial cytosolic Ca2+ concentration. The additional mechanism is the Na+–Ca2+exchanger, a sarcolemmal protein that exchanges three Na+ ions for one Ca2+ ion. Recall that excess sodium is pumped out of the cell by the Na+-K+-ATPase pump.
The SERCA is a pump that is regulated by adrenergic stimulation. The SERCA increases its activity (i.e., its ability to utilize ATP to accumulate Ca2+ within the SR) when exposed to β-adrenergic stimulation (12). Activation of the SERCA occurs through a series of kinases, such as protein kinase C, protein kinase A, and calmodulin-dependent protein kinase, which phosphorylate a protein called phospholamban (PLB). PLB is bound to the SERCA in its unphosphorylated form and inhibits pump activity. β-Adrenergic stimulation of the heart has three major effects: (a) to enhance tension development, (b) to increase the rate of tension development, and (c) to increase the rate of relaxation. The increased rate of relaxation has been shown to be mainly related to the phosphorylation of PLB. PLB functions as a brake on the SERCA. In knockout mice deficient in PLB, heart rate, contractility, and the rate of relaxation are all markedly enhanced. The SERCA works at a higher frequency in the absence of PLB, resulting in a greater Ca2+ load in the SR, which translates into a positive inotropic effect since there is more Ca2+ available for release from the SR during depolarization. Mutations of PLB have recently been shown in humans to be associated with heart failure, and PLB and its phosphorylation are now considered important potential pharmacologic targets for the treatment of heart failure (13).
|
|
|
Figure 45.13. Comparison of the ventricular and atrial sarcoplasmic reticulum (SR). Note the T-tubular structure in the ventricular myocyte and the marked absence of T tubules in the atrial myocyte. (Reused with permission from Bootman M, Higazi DR, Coombes S, et al. Calcium signaling during excitation-contraction coupling in mammalian atrial myocytes. J Cell Sci. 2006;119:3915.) |
Ca2+ availability is tightly regulated in the myocardial cell because Ca2+ ions are the switch that finally initiates the contractile process. The final step in the Ca2+ cascade is the binding of the Ca2+ that floods the myoplasm to troponin C.
Molecular Interactions
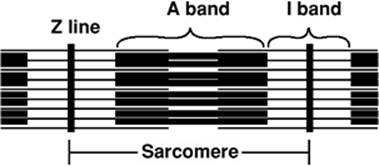
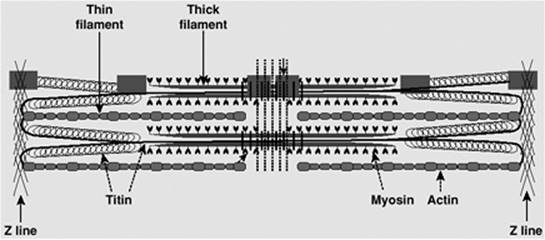
Ca2+ triggers the contractile process by interacting with the Ca2+-binding protein, troponin C, which is an integral part of the sarcomere. The sarcomere is the smallest contractile unit and is defined from Z line to Z line (Fig. 45.14). The myofibrillar structure is made up of interacting filaments, termed thick and thin filaments. The light area adjacent to the Z line consists of thin filaments, which are polymers of actin monomers that are anchored to the Z line. The A band consists of overlapping thick and thin filaments, and the H band in stretched muscle is due to thick filaments alone. The thick filament consists of myosin, a large protein made up of six subunits. Each myosin molecule contains two heavy chains, each of 220 kDa; two essential light chains (MLC1) of about 17 kDa; and two regulatory light chains (MLC2), each more than 20 kDa. The myosin molecule has a unique structure (Fig. 45.15) consisting of a tail area of two long α-helical segments due to the intertwining of heavy chains, a hinge area, and two globular head segments. The heads have a site for actin binding, an ATP binding pocket, and enzymatic ATPase activity. The MLC1 chains are bound to the rodlike neck of the heavy chains, and are believed to mechanically stabilize the myosin heads during force generation. The MLC2 chains are involved in the beat-to-beat tuning of force development. Phosphorylation of MLC2 leads to increased force development and an increased rate of force development, but a slowing of the kinetics of relaxation (14). Beside the thin and thick filament made up of actin and myosin, respectively, a third filament exists, which has been identified and characterized over the last 35 years. That third filament consists of the titin molecule. Titin is a giant endosarcomeric protein that extends from Z line to Z line (15,16) (Fig. 45.16). It has elastic properties that convey passive force to the cardiac myocyte. If a myocyte is stretched beyond overlap of the thick and thin filaments, the restoring force to resting length is provided by titin. In the cardiac myocyte, two isoforms of titin exist (N2B and N2BA), which differ in their extensibility. The N2BA isoform endows the cell with greater compliance. In patients with diastolic dysfunction and diastolic heart failure, the less compliant isoform, N2B, dominates. On the other hand, in patients with systolic heart failure, the more compliant isoform of titin, N2BA, dominates (17). Besides conferring passive tension to the cell, titin also aligns T tubules and the SR within the sarcomere and localizes the myosin thick filaments to a central location within the sarcomere.
|
|
|
Figure 45.14. The sarcomere, the minimal unit of contraction in the cardiac myocyte. The A band demonstrates the overlap of thick and thin filaments. The I band represents the thin filaments anchored to the Z line. |
|
|
|
Figure 45.15. A schematic of the myosin molecule. A two-headed molecule with a flexible neck and an α-helical tail. The head contains a binding site for adenosine triphosphate. The head and neck have attached essential and regulatory light chains that are referred to in the text. |
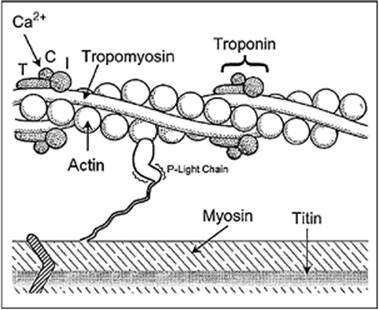
The thin filament consists of individual actin molecules of 43 kDa that combine to form long polymer chains in a double helical array. Interposed at regular spacing along the actin double helix are complexes of tropomyosin (Tm) and troponin (Tn) (Fig. 45.17). Tropomyosin is a linear molecule of approximately 70 kDa that lies in the groove of the actin double helix. Tn is found at the amino terminal end of the Tm molecule. Tn consists of a complex of three protein components: TnT, TnI, and TnC. Each of these components has a unique function essential for the orderly contractile process. TnT contains the binding site for tropomyosin and thus allows the Tn complex to be bound to Tm. TnI is an inhibitory subunit, blocking the interaction of actin with the myosin head and preventing force development. Finally, TnC, the molecular switch that activates contraction, has four Ca2+ binding sites, two of which are always occupied, even at a resting cytosolic Ca2+ concentration of 100 to 150 nM. The other two sites are of lower affinity and only bind Ca2+ when the concentration of Ca2+ is raised following release of Ca2+ from the RyR during the AP. Once the two low-affinity sites are filled with two Ca2+ ions, a conformational change occurs, resulting in a movement of the Tn complex and Tm and activation of the actin–myosin interaction (18).
Cardiac Contraction Cycle
At the molecular level, contraction and force generation occur because of the interaction of the myosin head with actin.
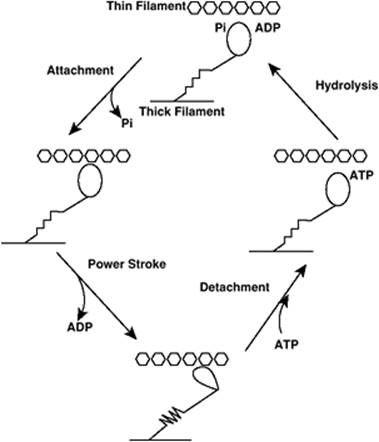
That interaction involves ATP binding and hydrolysis to form ADP, and the formation of a high-energy Pi intermediate at the myosin head (Fig. 45.18). Upon attachment of the head to actin, Pi is released, followed by release of ADP; the “power stroke” occurs wherein the myosin head changes conformation, pulling the thin filament toward the Z line. ATP then binds to a myosin head, leading to detachment of actin and myosin. ATP is hydrolyzed, forming the Pi intermediate and the ADP myosin complex, allowing reattachment to another site on the actin filament, since the relative position of myosin to actin has changed (19).
|
|
|
Figure 45.16. A representation of the sarcomere, demonstrating the essential role of the titin molecule in anchoring the thick filament to the Z line. (Reused with permission from Katz AM, Zile MR. New molecular mechanism in diastolic heart failure. Circulation. 2006;113:1922.) |
|
|
|
Figure 45.17. Schematic representation of protein interactions comprising the contractile apparatus in the cardiac myocyte. (Reused with permission from Ruegg JC. Cardiac contractility: how calcium activates the myofilaments. Naturwissenschaften. 1998;85:575.) |
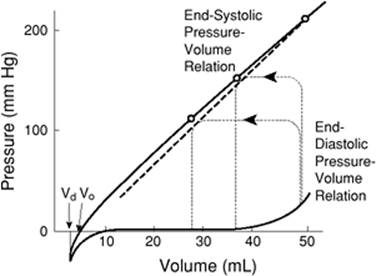
Two processes control contractility in the cardiac myocyte: (a) the length of the sarcomere and (b) the intrinsic contractility of the contractile elements. It was not until after 1950 that this latter phenomenon was first appreciated (20). The measurement of contractility in vivo has neither been easy nor satisfactory to accomplish. Several indices of contractility have been developed, but they usually require a great deal of technical expertise and invasive monitoring. Positive peak dP/dt, the time differential of ventricular pressure, has been employed as a simple index of contractile function. In order to appropriately measure it, a high fidelity micromanometer needs to be inserted into the left or right ventricle. While dP/dt is a simple concept, it is technically challenging to obtain, and is clearly dependent on preload, afterload, and heart rate. A further measure of contractility is the end-systolic pressure–volume relationship (ESPVR) (21). As can be seen in Figure 45.19, pressure volume loops may be generated at different ventricular volumes, and the slope of the line connecting the point of end systole on a family of loops gives a measure of contractility. However, even this measurement of contractility has been shown to yield inconsistent results (22).
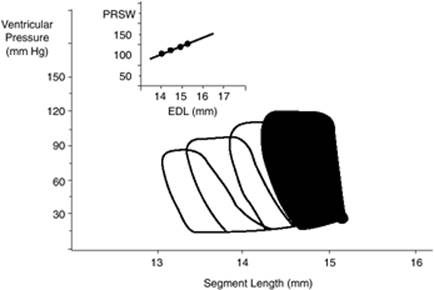
Currently, the measure of contractility that appears most reliable and consistent is the preload recruitable stroke work (PRSW) relationship. First proposed by Sarnoff and Berglund in 1954 (23), PRSW has been proven to have a linear relationship to the end-diastolic volume (24). This index of contractility has survived two decades of investigation and appears to reliably measure contractility despite changes in preload and afterload. The PRSW is obtained from the integrals of a family of pressure–volume loops, the measure of stroke work (SW), at varying end-diastolic volumes (EDVs) (25) (Fig. 45.20). The relationship is quantified by the following equation:
SW = M_W × (EDV - VW)
where MW is the slope and VW is the volume axis intercept (26).
|
|
|
Figure 45.18. Schematic of the contractile cycle of the actin–myosin interaction. Energy for contraction is provided by adenosine triphosphate (ATP). The myosin head contains enzymatic ATPase activity. When ATP is hydrolyzed, a high-energy phosphate intermediate (Pi) is formed on the myosin head. The dissociation of Pi leads to attachment of actin to myosin, and adenosine diphosphate (ADP) dissociation is associated with the actin–myosin power stroke. |
A plot of the stroke work as a function of end-diastolic volume or end-diastolic segment length (EDL) then yields a straight line, with MW representing a measure of contractility. This index of contractility has been shown to be highly linear and reproducible. A flat slope demonstrates that preload produces little increase in SW, suggesting reduced contractility. On the other hand, an increase in slope suggests an increase in contractility. The difficulty with this relationship is that its measurement requires manipulation of left ventricular (LV) pressure and volume. The majority of measurements in humans have been done during cardiac catheterization. Recent work, however, has resulted in a modification of the techniques required to obtain measurement of PRSW. Studies in canines (27) and humans (26) now show that PRSW and MW can be estimated from a single steady-state beat with either invasive or noninvasive techniques (28). In order to determine single-beat PRSW, the following formula has been derived:
SB MW = SWB/[EDVB - k × EDVB + (1-k) × LVWall
where SWB is stroke work for a single beat, EDVB is the end-diastolic volume, LVWall is the LV wall volume estimated from an echocardiographic LV mass determination, and k is a constant that varies little in healthy and diseased hearts. SWB can be estimated noninvasively from Doppler-derived SV and an oscillometric blood pressure measurement.
|
|
|
Figure 45.19. The pressure volume loops. The y axis represents the pressure in the left ventricle, while the x axis represents the volume in the ventricle. The line connecting pressure–volume loops at end systole is a straight line called the end-systolic pressure–volume relationship. (Reused with permission from Sagawa K. The end-systolic pressure-volume relation of the ventricle: definition, modification, and clinical use. Circulation. 1981;63:1223.) |
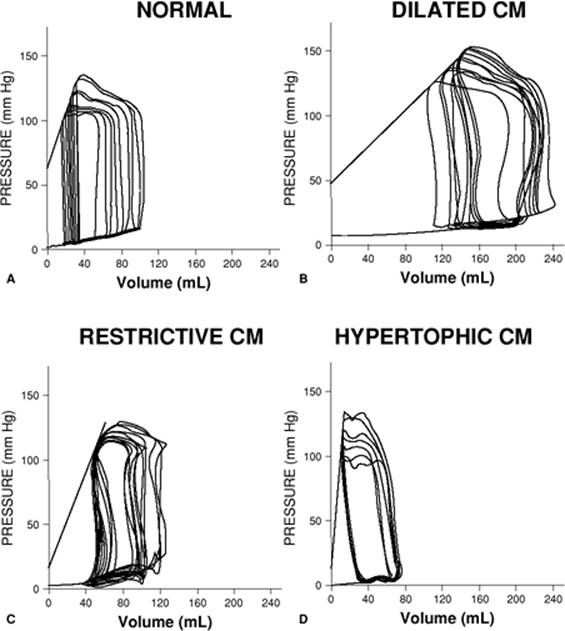
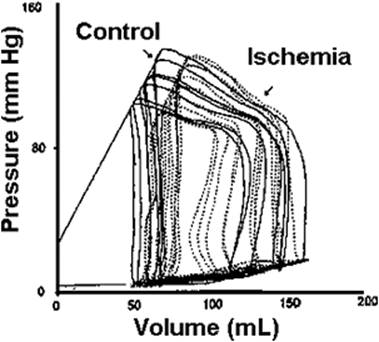
The pressure–volume loop provides a graphic representation of the active and passive properties of the heart as a pump. The shape and position of the pressure–volume loop can be of great value in characterizing the clinical picture. As shown in Figures 45.21 and 45.22, a particular pathologic state can be identified by the pressure–volume loop (29). The pressure–volume loop for patients with dilated cardiomyopathy and restrictive cardiomyopathy are markedly shifted to the right, while in hypertrophic cardiomyopathy, they are shifted to the left compared to normal individuals. Acute coronary ischemia also markedly alters the pressure–volume loops. SW can be calculated from the integration of the loop and gives a good idea of the energy expenditure involved with each heart beat. Fortunately, noninvasive techniques are now available to assess ventricular function in a quantitative way.
|
|
|
Figure 45.20. Pressure–segment length loop. In the inset, integrals of a family of pressure–segment length loops are plotted against end-diastolic segment length (EDL). The slope of this relationship, MW, is a measure of contractility. (Adapted from Pagel PS, Kampine JP, Schmeling WT, et al. Comparison of end-systolic pressure-length relations and preload recruitable stroke work as indices of myocardial contractility in the conscious and anesthetized chronically instrumented dog. Anesthesiology. 1990;73:278.) |
Blood Flow and Blood Pressure
Basic Hemodynamic Model
The function of the cardiovascular system is to circulate blood, which is essential for the maintenance of the internal environment of the human body. Blood flows only if a pressure gradient exists. Although blood flow is the purpose of the circulation, it is blood pressure that is commonly used as a surrogate to determine its operational performance. Pressure and flow are related by Ohm's law:
Q = Δ P/R
where Q is the flow (volume per time), ΔP is the pressure gradient, and R is the resistance to flow. Although this law, in a strict sense, only holds true for a rigid tube, it has been successfully applied to cardiovascular physiology. For instance, Ohm's law can be used to calculate the vascular resistance in patients in whom blood flow (by means of a balloon-tipped pulmonary artery catheter) and blood pressure (by means of an arterial catheter) are measured simultaneously. Such measurements have shown that the systemic vascular resistance is normally about ten times higher than the pulmonary vascular resistance (Table 45.2). In clinical practice, the systemic vascular resistance (SVR) is calculated from the cardiac output (Q), the mean arterial blood pressure (MAP), and the central venous pressure (CVP):
SVR = (MAP - CVP)/Q
Likewise, the pulmonary vascular resistance (PVR) is calculated from the cardiac output, the mean pulmonary artery pressure (PAPm), and the capillary wedge pressure (CWP). The latter is measured after balloon occlusion of a branch of the pulmonary artery and is normally in equilibrium with the pulmonary venous pressure:
PVR = (PAPm - CWP)/Q
These values may be indexed to body surface area.
|
|
|
Figure 45.21. A comparison of pressure–volume loops of patients with distinct types of cardiomyopathy (CM) in comparison to a normal patient. (Reused with permission from Kass DA. Clinical ventricular pathophysiology: a pressure-volume view. In: Warltier D, ed. Ventricular Function. Baltimore: Williams & Wilkins; 1995:131.) |
In a steady state, the blood flow is equal at any two cross sections in series along the circulation. Thus, the flow through the aorta equals the flow through all of the systemic capillaries. Although the aorta is the largest blood vessel, the combined cross-sectional area of the capillaries far exceeds the aortic cross section. As a result, the velocity of flow is much lower in the capillaries than in the aorta.
Generation of Blood Pressure
The pressure of the systemic circulation is produced by ejection of blood from the left ventricle. As a result of this ejection, blood is accelerated, and the elastic walls of the central blood vessels are slightly distended. The distension is crucial for normal circulatory function because it stores potential energy in vascular structures, resulting in a continuous flow of blood, even after the actual ejection period is completed. Although the pressure during the ejection period (systolic blood pressure) is higher than the pressure after the ejection period (diastolic blood pressure), elastic recoil sustains the flow of blood at all times. The difference between systolic and diastolic blood pressures is called pulse pressure. The pulse pressure is largely dependent on the stroke volume and the arterial compliance. In principle, the same mechanism applies to the pulmonary circulation. However, the pulse pressure of the pulmonary circulation is much lower, even though the right ventricle ejects about the same volume per stroke as the left ventricle. The low pressure in the right-sided circulation is a consequence of the high compliance of the pulmonary arteries and the low overall resistance of the pulmonary circulation.
An important indicator of the driving force of the circulation is the mean arterial pressure. The MAP of one cardiac cycle is the area under the blood pressure curve (∫ P dt) divided by the time of the cardiac cycle (Δt):
MAP = ∫ P dt/Δ t
|
|
|
Figure 45.22. Pressure–volume loops from a patient prior to and during acute coronary occlusion. Note the marked shift to the right of the family of loops during the ischemic period. (Reused with permission from Kass DA. Clinical ventricular pathophysiology: a pressure-volume view. In: Warltier D, ed. Ventricular Function. Baltimore: Williams & Wilkins; 1995:131.) |
Determination of MAP by this equation requires invasive monitoring of a continuous blood pressure trace. When blood pressure is measured by noninvasive techniques, MAP can be approximated from diastolic (DBP) and systolic (SBP) blood pressures by the following equation:
MAP = (2DBP + SBP)/3
The mean arterial pressure changes very little between the aorta and the small arteries. However, in arterioles and capillaries, a large pressure gradient exists, which eventually dissipates the mean pressure to a value near zero (venous pressure). Despite the constant mean pressure in all small and large arteries, there are noticeable changes in systolic and diastolic blood pressure. The systolic blood pressure increases from proximal to distal arteries, whereas the diastolic blood pressure decreases in the same direction. This phenomenon (i.e., increase in pulse pressure from central to distal) is caused by reflections of the pulse wave in the vascular tree.
|
Table 45.2 Hemodynamic variables |
||||||||||||||||||||||||||
|
Vascular Resistance and Compliance
The resistance to blood flow is one of the most important physiologic variables, one that constantly changes in response to external and internal factors. The resistance (R) to laminar flow through a rigid tube can be expressed by Poiseuille's law, which states that:
R = 8η L/π r4
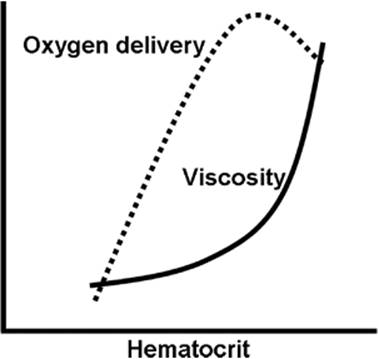
where η is the viscosity, L is the length of the tube, and r is its radius (1). Thus, the resistance depends on both the composition of blood and the properties of blood vessels. Specifically, the viscosity increases with hematocrit and with the plasma protein concentration (Fig. 45.23), whereas the radius of blood vessels is under tight control of the autonomic nervous system (see below). Poiseuille's law gives only an approximation of the true hemodynamic resistance because the human circulation deviates in many ways from the conditions under which the law applies. Blood vessels are not rigid, but they form branching and tapering elastic tubes; blood flow is not steady but pulsatile, and it is not necessarily laminar, but has turbulent flow components at certain locations.
Among the three independent variables of Poiseuille's law, it is the radius of blood vessels that undergoes the most significant changes. Total vessel radius, adjusted by a fine balance between vasodilation and vasoconstriction, is the main regulator of vascular resistance. SVR is the net result of the resistance offered by many vessels arranged both in series and in parallel. In analogy to electrical circuits, resistances in series are summed as (1):
|
|
|
Figure 45.23. Effect of hematocrit on blood viscosity and oxygen delivery. Abnormally high hematocrits produce a sharp increase in viscosity, which raises vascular resistance to a point that oxygen delivery decreases. The decrease in oxygen delivery results from a decrease in cardiac output, which more than offsets the increase in oxygen-carrying capacity. |
SVR = Rarteries + Rarterioles + Rcapillaries+ Rvenules + Rveins
In contrast, resistances in parallel are related to total SVR by the following equation (1):
1/SVR = 1/Rcoronary + 1/Rcerebral + 1/Rmuscle + 1/Rsplanchnic + 1/Rrenal + 1/Rskin + …
Individual components of the systemic circulation make very different contributions to total SVR. In particular, it holds that:
Rarterioles + Rcapillaries > > Rarteries + Rvenules + Rveins
Arterioles in particular are the main targets of the various regulatory mechanisms that lead to vasodilation or vasoconstriction. Since the resistances of the coronary, cerebral, and renal circulations are primarily controlled by local demand, the main factor that regulates total SVR is the net radius of arterioles in muscles, skin, and the gut. This net radius is under hormonal and autonomic nervous control and it can be affected by a number of drugs.
Hormones that are powerful vasoconstrictors include epinephrine, norepinephrine, angiotensin II, and arginine vasopressin (1). Nitric oxide is a vasodilator, with a very short half-life and an action that is mainly local. The autonomic nervous system exerts control over the SVR by an array of sympathetic fibers that innervate arterioles and capillaries at multiple sites, which is why sympathetic tone has such a profound effect on blood pressure. All these mechanisms act in concert and are linked by reflex pathways, such as the baroreceptor reflex. The baroreceptor reflex responds to mechanoreceptors located in the aorta, carotid sinuses, atria, ventricles, and pulmonary vessels. When the wall of these structures is stretched, receptor firing increases, which in turn causes complex changes in the autonomic system, leading to a decrease in sympathetic and increase in parasympathetic outflow. Reflex integration and many other regulatory functions that affect SVR are located in the medulla oblongata.
Although the large arteries and veins do not have a significant effect on vascular resistance, their elastic properties are, nevertheless, important for the following reasons. First, systemic arteries expand temporarily during systole, a mechanism that is used to store potential energy (see above). Second, systemic veins and all pulmonary vessels expand and shrink in order to accommodate changes in circulating blood volume. The degree to which vessels can expand is defined by their compliance (C):
C = Δ V/Δ P
where ΔV is the change in volume that corresponds to a certain change in transmural pressure ΔP (pressure difference between the inside and the outside of the vessel). The compliance is high in systemic veins and the pulmonary vasculature, which is why changes in blood volume will primarily affect the volume of these structures. In contrast, the compliance is low in the systemic arteries; as a result, their total volume is relatively stable, and they distend only minimally when the arterial pressure rises during systole. Compliance is inversely related to resistance.
|
Table 45.3 Distribution of blood volume |
||||||||||||
|
Distribution of Blood Volume
The circulating blood volume in adults is 60 to 70 mL/kg for women and 70 to 80 mL/kg for men. In neonates, the blood volume is 80 to 90 mL/kg. More than half of the blood volume is present in the venous system, including venules, veins, and the cava (Table 45.3). As discussed above, the compliance of veins is about 20 times higher than that of systemic arteries. Thus, small changes in venous pressure are associated with large changes in venous volume, and the venous system serves as a reservoir to accommodate shifts in total blood volume.
Stroke volume and cardiac output are highly sensitive to the degree of filling of the cardiac ventricles. Cardiac filling in turn depends on the central blood volume, which is defined as intrathoracic blood present in the heart, cava, pulmonary circulation, and intrathoracic arteries. The distribution of blood between the central (intrathoracic) compartment and the peripheral (extrathoracic) compartment can change with body position and with sympathetic tone. Redistribution of blood occurs mainly between compliant structures, such as the heart, the veins, and the pulmonary vasculature. The variable portion of the peripheral blood volume is located in the veins of the extremities and the abdominal cavity. In contrast, the blood volume in systemic arteries changes very little because of their low compliance. Changes in central venous pressure can be used as an indicator of changes in central blood volume. Although this technique is widely employed in the practice of critical care, it is not very sensitive, and it is only accurate if a number of preconditions apply, such as normal cardiac function, normal intrathoracic pressures, and accurate positioning of the pressure transducer.
Just like the vascular resistance, blood volume and blood distribution are under endocrine and autonomic nervous control. Angiotensin II and aldosterone decrease renal excretion of sodium, which leads to an increase in total plasma volume. Atrial natriuretic peptide is released into the bloodstream when atria are stretched, causing increased renal sodium excretion, which therefore leads to a decrease in plasma volume. Erythropoietin is a hormone released by the kidneys that causes bone marrow to increase the production of red blood cells, which also increases total blood volume. The distribution of blood volume is sensitive to the sympathetic tone. High sympathetic outflow causes venoconstriction in addition to the constriction of arterioles. The main effect of venoconstriction is an increase of the central blood volume at the expense of the peripheral blood volume.
References
1. Rhoades RA, Tanner GA, eds. Medical Physiology. 2nd ed. Philadelphia: Lippincott Williams & Wilkins; 2003.
2. Davies LK, Knauf DG. Anesthetic management for patients with congenital heart disease. In: Hensley FA, Martin DE, Gravlee GP, eds. Cardiac Anesthesia. 3rd ed. Philadelphia: Lippincott Williams & Wilkins; 2003.
3. Thibodeau GA, Patton KT. Anatomy and Physiology. 6th ed. St. Louis: Mosby Elsevier; 2007.
4. Sidebotham D, Merry A, Legget M, eds. Practical Perioperative Transesophageal Echocardiography. Edinburgh, Scotland: Butterworth Heinemann; 2003.
5. Lynch C. Cellular electrophysiology of the heart. In: Lynch C, ed. Clinical Cardiac Electrophysiology: Perioperative Considerations. Philadelphia: JB Lippincott; 1994:1.
6. Study R. The structure and function of neurons. In: Hemmings H, Hopkins P, eds. Foundations of Anesthesia Basic and Clinical Sciences. London: Mosby; 2000:179.
7. Opie LH. The Heart Physiology from Cell to Circulation. 3rd ed. Philadelphia: Lippincott-Raven; 1998.
8. Bogdanov KY, Maltsev VA, Vinogradova TM, et al. Membrane potential fluctuations resulting from submembrane Ca2+ releases in rabbit sinoatrial nodal cells impart an exponential phase to the late diastolic depolarization that controls their chronotropic state. Circ Res. 2006;99:979.
9. Bers DM. The beat goes on. Circ Res. 2006;99:921.
10. Barber MJ. Class I antiarrhythmic agents. In: Lynch C, ed. Clinical Cardiac Electrophysiology: Perioperative Considerations. Philadelphia: JB Lippincott; 1994:85.
11. Bootman M, Higazi DR, Coombes S, et al. Calcium signaling during excitation-contraction coupling in mammalian atrial myocytes. J Cell Sci. 2006;119:3915.
12. Tada M, Kirchberger M, Repke DI, et al. The stimulation of calcium transport in cardiac sarcoplasmic reticulum by adenosine 3 prime:5 prime–monophosphate-dependent protein kinase. J Biol Chem. 1974;249:6174.
13. Koss KL, Kranias EG. Phospholamban: a prominent regulator of myocardial contractility. Circ Res. 1996;79:1059.
14. Moss RL, Fitzsimons DP. Myosin light chain 2 into the mainstream of cardiac development and contractility. Circ Res. 2006;99:225.
15. Granzier H, Wu Y, Siegfried L, et al. Titin: physiological function and role in cardiomyopathy and failure. Heart Failure Rev. 2005;10:211.
16. Katz AM, Zile MR. New molecular mechanism in diastolic heart failure. Circulation. 2006;113:1922.
17. van Heerebeck L, Borbely A, Niessen WM, et al. Myocardial structure and function differ in systolic and diastolic heart failure. Circulation. 2006;113:1966.
18. Ruegg JC. Cardiac contractility: how calcium activates the myofilaments. Naturwissenschaften. 1998;85:575.
19. Blanck TJJ, Lee DL. Cardiac physiology. In: Miller RD, ed. Anesthesia. Vol. 1. Philadelphia: Churchill Livingstone; 2000:619.
20. Katz AM, Lorell BH. Regulation of cardiac contraction and relaxation. Circulation. 2000;102(S IV):69.
21. Sagawa K. The end-systolic pressure-volume relation of the ventricle: definition, modification, and clinical use. Circulation. 1981;63:1223.
22. Blanck TJJ, Lee DL. Cardiac physiology. In: Miller RD, ed. Anesthesia. Vol. 1. Philadelphia: Churchill Livingstone; 2000:619.
23. Sarnoff SJ, Berglund EI. Starling's law of the heart studied by means of simultaneous right and left ventricular function curves in the dog. Circulation. 1954;9(5):706–718.
24. Glower DD, Spratt JA, Snow ND, et al. Linearity of the Frank-Starling relationship in the intact heart: the concept of pre-load recruitable stroke work. Circulation. 1985;71:994.
25. Pagel PS, Kampine JP, Schmeling WT, et al. Comparison of end-systolic pressure-length relations and preload recruitable stroke work as indices of myocardial contractility in the conscious and anesthetized chronically instrumented dog. Anesthesiology. 1990;73:278.
26. Lee W, Huang W, Yu W, et al. Estimation of preload recruitable stroke work relationship by a single-beat technique in humans. Am J Physiol. 2003;284:744.
27. Karunanithi MK, Feneley MP. Single-beat determination of preload recruitable stroke work relationship: derivation and evaluation in conscious dogs. J Am Coll Cardiol. 2000;35:502.
28. Baicu CF, Zile MR, Aurigemma GP, et al. Left ventricular systolic performance, function, and contractility in patients with diastolic heart failure. Circulation. 2005;111:2306.
29. Kass DA. Clinical ventricular pathophysiology: a pressure-volume view. In: Warltier D, ed. Ventricular Function. Baltimore: Williams & Wilkins; 1995:131.