Philip Boysen
Measurement of pulmonary function is an important adjunct to the symptoms exhibited by a patient, as well as the findings on physical examination. The quantification of pulmonary function has specific applications to clinical medicine in the intensive care unit setting, such as the following:
· Confirming a clinical diagnosis of obstructive versus restrictive ventilatory defects in a patient with respiratory insufficiency or failure
· Following the course of the patient's disease and the response to treatment
· Enhancing decision making for patients about to undergo thoracoabdominal surgery
· Developing an anesthetic and postoperative plan for a patient with pulmonary disease
This chapter will outline the pulmonary function tests that are now considered routine and will address the interpretation of the tests. The timing and nature of the effects of thoracic and abdominal surgery and the clinical implications of the anesthetic and surgical procedures will also be considered.
The evaluation of a patient who is being considered for resectional lung surgery is an important issue for the anesthesiologist, surgeon, and intensivist. Finally, there are some aspects of pulmonary function measurement that are particularly applicable to practitioners of intensive care medicine.
Routine Pulmonary Function Testing
Although it might be argued that no form of testing can be considered routine, when clinicians refer to “routine pulmonary function testing” there are three types of measurement and assessment of lung function that define the pulmonary status of a patient: (i) spirometry, (ii) measurement of lung volumes, and (iii) measurement of lung diffusing capacity.
Spirometry
Spirometry remains the most basic technique to assess lung function, and the most valuable. The concept is simple, but the assessment of the results can be complex. In essence, the patient is asked to inhale to total lung capacity (TLC) and then to forcefully exhale into a device that measures volume versus time. The ability to perform a forceful exhalation is key to obtaining an adequate study. Maximal forced exhalation from TLC to residual volume (RV) results in a spirogram with a smooth and reproducible curve that defines a maximal forced expiratory volume envelope. To ensure that patient effort and cooperation is maximal and approaches the envelope that the patient cannot penetrate, the procedure is repeated three times, and the spirometric curves are superimposed and compared.
Performance of a forced vital capacity maneuver is not problematic for a normal person, but a patient with pulmonary impairment is greatly distressed by this procedure. It may take some time for the technician to achieve the performance needed. Once this occurs, the patient is asked to use a metered dose inhaler (beta2 agonist) and then repeat the forced vital capacity maneuver three more times, as the technician again assesses the results for maximal performance and its response to bronchodilators (Fig. 69.1).
The evaluation of a spirogram is straightforward, compares the results to data provided by examining a normal population of men and women, and seeks to answer two additional questions. From a physiologic standpoint, the spirogram defines patients with an obstructive or a restrictive physiologic defect or impairment. Restrictive defects are associated with a decrease in the forced vital capacity (FVC) of at least 20% of the predicted value. Obstructive ventilatory defects are revealed when the ratio of the forced expiratory volume in 1 second (FEV1) divided by the FVC (the FEV1/FVC ratio) is less than 85%. Other indications of obstructive lung disease available from the spirogram include the peak expiratory flow rate (PEFR), a useful method of following airflow obstruction due to asthma, and the maximal midexpiratory flow rate. With the latter measurement taken at the midpoint of the FVC, the slope of the line between 25% and 75% of the FVC (FEF 25%–75%) is a better indication of obstructive lung disease due to chronic bronchitis (Fig. 69.2).
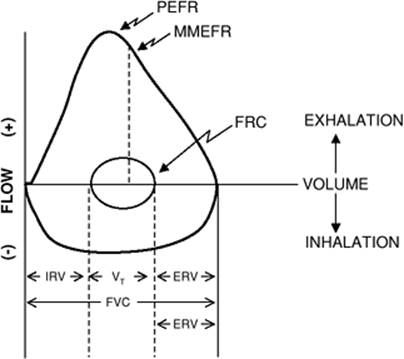
Another method of representing a maximal forced expiratory maneuver depicts the FVC versus flow rather than versus time (Fig. 69.3).
The forced exhaled volume between TLC and RV is the maximal expiratory flow curve. If the patient is asked to fully inhale back to TLC once the expiratory maneuver is completed, the flow–volume relationship is referred to as a flow–volume loop. This study is especially useful for diagnosing intrathoracic and extrathoracic upper airway obstruction.
Whereas the FVC measures exhaled volume versus time, and therefore gives an index of airflow, the maximum voluntary ventilation (MVV) is a test that involves repeated breaths and vigorous breathing for 10 to 12 seconds. The MVV is reported in L/minute, which means that the 10- or 12-second effort is multiplied by 6 or 5 respectively. Although it is only a rough index, the MMV assesses both airway status and respiratory muscle endurance.
|
|
|
Figure 69.1. Three forced exhalations are performed before and after bronchodilator inhalation to assess immediate response. The maximum measured exhaled volume is FVC. The exhaled volume at 1 second is FEV1.0. The FEV1.0/FVC ratio is reduced with an obstructive ventilatory deficit. |
Lung Volumes
Whereas spirometry is a simple test and widely available, measurement of lung volumes requires more complex instrumentation. Lung volume determinations add another dimension to spirometry as a means of defining pathophysiologic changes in lung function.
Several methods are available to measure lung volumes, two of which depend on analysis of a specific gas—one physiologic and one inert. The first method, requiring a nitrogen analyzer, is easily performed over a 7- to 10-minute period of spontaneous breathing of 100% oxygen. With each breath, a certain percentage of nitrogen in the lungs is replaced by oxygen until a certain point where very little nitrogen remains in the lungs, although the nitrogen level never reaches absolute zero. The log of the exhaled nitrogen concentration over time is displayed until no further decrement is noted. Since 79% of the resident lung volume is elemental nitrogen (N2), measuring the total amount of nitrogen exhaled allows calculation of the volume from which it came. In the lung with significant ventilation perfusion mismatch, the log N2 versus time is not a straight slope, and it takes longer to reach the equilibration end point.
In the operating room, this phenomenon can be demonstrated in the patient with asthma or chronic bronchitis if the gas analyzer is able to measure nitrogen in addition to the other physiologic or anesthetic gasses.
|
|
|
Figure 69.2. Compartmentalization of lung volume is achieved by noting the volume excursion during tidal breathing and repeated inhalation and exhalation. The functional residual capacity is measured using gas wash-in or wash-out techniques. TLC, total lung capacity; VC, vital capacity; FRC, functional residual capacity; RV, residual volume. |
|
|
|
Figure 69.3. The relationship between a recording of flow and volume during a forced vital capacity (FVC) maneuver. ERV, expiratory reserve; FRC, functional residual capacity; IRV, inspiratory reserve; MMEFR, maximal midexpiratory flow rate; PEFR, peak expiratory flow rate; VT, tidal volume. |
Rather than “wash out” a physiologic gas, the “wash in” of an inert gas can also be used to determine lung volumes, and helium is used for this purpose. Fitted with a nose clip and a one-way valve in the breathing circuit, the patient is asked to breathe quietly with normal tidal volumes and is then connected to the circuit with a reservoir containing a known volume and concentration (10%) of helium. Measuring helium breath by breath, the technician records the point at which the decline in helium concentration reaches a steady state. Using the formula V1C1 = V2C2, the total volume of the helium black box and the patient's lungs is calculated, and the black box volume is subtracted, yielding the lung volume of the patient. The volume that is measured with either of these techniques depends on the point at which the patient is linked continuously into the breathing circuit. The intent is to begin the measurement at the end of a tidal breath, at functional residual capacity (FRC). Using either a solenoid that detects flow reversal at the end of the tidal breath, or simply using direct observation of tidal breathing, this is usually easily accomplished.
|
|
|
Figure 69.4. Changes in lung volumes with extrinsic and intrinsic restriction ventilatory defects (RVD) are compared to normal. An extrinsic RVD mainly alters the total lung capacity (TLC) with minimal alteration of the functional residual capacity (FRC) and the residual volume (RV). An intrinsic RVD results in concentric reduction of the TLC, FRC, and RV. |
The lung volume study is completed by once again using the spirometer and coaching the patient to a full respiratory maneuver. Then, after quiet tidal breathing, the patient is asked to exhale to residual volume (RV), then inspire fully to total lung capacity (TLC), and after a second interval of quiet tidal breathing, fully inspire to TLC and expire to RV. Knowing the FRC from the dilution studies, all of the lung volume compartments can be calculated (Fig. 69.2).
Residual volume, functional residual capacity, and total lung capacity can be viewed as a system of concentric circles (Fig. 69.4).
An obstructive ventilatory defect is characterized by hyperinflation, with a greater effect on RV and FRC than on TLC. A restrictive ventilatory defect can be either intrinsic or extrinsic. An intrinsic restrictive ventilatory defect is characterized by a concentric reduction (each volume decreases by the same percentage). An extrinsic restrictive ventilatory defect shows a disproportionate loss of volume “off the top”; the major change is in TLC. The postoperative patient who has had a surgical procedure in the thorax or upper abdomen shows the latter change in physiology. Though transient, the extrinsic restrictive ventilatory change, especially when superimposed on a patient with obstructive physiology, can be significant.
|
|
|
Table 69.1 Patterns of pulmonary pathology measured by pulmonary function tests |
Diffusing Capacity
The third pulmonary function study of importance is aimed at assessing gas transfer at the alveolocapillary membrane. Oxygen is the gas transfer of interest, but making this measurement is difficult because there is always a back pressure or gas tension in the blood that must be compared to alveolar gas. This problem can be overcome by introducing a gas that is not normally in the bloodstream, specifically small amounts of carbon monoxide (CO). Since CO is not a physiologic gas, this measurement is referred to as the diffusing capacity, not diffusion capacity.
The measurement can be made in two ways, and there is controversy over which test gives superior information. The two methods include introducing CO into a breathing circuit and measuring the change in tidal breathing to a steady state, and similarly inhaling CO with a single breath. With the second technique, a further piece of information is obtained by relating the gas transfer to the size of the breath, reported as the KCO. This is an indication of diffusing capacity “where the gas goes,” and is considered another method of evaluating both restrictive and obstructive changes in physiology.
If the tissue of an adult lung were microdissected and spread out, it would cover the space of a football field. Thus, one of the reasons for a decrease in diffusing capacity (as opposed to a thickened alveolar-capillary membrane) is loss of effective surface area for gas transfer. This is a pathognomonic change seen in patients with emphysema.
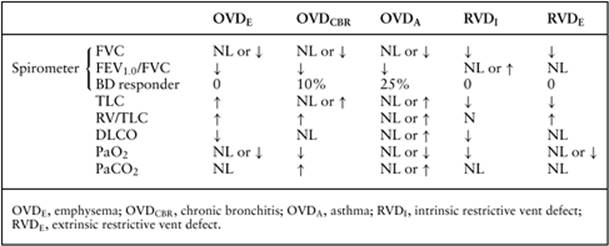
When spirometry, lung volumes, and diffusing capacity are all evaluated, there is a characteristic pattern of physiologic changes that identifies patient status and diagnosis, which is important in the care of the perioperative patient (Table 69.1).
Arterial Blood Gas Analysis
Arterial blood gas analysis (ABG) is usually included in the panoply of routine pulmonary function testing. In preparing a patient for surgery, ABG analysis is often ordered, but the usefulness is limited to an analysis of trends and diagnosis of underlying chronic disease. Prognostic value is limited, and for resectional lung surgery, postoperative ABGs are often improved. However, there is value in identifying the patients with obstructive lung disease who have emphysema, as opposed to chronic bronchitis, in assessing and designing postoperative therapy. Table 69.1 summarizes the findings for the various physiologic states.
Preoperative Pulmonary Function Testing
Resectional Lung Surgery
The main indication for lung resection remains the removal of a lung cancer (1). Since both the presence of obstructive lung disease and the incidence of cancer are related to smoking, it is not surprising that patients being evaluated for surgical resection of a lung tumor also suffer from chronic bronchitis or emphysema. Imaging studies have advanced such that the extent of the disease is well documented before surgery; imaging to guide biopsies also identifies the cell type during early evaluation. However, until the surgeon explores the open chest, the extent of the necessary resection for cure is not known. Thus the evaluation should always determine whether the patient can tolerate a pneumonectomy and subsequently live with one lung. Thus, the first step is to measure overall pulmonary function as shown in Table 69.2 (2).
If the patient meets all of these criteria, one can assume that the loss of the cancerous lung will result in pulmonary function that is at least half of the FEV1.0, i.e., the postoperative FEV1.0 will exceed 1.0 (3,4).
If the criteria are not met, and surgical resection, including pneumonectomy, is still being considered, the next step is to perform split lung function testing, and ascertain the contribution of the right versus the left lung to overall pulmonary function. The first method used to perform such an analysis was invasive but based on sound physiologic concepts. It had been observed, in both humans and animal models, that the inability to tolerate resection of a critical mass of lung resulted in cor pulmonale and respiratory failure. Thus, it was reasoned that if a temporary pneumonectomy could be induced with balloon occluding the pulmonary artery to the cancerous lung, the resulting pulmonary artery pressure proximal to the occlusion would identify the patient who could not tolerate resection of that lung due to lack of pulmonary capillary reserve, cor pulmonale, impaired exercise tolerance, and respiratory muscle fatigue (5,6,7). Other studies not only predicted survival but also morbidity and mortality and identified obstructive lesions of the trachea and larynx (8,9).
|
Table 69.2 Pulmonary function indicating physiological tolerance for surgery up to and including pneumonectomy |
||||||||||||||
|
A second technique, bronchospirometry, is also invasive but yielded the desired information. An awake patient underwent tracheal intubation with a double-lumen tube, and each port was connected to a separate spirometer. When the patient performed a forced vital capacity maneuver, the right contribution to the FVC could be distinguished from the left.
In the 1970s, investigators noted that most of these patients had abnormal ventilation perfusion lung scans, but for each lung as a whole, the radionuclide scans were fairly well matched. Reasoning that a perfusion scan, or even a ventilation scan, could be used to determine split lung function, they studied a series of patients preoperatively who then went on to surgical resection and had pulmonary function measured after recovery from surgery months later (10). Since that time, clinicians have found this to be a useful method of preparing the patient for surgery and predicting remaining lung function following pneumonectomy. For example, if the preoperative FEV1.0 = 1.6 L, and the scan reveals 60%/40% left lung versus right lung, and the right lung is being considered for resection, then:
1.6 L × .60 × .96 L, the calculated postoperative FEV1.0
The same investigators made two other early observations. First, the diseased lung often made little or no contribution to overall lung function, and if the calculation was incorrect, it was usually because postoperative lung function was better than predicted. Second, they suggested that the requirement for the predicted postoperative FEV1.0 be lowered from 1.0 L to 800 mL, the level below which they noted that respiratory failure and cor pulmonale usually occurred in the chronic obstructive pulmonary disease (COPD) patient.
Noncardiothoracic Surgery
Whereas quantitative assessment of pulmonary function is useful for thoracic surgery patients, there is little evidence to suggest that measurement of pulmonary function should be obtained solely for the purpose of perioperative management of an individual patient. Although certain types of surgery, such as upper abdominal surgery, nonresectional thoracic surgery, and cardiac surgery, often cause severe alterations in pulmonary function (the FVC may be reduced as much as 50% the first postoperative day), little is added to the history and physical examination in terms of considering risk.
Predicting Postoperative Pulmonary Complications
Postoperative pulmonary complications (PPCs) are usually defined as newly developed atelectasis, pneumonia, pulmonary thromboembolism, and acute respiratory failure requiring mechanical ventilation following surgery. Because of the difficulty of making predictions based solely on the measurement of pulmonary function, other strategies for assessment are continually being developed and analyzed. Early studies sought to first identify normal pulmonary function criteria for large populations and then demonstrate changes due to other changes in lung function, such as aging and cigarette smoking (11,12). The next step included identifying risk factors and determining if a preoperative therapeutic regimen would alter outcome, or if alterations in anesthetic technique improved or lessened postoperative pulmonary complications (13,14).
Most studies have been limited by the number of patients entered into the study protocol, but the accumulated evidence would indicate that preoperative testing would identify patients at risk for postoperative pulmonary complications (15,16,17,18). The efficacy of strategies to reduce postoperative pulmonary complications is not so well defined (19,20,21,22,23,24). Recently, the National Veterans Surgical Quality Improvement Program, in developing a multifactorial risk index for predicting postoperative pneumonia and respiratory failure after major noncardiac surgery, has reported large numbers of patients. The consistent risk factors in this population include the following (25):
· Smoking status: The duration of smoking cessation to achieve benefit appears to be at least 4 weeks, possibly as long as 8 weeks.
· Chronic obstructive lung disease, as defined by history and physical examination (spirometry has not been shown to be useful in prognosis)
· Measures of general health status: includes the presence/ measures of comorbid conditions, functional status, recent weight loss.
· Cognitive impairment, for whatever reason
· Previous stroke
· Type and location of the anticipated surgical procedure
· Age: a risk factor when controlled for comorbid conditions
· Long-term steroid therapy
· Recent moderate-to-heavy alcohol intake
· Impaired renal function
· Large transfusion: generally >6 units of packed red blood cells, plus other blood products
In this study, the authors were not able to analyze the importance of serum albumin, spirometry, use of prophylactic antibiotics, and body mass index or obesity. Other studies have suggested that a low serum albumin carries a higher risk for PPC, and the outcome is not changed by administering intravenous hyperalimentation, but risk is possibly lessened by feeding through the gut. As mentioned, spirometry is diagnostically accurate, but is not useful for prognosis; and obesity in the absence of comorbid conditions is not a significant risk factor for PPCs.
The use of general anesthesia for surgical procedures, and the duration of the anesthetic and surgical procedures (greater than 4 hours) were reported to increase the risk of PPCs. A common consultant comment has been, “OK for spinal, avoid general anesthesia,” implying that the volatile anesthetic agent had some negative impact on postoperative pulmonary function. Advances in anesthesia technology and skills have allowed investigators to reframe the question. Does the presence of adequate neuroaxial blockade during a surgical procedure reduce risk? The anesthetic plan can include spinal anesthesia, epidural anesthesia, combined spinal/epidural anesthesia, and these can also be combined with light levels of general anesthesia (the “epigeneral”). Further, neuroaxial blockade can be continued into the postoperative period for pain management. Postoperative pain management is an important goal that also enables a patient to complete deep breathing maneuvers. It does appear that the presence of neuroaxial blockade, either alone or in combination with general anesthesia, is associated with fewer deaths and complications.
Strategies to Reduce PPCs after Noncardiothoracic Surgery
The general approach to the patient with impaired pulmonary function has included cessation of smoking and an attempt to maximize pulmonary function with the use of bronchodilators, both beta-2-agonists and parasympatholytic agents, treatment of underlying infections or purulent sputum, and coaching to learn deep-breathing exercises. Bronchodilators are continued throughout the anesthetic and surgical procedure.
A recent publication reviewed the available literature on interventions to prevent PPCs after noncardiothoracic surgery. A synthesis of the evidence indicates the following:
· Studies with good evidence: The evidence indicates that lung expansion interventions are useful in preventing PPCs. This includes incentive spirometry, deep breathing exercises, and continuous positive airway pressure.
· Studies with fair evidence: The evidence indicates that selective rather than routine use of nasogastric tubes after abdominal surgery is beneficial, given that it decompresses the stomach, allowing for better diaphragmatic excursion. The use of short-acting, intraoperative neuromuscular blocking agents (e.g., rocuronium vs. pancuronium) is associated with improved outcomes.
· Studies with conflicting evidence: The evidence is conflicting or insufficient for cessation of smoking, epidural anesthesia, epidural analgesia, and laparoscopic versus open abdominal surgery. As noted above, the presence or absence of neuroaxial blockade—not the anesthetic choice—may be the determining factor. Also, laparoscopic procedures result in less pain and a lesser reduction in the FVC. Finally, although malnutrition is associated with increased risk, routine total enteral or parenteral nutrition does not reduce risk.
In summary, for noncardiothoracic surgery, there has been substantial investigation for decades aimed at performing a preoperative assessment to identify risk (26) early with invasive techniques (27). The value of preoperative pulmonary function testing has been repeatedly called into question (28,29) owning to the added time and expense. Preoperative pulmonary function testing is safe and noninvasive, but should not be routinely performed; rather, it should be limited to a specific indication supported by changes in the anesthetic or surgical procedure (30). Furthermore, the incidence of postoperative pulmonary dysfunction is influenced by the surgical site and the propensity to cause diaphragmatic dysfunction (31,32).
Additional Pulmonary Function Tests Pertinent to the Intensive care Unit
Lung–Thorax Compliance and Airway Resistance
Physiologists described lung–thorax pressure relationships in normal subjects by defining elastic recoil pressure. With a nose clip and mouthpiece in place, the subject inhaled deeply to TLC and, with an open glottis and no airflow, relaxed against a pressure monitor. The process was repeated in decrements of 200 mL to record the pressure–volume curve of the lung and thorax.
The same process can be adapted to the mechanically ventilated patient. In the ventilated patient who is not breathing spontaneously, changes in transpulmonary pressure—and thus lung volume—are achieved by positive pressure applied at the airway by the ventilator. Although some clinicians have suggested the construction of the pressure–volume relationship throughout the tidal breath, the common approach is to deliver a tidal breath—under positive pressure in the range of 8 mL/kg body weight—and measure the resulting airway pressure at two points: the peak inspiratory pressure (flow) and the relaxation pressure with the tidal breath held in the lungs with no airflow. Measurement of these two pressures, the second measurement accomplished with a short inspiratory hold, allows the calculation of lung–thorax compliance and airway resistance (33).
Clt = V/P in mL/cm H2O, where V = tidal volume and P = relaxation pressure
Raw = PIP/inspiratory flow, where inspiratory flow is constant during lung inflation
Since Raw is measured in cm H2O/mL/second, the product of lung–thorax compliance and airway resistance is the time constant for the lungs to achieve improved distribution of inspired gas.
Clt (mL/cm H2O = Raw (cm H2O/mL/second) = seconds (or time constant for the lung)
Testing Respiratory Muscle Strength
The ability to separate a patient from mechanical ventilation depends on respiratory muscle function—both strength and endurance. Respiratory muscle strength is assessed in clinical settings by measuring a pressure resulting from the generation of a forcing pressure due to activation of the respiratory muscle. Pressure measurements can be obtained at many different sites (e.g., the distal or proximal end of the endotracheal tube) or esophageal pressure measurements, as a reflection of changes in pleural pressure, can be obtained using various devices. Pressure measurements can also be made across structures. Thus, transdiaphragmatic pressures can be obtained by simultaneously measuring esophageal and gastric pressures. As yet, baseline measurements indicating the ability to separate a patient from mechanical ventilation have yet to be defined (34).
Tests of Respiratory Muscle Endurance
From the standpoint of a working muscle, endurance is defined as the ability of a muscle to develop tension and sustain it over time; the time–tension index is, therefore, the physiologic manifestation of muscle endurance. For the respiratory muscles, pressure is a manifestation of the ability to generate tension, and the pressure–time product, therefore, correlates with respiratory muscle endurance in the normal subject breathing against a resistive load. Measurement of tidal volume, mean inspiratory mouth pressure, and the duty cycle determine the pressure–time product. Similarly, in the intubated patient, pressures can be measured at the proximal end of the endotracheal tube as an index of the energy necessary to move the lung to a higher volume during positive pressure ventilation (35).
Breathing Patterns
Normal tidal breathing begins at FRC, a point where the tendency for the chest wall to spring outward is balanced by the tendency of the lung to collapse. The balance of these two forces occurs when there is complete apposition of the pleural surfaces. A tidal breath is an energy-transferring mechanism, the reason why exhalation is usually a passive phenomenon returning the lung volume to the normal FRC. Tidal excursions occur within the TL-to-RV envelope, and both an inspiratory reserve volume and an expiratory reserve volume are maintained. Patients in respiratory distress alter their tidal breathing patterns according to the added load placed on the respiratory system. Patients with a resistive load will slow inspiratory or expiratory flows and diminish the respiratory rate, in an effort to attain searching for the best combination of rate and tidal volume/flow to work against the imposed load. Patients with alterations in compliance, in a similar manner, reach the best combination of rate and tidal volume, which results in a rapid respiratory rate and smaller tidal volumes.
In the latter patients, tracheal intubation, mechanical ventilation, and the addition of positive end expiratory pressure (PEEP) are used to support the patient. This is often instituted with the observation of rapid, shallow breathing patterns, owing to the propensity to respiratory failure and collapse, a high oxygen cost of breathing, and, finally, hypoxemia and carbon dioxide retention.
The reoccurrence of rapid, shallow breathing is used to assess the ability to wean a patient from positive pressure ventilation. The so-called spontaneous breathing trial involves watching the patient breathe with very low levels of positive pressure support, presumably enough to overcome the endotracheal tube resistance prior to extubation. Thus, rapid shallow breathing patterns, which can be measured by the rapid shallow breathing index (RSBI), are used to assess the feasibility of weaning from ventilatory support (36,37).
Summary
Pulmonary evaluation is a critical step in managing patients with lung disease who are undergoing elective surgeries or are admitted to the ICU for respiratory insufficiency or failure. A few examples of this evaluation are indicated below:
· Confirming a clinical diagnosis of obstructive versus restrictive ventilatory defects in a patient with respiratory insufficiency or failure
· Following the course of patient disease and the response to treatment
· Enhancing decision making for patients about to undergo thoracoabdominal surgery
· Developing an anesthetic and postoperative plan for a patient with pulmonary disease
Although there are few effective strategies for preventing complications in the postoperative period, it is still not clear if risk stratification can be assessed with the use of sophisticated or simple exercise tests and measurements. Efforts should be directed to an accurate prediction caused by respiratory impairment in high-risk patients to anticipate and correct their physiologic response to surgery and improve outcome.
References
1. Boysen PG, Block AJ, Olsen GN, et al. Prospective evaluation for pneumonectomy using the Tc99 quantitative perfusion lung scan. Chest. 1977;72:422.
2. Boysen PG, Clark CA, Block AJ. Graded exercise testing and post-thoracotomy complications. J Cardiovasc Anesth. 1980;4:68.
3. Olsen GN, Block AJ, Tobias JA. Prediction of postpneumonectomy pulmonary function using quantitative macro aggregate lung scanning. Chest. 1974;66:13.
4. Olsen GN, Block AJ, Swenson EQ, et al. Pulmonary function evaluation of the lung resection candidate: a prospective study. Am Rev Resp Dis. 1975;111:379.
5. Roussas C. Function and fatigue of respiratory muscles. Chest. 1985;88:124.
6. Smith TP, Kinasewitz GT, Tucker WY, et al. Exercise capacity as a predictor of post-thoracotomy morbidity. Am Rev Resp Dis. 1984;129:730.
7. Uggla LG. Indication for and results of thoracic surgery with regard to respiratory and circulatory function tests. Acta Chir Scand. 1956;111:197.
8. Miller RD, Hyatt RE. Evaluation of obstructive lesions of the trachea and larynx by flo-volume loops. Am Rev Resp Dis. 1973;108:476.
9. Markos J, Mullin BP, Mittman DR, et al. Preoperative assessment as a predictor of morbidity and mortality after lung resection. Am Rev Resp Dis. 1989;139:902.
10. Kristerrson S, Lindell S, Stranberg L. Prediction of pulmonary function loss due to pneumonectomy using Xe133 radiospirometry. Chest. 1972;62:694.
11. Knudson RJ, Kalterborn WT, Knudson DE, et al. The single breath carbon monoxide diffusing capacity reference equations derived from a healthy non-smoking population and the effects of hematocrit. Am Rev Resp Dis. 1987;135:805.
12. Knudson RJ, Lebowitz MD, Hobberg CJ, et al. Changes in the maximal expiratory flow volume curve with growth and aging. Am Rev Resp Dis. 1983;127:725.
13. Gracey DR, Divertie MB, Didier EP. Preoperative pulmonary preparation of patients with chronic obstructive pulmonary disease. Chest. 1979;76:123.
14. Rodgers A, Walker N, Shug S, et al. Reduction of postoperative morbidity and mortality with spinal or epidural anaesthesia: results from overview of randomized trials. BMJ. 2000;321:1493.
15. Warner MA, Offord KT, Warner ME, et al. Role of preoperative cessation of smoking and other factors in postoperative pulmonary complications: a blinded prospective study of coronary artery bypass patients. Mayo Clin Thor. 1989;64:609.
16. Nagasawa M, Tanaki H, Tsukurna H, et al. Relationship between the duration of preoperative smoke-free period and the incidence of postoperative pulmonary complications after pulmonary surgery. Chest. 2006;120:705.
17. Ramsay SJ. Postoperative pulmonary complications. Ann Intern Med. 2002;137:550.
18. Lawrence VA, Connell JE, Smetana GW. Strategies to reduce postoperative pulmonary complications after noncardiothoracic surgery: systematic review for the American College of Physicians. Ann Intern Med. 2006;144:596.
19. Bapoje SR, Whitaker JF, Schulz T, et al. Preoperative evaluation of the patient with pulmonary disease. Chest. 2007;132:1637.
20. Cohn SL, Smetana GW. Update in perioperative medicine. Ann Intern Med. 2007;147:263.
21. Arozullah AM, Daley J, Henderson WG, et al. Multifactorial risk index for predicting postoperative respiratory failure in men after major noncardiac surgery. Ann Surg. 2000;232:243.
22. Arozullah AM, Khuri SF, Henderson WG, et al. Development and validation of a multifactorial risk index for predicting postoperative pneumonia after major noncardiac surgery. Ann Intern Med. 2001;135:847.
23. Qaseem A, Snow V, Fitterman N, et al. Risk assessment for strategies to reduce perioperative pulmonary complications for patients undergoing noncardiothoracic surgery: a guideline from the American College of Physicians. Ann Intern Med. 2006;144:575.
24. Lawrence VA. Predicting post-operative pulmonary complications: the sleeping giant stirs. Ann Intern Med. 2007;135:919.
25. Khuri SF, Daley J, Henderson W, et al. The National Veterans Administration Surgical Risk Study: risk adjustment for the comparative assessment of the quality of surgical care. J Am Coll Surg. 1995;180:519.
26. Smetana GW. Preoperative pulmonary evaluation. N Engl J Med. 1999;340:937.
27. Carlena E, Hanson HE, Nordenstrom B. Temporary unilateral balloon occlusion of the pulmonary artery. J Thorac Surg. 1961;22:527.
28. Celli BR. What is the value of preoperative pulmonary function testing? Med Clin North Am. 1993;77:309.
29. Crapo RO. Pulmonary function testing. N Engl J Med. 1994;331:25.
30. Gardner RM. ATS Statement. Snowbird workshop standardization of spirometry. Am Rev Resp Dis. 1979;119:831.
31. Ford GT, Whitelaw WA, Rosenal TW, et al. Diaphragm function after upper abdominal surgery in humans. Am Rev Resp Dis. 1983;127:431
32. Simmoneau G, Viven A, Sartene R, et al. Diaphragm dysfunction induced by upper abdominal surgery: role of postoperative pain. Am Rev Resp Dis. 1983;128:899.
33. Jubran W, Toban M. Passive mechanics of lung and chest wall in patients who failed or succeeded in trials of weaning. Am J Respir Crit Care Med. 1997;155:916–921.
34. Hubmayr RD, Rehder K. Respiratory muscle failure in critically ill patients. Semin Respir Med. 1992;13:14–21.
35. Tobin MJ, Laghi F, Jubran W. A respiratory muscle dysfunction in mechanically ventilated patients. Mol Cell Biochem. 1998;179:87–98.
36. Stroetz RW, Hubmayr RD. Tidal volume maintenance during weaning with pressure support. Am J Respir Crit Care Med. 1995;152:1034–1040.
37. Capdevila X, Perrigault PF, Ramonatxo M, et al. Changes in breathing pattern and respiratory muscle performance parameters during difficult weaning. Crit Care Med. 1998;26:79–87.